Densification of the Ground-Based GNSS Observation Network in the Southwest Indian Ocean: Current Status, Perspectives, and Examples of Applications in Meteorology and Geodesy
 Olivier Bousquet1*
  Edouard Lees1 Jonathan Durand1
  Aline Peltier2,3 Anne Duret4 Dominique Mekies1
  Patrice Boissier2,3 Thomas Donal4 Frauke Fleischer-Dogley5 Lova Zakariasy6
- 1Laboratoire de l’Atmosphère et des Cyclones, UMR 8105 (Reunion University/Meteo-France/CNRS), Réunion Island, France
- 2Institut de Physique du Globe de Paris, Université de Paris, Paris, France
- 3Observatoire Volcanologique du Piton de la Fournaise, La Plaine des Cafres, France
- 4Institut National de l’Information Géographique et Forestière, Saint-Mandé, France
- 5Seychelles Islands Foundation, Mahé, Seychelles
- 6Institut Supérieur de Technologie d’Antisiranana, Antsiranana, Madagascar
In the frame of the research project IOGA4MET, a new ground-based GNSS network is being deployed in the Southwest Indian Ocean (SWIO) since November 2017. This new network opens up for new research opportunities in geodesics and atmospheric sciences in this area regularly exposed to natural hazards, and significantly expands the International GNSS System (IGS) network, which only includes eight stations so far in the SWIO. After a description of the current status of IOGA4MET, several examples of regional applications in meteorology (climatology and numerical modeling) and geodesy (monitoring of ground deformations) are presented using data collected in northern Madagascar and small neighboring islands in 2018–2020. The observed water vapor cycle is shown to exhibit different characteristics and important variability at all locations. At the seasonal scale, maximum IWV values are similar everywhere, minimum values decrease away from the equator and a sharp IWV gradient can be noticed during the wet–dry transition period. At this time scale, the seasonal IWV cycle analyzed with the high-resolution NWP system AROME-IO matches observations with little discrepancies. At the diurnal scale, IWV characteristics show different behavior on each side of Madagascar, which emphasizes the important role of this island in driving the regional circulation. Finally, examination of ground displacements measured by GNSS stations in relationship with the ongoing Mayotte seismic-volcanic crisis indicates that ground deformation associated with the current off-shore volcanic activity east of Mayotte does not extend up to 250 km, or is currently too low to be detected in very far field.
Introduction
It is relatively common for a measurement system to end up being used for different purposes than those it was originally intended for. Global Navigation Satellite System (GNSS) is for instance one of the technologies whose current applications have extended far beyond its original expected use. Initially designed in the late 70s to support military and civilian positioning and timing, GNSS technology has indeed quickly established itself as an essential tool in seafloor (Bürgmann and Chadwell, 2014), volcano (Fernández et al., 2017) and tectonic (e.g., Segall and Davis, 1997) geodesy, thanks to its ability to measure land and ocean movements with millimeter accuracy. Another important application of GNSS measurements emerged in the early 1990s, when it was found that ground-based GNSS stations could also be used to accurately measure atmospheric water vapor content (Bevis et al., 1992). Since then GNSS has become a key tool in atmospheric and climate sciences (Guerova et al., 2016), and is now commonly used in numerical weather prediction [(NWP), e.g., Bock et al., 2005, 2007a; Mahfouf et al., 2015; Arriola et al., 2016], weather nowcasting (e.g., Van Baelen et al., 2011; Brenot et al., 2013) and climatological (e.g., Parracho et al., 2018; Lees et al., 2020) applications.
Most public GNSS observations currently available to the research community belong to the International GNSS System (IGS) network, which comprises ∼400 permanent stations implemented by a voluntary federation of 200 institutions worldwide. Although this network has been growing steadily for almost 20 years, its density is however very heterogeneous and many regions are still poorly instrumented1. With only 8 public GNSS stations (Figure 1), the Southwest Indian Ocean (SWIO) [0-40S, 30-90E] is for instance one of the least instrumented areas of the planet. The low number of sensors deployed in this area can be explained by the difficulties in deploying such instruments under good operating conditions, but also because most countries of the SWIO cannot operate these observing systems on a sustainable basis. The SWIO nevertheless presents unique characteristics that make of this region a particularly interesting and exciting area of investigation in Earth sciences.
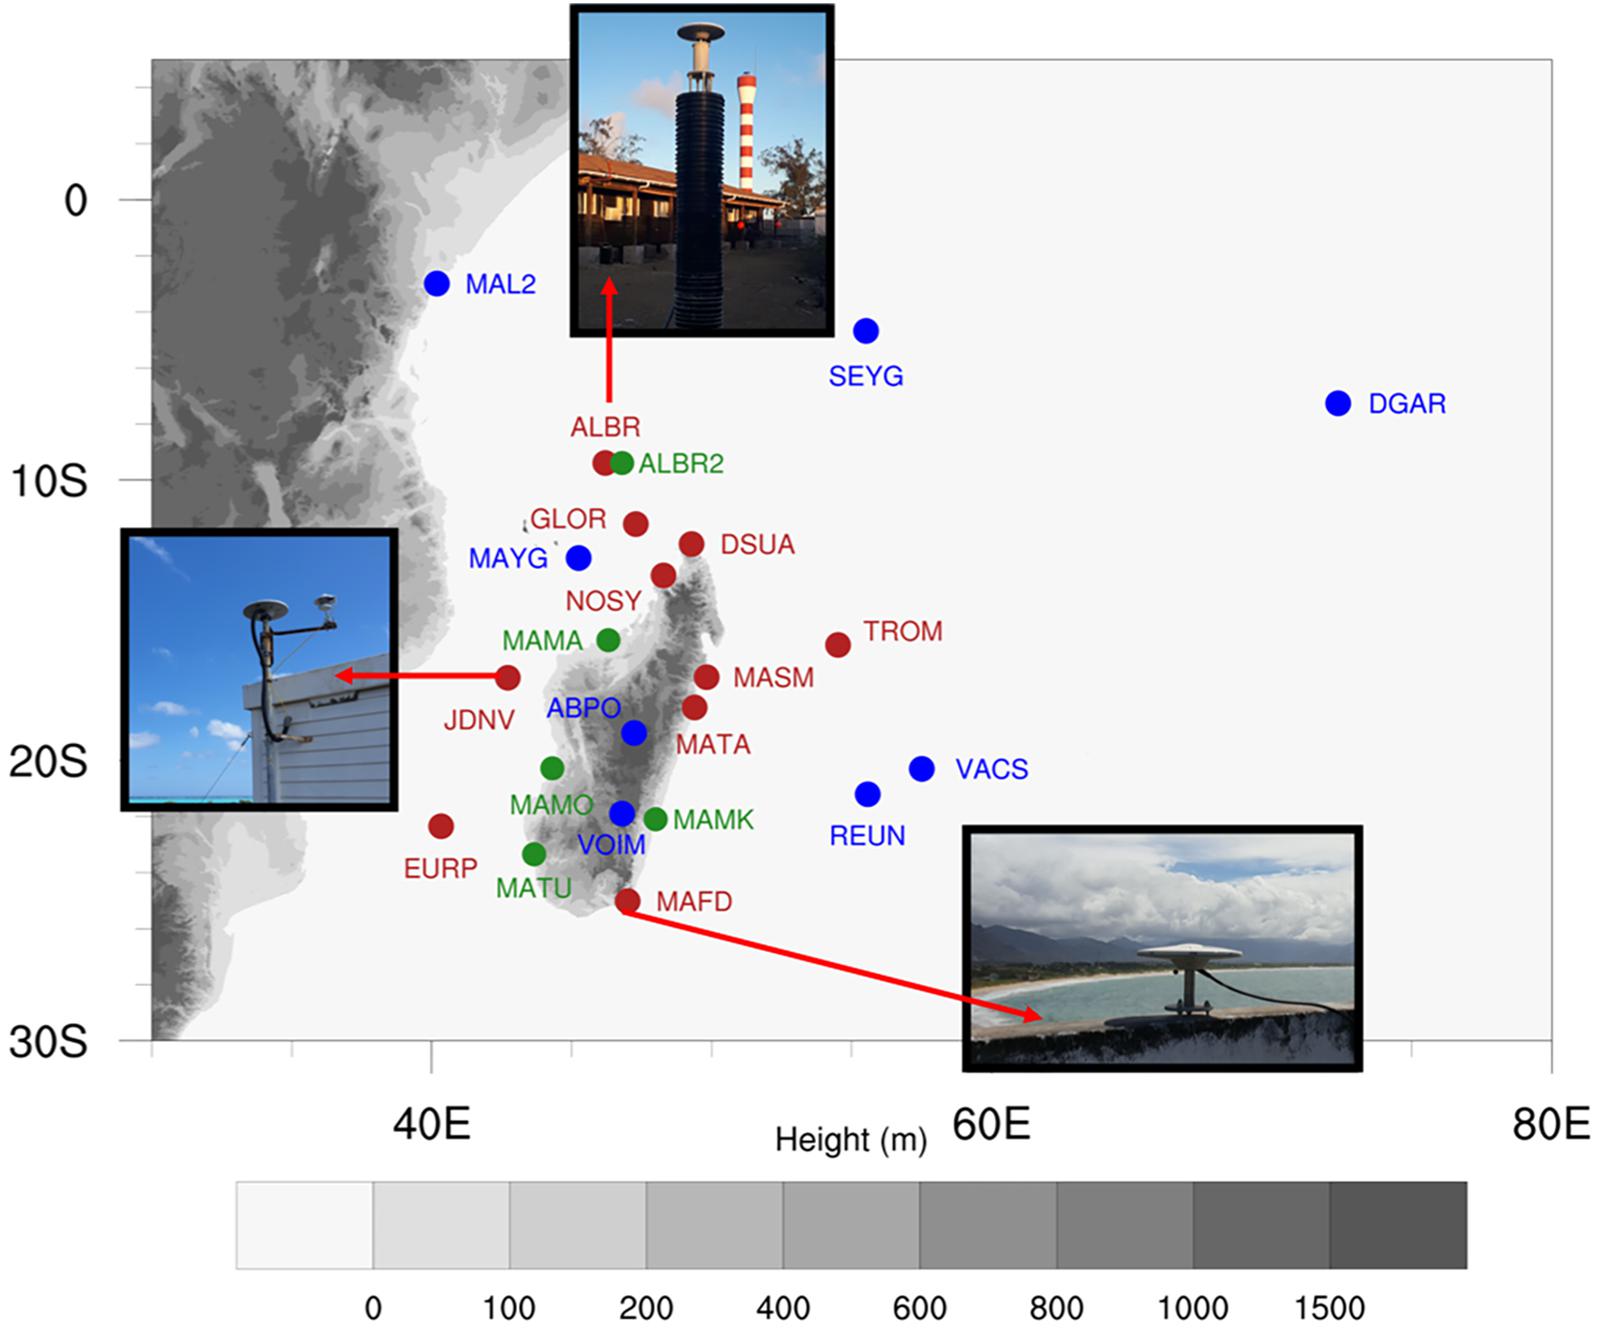
Figure 1. Location of public GNSS stations available in the SWIO superimposed on terrain height (gray shaded). Blue dots indicate IGS stations while red (resp. green) dots show current (resp. future) IOGA4MET stations, respectively. The inserts show pictures of GNSS stations deployed at Aldabra (11/2017), Fort-Dauphin (07/2018) and Juan de Nova (04/2019).
With nearly 11 tropical low-pressure systems per year, the SWIO is one of the three most active cyclonic basins on the planet (Leroux et al., 2018). Tropical cyclones (TCs) that develop in this region can be very destructive and often result in considerable human and material losses, as shown by the recent TC Idaï, which caused more than 1000 deaths and several billion dollars’ worth of damage in Mozambique in 2019. Sea level monitoring in this area, home of many small inhabited islands, is also a key issue in the context of climate change, but the Global Sea Level Observing System (GLOSS) network, which uses tide gauges collocated with GNSS stations, includes very few measurements in this basin2. From a geodesic standpoint, understanding the origin and behavior of crustal features of the offshore branch of the East African Rift System (aka Davie Ridge), which spawns over 1200 km from the coast of Kenya to Madagascar, is also a critical issue for geophysicists (Courgeon et al., 2018). The need to study the dynamics of the Earth’s crust in this area has been further highlighted recently following the beginning of an intense, and totally unexpected, seismic-volcanic crisis near Mayotte Island (Cesca et al., 2020).
In order to address the overall lack of GNSS observations in the SWIO, “Laboratoire de l’Atmosphère et des Cyclones” (LACy) and its partners have started to deploy a new ground-based GNSS network under the frame of research project “Indian Ocean GNSS Application for Meteorology” (IOGA4MET). This short paper aims to present the characteristics of this new network together with potential research applications in atmospheric and earth sciences. After a description IOGA4MET current status, examples of applications in meteorology (analysis and modeling of the water vapor cycle in northern Madagascar) and geodesy (ground displacements in the context of the Mayotte seismic-volcanic crisis) are presented using tropospheric and positioning observations collected in 2018–2020.
Data and Methods
This study is based upon the analysis of GNSS-derived IWV data from both IGS and IOGA4MET ground-based GNSS observation networks as well as numerical model data.
GNSS Data
IOGA4MET principally aims to increase the number of tropospheric GNSS measurements (e.g., zenithal delay and integrated water vapor amounts) in the SWIO through the deployment of at least 15 new ground-based GNSS stations in Madagascar and surrounding islands. As of May 2020, 10 permanent GNSS stations have already been deployed in the area, with five more to be installed in early 2021 (Figure 1). Each station consists in a GNSS receiver (Trimble NetR9) and a GNSS antenna (Trimble Zephyr 3), collocated with a surface weather station used to gather atmospheric parameters needed to calculate tropospheric data (the reader is referred to Bevis et al., 1992 for details about the calculation of GNSS tropospheric parameters). Currently this network includes five stations in Madagascar (Diego-Suarez, Sainte-Marie, Tamatave, Fort-Dauphin and Nosy Be), one in Seychelles’ outer islands (Aldabra), and four in the Eparses Islands of Europa, Juan de Nova, Tromelin and Grande Glorieuse (Figure 1). The precise location and installation date of all GNSS stations can be found in the Supplementary Material section.
All IOGA4MET GNSS stations include the American GPS and Russian GLONASS satellite constellations, with half of them also including the European one, GALILEO [the reader is referred to Li et al. (2015) for the description of major GNSS satellite constellations]. Raw GNSS data consist of observation files with 30-s sampling produced at both hourly and daily time steps. In all Eparses islands but Grande Glorieuse, data are currently collected and transmitted on a regular basis by the staff of the Terres Australes et Antartiques Françaises (TAAF) administration. All other stations transmit their data in real time via cellular (MATA, NOSY, MAFD), satellite (ALBR, GLOR) or cabled (all others) Internet networks.
Observations are sent to the French “Institut National de l’Information Géographique et Forestière” (IGN) data center and integrated into IGN’s permanent GNSS network (RGP), allowing for data reception and formatting, routine GNSS calculations and wide dissemination of products such as times series of geographic coordinate and zenithal tropospheric delays. GNSS data files are processed upon reception with the Bernese GNSS software, which is a scientific, high-precision, multi-GNSS data processing tool developed at the Astronomical Institute of the University of Bern (Dach et al., 2015), with hourly, daily, and weekly updates. Tropospheric GNSS data are also deposited on global meteorological databases, allowing for potential data assimilation in main NWP systems.
Model Data
In addition to GNSS-derived IWV observations, this study also makes use of the following numerical model data:
- 6-hourly IWV analysis data extracted from the NWP system AROME-Indian Ocean (AROME-IO), which is the high-resolution (2.5 km) operational model used by the French weather service (Meteo-France) to provide both global forecasting products and TC forecasts to the 15 members of the SWIO Tropical Cyclone Committee (Bousquet et al., 2020). In its operational configuration, AROME-IO is initialized from European Center for Medium-Range Weather Forecast (ECMWF)’s Integrated Forecasting System (IFS), which also provides lateral boundary conditions. It runs four times per day at 00, 06, 12, and 18 UTC for periods of 42 h. While AROME-IO does not allow for direct data assimilation yet, an”analysis incremental update” (IAU) scheme is relied upon to generate small-scale features in model analyses (Bousquet et al., 2020). Note that the assimilation of GNSS data is nevertheless taken into account indirectly through IFS, which assimilates GNSS-derived zenithal delay observations collected at IGS stations (see blue dots in Figure 1 for locations).
- Hourly IWV reanalysis data extracted from the new, high-resolution, ECMWF 5th generation reanalysis (ERA5), which replaced the previous ERA-Interim reanalysis on 31 August 2019. ERA5 provides hourly estimates of a large number of atmospheric, land and oceanic climate variables over the Earth on a 0.25 × 0.25-degree horizontal grid (31 km) using 137 levels from the surface up to 80 km (Hersbach et al., 2020).
Results
Examples of Meteorological Applications
GNSS tropospheric data such as atmospheric integrated water vapor (IWV) contents have become one of the most reliable datasets for monitoring global warming and assessing medium-to-long-term trends in space-time distribution of atmospheric moisture around the world (e.g., Wang and Zhang, 2009; Chen and Liu, 2016; Parracho et al., 2018). Due to the limited number of observations available in the SWIO, very little is however known yet about the distribution of water vapor in this area. IOGA4MET therefore represents a great opportunity to investigate further the properties of the water cycle in this part of the world as well as its representation in NWP systems.
The mountainous island of Madagascar separates the SWIO basin into two parts: the Mozambique Channel to the west, and the open ocean to the East. With a surface area of 594 301 km2, this island is the largest land mass in the SWIO basin and is characterized by a high proportion of high-elevation terrain (Figure 1). Although very few studies on Madagascar climate can be found in the literature, the complex orography of this island is known to have a strong influence on the weather and climate of the SWIO (Nassor and Jury, 1998; Landman et al., 2005; Macron et al., 2016). Madagascar also represents a large surface heating source compared with the surrounding water body, leading to large diurnal circulations that can potentially influence the water cycle of inhabited nearby islands at diurnal time scales. In the following we use time series of tropospheric GNSS observations and model analyses to investigate the characteristics of the tropospheric water vapor seasonal and diurnal cycles in the northern part of this country and three surrounding islands.
Time series of hourly IWV amounts derived from the analysis of GNSS observations collected in 2019 at Aldabra (ALBR), Grande Glorieuse (GLOR), Diego-Suarez (DSUA) and Sainte-Marie (MASM) are shown in Figure 2, together with the associated 30-day moving average (+/− 15 days, black line). IWV contents were obtained from the approach of Lees et al. (2020) using zenithal delay observations computed with the Bernese software. On average (black line) tropospheric GNSS observations show a drier period during the cold season (May–October), with minimum values observed near the end of the Austral winter (JJA). A short transition time between the wet and dry seasons is observed in May at all locations, which corresponds to the rapid northward propagation of the Inter Tropical Convergence Zone (ITCZ) over the area, and characterizes the transition from East to West African monsoon (Bock et al., 2007b). The transition between the dry and wet seasons, which begins in October/November, is more gradual with monthly maximum humidity values being observed in January. During the Austral summer (DJF) and winter (JJA), the tropospheric humidity content remains more or less uniform and averages between 53 and 56 kg.m–2 (resp. 30–35 kg.m–2) during the warm (resp. cold) season, depending on the location. While observed hourly (70 kg.m–2) and monthly (53–55 kg.m–2) maximum IWV values are similar everywhere, minimum values however increase with distance away from the equator. The average amplitude of the seasonal cycle is thus less marked at ALBR (Figure 2A, +/− 17 kg.m–2, 9°S), than at GLOR (Figure 2B, +/− 22 kg.m–2, 11°S), DSUA (Figure 2C, +/− 25 kg.m–2, 12°S) and MASM (Figure 2D, +/− 28 kg.m–2, 25°S). Highest absolute (hourly) minimum IWV values are also observed in Aldabra with ∼20 kg.m–2, against ∼15 kg.m–2 elsewhere.
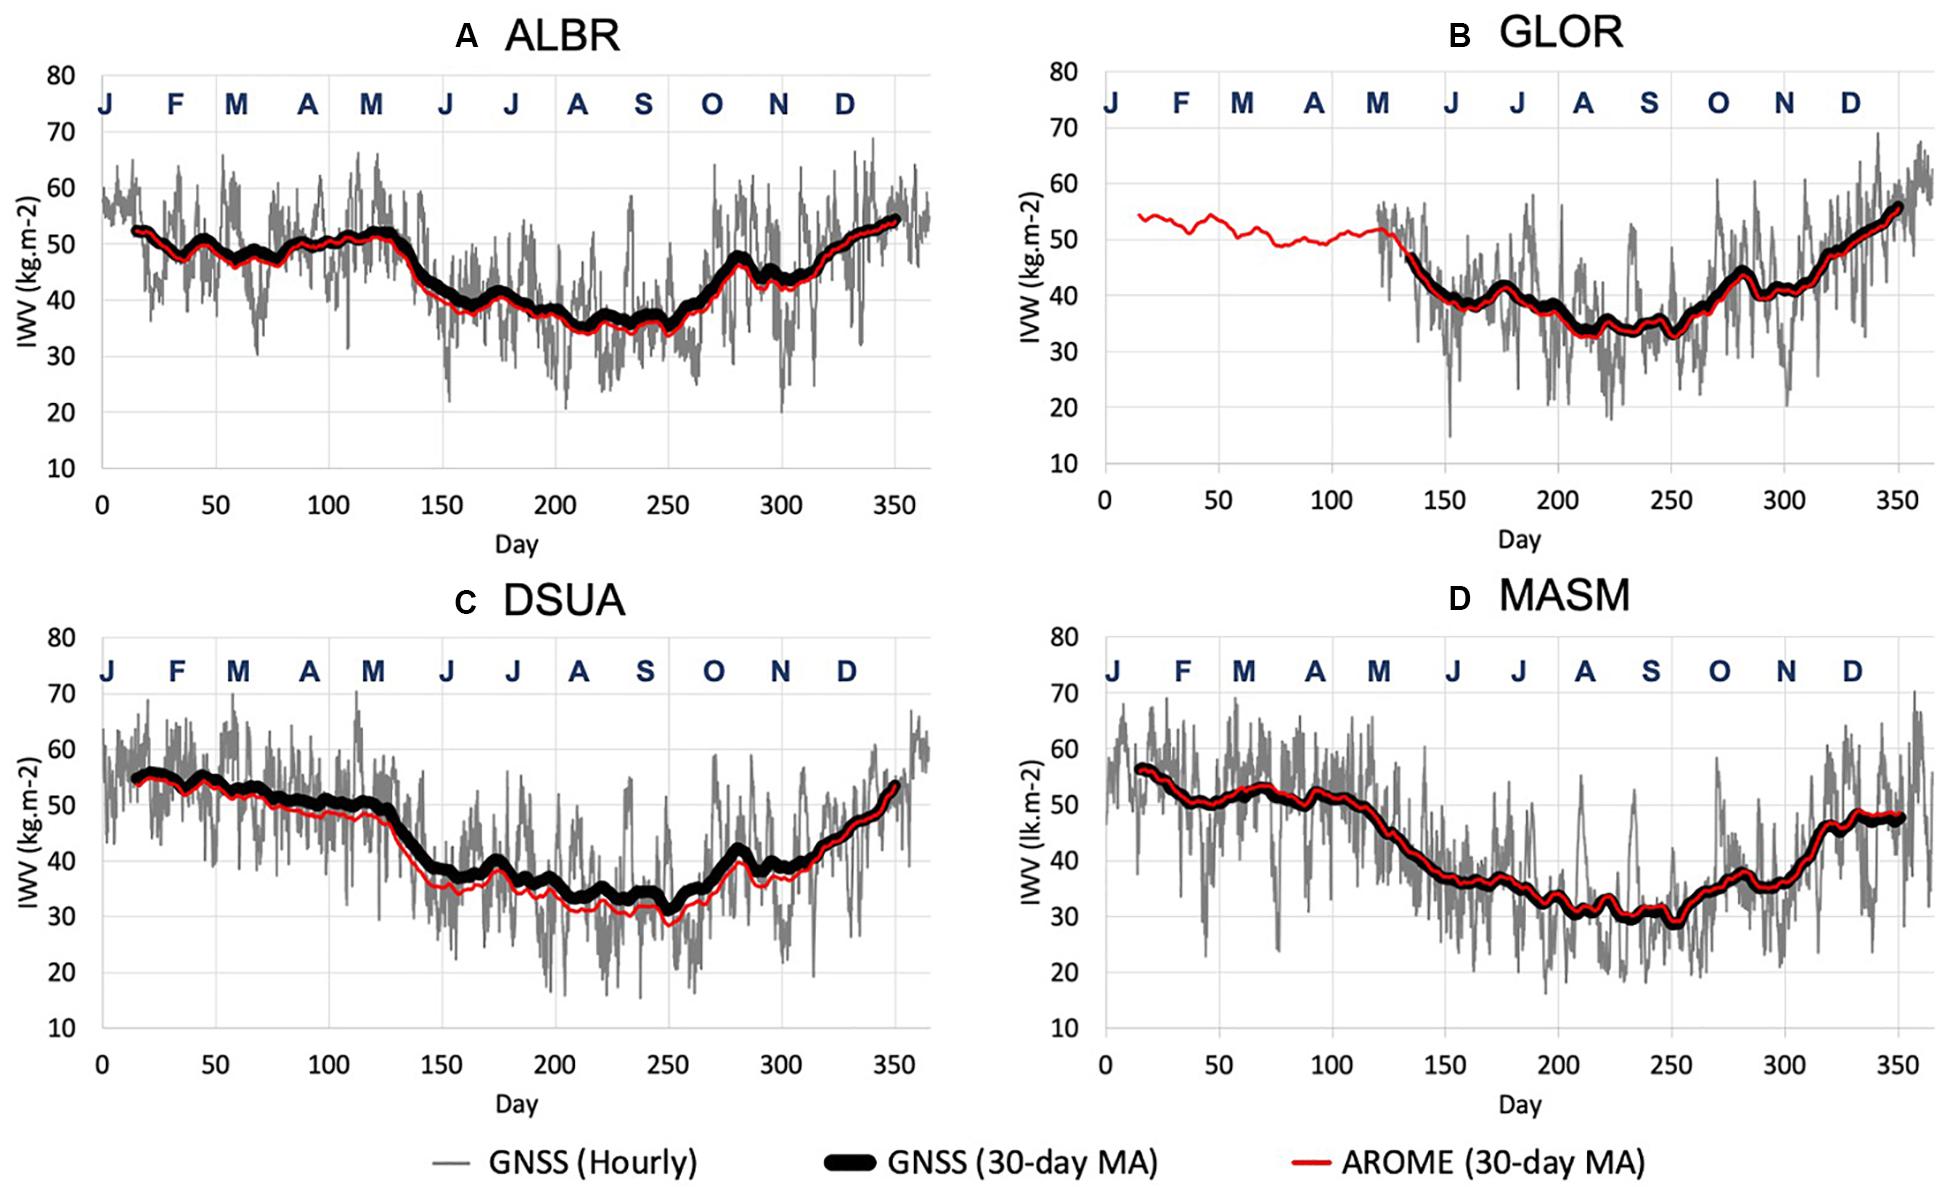
Figure 2. Times series of hourly integrated water vapor content (kg.m– 2) as deduced from GNSS data collected at (A) Aldabra (ALBR), (B) Grande Glorieuse (GLOR), (C) Diego-Suarez (DSUA) and (D) Sainte-Marie (MASM) between 1 January and 31 December, 2019 (see Figure 1 for location). Black (resp. red) lines show the 30-day moving average (+/– 15 days) of GNSS (resp. AROME-IO) IWV times series. Note that continuous times series of tropospheric GNSS data at GLOR are only available since May 2019.
GNSS-derived IWV data can also be used as an independent source to evaluate and monitor the water vapor distribution in model reanalyses (e.g., Bock et al., 2005; Bock and Parracho, 2019; Lees et al., 2020) as well as NWP and climate model forecasts (Guerova et al., 2016). In the following, GNSS-derived IWV observations collected from January 1–December 31, 2019 are compared against IWV contents analyzed daily at 00, 06, 12, and 18 UTC with the AROME-IO NWP system over the same period of time. The evolution of IWV contents analyzed four times daily by this model at Aldabra, Grande Glorieuse, Diego-Suarez and Sainte-Marie are shown by the red lines in Figure 2. In order to smooth out short-term fluctuations (e.g., tropical cyclones) and highlight the effect of seasonality on potential biases or systematic errors, a 30-day moving average was applied to both model and GNSS (black line) data. At these time scales, one can note the excellent agreement between analyzed and observed IWV values, especially at Sainte-Marie (Figure 2D) where the model reproduces both the observed trend and intensity of IWV with imperceptible discrepancies. A similar behavior is also observed at Aldabra (Figure 2A) and Grande Glorieuse (Figure 2C) although one can note a slight underestimation of the tropospheric moisture content of ∼1 kg.m–2 (∼2%) during the cold season. The most notable differences are observed in Diego-Suarez, where model IWV values are systematically underestimated by 1 to 4 kg.m–2 (up to 12%), especially during the cold months of June to October. Although DSUA is located along the coast, local circulations are nevertheless strongly influenced by the presence of the highland’s region located a few 10s of km southward of Diego-Suarez (Figure 1). We thus suspect these errors to be related to an insufficient resolution of the model topography, which would prevent the model from properly capturing the modifications of air masses caused by the orography (lifting and subsiding motions) at the local scale. Conversely, the islands of Grande Glorieuse, Sainte-Marie and Aldabra are flat and are not, or only slightly, influenced by Madagascar’s orography.
Using both ECMWF’s 5th generation reanalysis (ERA5) and IGS data, Lees et al. (2020) recently analyzed the properties of the diurnal cycle in various islands (Central Madagascar, Mayotte, La Reunion, Chagos, Mauritius) of the SWIO. An interesting result of this study lied in the highlighting of Madagascar’s complex role in driving local water processes in the neighboring island of Mayotte.
In order to further illustrate the evolution of the diurnal water vapor cycle in this area, Figure 3 shows diurnal IWV anomalies in northern Madagascar and surrounding areas, as inferred from ERA5 hourly IWV data throughout year 2019. According to reanalysis data, the northern part of Madagascar is entirely characterized by negative moisture anomalies from 6 LST (Figure 3B) to 9 LST (Figure 3C), while surrounding areas show neutral to positive anomalies. Near 12 LST (Figure 3D) positive anomalies appear along the east coast of the big island, before increasing and gradually spreading westward during the rest of the day (Figures 3E–H). Finally, between 18 LST (Figure 3F) and 21 LST (Figure 3G), positive anomalies have extended throughout the island and surrounding areas, except in the northern part of the Mozambique Channel where negative anomalies can still be noticed S-SW of Grande Glorieuse.
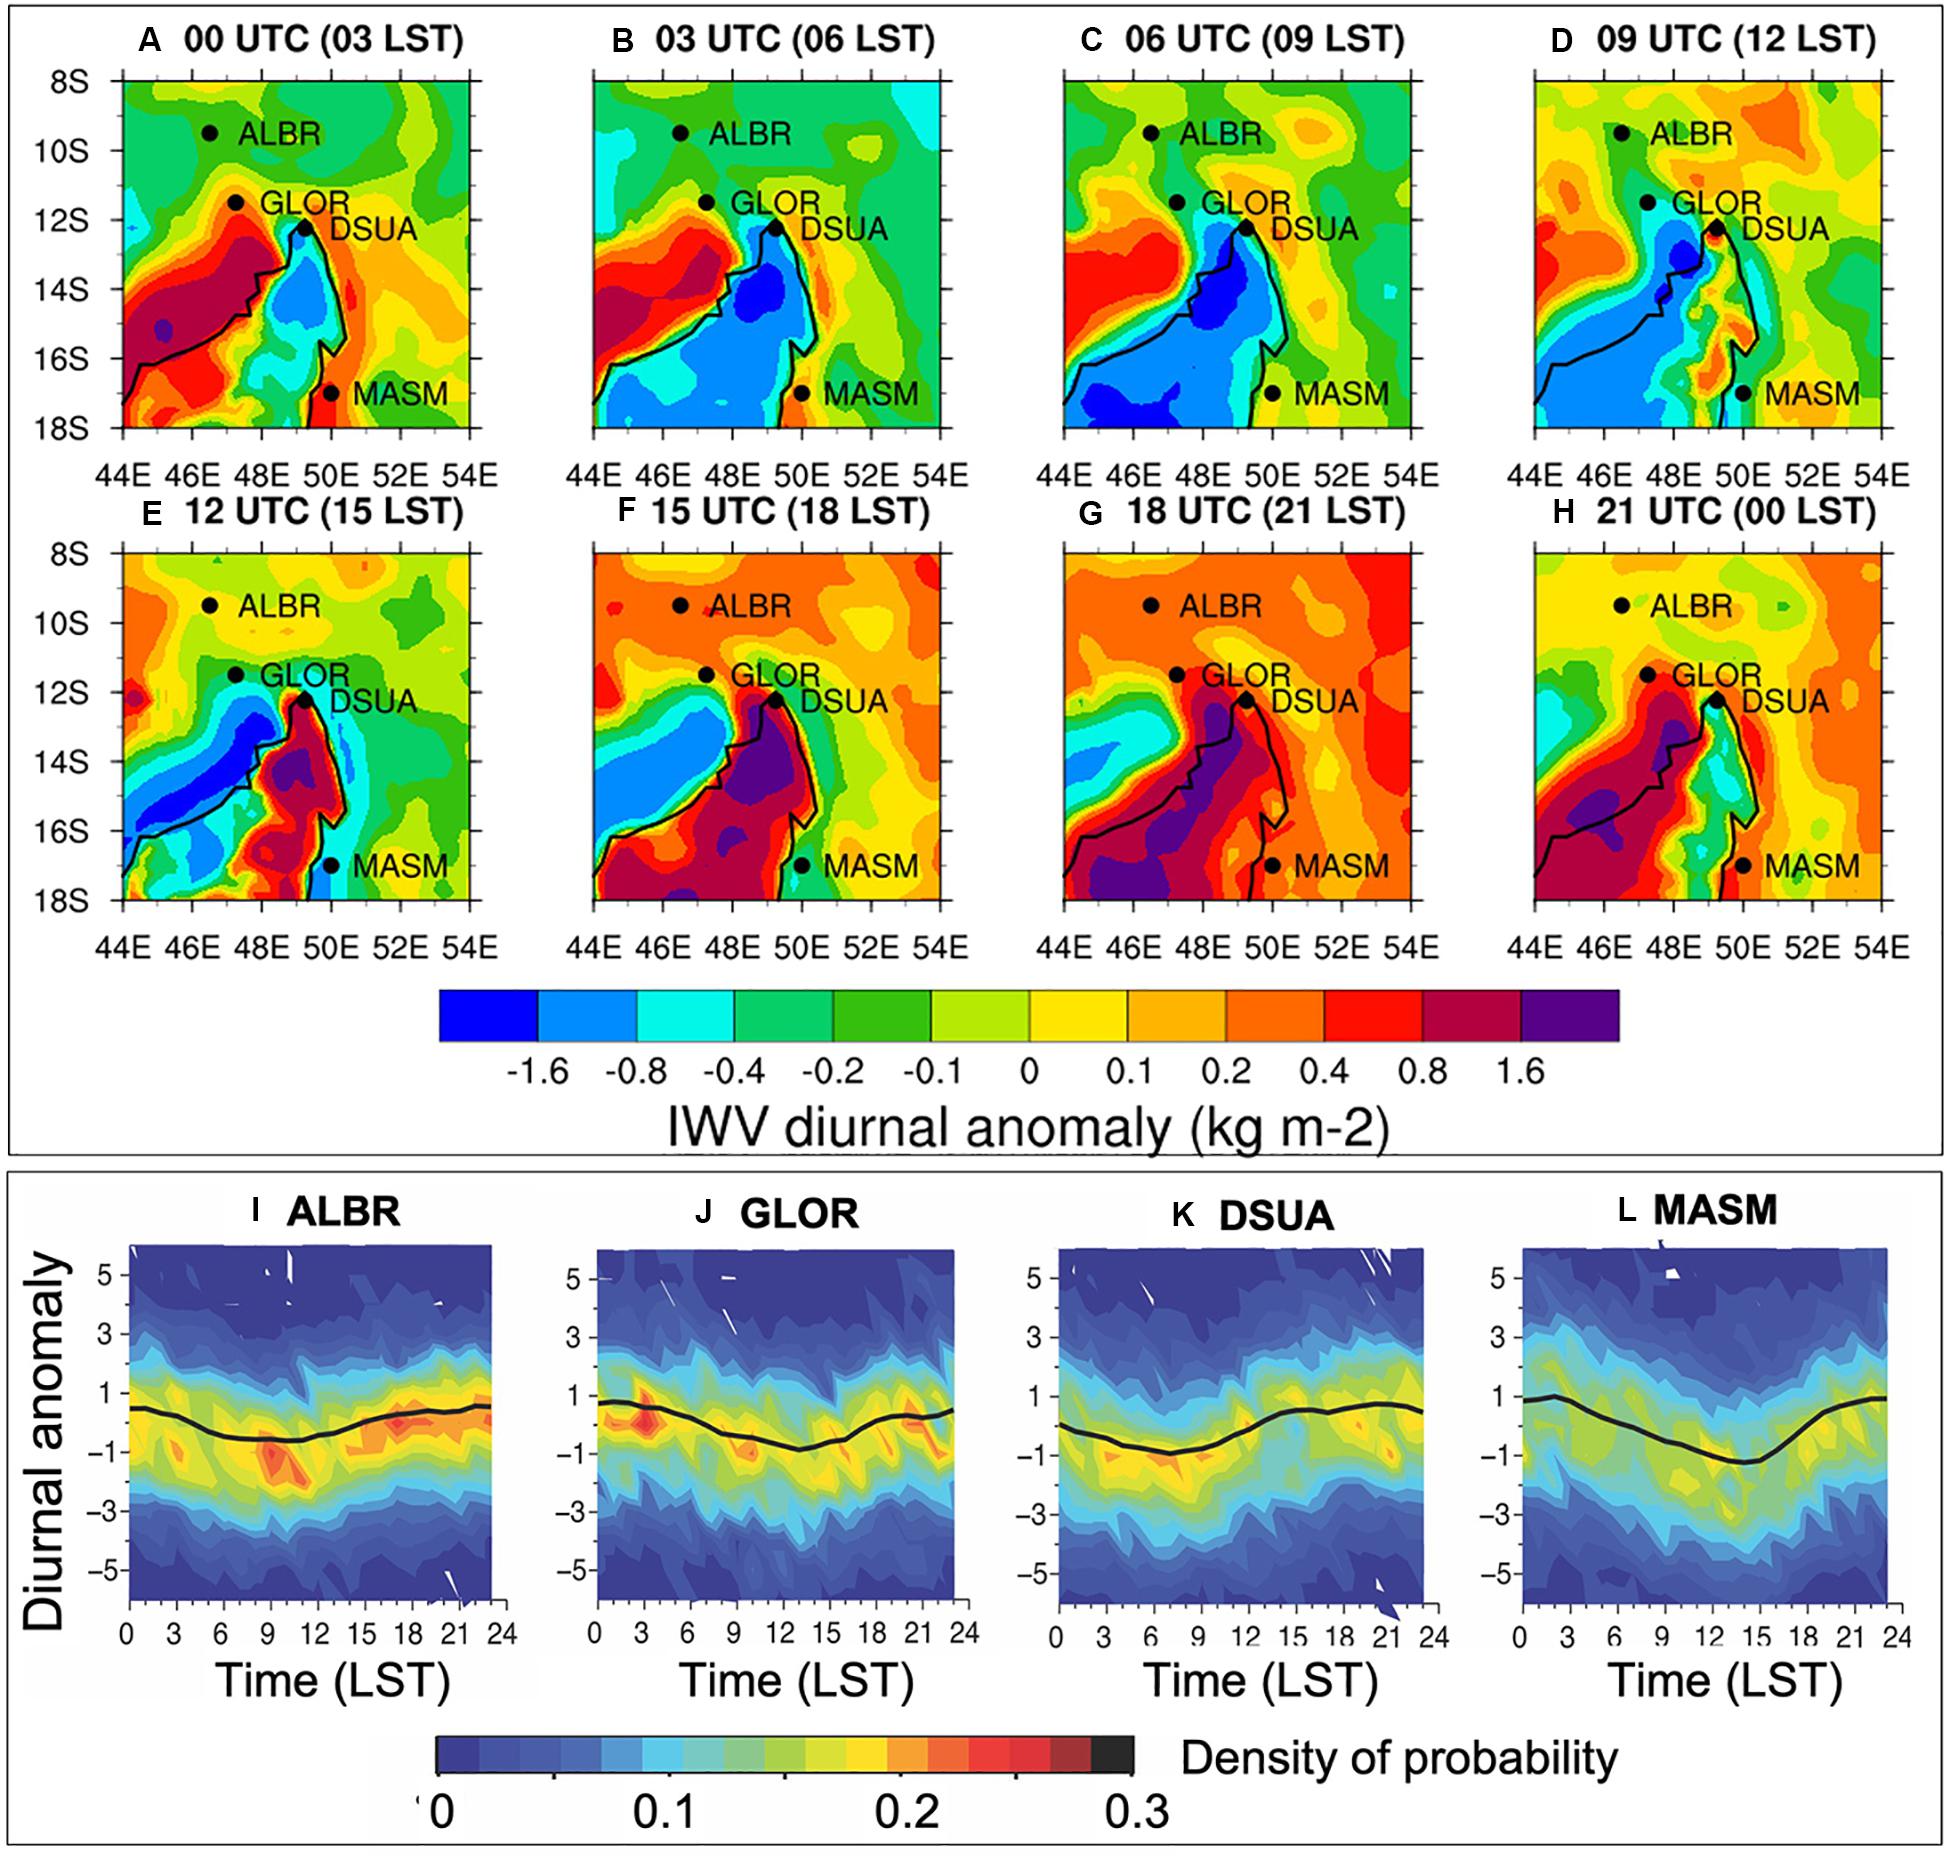
Figure 3. Top and middle panels show IWV diurnal cycle anomaly (kg.m– 2) computed from ERA5 data between 44–54°E and 8–18°S, by steps of 3 h. Bottom panel shows the density of probability (shaded) and average diurnal anomaly (black line) of IWV (kg.m– 2) derived from GNSS data collected in 2019 at (I) ALBR, (J) GLOR, (K) DSUA and (L) MASM. Black dots in (A–H) show the locations of GNSS stations used in (I–L).
This overall pattern likely results from (i) the combination of land-breeze / sea-breeze circulations that form at day and night times, and (ii) northwestward advection of moisture anomalies resulting from the presence of the South Indian Ocean anticyclone (located SE of Madagascar), which favors moisture transport and convergence over the central and northern mountains of this island throughout the year (Macron et al., 2016). During the afternoon and early evening (Figures 3D–G), positive (resp. negative) anomalies are generated over land (resp. ocean) by ascending (resp. subsiding) motions associated with land-breeze circulations. This phenomenon reverses during the night and in the early morning with the onset of the sea breeze (Figures 3A–C,H). This results in the formation of a dipole-like pattern between the northern/northwestern parts of Madagascar and the adjacent part of the northern Mozambique Channel whose phase shifts at 12 LST (Figure 3D) and 00 LST (Figure 3H), i.e., approximately when the breeze circulation shift from land to sea regime.
The observed diurnal IWV cycle at Aldabra, Grande Glorieuse, Diego-Suarez and Sainte Marie is shown in Figures 3I–L, which displays mean diurnal moisture anomalies inferred from the analysis of GNSS data at these locations. Overall each site shows distinct diurnal IWV patterns. At ALBR (Figure 3I), the diurnal cycle is typical of that of an oceanic environment with minimum (resp. maximum) IWV values occurring in late morning (resp. midnight). The diurnal cycle there is less marked than at other locations, reflecting the fact that this atoll is located outside the diurnal influence zone of Madagascar (Figures 3A–H). On the other hand, the diurnal cycle at GLOR (Figure 3J) appears strongly driven by moisture advection originating from Madagascar and shows minimum (resp. maximum) IWV values at 15 LST (resp. midnight). At DSUA (Figure 3K) and MASM (Figure 3L), the IWV diurnal cycle is more or less in phase opposition. At DSUA it is typical of that of a continental area with minimum (resp. maximum) moisture content observed in early morning (resp. mid-afternoon/evening). At MASM the diurnal moisture pattern resembles that of a land-breeze/sea-breeze behavior (with the rising branch of the breeze circulation located inland in the afternoon and offshore at night). Consequently, the minimum (resp. maximum) IWV values are observed in mid-afternoon (resp. night-time). These observed differences emphasize the important role of Madagascar in driving the regional circulation and water vapor distribution at the diurnal scale.
Example of Geophysical Application
Although IOGA4MET was initially intended to monitor the space-time variability of water vapor, collected data have also started to be widely used by geophysicists for ongoing research activities on ground deformations, especially in the frame of the current Mayotte seismic-volcanic crisis.
Indeed, in May 2018 an unusual seismic activity was recorded offshore Mayotte (Lemoine et al., 2020), and was quickly accompanied in July by ground deformation on this island. The first inverse modeling, using a single isotropic source, showed that these displacements were probably induced by the deflation of a deep magma reservoir (around 30–50 km depth) located 30–60 km east of Mayotte (Lemoine et al., 2020; OVPF/IPGP monthly bulletins 2019). From May, 2–18, 2019, an oceanographic campaign aboard the research vessel Marion Dufresne revealed that these features were actually associated with a major submarine eruption, located about 50–60 km east of the island.
Since the beginning of the crisis, important efforts have been made to monitor this event, including the deployment of temporary and permanent remote GNSS and seismic stations in and around Mayotte to constrain the eastwards extension of the ground deformation. In March 2019, a GNSS station was thus deployed 250 km east of Mayotte, at Grande Glorieuse (GLOR). This GNSS station, together with those previously installed in Mayotte (MAYG IGS station and privately-owned others not shown in this paper) and Diego-Suarez (DSUA, 440 km E/NE of Mayotte), can be used to monitor the ground deformations associated with this offshore volcanic activity.
Figure 4 presents time series of eastward, westward and vertical ground displacements derived from GNSS measurements recorded from June 12, 2018 to March 18, 2020 at these three locations. Positioning data were obtained daily at 23 UTC over 645 days at MAYG, 580 days at DSUA and 320 days at GLOR and were corrected from plate velocity – Note that positioning data used in this figure were processed independently by IPGP using the GIPSy-X software suite (Bertiger et al., 2020). GNSS observations collected in Mayotte (Figure 4A) show that this island has been subjected to strong and regular ground deformation over this period. Ground motion began to be recorded in July 2018, approximately 2 months after the beginning of the unusual seismic activity and increased progressively in a more or less linear way. Since then, the MAYG station recorded a cumulated subsidence of approximately 17 cm and drifted nearly 20 cm to the east and 2 cm to the south.
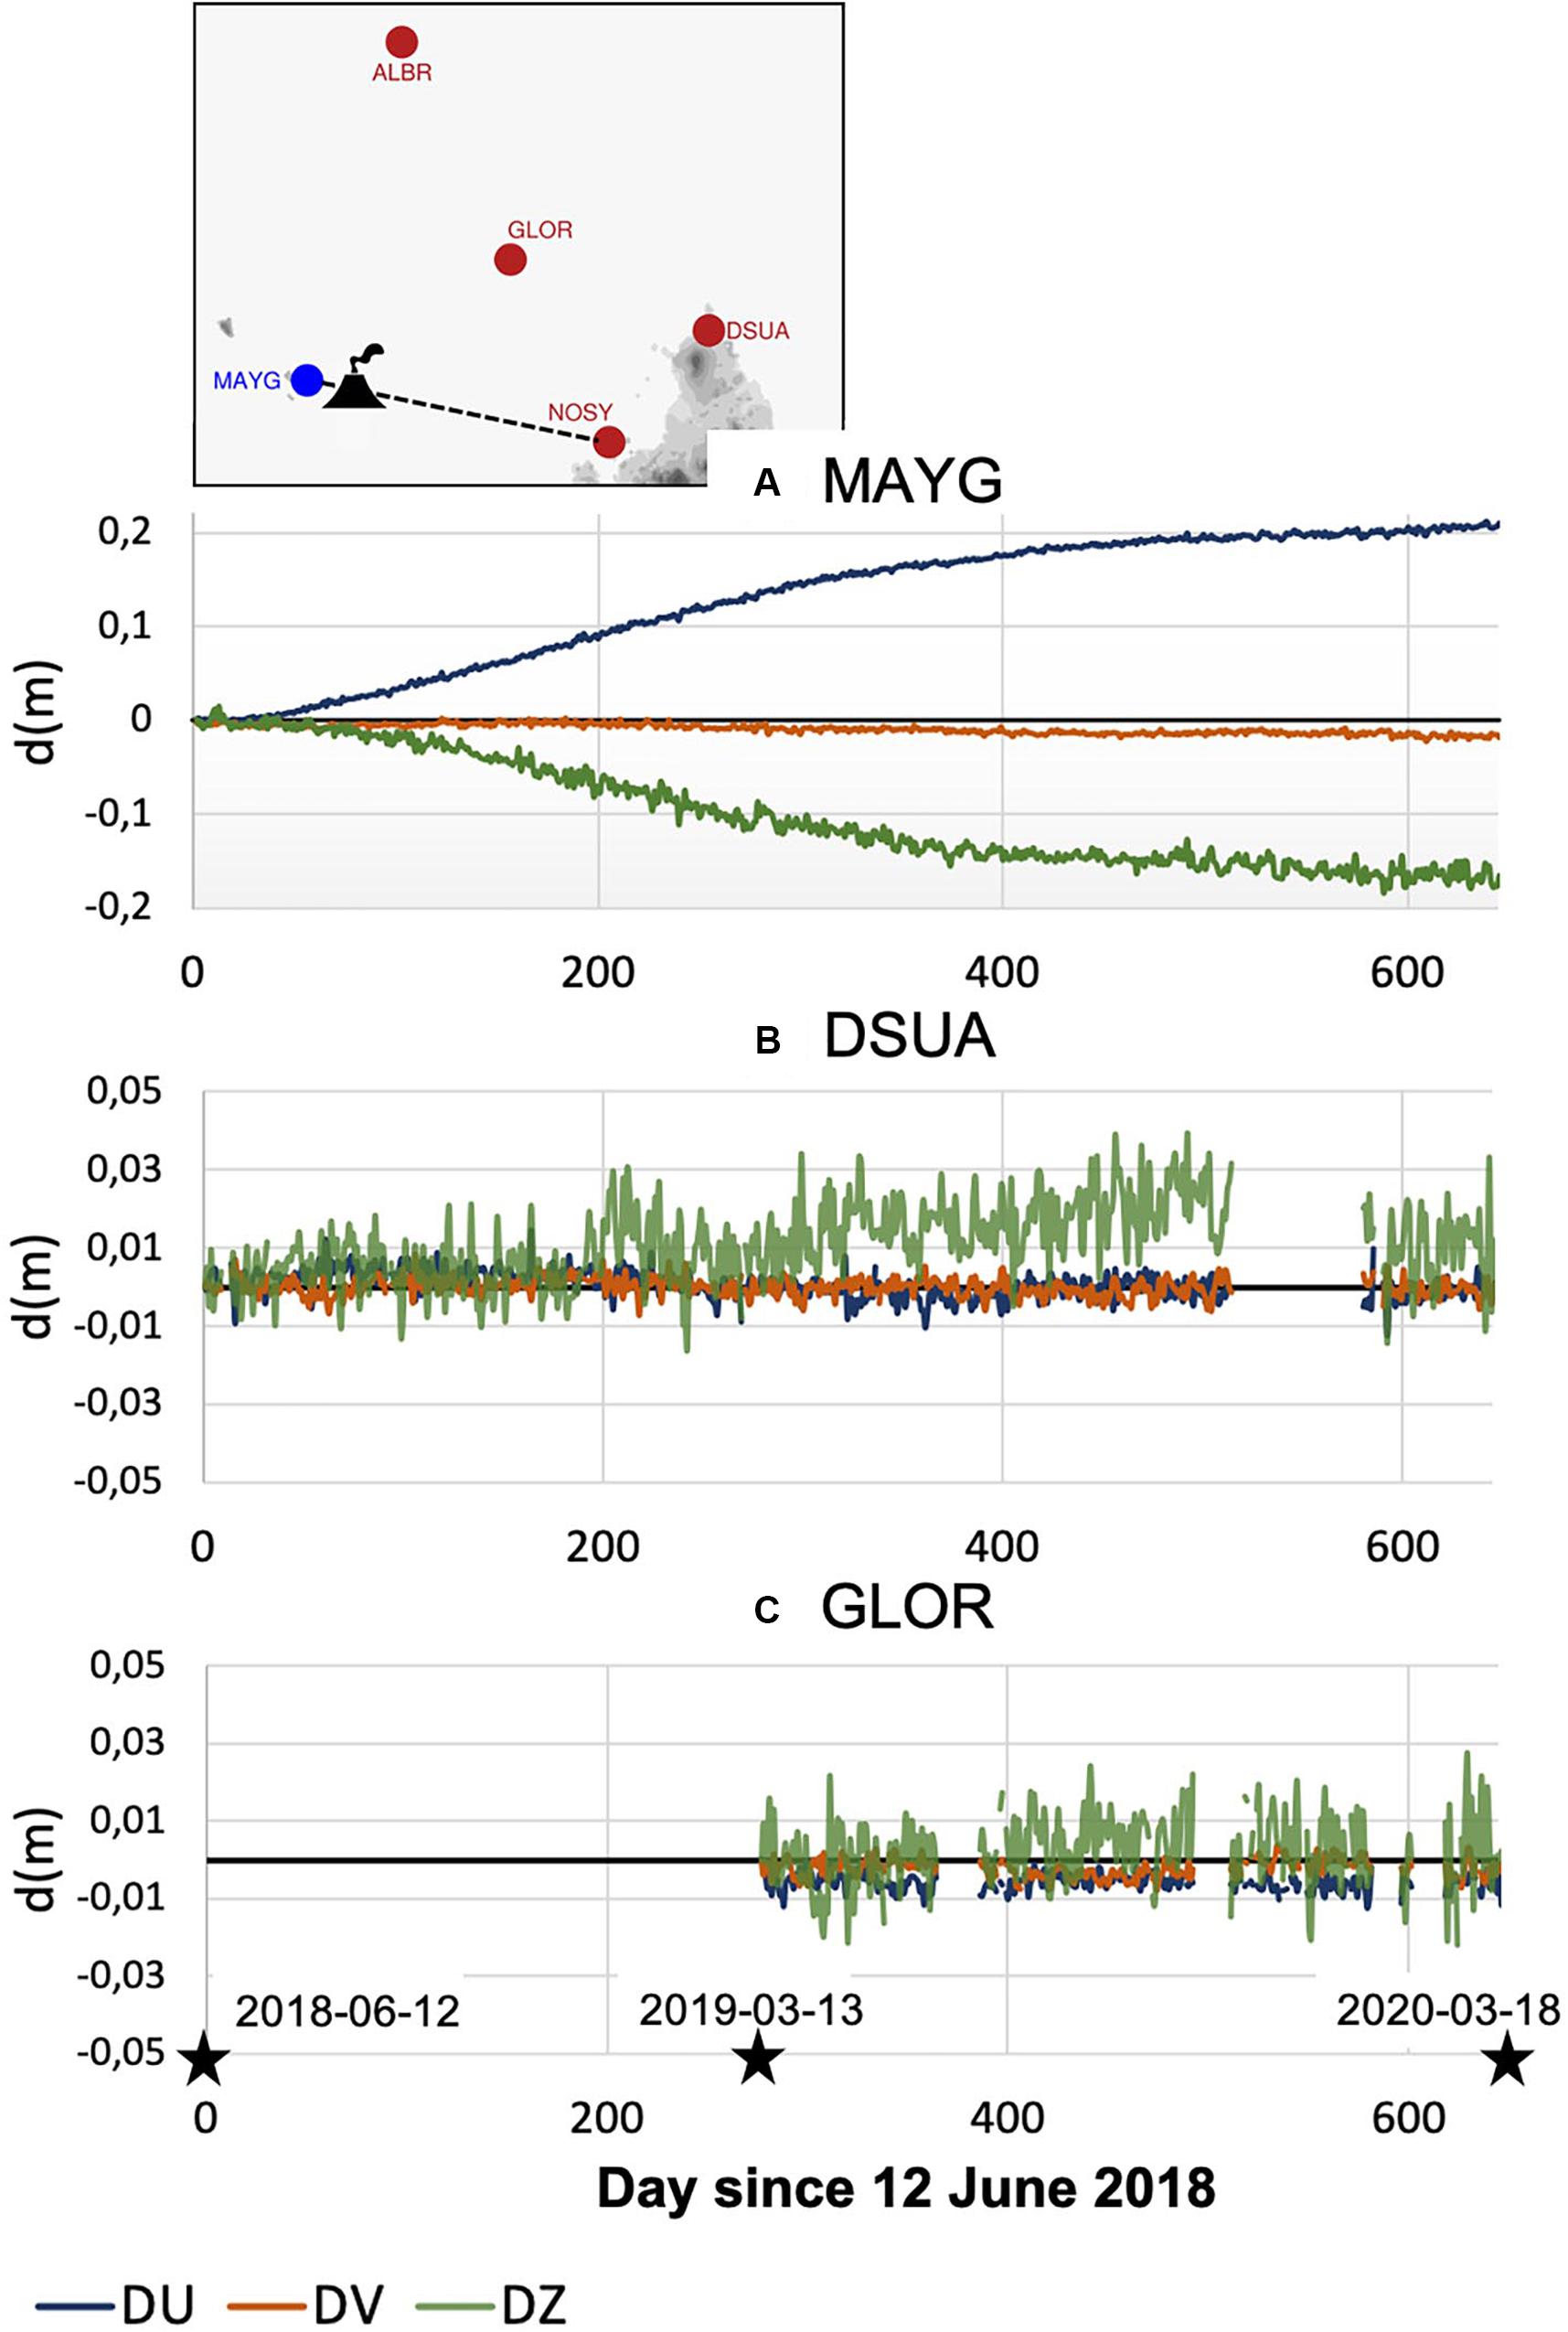
Figure 4. Eastward (blue), southward (orange), and vertical (green) ground displacements with plate velocity removed as recorded by GNSS stations of (A) Mayotte (MAYG), (B) Diego-Suarez (DSUA) and (C) Grande Glorieuse, between June 12, 2018 and March 3, 2020. The insert shows the position of GNSS stations discussed in the text (in red: IOGA4MET stations, in blue: IGS station) as well as the location of the submarine volcano discovered in May 2019 [12.54′S, 45.43′E]. Note the different vertical scales in (A–C).
As mentioned earlier, data collected at nearby locations can be used to constrain and monitor the spatial extension of the ground deformation associated with the submarine eruption, which is key to anticipate potentially devastating impacts of this seismic-volcanic activity on neighboring territories. As of March 2020, no significant deformation has been recorded yet at GLOR, DSUA (vertical motion data collected at the latter location seems to indicate a slight uplift tendency of 2 cm over the period of observation, which remains in the expected standard error for this component) and Aldabra (380 km N/NE of Mayotte, not shown). Ground displacements associated with the offshore volcanic activity thus do not seem to extend up to 250 km or are currently too low to be detected in very far field. In the coming months, data collected by the newer GNSS station of Nosy-Be (NOSY), which is the first land east of Mayotte along the segment connecting this island to the new volcano (Figure 4), will allow to constrain and investigate more precisely the spatial extension of the source of deformation.
Discussion
The deployment of 10 new permanent GNSS stations in the SWIO considerably increases atmospheric and geodesic observation capabilities in this poorly instrumented area. Although datasets collected to date by these new stations are still limited – most GNSS stations were installed less than a year ago – the analysis of data collected by the oldest ones already allows to assess the potential of these new observations for applications in geodesy and atmospheric sciences.
For instance, the analysis of tropospheric GNSS data collected during year 2019 in northern Madagascar (Diego-Suarez) and three small neighboring islands (Aldabra, Sainte-Marie, and Grande Glorieuse) has shown that these new observations represent a great opportunity to describe more accurately the water cycle at various time and space scales in this little studied area. The analysis of positioning data collected at and nearby Mayotte also shows that these new datasets can be particularly useful to monitor ground-based displacements associated with the unique off-shore volcanic activity currently taking place in this area.
In the short-term additional GNSS stations will be deployed to further increase the density of the network, especially in and around Madagascar (Figure 1). In 2020, five additional stations will thus be installed at Majunga (MAMA), Morondava (MAMO), Tulear (MATU) and Manakara (MAMK), while a second station will be installed at Aldabra (ALBR2) to monitor more precisely potential ground displacements on this emblematic and unique atoll. The installation of a couple of additional GNSS stations in Seychelles (Praslin) and Comoros (Mohéli) is also currently investigated. Another short-term objective is to integrate most IOGA4MET’s stations into the IGS and SONEL (the French dedicated GNSS data center for GLOSS) networks. For this purpose, real-time transmission will be implemented at all Eparses locations (using TAAF’s satellite communication system) and all stations will be upgraded to include the European and Chinese (BeiDou) GNSS satellite constellations (allowing to both increase positioning performance and generate the multi-GNSS products required by IGS). The stations of Aldabra (ALBR), Sainte-Marie (MASM) and Diego-Suarez (DSUA), all used in this study, are among the first candidates.
In the frame of the research project MAP-IO, a mobile GNSS station will also be installed permanently onboard the research vessel Marion Dufresne in late 2020. The RV Marion Dufresne, which cruises around 300 days per year in the Eparses Islands and Austral territories, will permit to collect meaningful observations in inaccessible areas of the SWIO as well as to further densify the spatial density of water vapor data collected in this oceanic basin. Studies are also ongoing to evaluate the impact of GNSS data assimilation on AROME-IO’s analysis and forecasts using the 3DVar assimilation scheme implemented in the research version of this operational model (Bousquet et al., 2020). GNSS data assimilation is expected to improve TC forecast in this basin through constraining more precisely the water vapor field in the model. We expect this development to improve, in particular, model forecasts in areas characterized by elevated and complex terrain like Madagascar or small volcanic islands such as Reunion and Mayotte.
Data Availability Statement
The raw data supporting the conclusions of this article will be made available by the authors, without undue reservation.
Author Contributions
OB is the manager of the project. OB and AP were involved in field work, data analysis, research work, and writing. EL, PB, DM, and JD were involved in field work, data analysis, and processing. AD and TD were involved in data analysis and processing. FF-D and LZ were involved in data collection and field work. All authors contributed to the article and approved the submitted version.
Conflict of Interest
The authors declare that the research was conducted in the absence of any commercial or financial relationships that could be construed as a potential conflict of interest.
Funding
The GNSS stations of DSUA, MASM, MATA, MAFD, and ALBR were deployed in the frame of INTERREG-5 Indian Ocean 2014–2020 research project “ReNovRisk Cyclones and Climate Change,” funded by the European Union, La Reunion Regional Council and the French Government. GNSS stations of EURP, JDNV, GLOR, and TROM were installed as part of research project “IOGA4MET-EI,” funded by the research consortium “Iles Eparses” 2017–2020, while NOSY was funded by La Reunion University through its internal research program OMNCG. IGN was funded by CNRS to coordinate geodetic operations for the Mayotte seismic-volcanic crisis. Since the implementation of this ground-based GNSS Observation Network in the Southwest Indian Ocean, the stations GLOR, DSUA, and NOSY are now included in the monitoring of the Mayotte volcano activity through the REVOSIMA (Réseau de surveillance volcanologique et sismologique de Mayotte). REVOSIMA also participated in the funding of the densification of the GNSS network in the Mayotte area.
Acknowledgments
We express their warmest thanks to TAAF administration, Mrs. de Plucinski (Soanambo Hotel), Mr. Badourali (Kaleta Hotel), and Vidal-Lamouroux (Ambonara Mall) for hosting our instruments in Eparses Islands, Sainte-Marie, Fort-Dauphin and Nosy Be. All IOGA4MET GNSS stations, excepting GLOR which belongs to IPGP, are owned by La Reunion University and CNRS. The IGS MAYG station is owned by CNES. This is IPGP contribution 4158. IOGA4MET and IGS (MAYG) GNSS data used in this manuscript are available from IGN’s RGP and IGS databases at ftp://rgpdata.ign.fr/pub/gnssmayotte and https://files.igscb.org, respectively. ERA5 data can be downloaded at https://cds.climate.copernicus.eu/cdsapp!320/dataset/reanalysis-era5-single-levels?tab=overview.
Supplementary Material
The Supplementary Material for this article can be found online at: https://www.frontiersin.org/articles/10.3389/feart.2020.566105/full#supplementary-material
Footnotes
- ^ http://www.igs.org/network for current IGS station location
- ^ https://www.psmsl.org/products/gloss/glossmap.html for current GLOSS stations
References
Arriola, J. S., Lindskog, M., Thorsteinsson, S., and Bojarova, J. (2016). Variational bias correction of GNSS ZTD in the HARMONIE modeling system. J. App. Meteorol. Clim. 55, 1259–1276. doi: 10.1175/JAMC-D-15-0137.1
Bertiger, W., Bar-Sever, Y., Dorsey, A., Haines, B., Nate, H., and Dan, H. (2020). GipsyX/RTGx, a new tool set for space geodetic operations and research. Adv. Space Res. 66, 469–489. doi: 10.1016/j.asr.2020.04.015
Bevis, M., Businger, S., Herring, T. A., Rocken, C., Anthes, R. A., and Ware, R. H. (1992). GPS meteorology: remote sensing of atmospheric water vapor using the global positioning system. J. Geophys. Res. 1992, 15787–15801. doi: 10.1029/92JD01517
Bock, O., Bouin, M. N., Walpersdorf, A., Lafore, J. P., Janicot, S., Guichard, F., et al. (2007a). Comparison of ground- based GPS precipitable water vapour to independent observations and NWP model reanalyses over Africa. Q. J. Roy. Meteor. Soc. 133, 2011–2027. doi: 10.1002/qj.185
Bock, O., Guichard, F., Janicot, S., Lafore, J. P., Bouin, M. N., and Sultan, B. (2007b). Multiscale analysis of precipitable water vapor over africa from gps data and ecmwf analyses. Geophys. Res. Lett. 34:L09705. doi: 10.1029/2006GL028039
Bock, O., Keil, C., Richard, E., Flamant, C., and Bouin, M. N. (2005). Validation of precipitable water from ECMWF model analyses with GPS and radiosonde data during the MAP SOP. Q. J. Roy. Meteorol. Soc. 131, 3013–3036. doi: 10.1256/qj.05.27.384
Bock, O., and Parracho, A. C. (2019). Consistency and representativeness of integrated water vapour from ground-based GPS observations and ERA-Interim reanalysis. Atmos. Chem. Phys. 19, 9453–9468. doi: 10.5194/acp-19-9453-2019
Bousquet, O., Barbary, D., Bielli, S., Kebir, S., Laure, R., Faure, G., et al. (2020). An evaluation of tropical cyclone forecast in the Southwest Indian Ocean basin with AROME-Indian Ocean convection-permitting numerical weather predicting system. Atmos Sci Lett. 21:e950. doi: 10.1002/asl2.950
Brenot, H., Neméghaire, J., Delobbe, L., Clerbaux, N., De Meut-ter, P., Deckmyn, A., et al. (2013). Preliminary signs of the initiation of deep convection by GNSS. Atmos. Chem. Phys. 13, 5425–5449. doi: 10.5194/acp-13-5425-2013
Bürgmann, R., and Chadwell, D. (2014). Seafloor geodesy. Annu. Rev. Earth Planet. Sci. 42, 509–534. doi: 10.1146/annurev-earth-060313-054953
Cesca, S., Letort, J., Razafindrakoto, H. N. T., Sebastian, H., Eleonora, R., Isken, M. P., et al. (2020). Drainage of a deep magma reservoir near Mayotte inferred from seismicity and deformation. Nat. Geosci. 13, 87–93. doi: 10.1038/s41561-019-0505-5
Chen, B., and Liu, Z. (2016). Global water vapor variability and trend from the latest 36year (1979 to 2014) data of ECMWF and NCEP reanalyses, radiosonde, GPS, and microwave satellite. J. Geophys. Res. Atmos. 121, 442–411. doi: 10.1002/2016JD024917
Courgeon, S., Bachèlery, P., Jouet, G., Jorry, S. J., Bou, E., Gilbert, C., et al. (2018). The offshore east African rift system: new insights from the Sakalaves seamounts (Davie Ridge, SW Indian Ocean). Terra Nova 30, 380–388. doi: 10.1111/ter.12353
Dach, R., Lutz, S., Walser, P., and Fridez, P. (2015). Bernese GNSS Software Version 5.2. Bern: University of Bern.
Fernández, J., Pepe, M., Poland, F., and Sigmundsson, F. (2017). Volcano geodesy: recent developments and future challenges. J. Volcanol. Geotherm. Res. 344, 1–12. doi: 10.1016/j.jvolgeores.2017.08.006
Guerova, G., Jones, J., Dousa, J., Dick, G., Haan, S. D., Rosa, P., et al. (2016). Review of the state of the art and future prospects of the ground-based GNSS meteorology in Europe. Atmos. Meas. Tech. 9, 5385–5406. doi: 10.5194/amt-9-5385-2016
Hersbach, H., Bell, B., Berrisford, P., Shoji, H., Andras, H., Radu, R., et al. (2020). The ERA5 global reanalysis. Q. J. R. Meteorol. Soc. 2020, 1–51. doi: 10.1002/qj.3803
Landman, W. A., Seth, A., and Camargo, S. J. (2005). The effect of regional climate model domain choice on the simulation of tropical cyclone-like vortices in the southwestern Indian Ocean. J. Clim. 18, 1263–1274. doi: 10.1175/JCLI3324.1
Lees, E., Bousquet, O., Roy, D., and Leclair, J. (2020). Analysis of diurnal to seasonal variability of Integrated Water vapour in the South Indian Ocean Basin Using Ground-Based GNSS and 5th generation ECMWF Reanalysis (ERA5) data. Q. J. R. Meteorol. Soc. (in press).
Lemoine, A., Briole, P., Bertil, D., Roullé, A., Foumelis, M., Thinon, I., et al. (2020). The 2018–2019 seismo-volcanic crisis east of Mayotte, Comoros islands: seismicity and ground deformation markers of an exceptional submarine eruption. Geophys. J. Int. 223, 22–44. doi: 10.1093/gji/ggaa273
Leroux, M. D., Meister, J., Mekies, D., Dorla, A., and Caroff, P. (2018). A Climatology of Southwest Indian ocean tropical systems: their number, tracks, impacts, sizes, empirical maximum potential intensity, and intensity changes. J. Appl. Meteor. Climatol. 57, 1021–1041. doi: 10.1175/JAMC-D-17-0094.1
Li, X., Zhang, X., Ren, X., Fritsche, M., Wickert, J., and Schuh, H. (2015). Precise positioning with current multi-constellation Global Navigation Satellite Systems: GPS, GLONASS, Galileo and BeiDou. Sci. Rep. 5:8328. doi: 10.1038/srep08328
Macron, C., Richard, Y., Garot, T., Bessafi, M., Pohl, B., Adolphe, R., et al. (2016). Intraseasonal rainfall variability over madagascar. Mon. Wea. Rev. 144, 1877–1885. doi: 10.1175/MWR-D-15-0077.1
Mahfouf, J. F., Ahmed, F., Moll, P., and Teferle, N. F. (2015). Assimilation of zenith total delays in the AROME France convective scale model: a recent assessment. Tellus A 67:26106. doi: 10.3402/tellusa.v67.26106
Nassor, A., and Jury, M. R. (1998). Intra-seasonal climate variability of Madagascar. Part 1: mean summer conditions. Meteorl. Atmos. Phys. 65, 31–41. doi: 10.1007/BF01030267
Parracho, A. C., Bock, O., and Bastin, S. (2018). Global IWV trends and variability in atmospheric reanalyses and GPS observations. Atmos. Chem. Phys. 18, 16213–16237. doi: 10.5194/acp-18-16213-12018
Segall, P., and Davis, J. L. (1997). GPS applications for geodynamics and earthquake studies. Annu. Rev. Earth Planet. Sci. 25, 301–336. doi: 10.1146/annurev.earth.25.1.301
Van Baelen, J., Reverdy, M., Tridon, F., Labbouz, L., Dick, G., Bender, M., et al. (2011). On the relationship between water vapour and evolution and the life cycle of precipitation systems. Q. J. Roy. Meteor. Soc. 137, 204–223. doi: 10.1002/qj.785.458
Keywords: Southwest Indian Ocean, GNSS – Global Navigation Satellite System, water vapor cycle, Madagascar, Mayotte, geodesy, NWP (numerical weather prediction), AROME Indian Ocean
Citation: Bousquet O, Lees E, Durand J, Peltier A, Duret A, Mekies D, Boissier P, Donal T, Fleischer-Dogley F and Zakariasy L (2020) Densification of the Ground-Based GNSS Observation Network in the Southwest Indian Ocean: Current Status, Perspectives, and Examples of Applications in Meteorology and Geodesy. Front. Earth Sci. 8:566105. doi: 10.3389/feart.2020.566105
Received: 27 May 2020; Accepted: 14 August 2020;
Published: 04 September 2020.
Edited by:
Gert-Jan Steeneveld, Wageningen University & Research, NetherlandsReviewed by:
Jana Sanchez Arriola, Agencia Estatal de Meteorología, SpainRicardo de Camargo, University of São Paulo, Brazil
Copyright © 2020 Bousquet, Lees, Durand, Peltier, Duret, Mekies, Boissier, Donal, Fleischer-Dogley and Zakariasy. This is an open-access article distributed under the terms of the Creative Commons Attribution License (CC BY). The use, distribution or reproduction in other forums is permitted, provided the original author(s) and the copyright owner(s) are credited and that the original publication in this journal is cited, in accordance with accepted academic practice. No use, distribution or reproduction is permitted which does not comply with these terms.
*Correspondence: Olivier Bousquet, olivier.bousquet@meteo.fr