the Creative Commons Attribution 4.0 License.
the Creative Commons Attribution 4.0 License.
 | 04 Sep 2020
Automated precipitation monitoring with the Thies disdrometer: biases and ways for improvement
Michael Fehlmann
Mario Rohrer
Annakaisa von Lerber
Markus Stoffel
The intensity and phase of precipitation at the ground surface can have important implications not only for meteorological and hydrological situations but also in terms of hazards and risks. In the field, Thies disdrometers are sometimes used to monitor the quantity and nature of precipitation with high temporal resolution and very low maintenance and thus provide valuable information for the management of meteorological and hydrological risks. Here, we evaluate the Thies disdrometer with respect to precipitation detection, as well as the estimation of precipitation intensity and phase at a pre-alpine site in Switzerland (1060 m a.s.l.), using a weighing precipitation gauge (OTT pluviometer) and a two-dimensional video disdrometer (2DVD) as a reference. We show that the Thies disdrometer is well suited to detect even light precipitation, reaching a hit rate of around 95 %. However, the instrument tends to systematically underestimate rainfall intensities by 16.5 %, which can be related to a systematic underestimation of the number of raindrops with diameters between 0.5 and 3.5 mm. During snowfall episodes, a similar underestimation is observed in the particle size distribution (PSD), which is, however, not reflected in intensity estimates, probably due to a compensation by snow density assumptions. To improve intensity estimates, we test PSD adjustments (to the 2DVD) and direct adjustments of the resulting intensity estimates (to the OTT pluviometer), the latter of which are able to successfully reduce the systematic deviations during rainfall in the validation period. For snowfall, the combination of the 2DVD and the OTT pluviometer seems promising as it allows for improvement of snow density estimates, which poses a challenge to all optical precipitation measurements. Finally, we show that the Thies disdrometer and the 2DVD agree well insofar as the distinction between rain and snowfall is concerned, such that an important prerequisite for the proposed correction methods is fulfilled. Uncertainties mainly persist during mixed-phase precipitation or low precipitation intensities, where the assignment of precipitation phase is technically challenging, but less relevant for practical applications. We conclude that the Thies disdrometer is suitable not only to estimate precipitation intensity but also to distinguish between rain and snowfall. The Thies disdrometer therefore seems promising for the improvement of precipitation monitoring and the nowcasting of discharge in pre-alpine areas, where considerable uncertainties with respect to these quantities are still posing a challenge to decision-making.


The intensity and type of precipitation falling on the ground surface (e.g., rain, snow, drizzle, or hail) often determines the absence or occurrence of subsequent processes. A detailed knowledge on the nature and intensity of precipitation is therefore decisive in terms of hazards and ensuing risks. For example, for the management of traffic roads, it is important to know whether falling snow or mist will likely hamper road conditions or visibility (Toivonen and Kantonen, 2001). In this context, Juga et al. (2012) show that very poor visibility due to intense snowfall, combined with reduced road surface friction, caused a severe flow of accidents in Helsinki on 17 March 2005. Likewise, the occurrence of freezing rain at the ground surface can lead to the collapse of trees and power supply lines with potentially catastrophic cascading effects, as was experienced during a recent case in Slovenia (Kämäräinen et al., 2017; Schauwecker et al., 2019). Last, but not least, both precipitation intensity and its phase (i.e., rain or snowfall) are decisive for runoff formation and the occurrence of flash floods in (pre-)alpine catchments (e.g., Fehlmann et al., 2018; Tobin et al., 2012).
To support decision-making and intervention in such situations, the Thies Clima laser precipitation monitor (in the following referred to as Thies disdrometer) offers the possibility to measure precipitation intensity and type with a high temporal resolution; the monitor can therefore replace present weather observations from manned stations to a certain degree (Merenti-Välimäki et al., 2001). Due to their low maintenance requirements, disdrometers have been used widely for operational weather monitoring for road or air traffic. More recently, the Thies disdrometer has also been tested with the aim of verifying dual-polarimetric weather radars, and in particular their hydrometeor classification algorithms (Pickering et al., 2019). Aside from the calibration and verification of rainfall estimation by radar and satellite, disdrometers are also used for a proper understanding of hydrometeorological regimes and soil erosion, pollution wash off in urban environments, or interactions of rainfall with crop and forest canopies (Angulo-Martínez et al., 2018; Frasson and Krajewski, 2011; Nanko et al., 2004, 2013). In the future, disdrometers will likely be employed more often for hydrological purposes as well, with the aim of monitoring heavy precipitation and the ensuing nowcasting of river discharge, particularly in mountainous environments where precipitation phase estimates are still uncertain (e.g., Unterstrasser and Zängl, 2006). However, there are only a few studies that assess the uncertainties of the Thies disdrometer, mostly comparing the instrument to OTT Parsivel disdrometers (e.g., Adirosi et al., 2018; Angulo-Martínez et al., 2018; Guyot et al., 2019; Upton and Brawn, 2008) and (in a few cases) to rain gauges (e.g., Lanza and Vuerich, 2012; Lanzinger et al., 2006). Furthermore, weather radars still suffer from limitations in the detection of convective precipitation or due to the blocking of the radar signal at lower elevations by mountain topography (Besic et al., 2016), therefore rendering reliable ground observations even more important in these areas.
In this study, we evaluate the Thies disdrometer with respect to precipitation detection, as well as the monitoring of precipitation intensity and phase, at a well-instrumented measuring site in Switzerland (Innereriz, 1060 m a.s.l.). To this end, we have used a weighing precipitation gauge (OTT pluviometer) and a two-dimensional video disdrometer (2DVD) as reference instruments over a measurement period of 2 years. The 2DVD provides accurate information about the volume and velocity of falling hydrometeors and has already been used previously as a reference to correct particle size and velocity (Parsivel) distributions of laser disdrometers during either rainfall (Leinonen et al., 2012; Raupach and Berne, 2015) or snowfall (Battaglia et al., 2010), even if the 2DVD seems to underestimate droplets in the lower range of diameters, i.e., below 0.5 mm (Raupach et al., 2019; Thurai et al., 2017; Thurai and Bringi, 2018). In this study, we include both solid and liquid precipitation events and point to differences in resulting correction methods. Furthermore, we develop a hydrometeor classification algorithm for the 2DVD measurements as a basis for the evaluation of precipitation phase estimates. Whereas other studies have developed such algorithms using bulk variables for the classification (e.g., Grazioli et al., 2014), here we have implemented a particle-by-particle classification method allowing to explore resulting mixing ratios in the case of mixed-phase precipitation.
The paper is organized as follows: in Sect. 2, the measurement devices are presented in more detail and the processing of the raw data is described. In Sect. 3, biases and proposed corrections of the Thies disdrometer are presented with respect to precipitation detection and the monitoring of precipitation intensity and phase. In Sect. 4, results are discussed and conclusions are drawn with respect to the operational monitoring of precipitation with the Thies disdrometer, as well as potential applications in a hydrological context.
2.1 Measurement devices
The Thies disdrometer is evaluated in this study by using a weighing precipitation gauge (OTT pluviometer) and a 2DVD as a reference. Measurements have been taken over a duration of 2 years (1 July 2017–30 June 2019). These instruments have been set up at Innereriz, Switzerland (1060 m a.s.l., Fig. 1) and are described in more detail in the following.
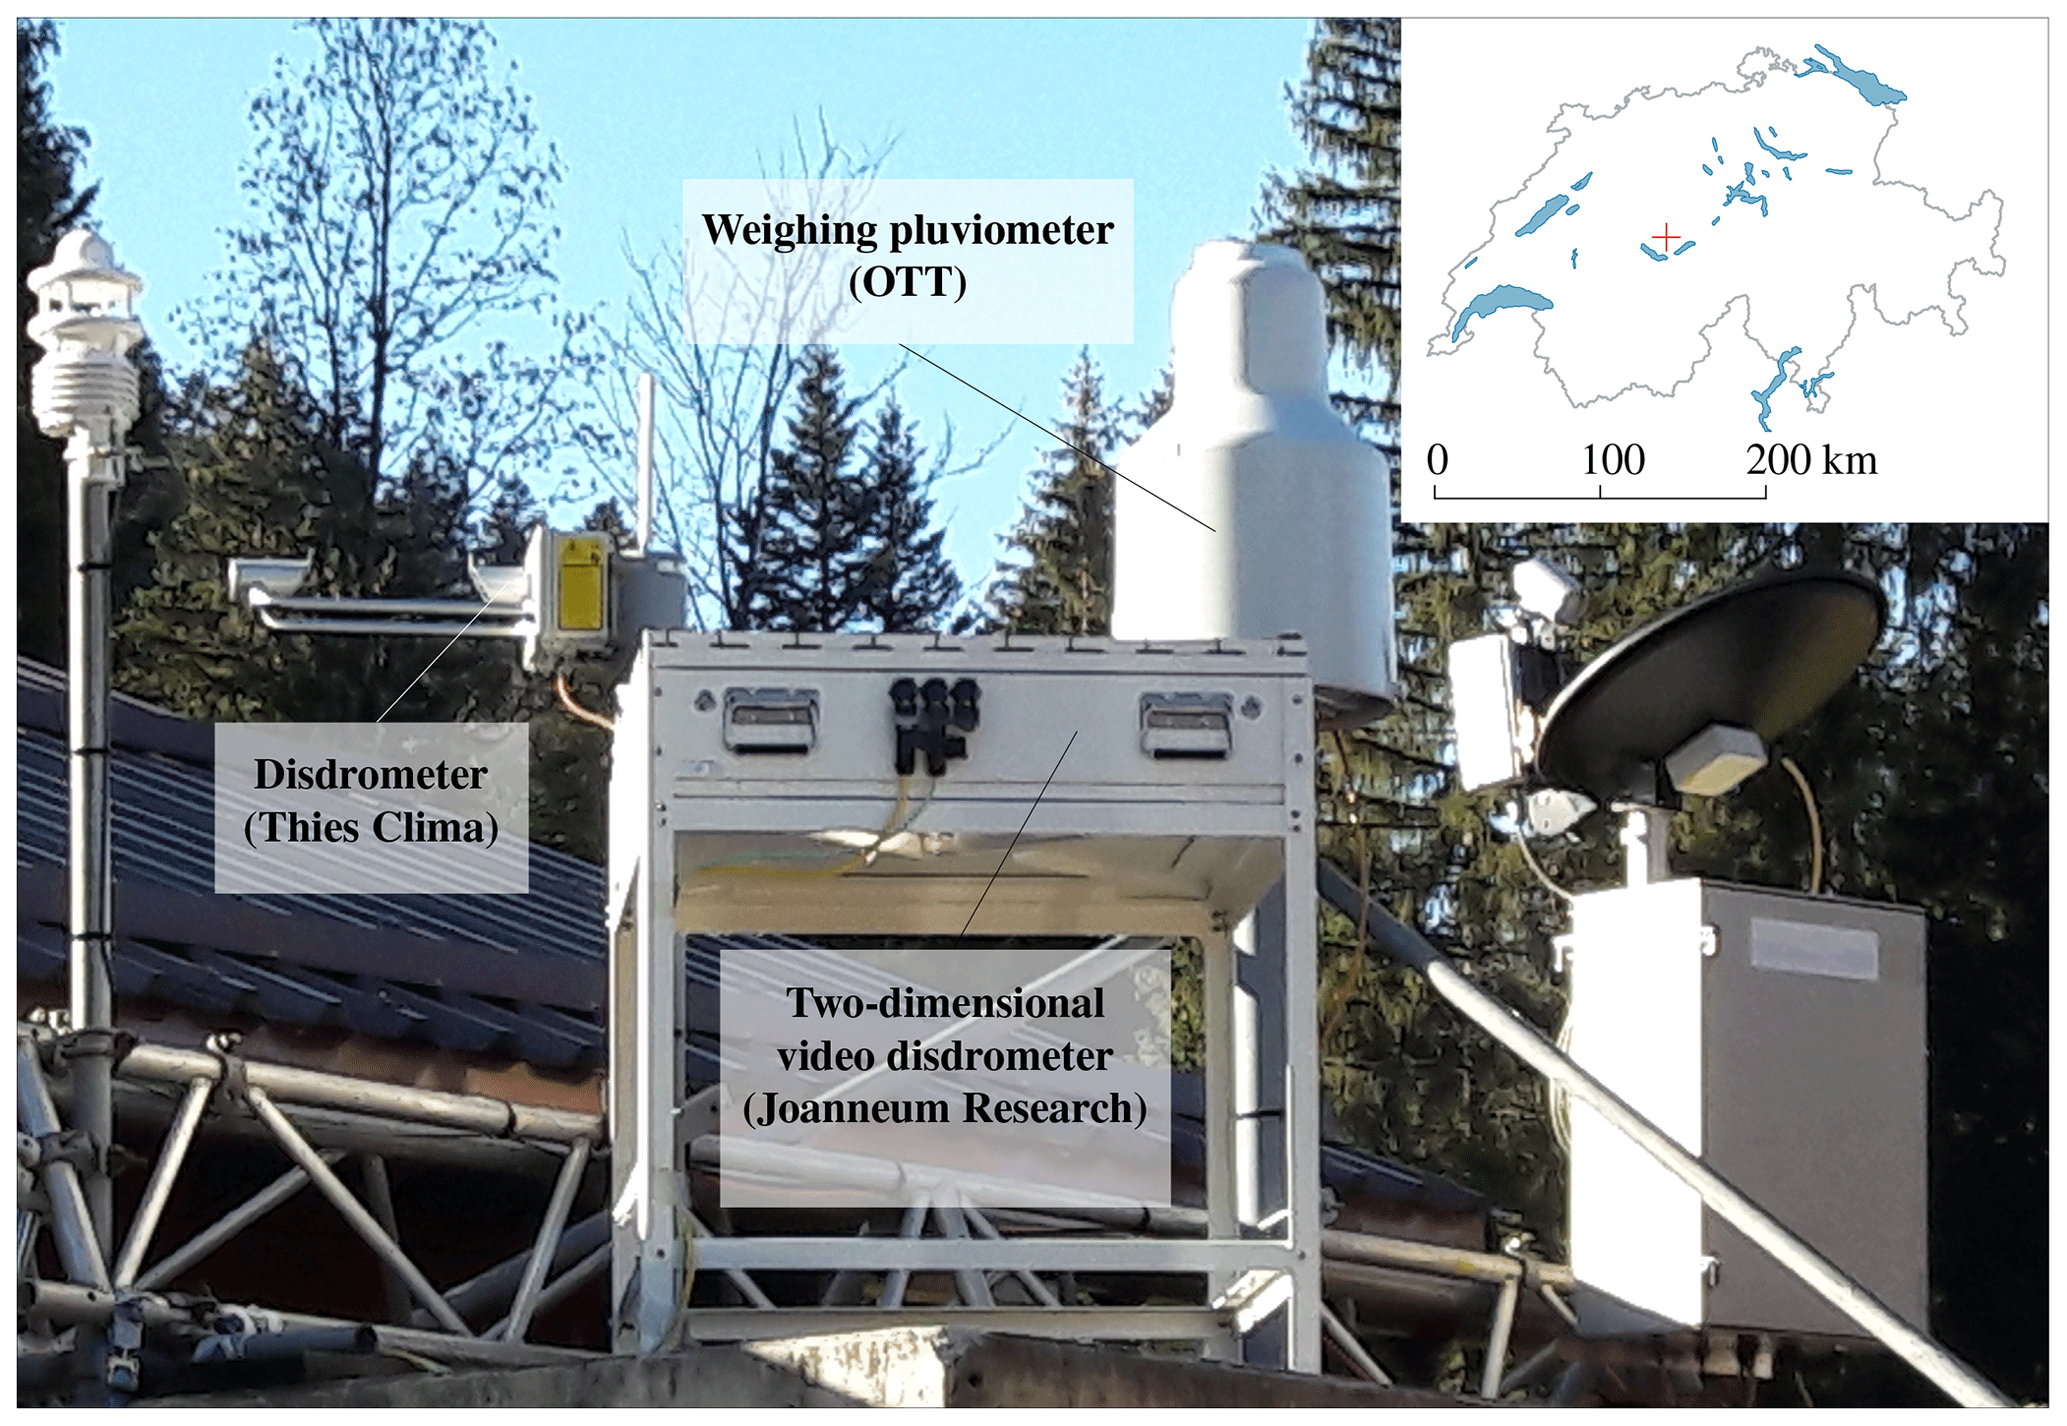
Figure 1Measurement devices located in a pre-alpine area in Switzerland (Innereriz, 1060 m a.s.l.). In this study, the Thies disdrometer is evaluated using both the OTT pluviometer as well as a two-dimensional video disdrometer as a reference during 2 years of measurements.
The Thies disdrometer is designed to estimate precipitation intensity and different types of precipitation (e.g., drizzle, rain, hail, snow, or mixed precipitation). Precipitation type and intensity are estimated on the basis of an optical principle, i.e., by the generation of a laser beam (786 nm) attenuated by falling particles (Fig. 2a). The strength and duration of this attenuation allows for an inference of the diameter and velocity of the falling particles, such that precipitation type can be estimated by using empirical relationships between these two quantities (e.g., Gunn and Kinzer, 1949). The exact functioning of this classification algorithm, as well as the other equations used, are thereby not reported by the manufacturer. To derive precipitation intensity from raw particle data, several assumptions have to be made that also regard particle shape and density. Whereas for liquid precipitation, an oblate shape (Chuang and Beard, 1990) and a density of 1 g cm−3 are assumed, and a spherical shape is considered for solid precipitation. The density of a snow particle (ranging from 5 to 450 g cm−3) is estimated, taking its diameter and velocity and the ambient temperature into account. As the exact relationship used is not reported by the manufacturer, a simplified relationship between particle diameter and density is derived in this study to estimate precipitation intensities in case of snowfall (Sect. 3.2). The dominant precipitation type (WMO table 4680) and precipitation intensity are reported by the instrument every minute. Furthermore, particle diameter and velocity distributions are summarized by the number of particles recorded in paired classes of diameters (20 classes, ranging from 0.125 to 9 mm) and velocity (22 classes, ranging from 0 to 12 m s−1), yielding a total of 440 classes. Note that in some studies using optical disdrometer measurements, additional filters are applied to remove spurious measurements due to splashing or margin faller effects (e.g., Chen et al., 2016; Friedrich et al., 2013; Raupach and Berne, 2015; von Lerber et al., 2017). Usually, such filters are based on a validity check of the combined diameter and fall velocity information, e.g., excluding data that are more than 60 % above or below the fall velocity–diameter relationship for rain (Jaffrain and Berne, 2011). However, as investigated in detail by Friedrich et al. (2013) for Parsivel disdrometers, such spurious measurements mostly occur at wind speeds exceeding 20 m s−1. As our study is extremely wind-sheltered (see Sect. 4), we thus did not see the need to apply such a filter in this study. This is further supported by an exploratory analysis of applying the filter proposed by Chen et al. (2016) to the Thies disdrometer measurements over the full time period, which revealed that the volume contribution of the filtered particles is only very small (on the order of 2 %–3 %) in our case.
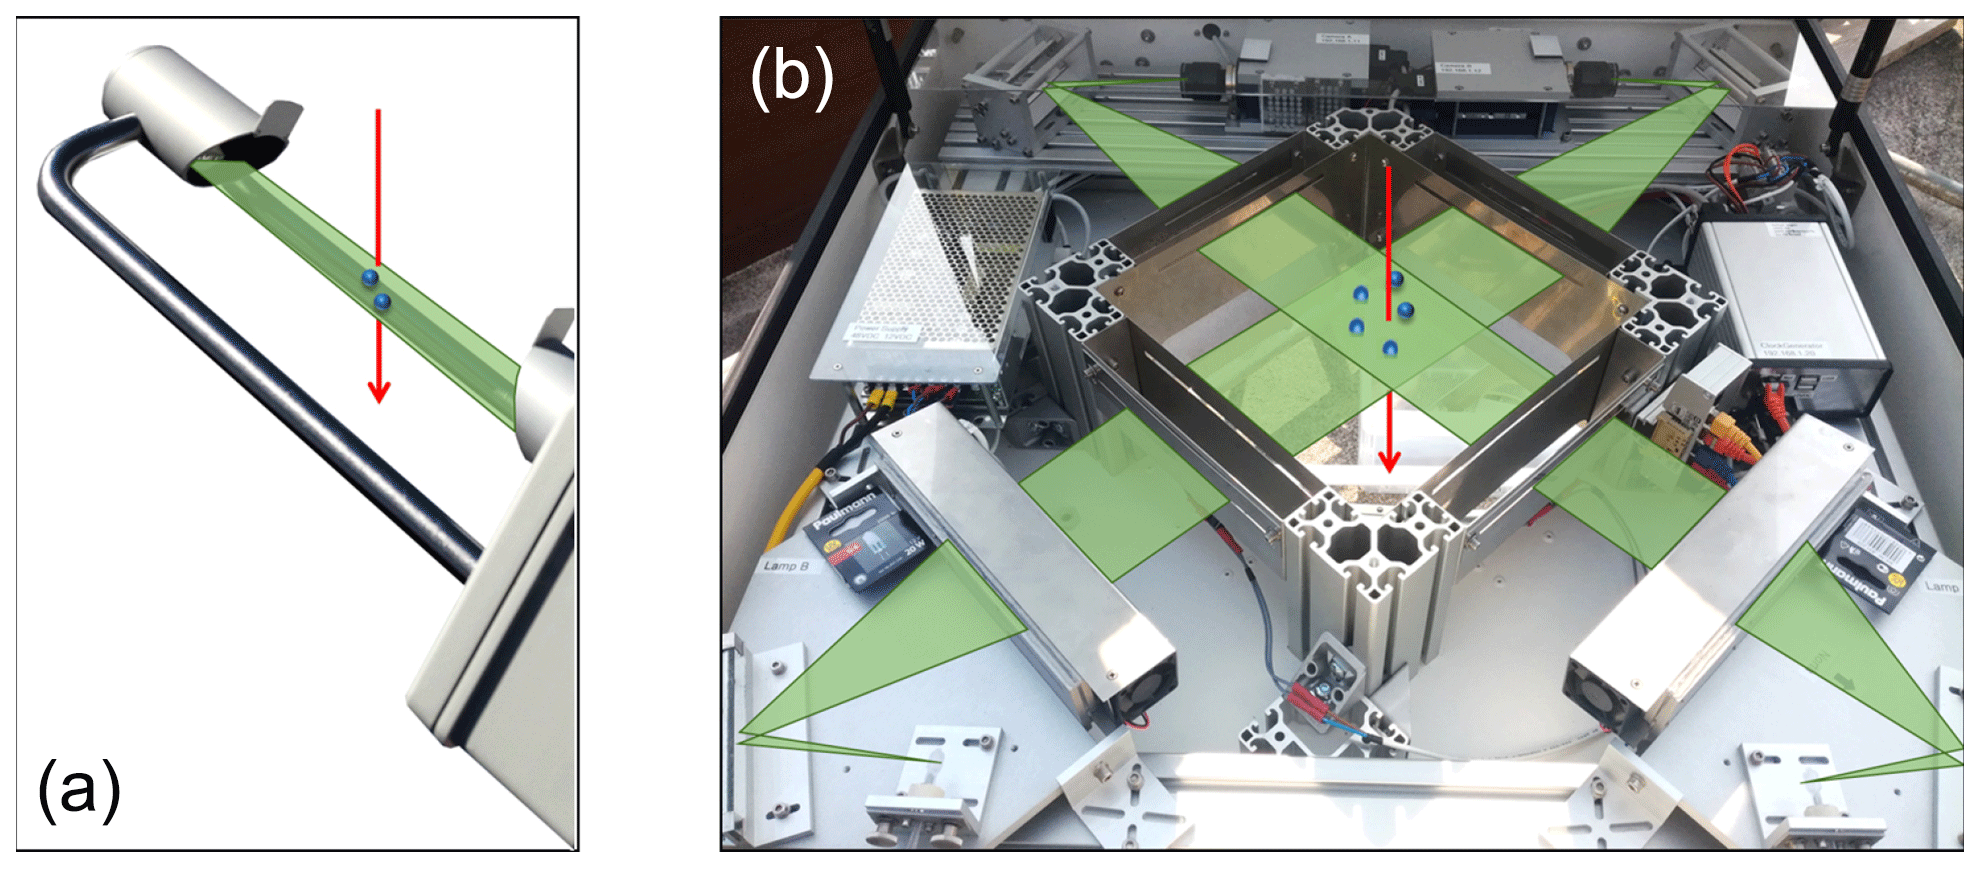
Figure 2Comparison of the measurement principles of the Thies disdrometer (a) and the two-dimensional video disdrometer (2DVD, b): while the Thies disdrometer measures the attenuation of an infrared laser beam (786 nm) via falling particles, the 2DVD detects the shadowing of individual pixels in images taken by two optical cameras and from two perspectives.
The 2DVD, developed by Joanneum research, is able to derive more direct and detailed information about individual hydrometeors than the Thies disdrometer. Maintenance requirements for the instrument are not negligible, and it is mainly used in the research context and in combination with radar observations (e.g., Bringi et al., 2015; Gorgucci and Baldini, 2015; Huang et al., 2010, 2015; Thurai et al., 2012). Furthermore, the 2DVD has been used for the correction of laser disdrometers (Raupach and Berne, 2015). As shown in Fig. 2b, falling hydrometeors are detected by two optical cameras from two perspectives, which allows us to derive more detailed information about the shape and volume of individual particles, as well as their velocity. Information about these quantities is reported for each individual particle, including the exact time of the observation (in ms). Precipitation type is not (yet) reported by the instrument but can be estimated on the basis of the raw particle data. To validate precipitation type estimates by the Thies disdrometer, a classification algorithm was developed in this study, allowing an estimation of the type of each individual hydrometeor (Sect. 2.2).
The OTT pluviometer is designed to automatically determine precipitation intensities and amounts. Unlike tipping bucket rain gauges, this instrument is based on the weighing of the precipitation amount in a high-precision load cell. Advantages compared to a tipping bucket rain gauge are particularly related to the measurement of solid precipitation amounts, resulting in fewer losses due to the evaporation and the avoidance of a temporal lag effect in the measurement (Savina et al., 2012). The instrument is thus able to measure precipitation amounts with high accuracy and is therefore used as a reference for precipitation amounts at the ground surface in various applications, including the validation of disdrometers (e.g., Raupach and Berne, 2015). According to the operating instructions of the OTT pluviometer, the instrument provides the raw precipitation values every 6 s using a resolution of 0.001 mm. After the application of special filter algorithms (e.g., a correction for wind effects), non-real-time 1 min outputs are available at a resolution of 0.01 mm. Of course, it can be questioned whether very weak precipitation can actually be measured so accurately. For example, Tiira et al. (2016) found in their mass retrieval (performed approximately every 5 min) that the output seems to fluctuate and used a threshold of 0.2 mm h−1 for their analysis. Furthermore, a well-known problem when using precipitation gauges mounted above ground is the undercatch due to the influence of wind, which has been extensively studied for rainfall (e.g., Pollock et al., 2018) and in particular for snowfall (e.g., Fassnacht, 2004; Kochendorfer et al., 2017; Yang, 2014; Wolff et al., 2015). The undercatch is thereby found to be larger for snowfall than for rainfall and to increase with increasing wind speed. In this study, however, we do not explicitly correct for wind effects, as wind speeds at the study site are generally very low (on average 0.46 m s−1 during the investigated time period). The maintenance requirements of the instrument are relatively low – only the container, which holds 750 mm for the model used, must be emptied regularly. Precipitation intensity and amount are reported every minute.
Finally, temperature and wind measurements of a LUFFT weather sensor are used in this study. This sensor was located at the same measuring station (Fig. 1) and provided corresponding measurements every minute. Temperature is measured by way of a highly accurate negative temperature coefficient (NTC) resistor in a ventilated housing with radiation protection in order to keep the effects of external influences (e.g., solar radiation) as low as possible. The wind meter uses four ultrasonic sensors that take cyclical measurements in all directions. The resulting wind speed and direction are calculated from the measured run-time sound differential.
2.2 2DVD classification algorithm
As precipitation type is not reported by the 2DVD by default, a classification algorithm was developed in this study to assign one of the following precipitation types to each observed hydrometeor: hail, rain, melting snow, graupel, or snow. Unlike other algorithms (e.g., Grazioli et al., 2014), the algorithm used here is based on a particle-by-particle classification rather than on bulk information, which even allows for the explicit quantification of hydrometeor mixtures during a given time period. For the validation of the Thies disdrometer, the dominant precipitation type during 1 min observations was then estimated on the basis of these mixing ratios.
Similar to the Thies disdrometer, the classification algorithm is based on the empirical relationship between particle diameter D and fall velocity V, which varies among different types of precipitation. The equations used (Eqs. 1–5) are based on literature (Gunn and Kinzer, 1949; Locatelli and Hobbs, 1974; Mitchell, 1996), as well as measurements and analyses conducted by Joanneum Research.
A particle is considered for classification only if its diameter D and velocity V lie within a valid range () and if no major differences exist in particle size between the two cameras (, where HA and HB denote the particle height in camera A and B, respectively). For each valid particle, theoretical fall speeds for different precipitation types are calculated according to its diameter and Eqs. (1)–(5). The estimated values are then compared to measured velocity, whereas precipitation type is determined according to the closest match between these values. In addition, snow or melting snow above 10 ∘C is reclassified as rain – a plausibility check which is also applied by Thies Clima for the processing of Thies disdrometer data. An example of the resulting particle-by-particle classification is given in Fig. 3 for a transition from rain to snowfall during 6 h.
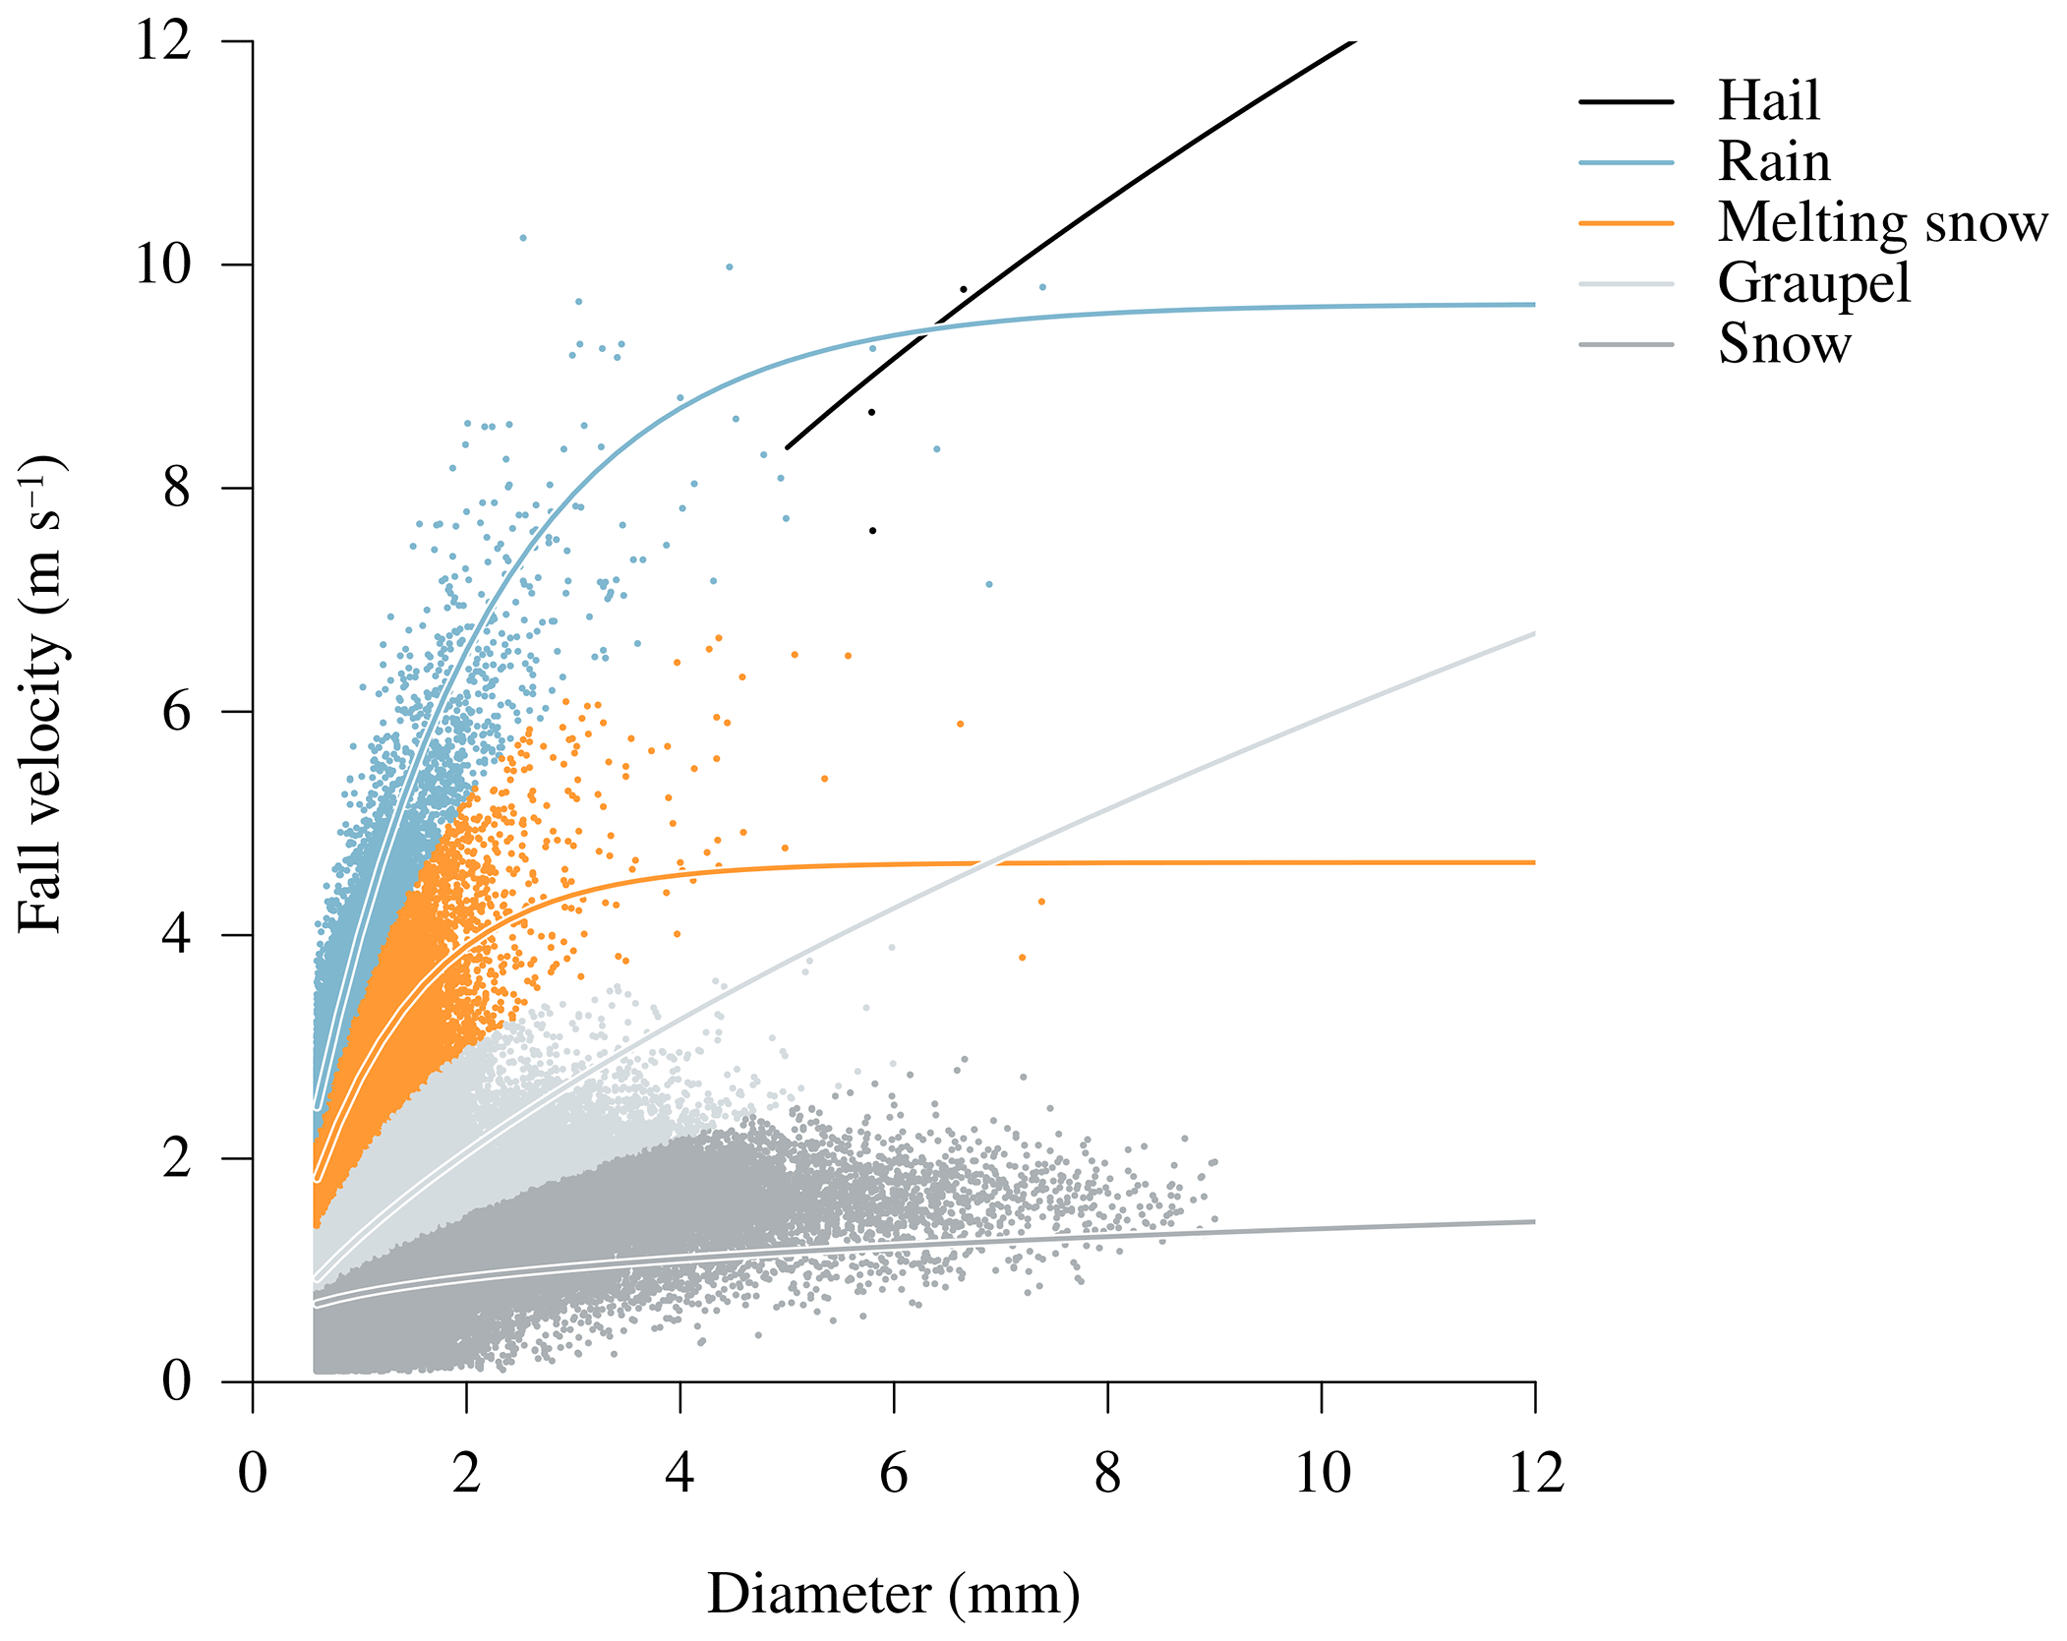
Figure 3Example of the classification algorithm developed in this study during a transition from rain to snowfall (17 February 2018, 17:00 to 23:00 UTC). After a plausibility check, each hydrometeor detected by the two-dimensional video disdrometer is classified as one of five precipitation types (hail, rain, melting snow, graupel, snow). This classification is based on empirical relationships between particle diameter and fall velocity (Eqs. 1–5).
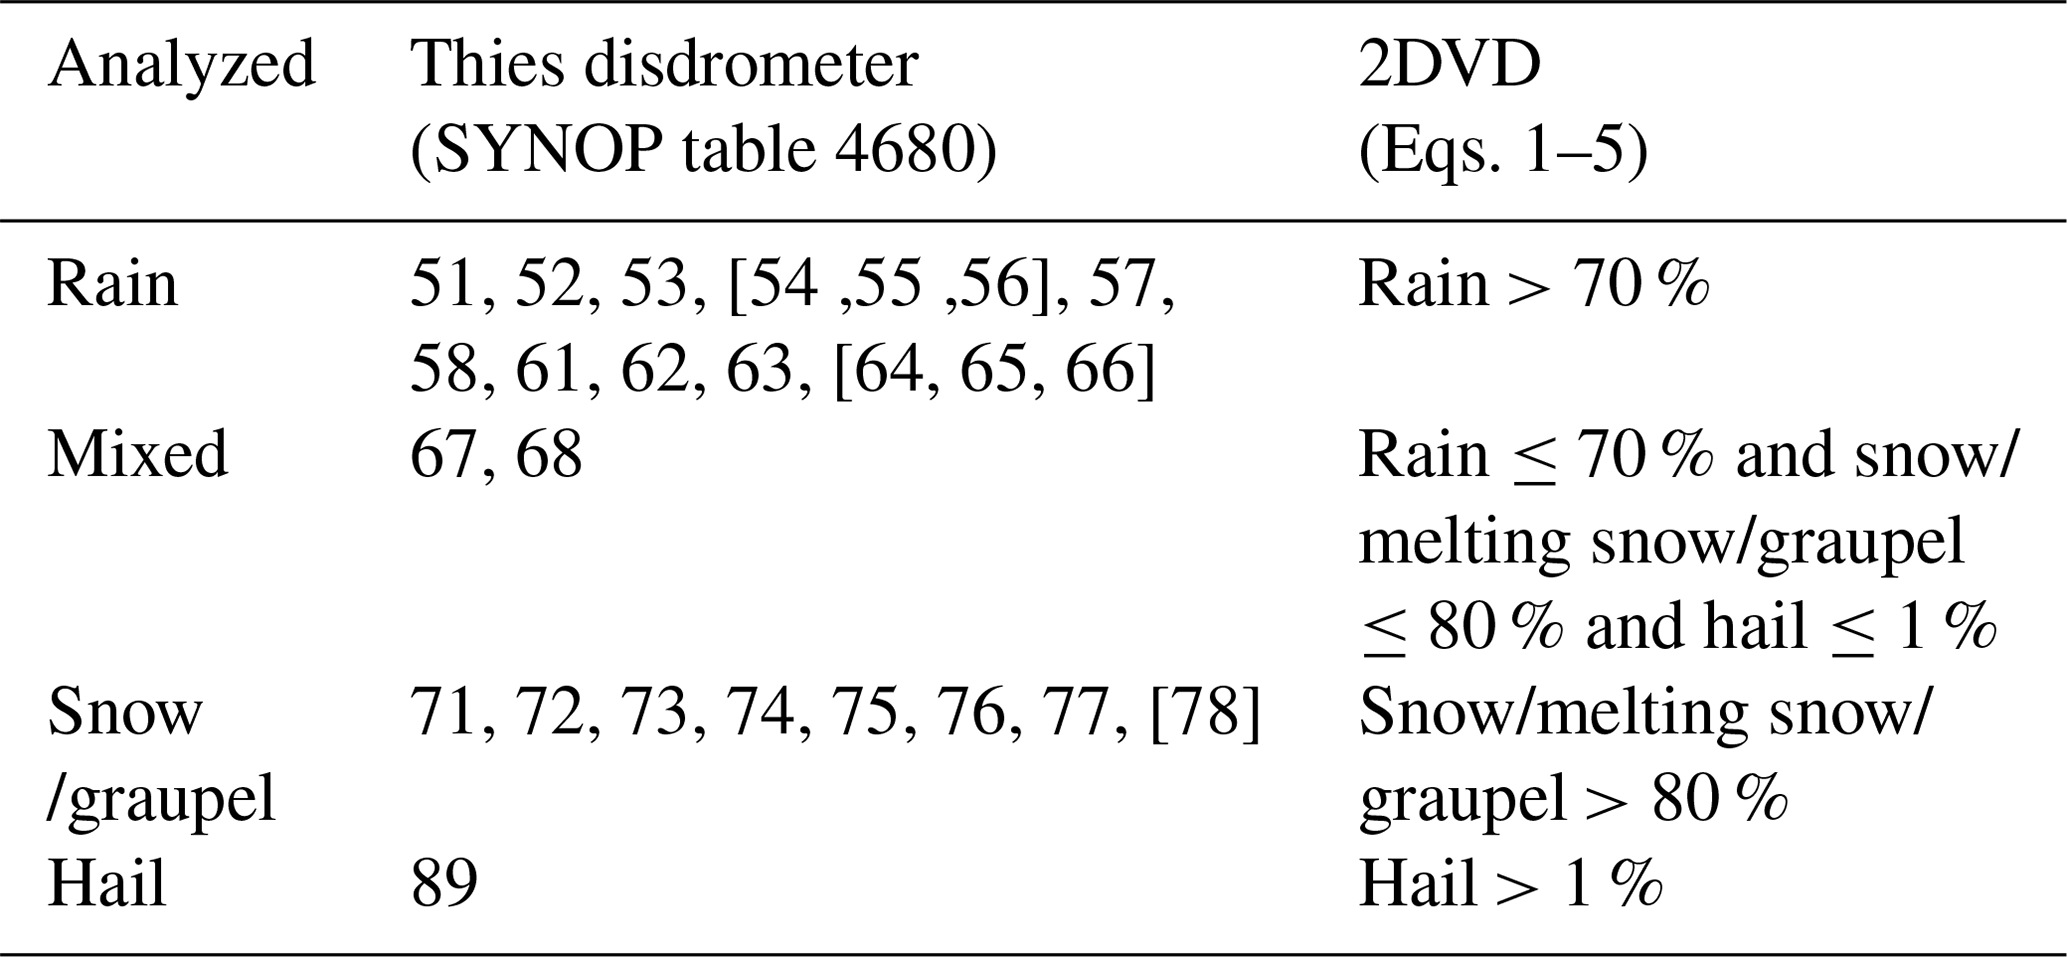
After the inspection of 1 min mixing ratios of different precipitation types obtained by this classification algorithm (not shown here), we determined the dominant precipitation phase during 1 min as follows (Table 1): rain is considered dominant if more than 70 % of the particles are classified as rain, whereas snow and/or graupel are considered dominant if more than 80 % of the particles are classified as snow, melting snow, or graupel. Furthermore, hail is already assigned for mixing ratios greater than 1 % as the chance of (larger) hailstones being captured by the relatively small measuring area is quite small. In the remaining cases, mixed-phase precipitation is assigned.
To investigate the effect of applying different classification methodologies on obtained results, the classification algorithm described above was also applied to Thies data. Given the binned data, the mean velocity and diameter of each V-D class were used for the classification rather than information about individual particles.
2.3 Comparison of measurements and performance measures
The Thies disdrometer is evaluated by using the OTT pluviometer as a reference for precipitation detection and intensities and the 2DVD as a reference for particle size distribution (PSD) and precipitation type. The following comparisons refer to a time period of 2 years (1 July 2017–30 June 2019), during which all of these instruments have been installed simultaneously. Whereas the first year of measurements (1 July 2017–30 June 2018) is used for the design of the proposed correction methods, the second year of measurements (1 July 2018–30 June 2019) is used for the independent validation of the methods.
When comparing the Thies disdrometer with the OTT pluviometer, corresponding 1 min observations are merged. Although both instruments are measuring with a resolution of 1 min, they have not been set up to measure synchronously. To avoid mismatches due to temporal shifts between observations, the minimum integration time considered for the evaluation of precipitation detection and precipitation intensities was set to 5 min. As the effect of increasing integration time on the reliability of measurements can be of interest for operational applications, we also report results for integration times up to 4 h (i.e., 5, 10, 20, 30, 60, 90, 120, and 240 min). Intensities for different integration times are calculated based on the cumulative precipitation sum, which is given by both instruments. For all correction methods applied, the variable of interest is first integrated over the considered integration time before any correction is applied.
Table 1Reclassification scheme used for the comparison of dominant precipitation phase (1 min) between the Thies disdrometer and the two-dimensional video disdrometer (2DVD). Note that codes in square brackets refer to precipitation types that are not yet identifiable automatically, i.e., that are not reported by the instrument.
When comparing the Thies disdrometer (or the OTT pluviometer) with the 2DVD, 1 min observations can be used, and the 2DVD data is aggregated accordingly. When comparing the PSD between the two disdrometers, the number of particles is normalized by the so-called effective measuring area. This area slightly deviates from the actual measuring area (being 45.32 cm2 for the Thies disdrometer and 109.39 cm2 for the 2DVD) as a function of particle diameter. Essentially, the effective measuring area decreases for larger particles due to the increasing nonrecognition of partially observed particles at the border of the measuring area. Whereas the effective measuring area is reported by the 2DVD for each observed particle, it is calculated for each diameter class of the Thies disdrometer following Angulo-Martínez et al. (2018), using the mean diameter of each class. For the adjustment of the particle size distribution (PSD) measured by the Thies disdrometer, we adopt a methodology proposed by Raupach and Berne (2015), which essentially scales drop concentrations per diameter class to ensure that they on average match those recorded by the 2DVD. The correction factors used for this scaling correspond to the ratio of summed 2DVD drop concentrations to summed Thies drop concentrations in the calibration period (1 July 2017–30 June 2018) and are separately calculated for rain and snowfall. For the consistent comparison of precipitation phase between the two disdrometers, certain precipitation types were aggregated according to Table 1. Furthermore, we only consider pairwise complete (1 min) observations of both instruments with either rain, snow, or mixed precipitation, resulting in a time series of 2533 h of precipitation.
For the evaluation of categorical variables, i.e., precipitation detection (yes/no) and precipitation phase (rain/mixed/snow), hit and false alarm rates with respect to the reference instrument are calculated according to Jolliffe and Stephenson (2012). In the case of precipitation detection (yes/no), we further investigate the effect of minimum precipitation thresholds applied to measurements of the Thies disdrometer on hit and false alarm rates by investigating the so-called Receiver Operating Characteristic (ROC) curves (e.g., Jolliffe and Stephenson, 2012). A ROC curve thereby depicts the variation of hit and false alarm rates with the variation of such a threshold. For example, using a threshold of 0 mm h−1 for precipitation detection (i.e., always reporting precipitation regardless of the measurement) will result in both a hit and a false alarm rate of 1. On the other hand, choosing an indefinitely high minimum precipitation threshold will result in both a hit and a false alarm rate of 0. Between these extremes, the resulting hit and false alarm rates depend on the capabilities of the Thies disdrometer to detect precipitation as compared to the reference instrument, while the theoretical optimum (hit rate of 1 and false alarm rate of 0) can usually not be achieved. To establish ROC curves for different integration times we use the fixed thresholds THROC = {0, 0.001, 0.002, ..., 0.05, 0.1, 0.15, ..., 1, 1.2, 1.4, ..., 3} in mm h−1.
For the evaluation of biases in precipitation intensity measurements, systematic deviations between the instruments are characterized in terms of the absolute bias B (Eq. 6), where denotes the estimation of the Thies disdrometer and x denotes the measurement of the OTT pluviometer for all observations n.
3.1 Precipitation detection
The capability of the Thies disdrometer to detect precipitation is assessed using the OTT pluviometer as a reference. After exploring the full time series, data from the first year of measurements was used to optimize precipitation detection by establishing minimum precipitation thresholds. The application of these thresholds was then evaluated during the second year of independent measurements.
The capability of the Thies disdrometer to distinguish precipitation from no precipitation is described in terms of its hit and false alarm rate when using the OTT pluviometer as a reference. In a first step, hit and false alarm rates are calculated over the whole time series and are indicated with circles in Fig. 4a for different integration times. Thereby, hit rates are stable and reach values between 95.2 % and 95.9 %. False alarm rates are low for short integration times (e.g., 5.1 % for periods of 5 min) but tend to increase with increasing integration time (e.g., 14.1 % for periods of 4 h).
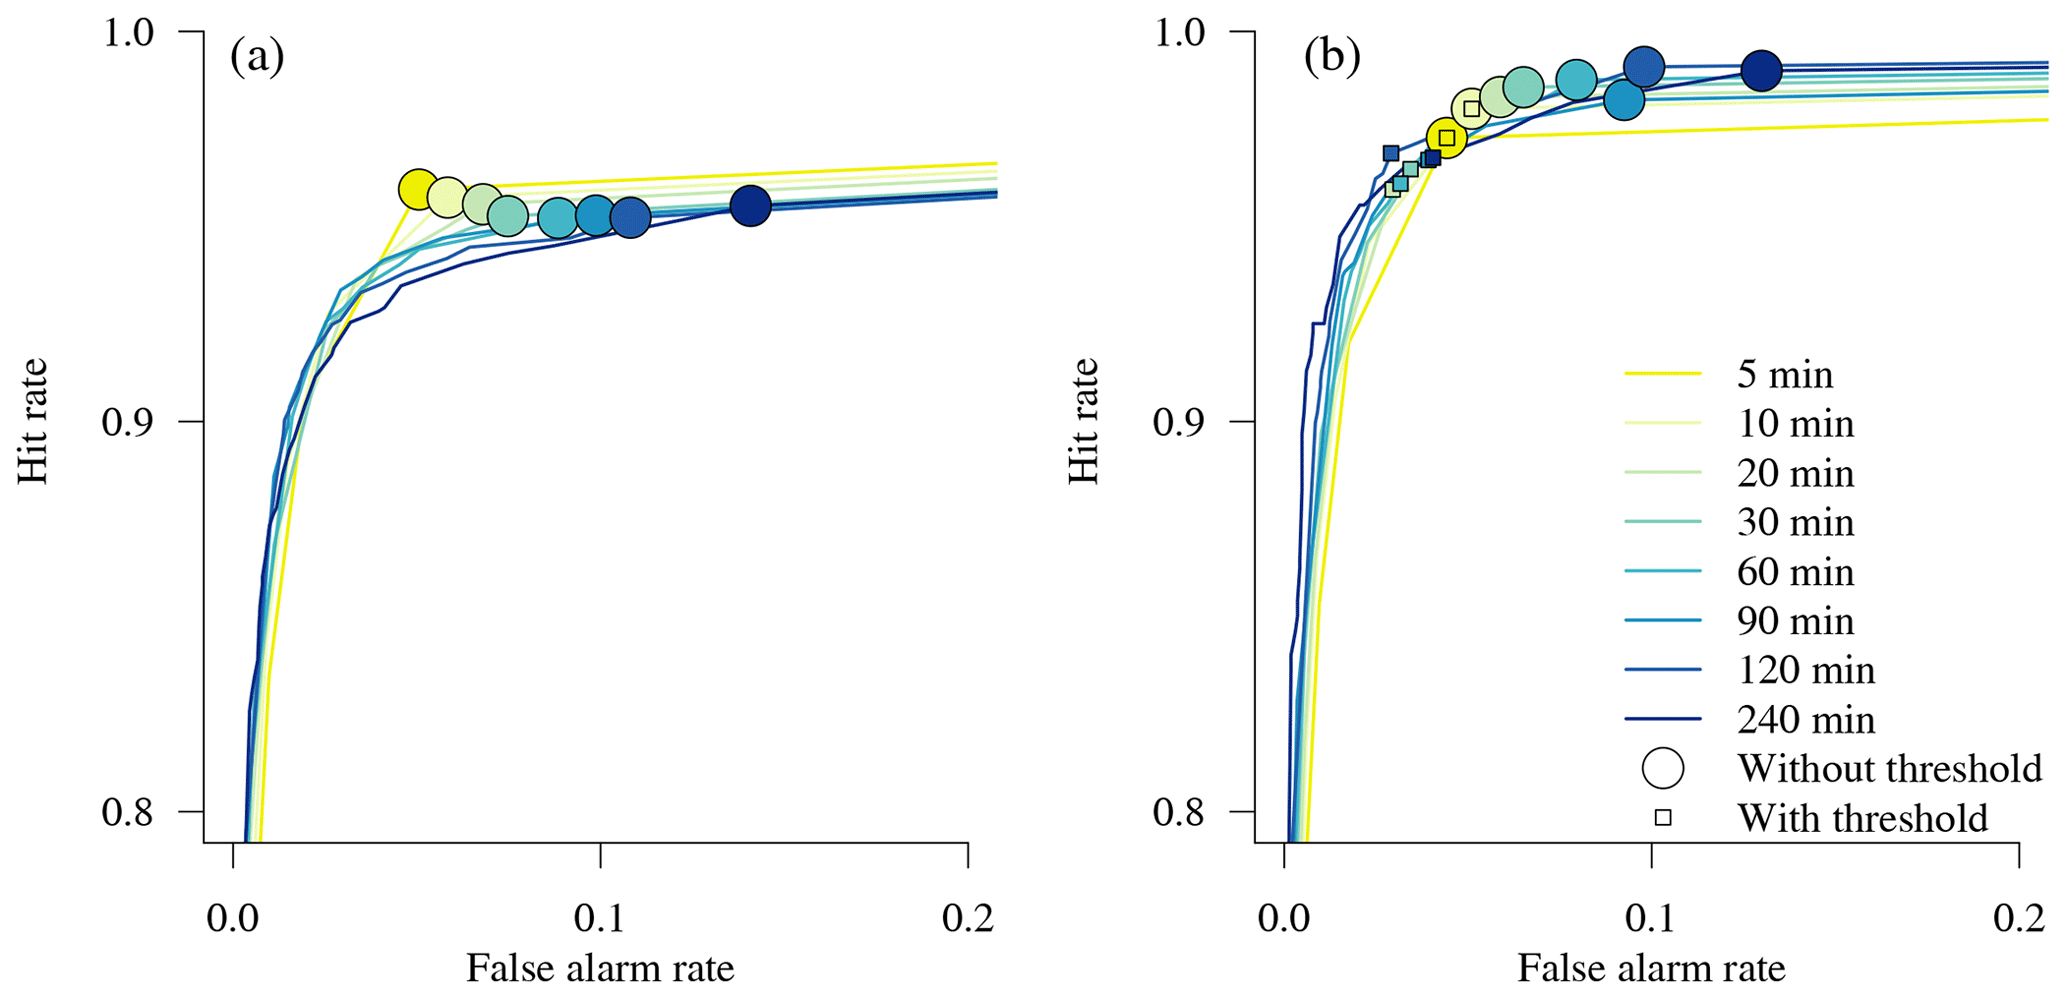
Figure 4Receiver operating characteristic (ROC) curves showing hit and false alarm rates of the Thies disdrometer with respect to the detection of precipitation using the OTT pluviometer as a reference. (a) Exploration of hit and false alarm rates during the whole time series (2 years). (b) Effect of applying minimum precipitation thresholds on hit and false alarm rates during the second year of measurements. Note that the proposed thresholds are established during the first year of measurements in order to reduce false alarm rates, particularly for longer integration times.
In a second step, we tested the application of minimum precipitation thresholds to the Thies disdrometer observations in order to reduce false alarm rates for longer integration times. The ROC curves shown in Fig. 4 (left) thereby depict all possible combinations of hit and false alarm rates that can be achieved by the introduction of such a threshold. The application of a minimum threshold will generally reduce both false alarms and hit rates. Therefore, an optimal threshold was defined for each integration time by minimizing the Euclidean distance to the upper-left corner in the ROC diagram (i.e., to the theoretical optimum with a hit rate equal to 1 and a false alarm rate equal to 0), resulting in a balanced solution between the two measures. This optimization was applied to the first year of measurements, and the resulting thresholds are listed in Table 2 for each integration time. It is noteworthy that these thresholds (expressed in mm h−1) are quite stable for different integration times with a mean of 0.04 mm h−1.
Table 2Minimum precipitation thresholds established in the calibration period to optimize precipitation detection for different integration times. The thresholds are chosen to minimize the distance to an ideal point in a receiver operating characteristic (ROC) diagram (i.e., a hit rate equal to 1 and a false alarm rate equal to 0, Fig. 4). The corresponding reduction in hit and false alarm rates and the resulting distance to this point are given for the independent validation period.

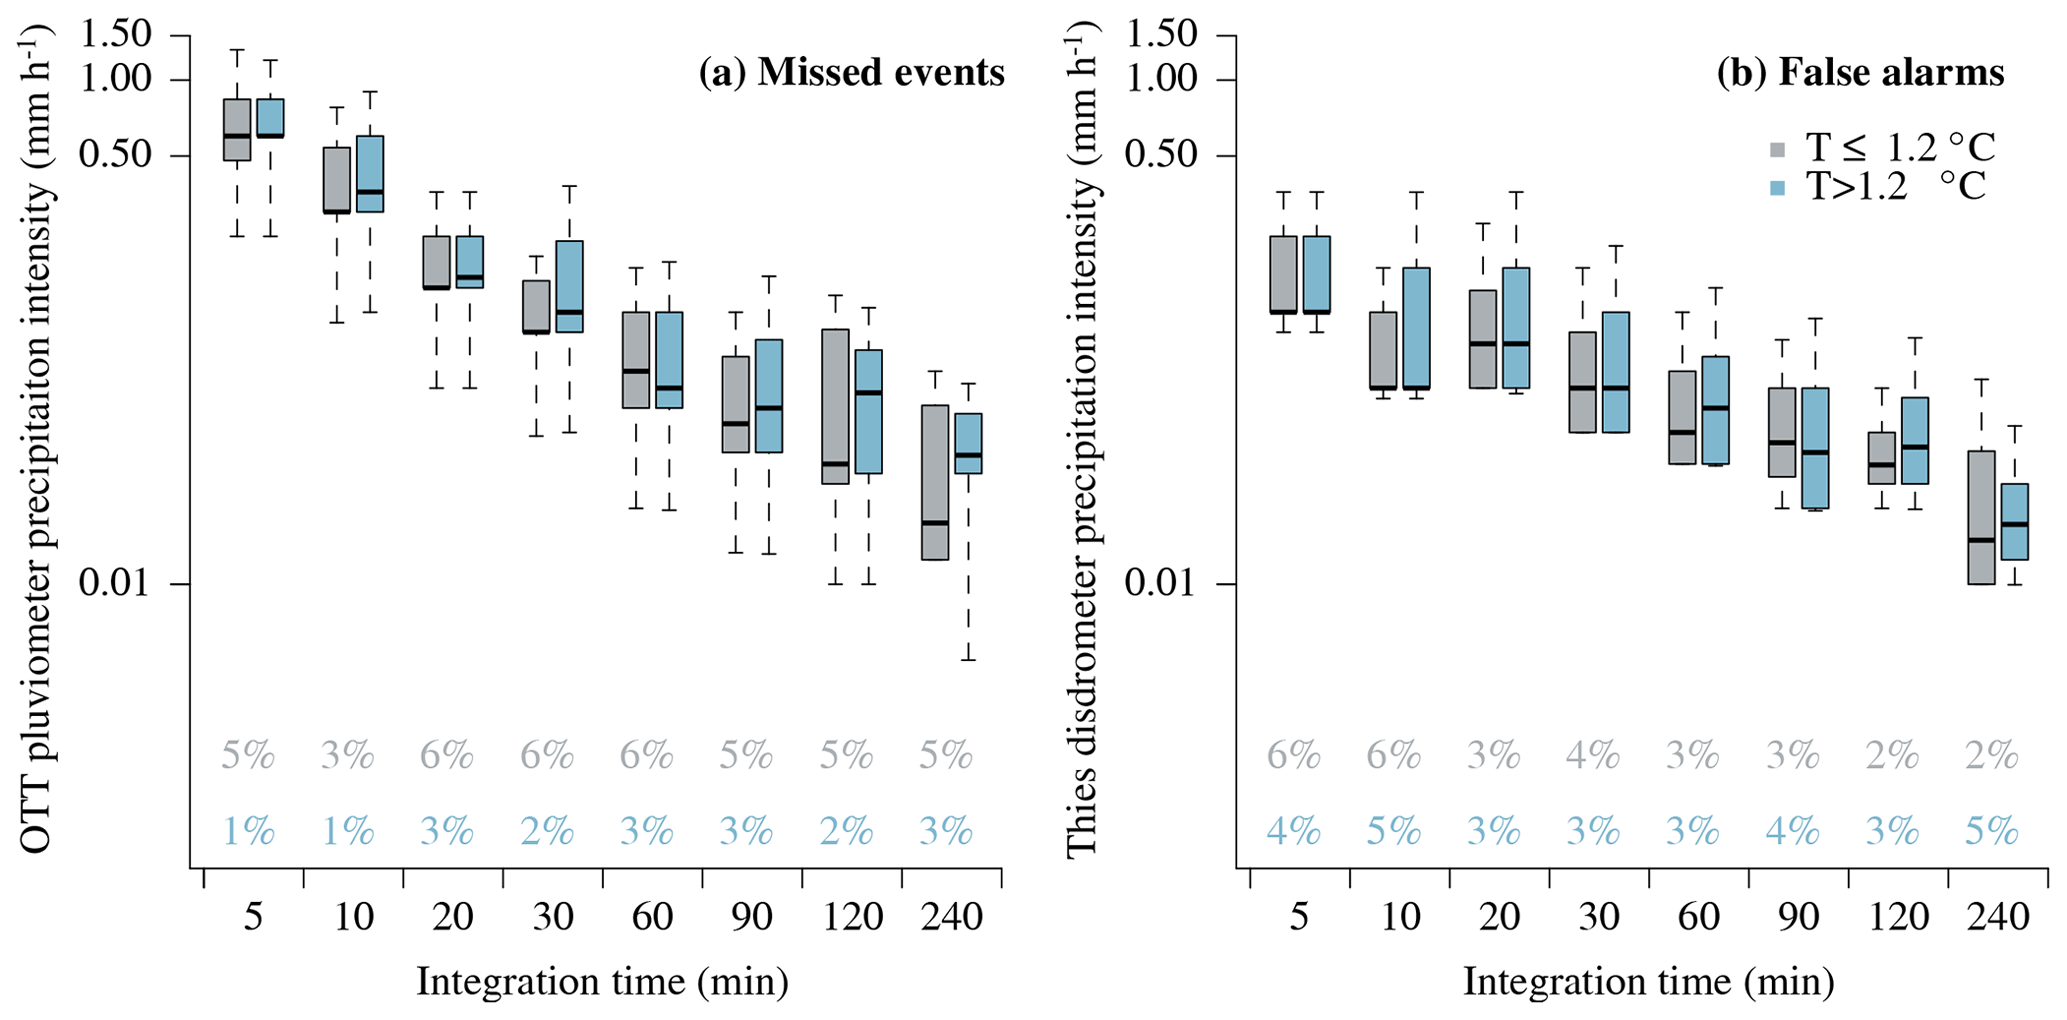
Figure 5Distribution of precipitation intensities and phase during missed events (a) and false alarms (b) by the Thies disdrometer during the validation period (each box shows the median and interquartile range of the distribution, while the whiskers extend to 1.5 times this range from the box or to the most extreme data point). While precipitation intensities measured by the OTT pluviometer are analyzed during missed events, precipitation intensities indicated by the Thies disdrometer are analyzed during false alarms. Events are separated according to a temperature threshold (1.2 ∘C), and the relative frequency of missed events, as well as the false alarm rate, is given at the bottom of each panel for cases above and below this temperature threshold. Note that a logarithmic scale is used to display precipitation intensities.
The effect of applying the proposed thresholds on hit and false alarm rates during the second year of measurements is depicted in Fig. 4b and Table 2. The application of such thresholds is particularly beneficial for integration times exceeding 20 min, as they allow us to effectively reduce false alarm rates by up to 8.9 % (for periods of 4 h). For integration times shorter than 20 min, the application of a minimum precipitation threshold only has a negligible effect. Furthermore, by applying the proposed thresholds, a balanced solution with respect to hit rates and false alarm rates can be found for all the integration times considered, resulting in a relatively similar distance to the theoretical optimum in the ROC diagram.
Finally, by applying the proposed minimum precipitation thresholds in Table 2, we analyze missed events as well as false alarms produced by the Thies disdrometer in the validation period in more detail, i.e., with respect to precipitation intensity and phase. Whereas precipitation intensities measured by the OTT pluviometer were of interest during missed events, precipitation intensities indicated by the Thies disdrometer were analyzed during false alarms. To investigate whether the phase of precipitation could be relevant for missed events or false alarms, observations were separated according to a temperature threshold of 1.2 ∘C (Fehlmann et al., 2018). The resulting distributions of precipitation intensities and phase during missed events and false alarms are shown in Fig. 5. Precipitation intensities during missed events decrease with increasing integration time, mean intensities being around 0.6 mm h−1 during periods of 5 min and decreasing to around 0.03 mm h−1 during periods of 4 h. While precipitation intensities during missed events are very similar above and below the temperature threshold of 1.2 ∘C, the relative frequency of missed events seems to be slightly higher below this temperature threshold. Precipitation intensities indicated by the Thies disdrometer during false alarms are very low, ranging from 0.12 mm h−1 for 5 min periods to 0.02 mm h−1 for 4 h periods, with no remarkable differences above and below the temperature threshold of 1.2 ∘C.
3.2 Precipitation intensities
The capability of the Thies disdrometer to measure precipitation intensities is assessed with the OTT pluviometer as a reference for precipitation intensities as well as with the 2DVD as a reference for the PSD. After exploring error patterns in the entire time series, the first year of measurements was used to establish corresponding correction methods. The application of the established correction methods was then evaluated with independent data from the second year of measurements.
Figure 6 depicts the cumulative precipitation sums of the Thies disdrometer over the full investigation period as compared to the OTT pluviometer. Precipitation sums for both instruments are separated into rain and snow according to 1 min precipitation type estimates of the Thies disdrometer. As rain and snowfall events represent 89.5 % of the total precipitation sum, we restrict analysis to these two precipitation types in the following. Total precipitation after 2 years of measurements is underestimated by 12.4 % by the Thies disdrometer. This systematic underestimation is almost entirely related to rainfall events, during which the total precipitation sum is underestimated by even 16.5 %. The underestimation during snowfall events is much smaller (4.0 %) and seems to be less systematic but instead related to individual events during the second year of measurements.

Figure 6Cumulative precipitation sums as measured by the Thies disdrometer (dashed lines) and the OTT pluviometer (solid lines) during the whole time series (2 years). Precipitation sums are separated into rain and snow based on the recorded dominant precipitation type by the Thies disdrometer (1 min).
As a first approach to improve precipitation intensity estimates by the Thies disdrometer, we tested a direct adjustment to the measurements of the OTT pluviometer. A comparison of precipitation intensities between these instruments during the full investigation period is shown in Fig. 7 for an integration time of 30 min; it confirms the error pattern described above: whereas a systematic underestimation of rainfall intensities is visible, almost no systematic error can be seen with respect to snowfall intensities. Furthermore, the systematic underestimation of precipitation intensities seems to be well captured by a constant factor (i.e., independent of integration time or precipitation intensity). We thus propose using the ratio of the OTT pluviometer to the Thies disdrometer precipitation sum as a correction factor and to distinguish between rain and snowfall. Using the first year of measurements, the resulting correction factors for rain and snowfall intensities are 1.20 and 0.96, respectively.
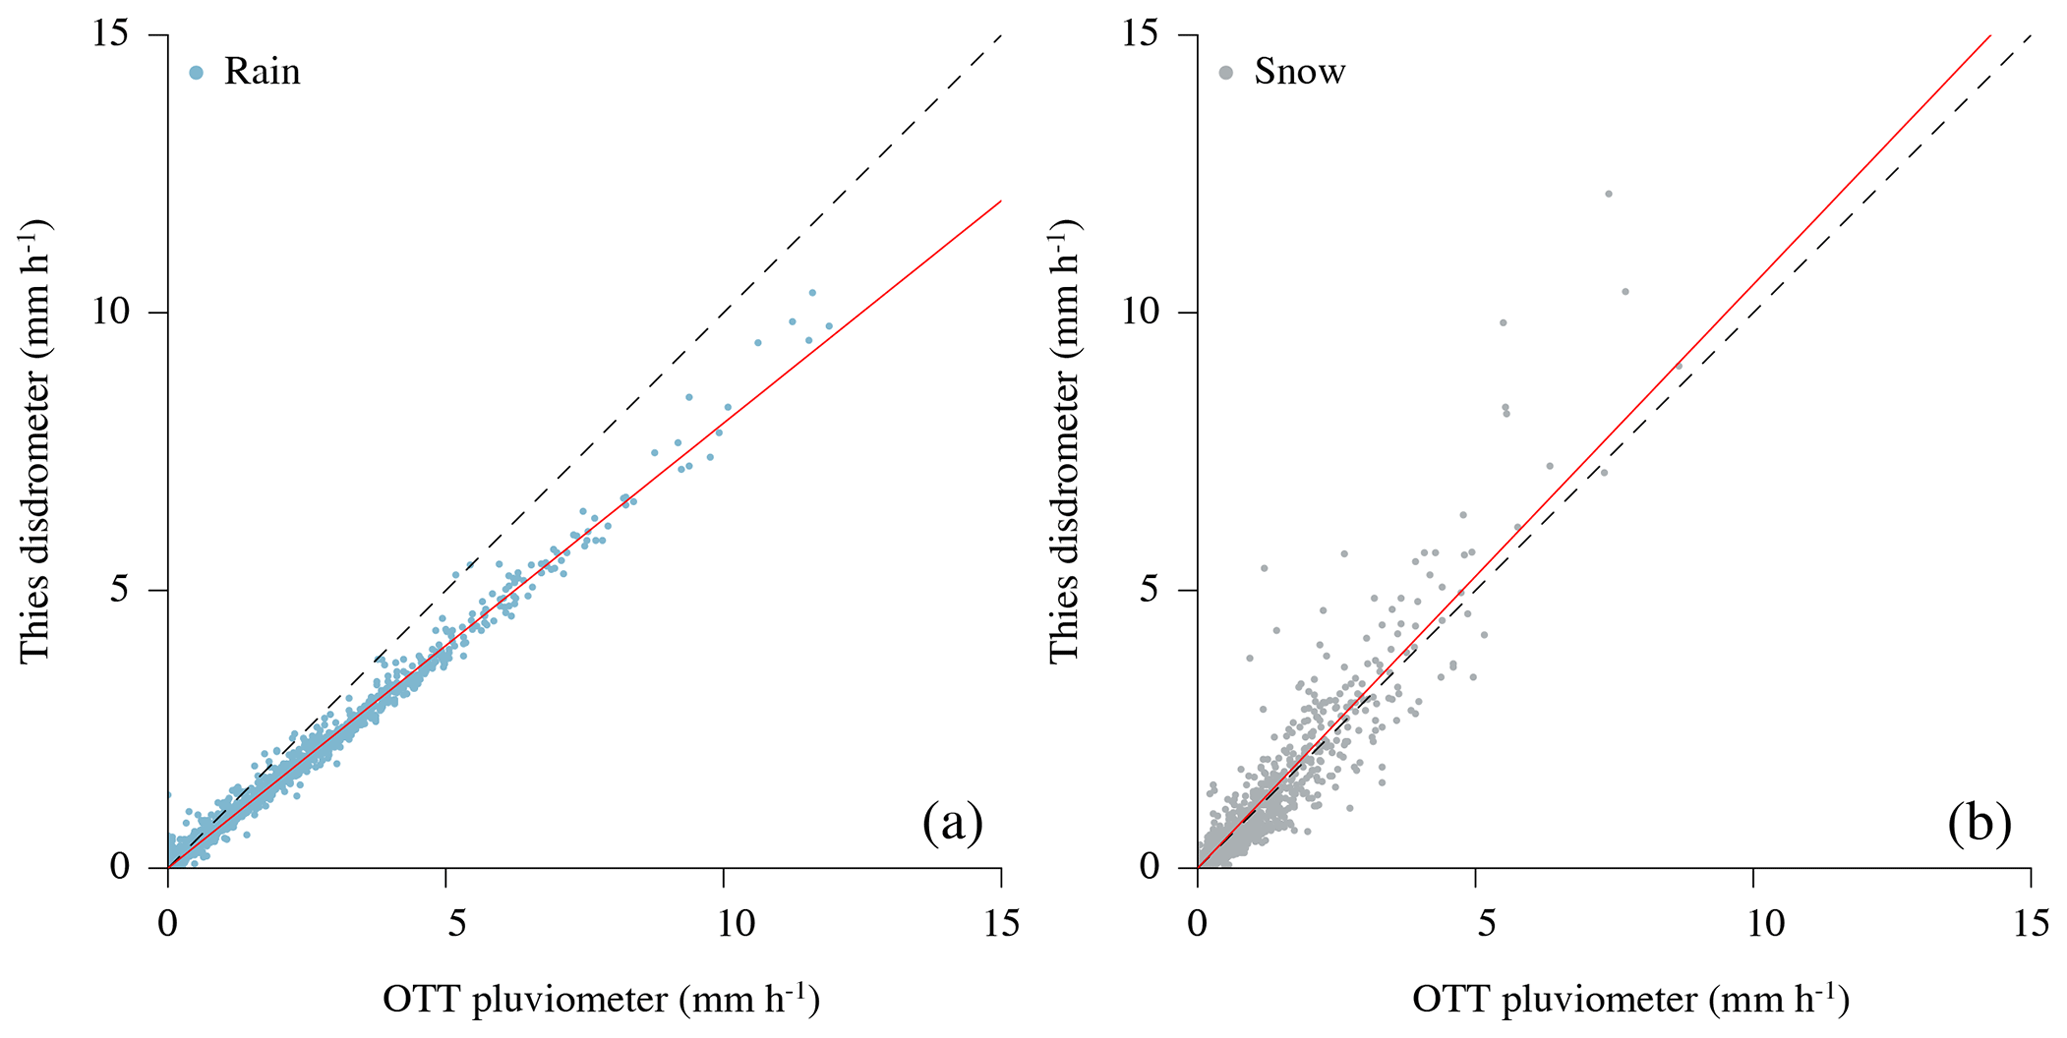
Figure 7Precipitation intensities during periods of 30 min as recorded by the Thies disdrometer and the OTT pluviometer during the whole time series (2 years). Precipitation is separated into rain (a) and snow (b) based on the recorded dominant precipitation type by the Thies disdrometer (1 min). To highlight systematic errors, a linear regression is shown in both panels (red line), which is forced through the origin and has a slope of 0.80 for rainfall intensities and of 1.05 for snowfall intensities.
As a second approach to improve precipitation intensity estimates using the Thies disdrometer, we tested an adjustment of the PSD to the measurements of the 2DVD. A comparison of the summed PSD between these two instruments is shown in Fig. 8 for all rain and snowfall events during the whole time series (2 years). The separation into rain and snowfall events is based on the recorded dominant precipitation type by the Thies disdrometer (1 min). Although the overall shape of the PSD is similar for both instruments, systematic deviations seem to exist during both rain and snowfall events. During rainfall events, the number of particles with diameters between 0.5 and 3.5 mm (class nos. 4–12) is systematically underestimated, whereas the number of smaller and larger particles is overestimated by the Thies disdrometer as compared to the 2DVD. When looking at the monthly variability of the resulting correction factors (Fig. 8, right), the overestimation seems to be less stable than the underestimation. During snowfall, the number of particles with diameters exceeding 0.75 mm is overestimated, whereas the number of smaller particles is underestimated as well. It is worth noting that the underestimation (class nos. 4–12 for rainfall and 5–22 for snowfall) will affect resulting estimates of precipitation intensity in particular. In the case of rainfall and assuming the mean PSD obtained by the Thies disdrometer, particles between 0.5 and 3.5 mm (class nos. 4–12) contribute to 90 % of the total rainfall volume. The smallest and largest particles are almost negligible for total volume due to their small volume (smallest particles) and number (largest particles), respectively. Nevertheless, we propose applying correction factors for the number of particles in each diameter class and further distinguishing between rainfall and snowfall. Using the first year of measurements, the resulting correction factors for rain and snowfall are listed in Table 3. Given the corrected PSD, rainfall intensity is calculated by assuming a density of 1 g cm−3. For snowfall, a relationship between particle diameter and density is established by comparing 1 min accumulated volumes (measured by the 2DVD) to the corresponding mass (measured by the OTT pluviometer) and is shown in Fig. 9.
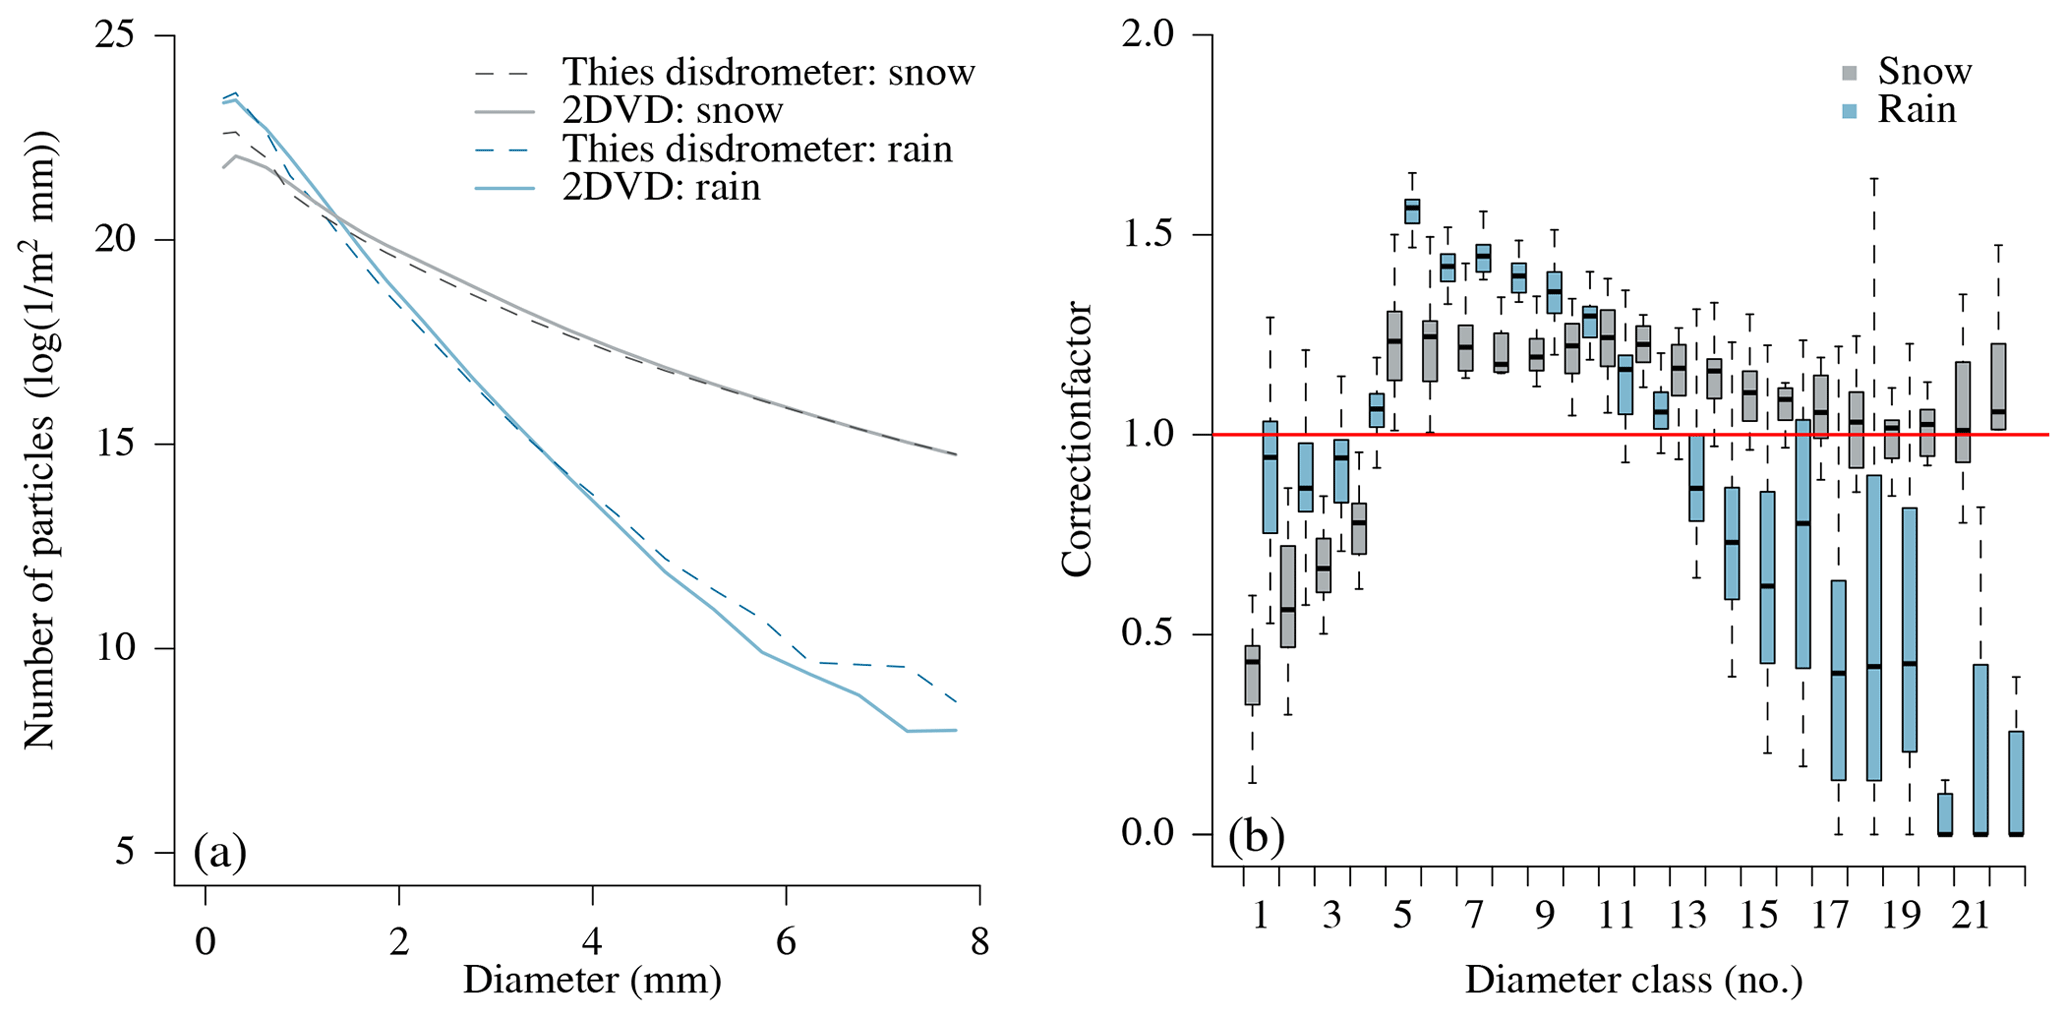
Figure 8Comparison of particle size distribution (PSD) obtained by the Thies disdrometer and the two-dimensional video disdrometer (2DVD) during the whole time series (2 years). (a) Summed PSD during all observed rain and snowfall events. The separation into rain and snowfall events is based on the recorded dominant precipitation type by the Thies disdrometer (1 min). (b) Resulting correction factors for different diameter classes of the Thies disdrometer, using the 2DVD as a reference. Thereby, the median and variability of these correction factors is shown using monthly results (each box shows the interquartile range of the distribution, while the whiskers extend to 1.5 times this range from the box or to the most extreme data point).
Table 3Correction factors for the number of particles in 22 diameter classes as measured by the Thies disdrometer, resulting from a comparison to the two-dimensional video disdrometer in the calibration period. Measurements are separated into rain and snow based on the recorded dominant precipitation type by the Thies disdrometer (1 min).
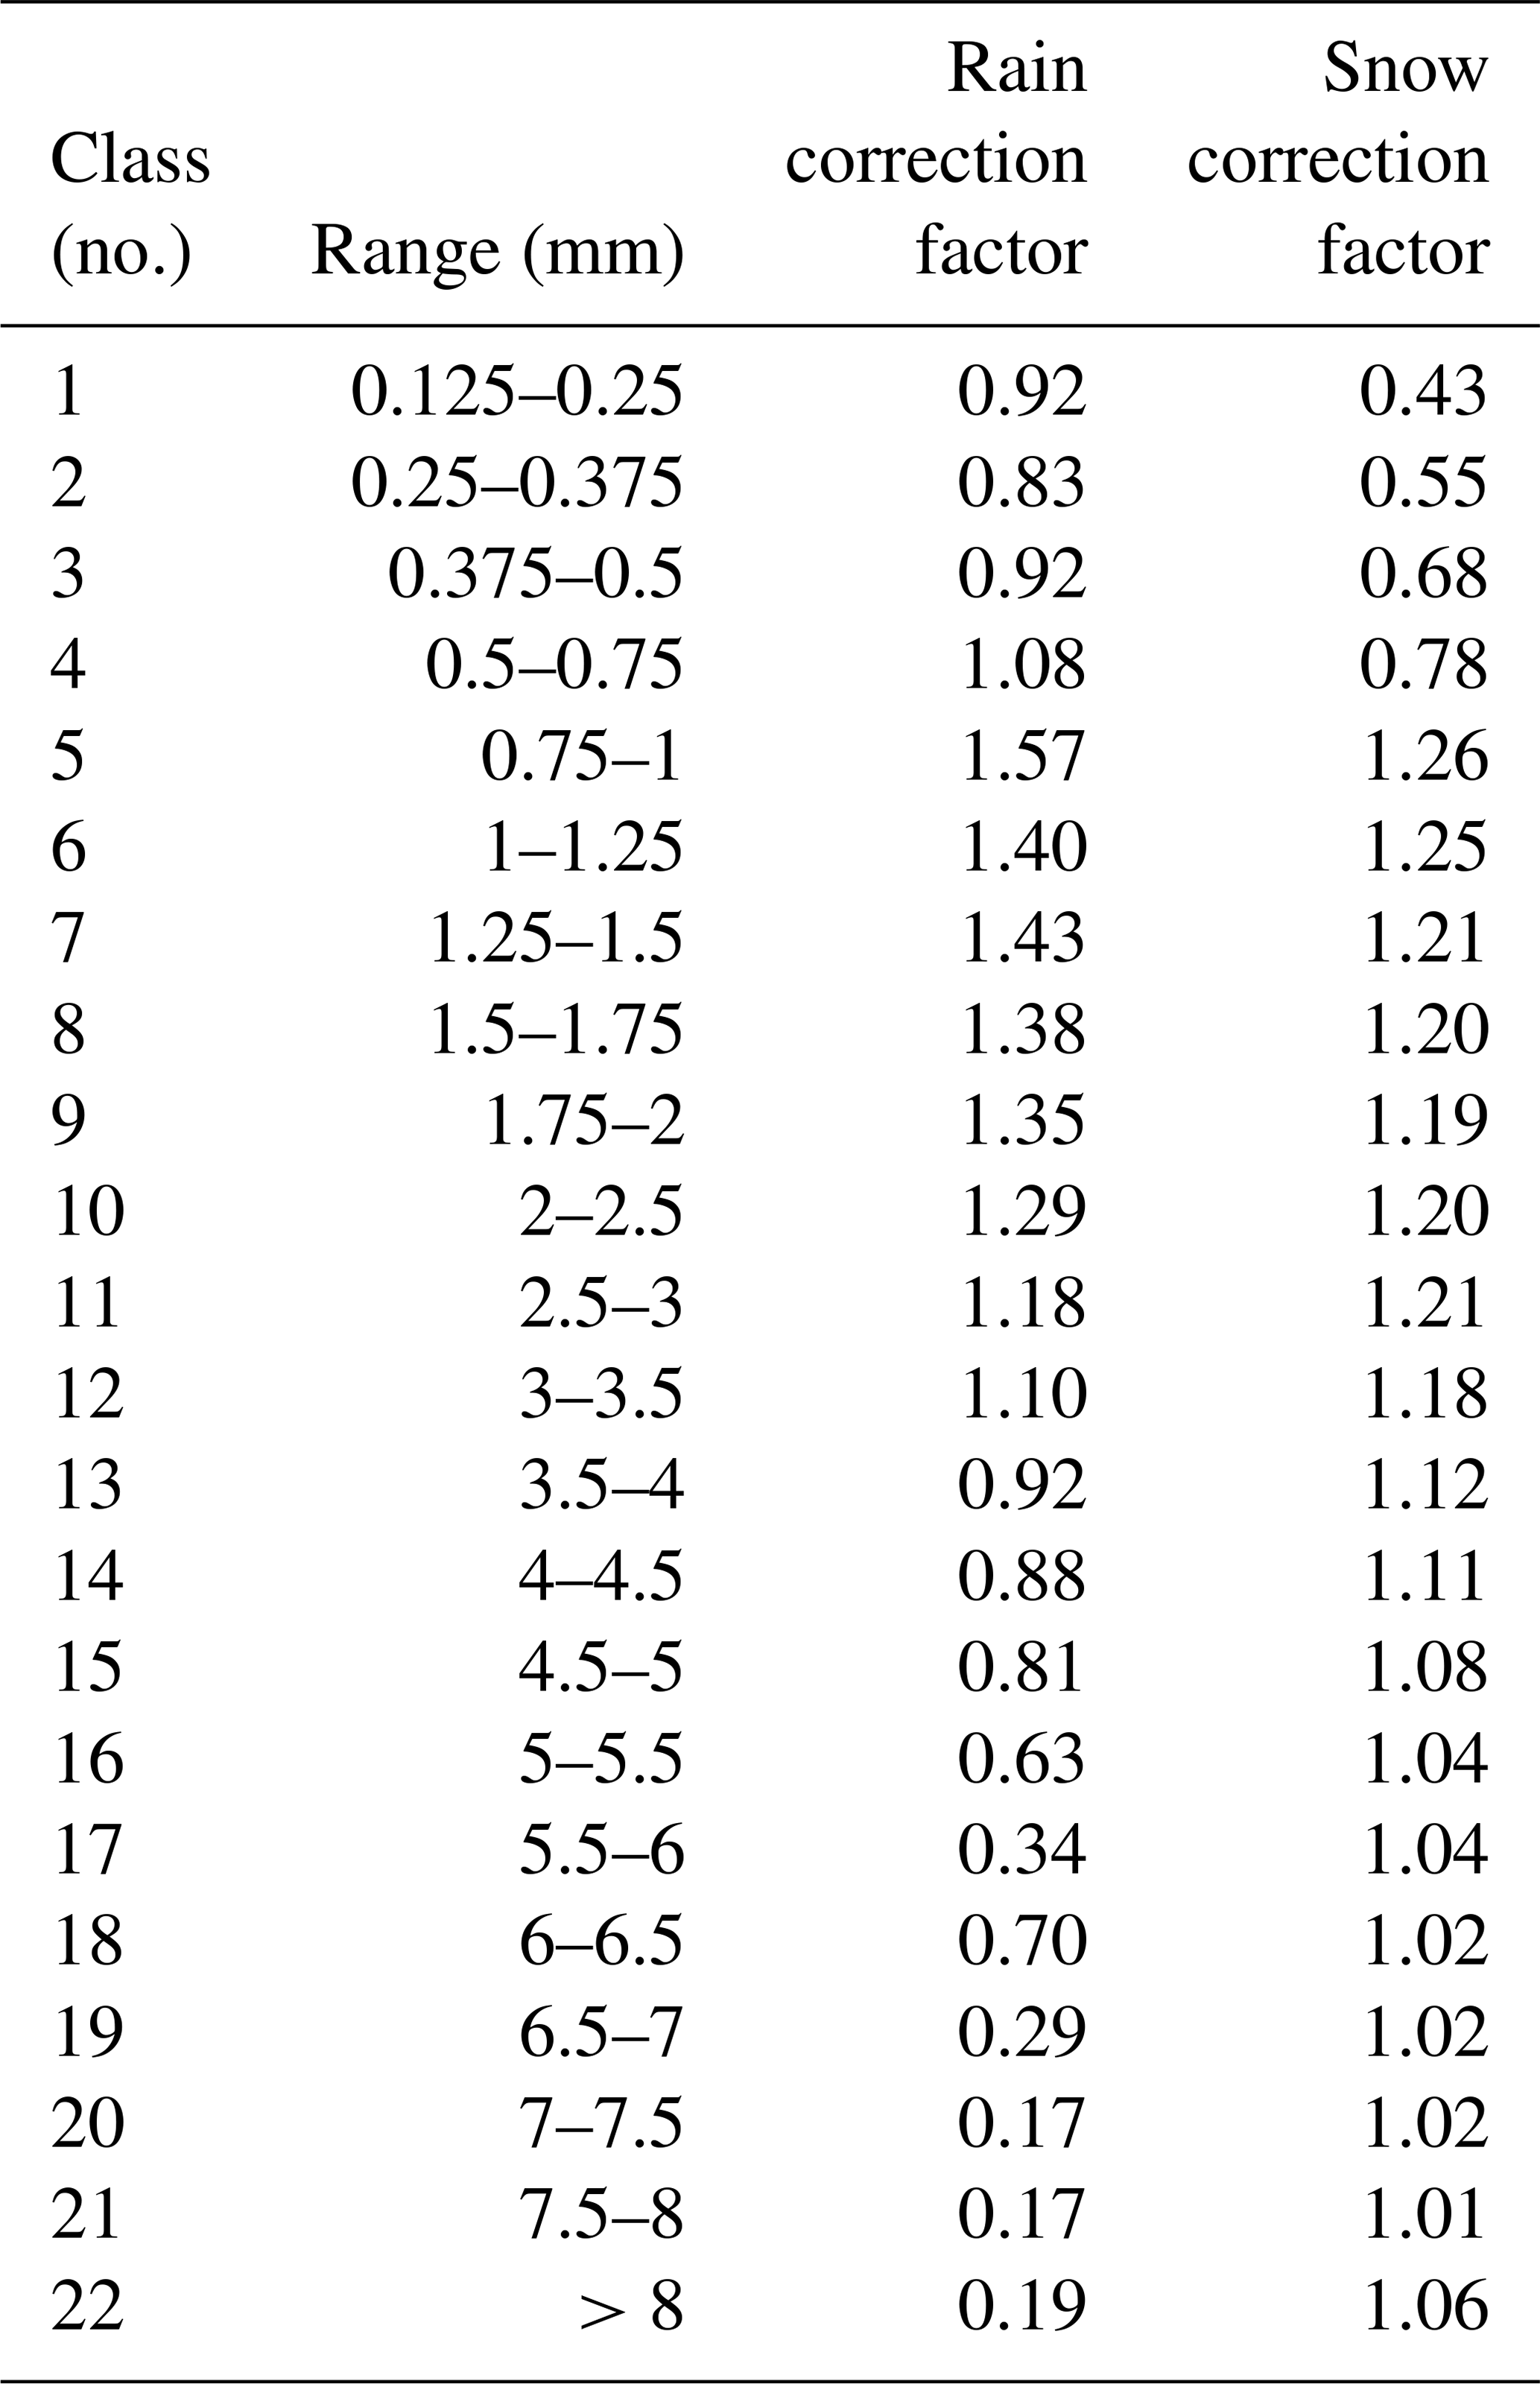
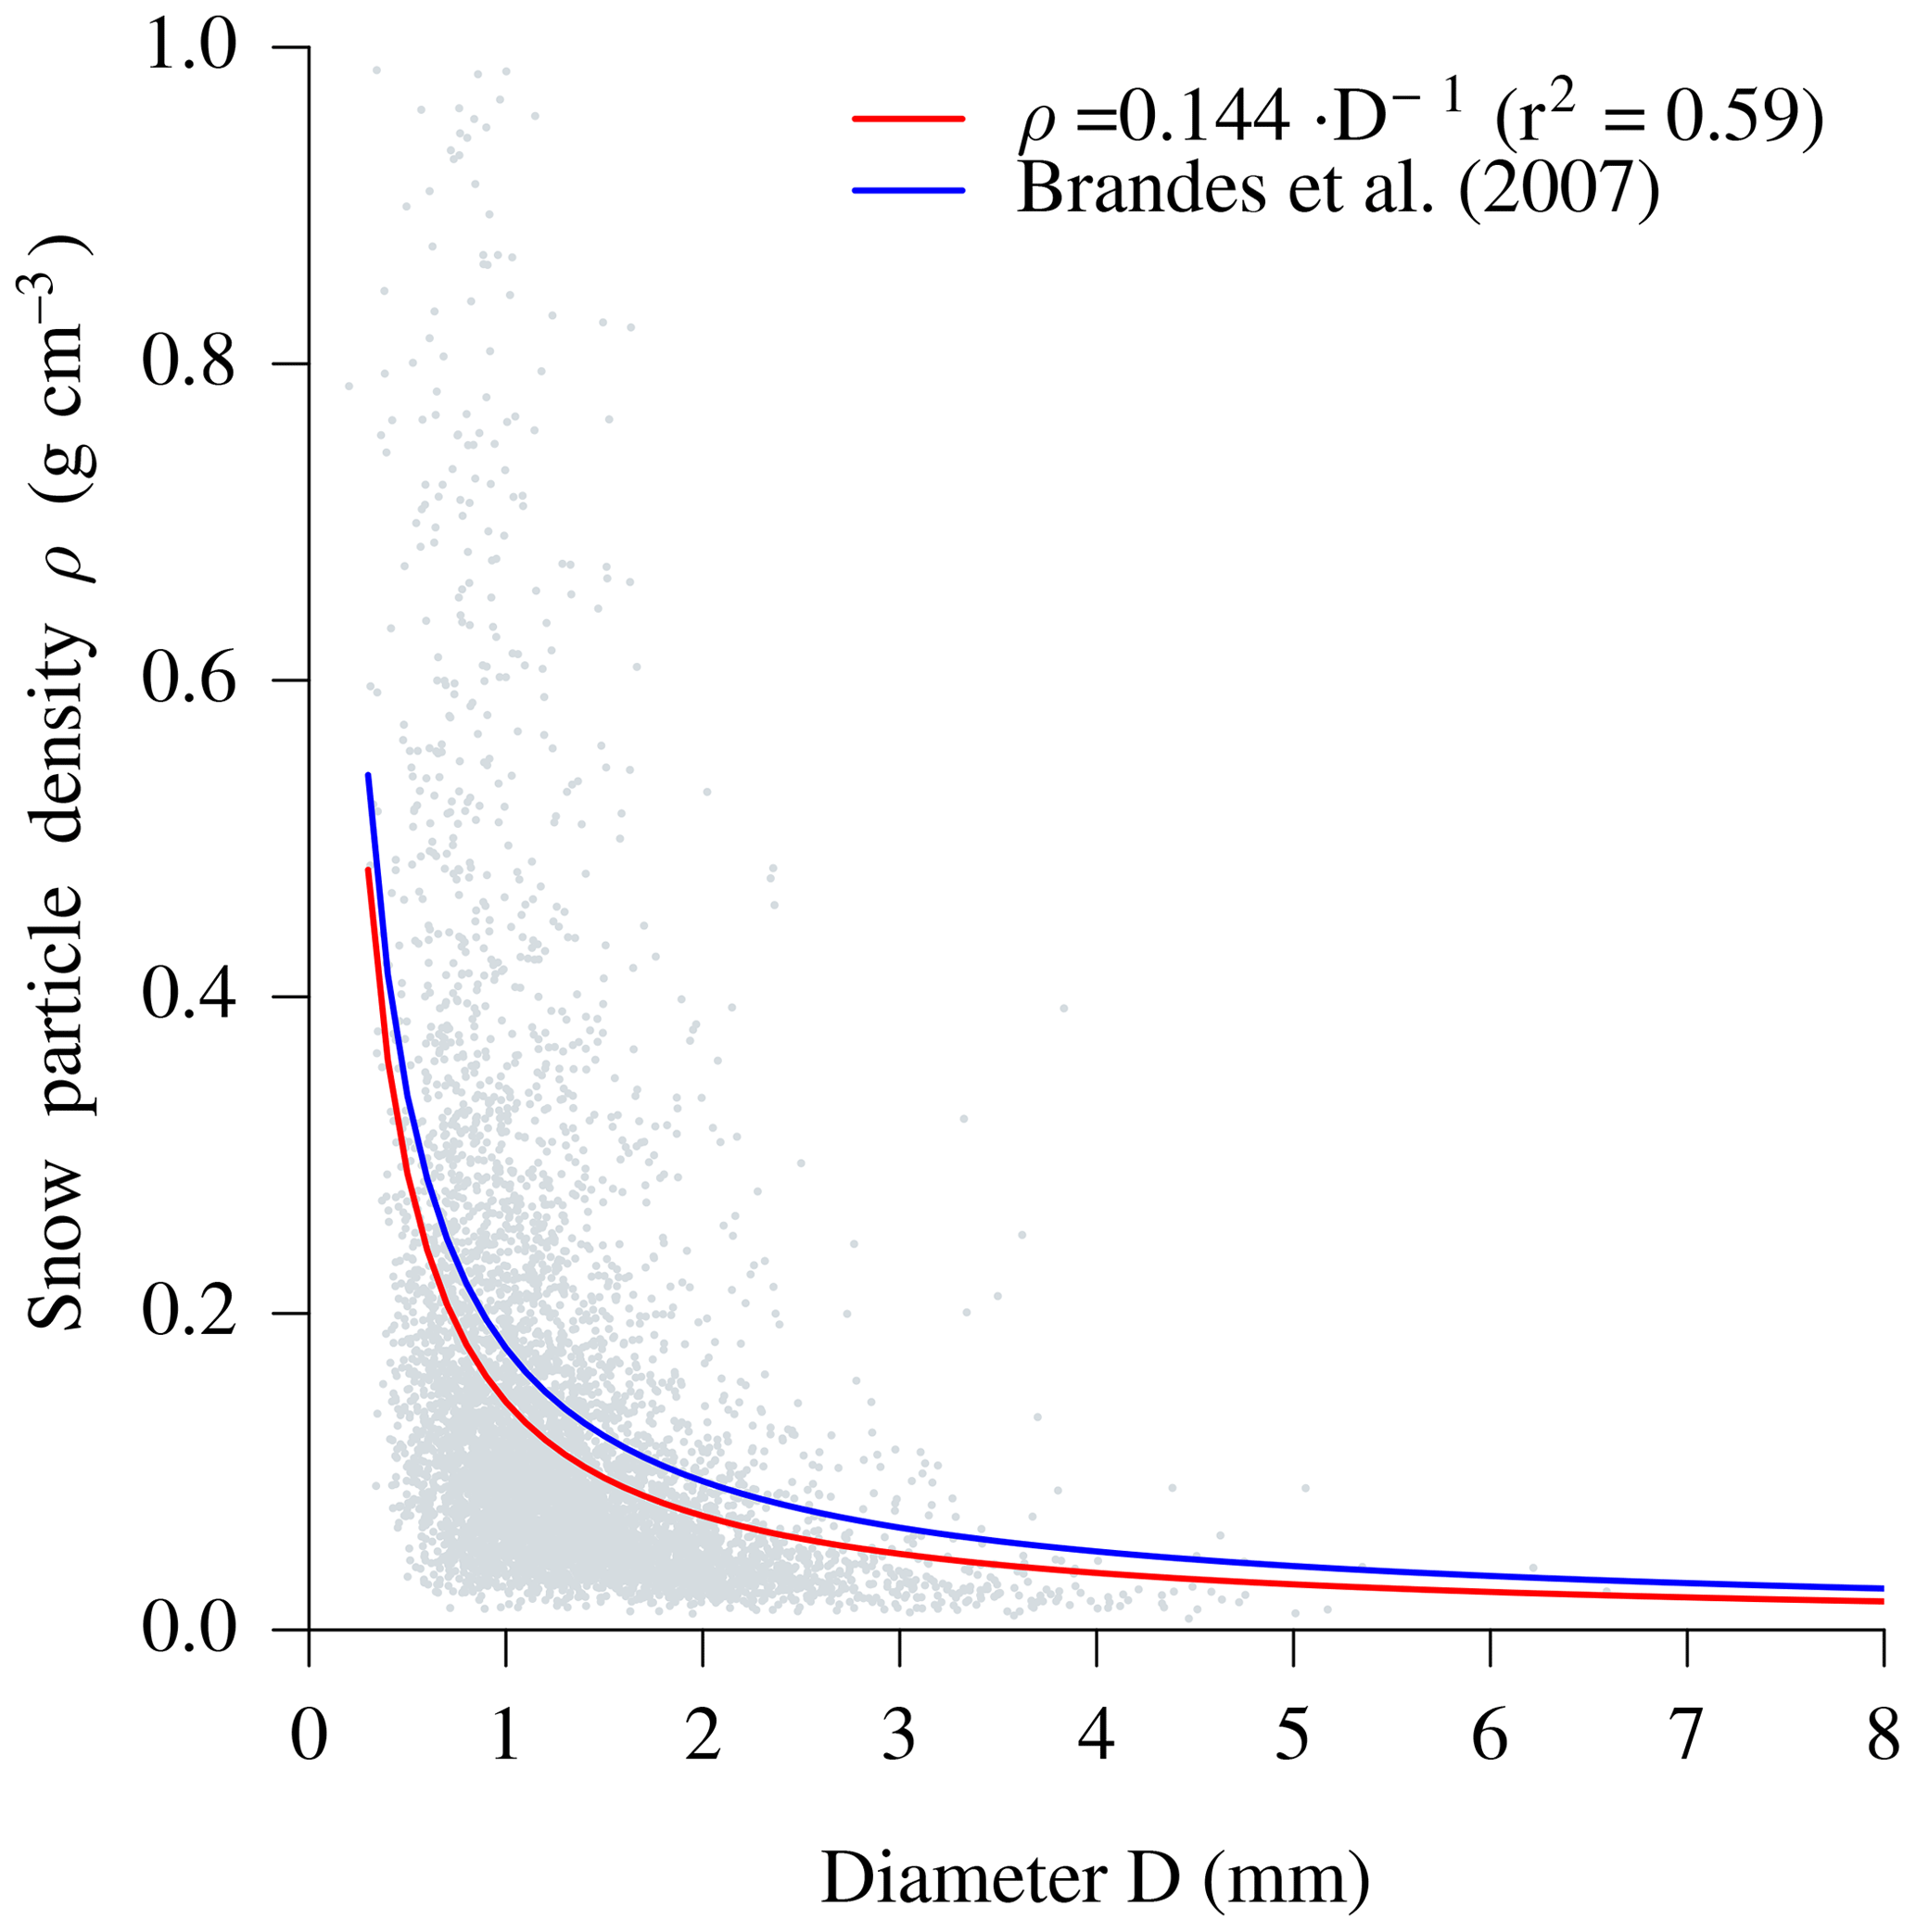
Figure 9Relationship between snow particle density and mean particle diameter based on 1 min observations during the first year of measurements. Snowfall events are identified based on the recorded dominant precipitation type by the Thies disdrometer. Snow particle density is then calculated by comparing the precipitation volume measured by the two-dimensional video disdrometer (2DVD) and precipitation mass measured by the OTT pluviometer and is related to mean particle diameter as measured by the 2DVD. The fitted curve is used to translate particle size distribution into snowfall intensities during the second year of measurements. Note that the corresponding relationship established by Brandes et al. (2007) is shown as a reference.
The effect of both correction methods proposed here was subsequently tested during the second year of measurements. The resulting biases of the Thies disdrometer before and after the correction are given in Table 4 for different integration times. These biases are thereby calculated for the whole dataset, as well as for all rain and snowfall separately. An example for the integration time of 30 min is further given in Fig. 10. As can be seen in Table 4 and Fig. 10, the most robust result is achieved by the adjustment of rainfall intensities to the OTT pluviometer, which successfully reduces the underestimation of liquid precipitation in the validation period. The adjustment of rainfall intensities to the 2DVD, however, results in a positive bias in the validation period. For snowfall, both correction methods have a smaller impact and even result in slightly higher negative biases than are present without any adjustment.
Table 4Biases in precipitation intensity measurements of the Thies disdrometer during the second year of measurement using the OTT pluviometer as a reference. The absolute bias B (Eq. 6) of the uncorrected measurements is given for all events, as well as for rain and snowfall separately (left value). Furthermore, the effect of the two proposed correction methods is shown, i.e., the adjustment to the OTT pluviometer (middle value) and the two-dimensional video disdrometer (right value). The correction methods are thereby established during the first year of measurements.
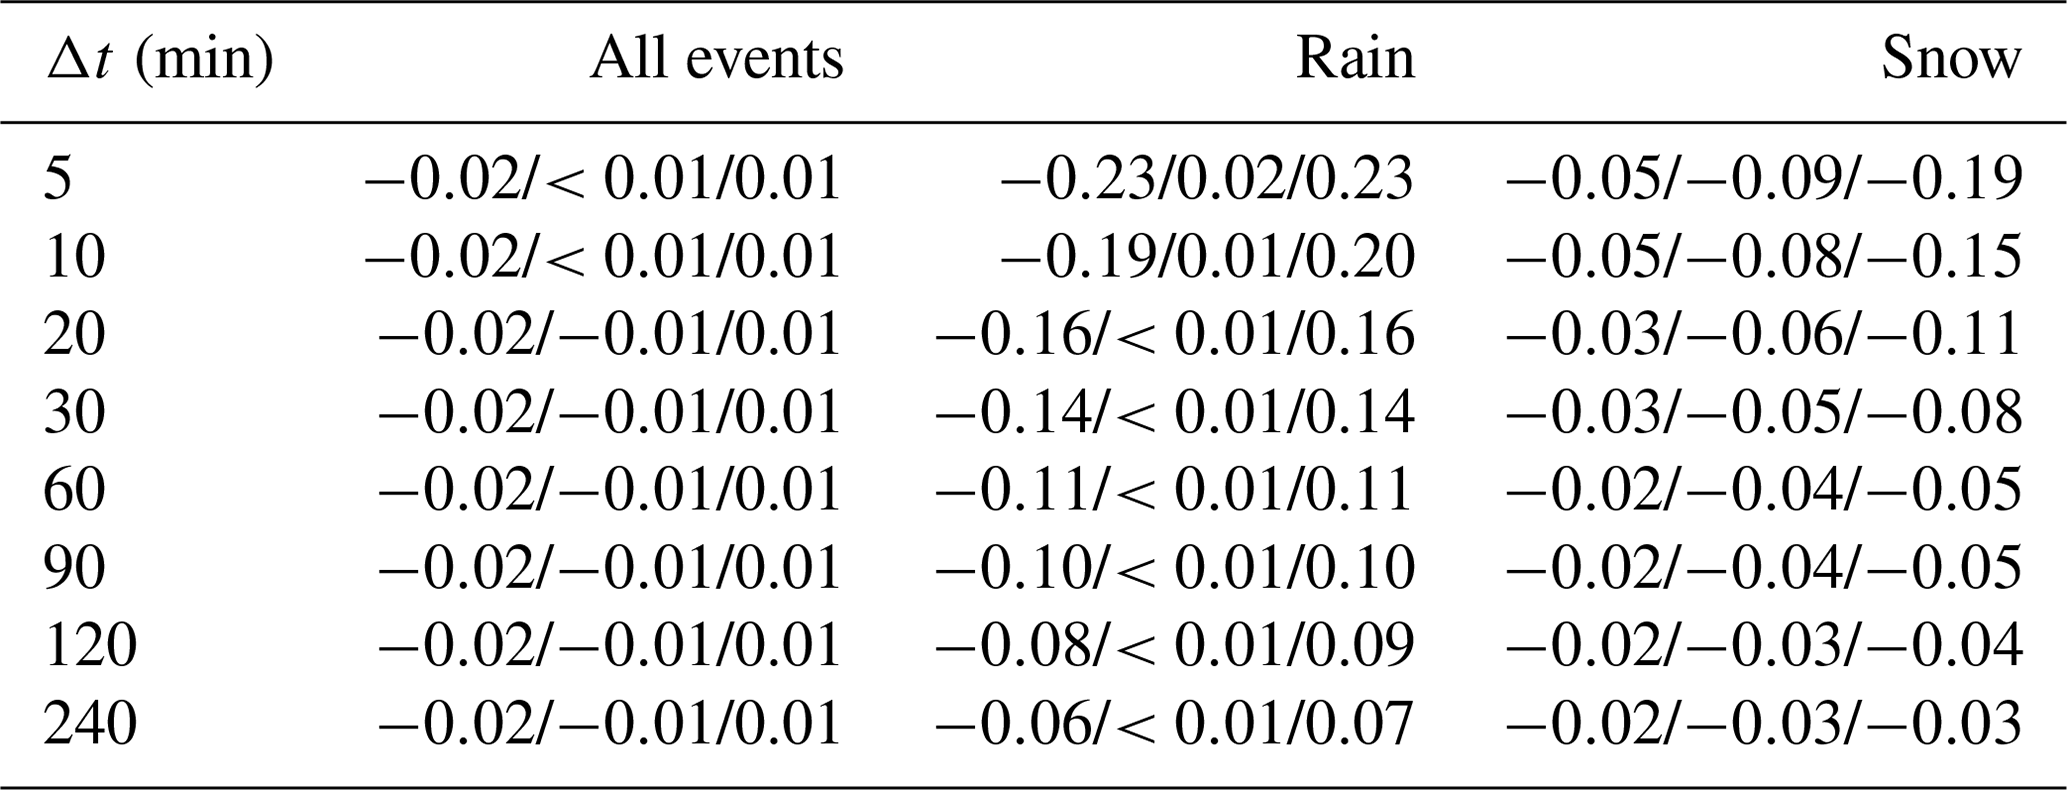

Figure 10Precipitation intensities during periods of 30 min as recorded by the Thies disdrometer and the OTT pluviometer during the second year of measurements. Precipitation is separated into rain, snow, and other types (e.g., mixed) based on the recorded dominant precipitation type by the Thies disdrometer (1 min observation). The effect of the two proposed correction methods, i.e., adjustment to the OTT pluviometer and the two-dimensional video disdrometer (2DVD), are shown in separate panels (B: bias; Corr: correlation coefficient). Note that these adjustments distinguish between rain and snowfall and were established in the first year of measurements.
3.3 Precipitation phase
The capability of the Thies disdrometer to detect the predominant precipitation type is assessed using the 2DVD as a reference. We thereby focus on the precipitation phase, i.e. the distinction of rain and snowfall, which has been shown above to be an important criterion for the proposed correction methods.
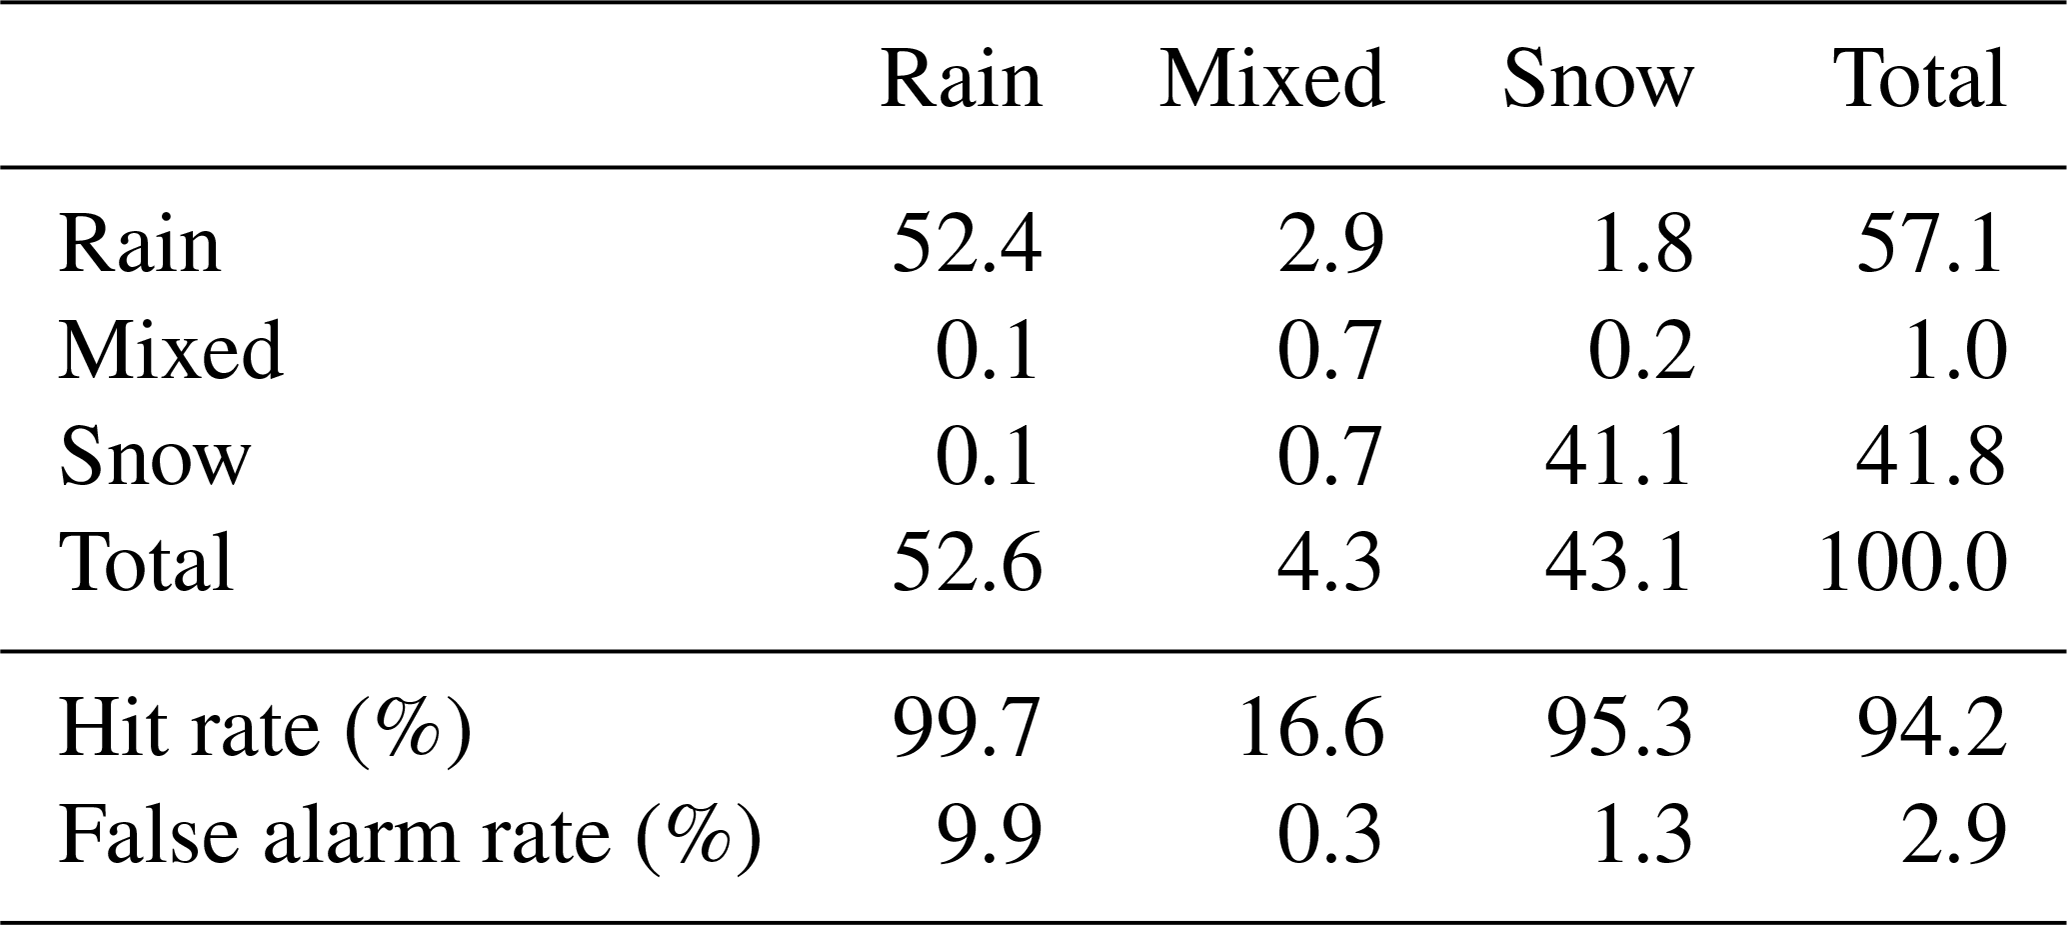
Table 5 shows the agreement of precipitation phase estimates between the Thies disdrometer and the 2DVD during the full time series, while Fig. 11 depicts the relative frequency of observations as a function of temperature for both instruments, including an indication of the mixing ratios obtained by the 2DVD. Thereby, the Thies disdrometer agrees well with the 2DVD insofar as the classification of rain and snow is concerned. By contrast, larger differences exist with respect to the classification of mixed precipitation. Regarding the detection of rain, the Thies disdrometer reaches an almost perfect hit rate (99.7 %). However, the overall frequency of rain is slightly overestimated by the Thies disdrometer, being reflected by a false alarm rate of 9.9 %. Regarding the detection of snow, the overall frequency of detected cases is almost equal for both instruments. The hit and false alarm rate of the Thies disdrometer with respect to the 2DVD is reaching 95.3 % and 1.3 %, respectively, reflecting a good agreement between the two instruments. Finally, the Thies disdrometer classifies far fewer cases as mixed precipitation (1 %) than the 2DVD (4.3 %), resulting in both a low hit and false alarm rate for these cases.
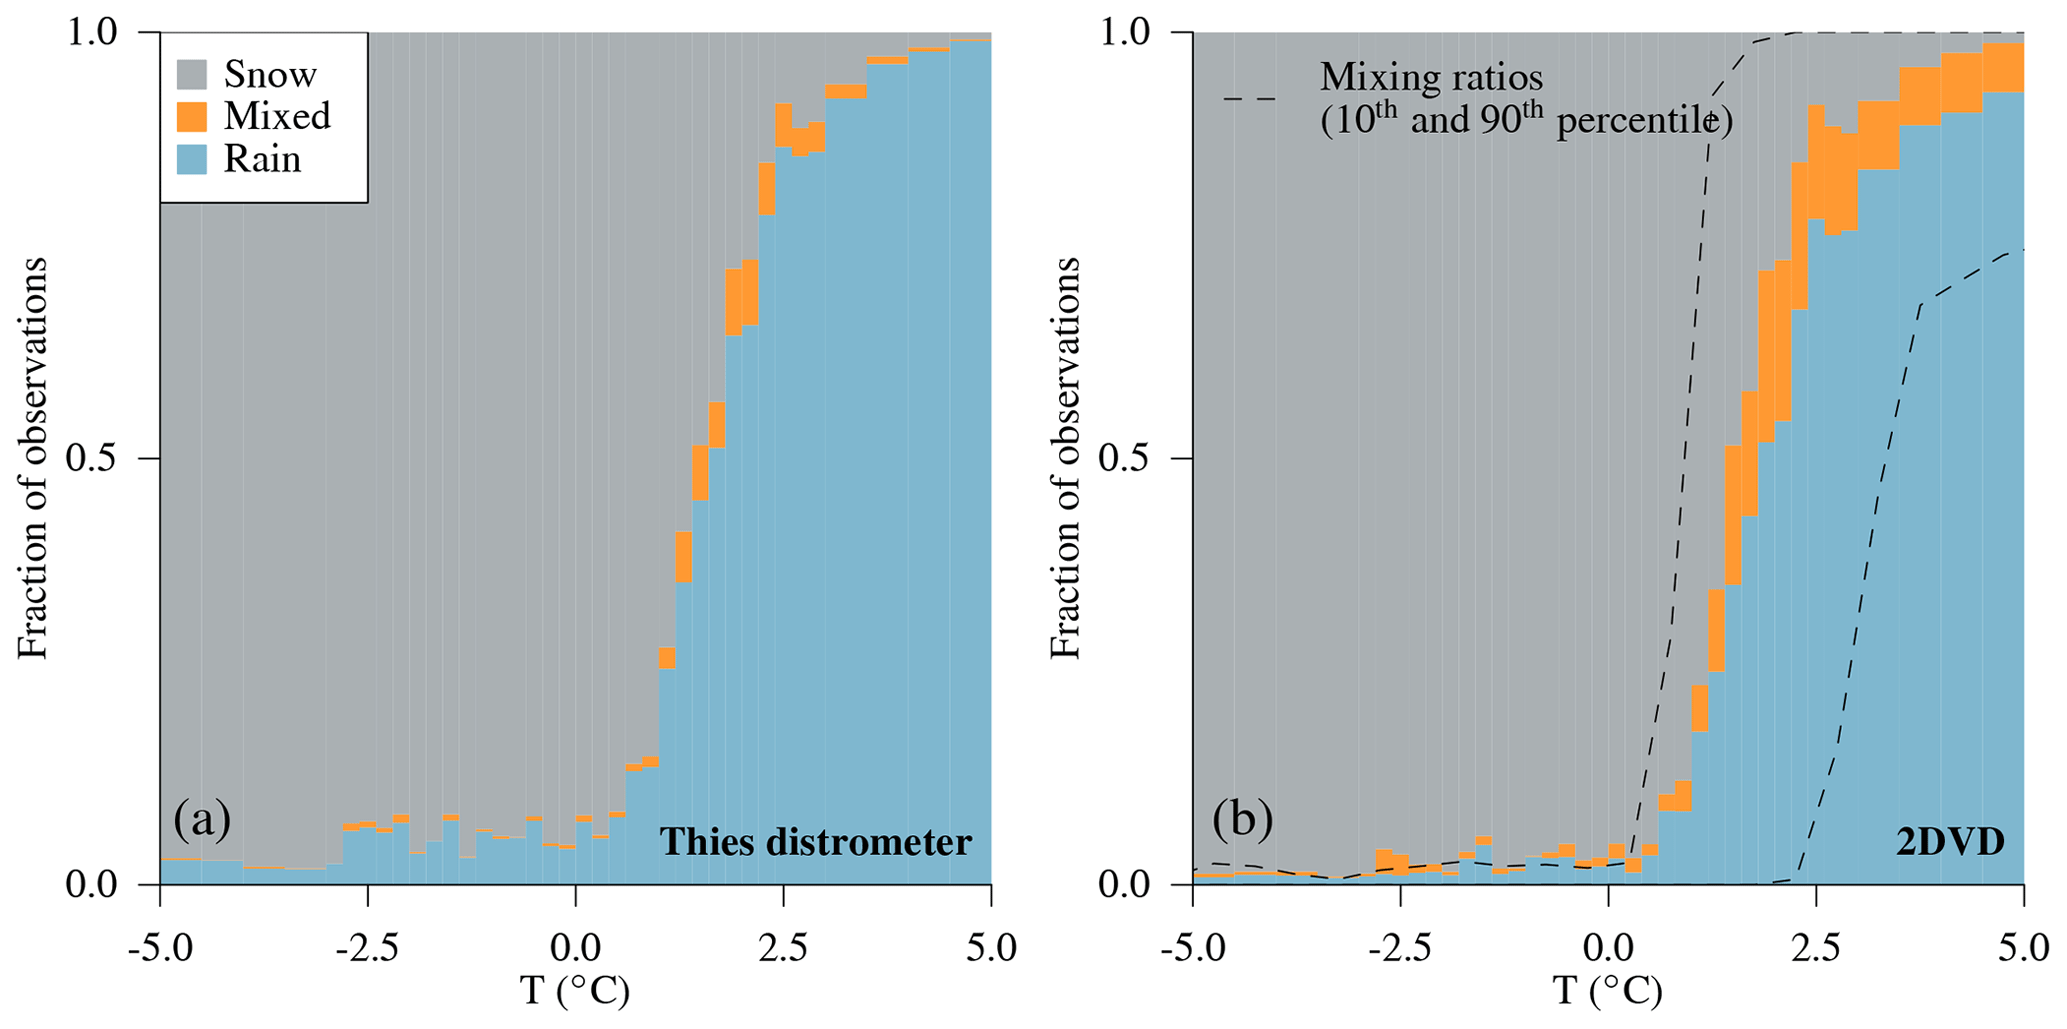
Figure 11Relative frequency of the observed dominant precipitation phase by the Thies disdrometer (a) and the two-dimensional video disdrometer (2DVD, b) as a function of air temperature during 2 years of measurements (2533 h of precipitation). For the 2DVD, the mixing ratio of liquid precipitation obtained at different temperatures is indicated by the 10th and 90th percentile of its distribution (dashed lines).
Most misclassifications are related to cases during which the Thies disdrometer indicates rain, whereas the 2DVD indicates mixed precipitation or snow. As can be seen in Fig. 11, such cases occur at both temperatures above and well below 0 ∘C. Thereby, the Thies disdrometer seems to overestimate cases of rain below 0 ∘C and to underestimate cases of snowfall or mixed precipitation above 0 ∘C as compared to the 2DVD. At least during distinct misclassifications, i.e., in cases where the Thies disdrometer indicated rain while the 2DVD indicating snow, it can be shown that precipitation intensities are very small, i.e., their mean being 0.19 mm h−1 (while being 0.93 mm h−1 for all cases).
In this study, we have shown that the Thies disdrometer is well suited for precipitation detection, reaching hit rates of around 95 % with respect to the OTT pluviometer. The false alarm rate, which indicates the probability of the Thies disdrometer detecting precipitation during a dry period, is increasing with increasing integration time. This can be somewhat expected, as the chance of misinterpreting a signal or disturbance as precipitation is increasing with the increasing duration of this period. Furthermore, false alarm rates might be affected by the sensitivity of the reference instrument but are comparable to findings of Bloemink and Lanzinger (2005), who use human observations as a reference.
Table 5Comparison of the precipitation phase detected by the Thies disdrometer (rows) and the two-dimensional video disdrometer (columns). The numbers are given as percentages of the total number of 1 min observations during 2 years of measurements, which are equal to 2533 h of precipitation.
We have further demonstrated that the Thies disdrometer systematically underestimated rainfall intensities at the study site by 16.5 % during 2 years of measurements, which we explain as being related to an underestimation of drop concentrations for drop diameters ranging between 0.5 and 3.5 mm. At the same time, larger and smaller drops are overestimated by the instrument; this is, however, less relevant for the resulting estimates of rainfall intensities. Other studies have reported similar patterns in terms of bias in the PSD and while analyzing other disdrometers, such as the Joss–Waldvogel (Leinonen et al., 2012) or the OTT Parsivel disdrometers (Raupach and Berne, 2015). However, the deviations in the PSD and implications for rainfall intensity estimates can be different between different types of instruments. For example, the OTT Parsivel1 disdrometer only underestimates drops with sizes ranging between 0.8 and 1.6 mm and only during periods of higher rainfall intensity. In addition, the device tends to even overestimate rainfall intensities (Raupach and Berne, 2015). Interestingly, an overestimation of rainfall intensities is also reported for the Thies disdrometer at the intercomparison site Wasserkuppe in Germany (Lanzinger et al., 2006). Supposedly, this contrary result to our study is due to differences in wind exposure. While our study site in Innereriz is extremely wind-sheltered (average wind speeds being 0.46 m s−1 during the investigation period), the site at Wasserkuppe is strongly exposed to wind, average wind speeds being 6.4 m s−1 from 1999–2018 (data obtained by the German weather service, DWD). Finally, when compared the OTT Parsivels, Guyot et al. (2019) found that the Thies disdrometer starts to underestimate the number of droplets from 0.75 mm up towards larger diameters when compared to Parsivel1 and also underestimates liquid precipitation compared to both Parsivel1 and Parsivel2. To reduce the underestimation of rainfall intensities by the Thies disdrometer found at our study site, we established an adjustment to 2DVD measurements following the methodology of Raupach and Berne (2015). However, when applying the resulting adjustment in the validation period, we introduce a positive bias, which could indicate a slight overestimation of liquid precipitation by the 2DVD when compared to the OTT pluviometer. A more stable correction is achieved by applying a linear adjustment to the OTT pluviometer. This method is thus proposed as the preferred correction method in this study, especially when the PSD itself is not of interest to the user. It should be noted further that the overestimation of smaller drops by laser disdrometers with respect to the 2DVD is also found in other studies (Krajewski et al., 2006; Raupach and Berne, 2015), but can at least partly be related to unreliable estimates by the 2DVD for small drops (Tokay et al., 2013). As rainfall intensity or radar reflectivity are not strongly affected by the concentrations of small drops, no further adjustment of the PSD is considered in this study. For the reconstruction of the drizzle mode of the PSD, Raupach et al. (2019) present a method that is able to correct for this deficiency and further improve rainfall intensity estimates for light rain.
Regarding the measurement of snow, we show that the number of particles with diameters exceeding 0.75 mm is slightly underestimated by the Thies disdrometer. However, this bias is not reflected in intensity estimates. Although not systematically biased, a more detailed analysis of the correlation coefficient (not shown here) revealed that uncertainty in snowfall intensity estimates is higher than for rainfall. This is most likely related to some of the underlying assumptions (e.g., about particle orientation, shape, or density) being less appropriate for solid than liquid precipitation (Yuter et al., 2006; Battaglia et al., 2010). Regarding snow density, we propose a simple parametrization of particle density as a function of particle diameter, which is similar to other studies (e.g., Fabry and Szyrmer, 1999; Brandes et al., 2007) and found here to substantially improve intensity estimates as compared to a constant density assumption. By applying the proposed adjustment of the PSD and this snow density parametrization to Thies disdrometer measurements, correlation of the resulting snow intensity estimates with respect to the OTT pluviometer can be slightly improved. Given the still high uncertainties in the snow density parameterization (apparent in Fig. 9), we further tested the inclusion of information about particle velocity and temperature but could not thereby improve resulting intensity estimates. The analysis of the correlation coefficient for snowfall intensities further revealed that correlations generally increase with increasing integration time (particularly up to 20 min). This indicates that at least some uncertainties in estimates of snowfall intensities, including small time shifts between observations, are averaged out over longer integration times.
The distinction between rainfall and snowfall is not only an important prerequisite for the proposed correction methods, but also relevant with respect to hydrological applications in alpine or pre-alpine areas. In this study, we show that the Thies disdrometer is well suited for a distinction of rainfall from snowfall (hit rates reaching 99.7 % for rainfall and 95 % for snowfall using the 2DVD as a reference). Larger differences between the two disdrometers exist for mixed precipitation, particularly for small precipitation intensities. As such, our results are in line with other studies in which precipitation-phase estimates from disdrometers (including the Thies disdrometer) have been compared to human observations (Bloemink and Lanzinger, 2005; Merenti-Välimäki et al., 2001). In particular the underestimation of mixed-phase precipitation by the Thies disdrometer is consistent with results of Bloemink and Lanzinger (2005). At the same time, a recently reported case study suggests that the instrument is able to accurately signal mixed precipitation during changes between snow and rain (Pickering et al., 2019). In this context, we would like to point out that the agreement of the dominant precipitation type during mixed precipitation with any reference observation will depend on the range of mixing ratios implicitly or explicitly considered as mixed precipitation. Our analysis indicates that the distinction between liquid and mixed precipitation is particularly sensitive to the choice of such a threshold. Furthermore, the application of the proposed classification algorithm to both disdrometers indicates that a reasonable choice for these thresholds might differ between different instruments. In addition to the validation of dominant precipitation type estimates, the particle-by-particle classification algorithm presented in this study can provide a basis for the validation of explicitly characterized hydrometeor mixtures, as is the case, for example, in polarimetric radar observations (e.g., Besic et al., 2018) or atmospheric models (e.g., Forbes et al., 2014).
The Thies disdrometer has the advantage of low maintenance requirements and allows the estimation of not only precipitation intensity but also precipitation type. The reliable distinction between rainfall and snowfall is considered here as an advantage for hydrological applications in mountainous environments, where local estimates of precipitation phase are still uncertain. We therefore see potential in installing disdrometers at sensitive elevations in mountainous catchments complementary to precipitation gauge and weather radar data to improve precipitation monitoring and short-term flood forecasting in these areas.
The 2DVD was particularly useful in this study to further investigate the biases of the Thies disdrometer, to establish a parametrization of snow density, and to provide a reference for the estimation of precipitation phase. Future studies may focus on a refinement of the proposed snow density parametrization and hydrometeor classification algorithm by taking other parameters such as particle orientation or shape (e.g., roundness, oblateness) into account.
In this study, we could not clarify how the relevant underestimation for liquid precipitation is dependent on wind or other influences. We suggest investigating this dependence in further studies.
The data used in this study, i.e., measurement outputs of the Thies disdrometer, the OTT pluviometer, the two-dimensional video disdrometer, and the LUFFT weather sensor (1 July 2017–30 June 2019), can be found in Fehlmann et al. (2020).
MF designed the framework of the study and evaluation strategy with help from all coauthors. MF processed the data obtained by the measurement devices (i.e., the Thies disdrometer, the two-dimensional video disdrometer, the OTT pluviometer, and the LUFFT weather sensor) and implemented the presented evaluation methods. MF, MR, AvL, and MS participated in writing and editing the manuscript, as well as investigating and interpreting the results.
The authors declare that they have no conflict of interest.
The authors acknowledge Geopraevent for technical support in the field. We would also like to thank Joanneum Research and Thies Clima for providing information about data processing algorithms of their instruments (i.e., the Thies disdrometer and the two-dimensional video disdrometer) and for the valuable discussion of the obtained results. Thanks also to Alexis Berne, the two anonymous reviewers, and to Adrien Guyot for their very constructive feedback during the peer review process of this article.
This research has been supported by the European Commission (ANYWHERE grant no. 700099), the Swiss Federal Office for the Environment, and the Canton of Bern, Switzerland.
This paper was edited by Alexis Berne and reviewed by two anonymous referees.
Adirosi, E., Roberto, N., Montopoli, M., Gorgucci, E., and Baldini, L.: Influence of disdrometer type on weather radar algorithms from measured DSD: Application to Italian climatology, Atmosphere, 9, 1–30, https://doi.org/10.3390/atmos9090360, 2018. a
Angulo-Martínez, M., Beguería, S., Latorre, B., and Fernández-Raga, M.: Comparison of precipitation measurements by OTT Parsivel2 and Thies LPM optical disdrometers, Hydrol. Earth Syst. Sci., 22, 2811–2837, https://doi.org/10.5194/hess-22-2811-2018, 2018. a, b, c
Battaglia, A., Rustemeier, E., Tokay, A., Blahak, U., and Simmer, C.: PARSIVEL snow observations: A Critical Assessment, J. Atmos. Ocean. Technol., 27, 333–344, https://doi.org/10.1175/2009JTECHA1332.1, 2010. a, b
Besic, N., Figueras i Ventura, J., Grazioli, J., Gabella, M., Germann, U., and Berne, A.: Hydrometeor classification through statistical clustering of polarimetric radar measurements: a semi-supervised approach, Atmos. Meas. Tech., 9, 4425–4445, https://doi.org/10.5194/amt-9-4425-2016, 2016. a
Besic, N., Gehring, J., Praz, C., Figueras i Ventura, J., Grazioli, J., Gabella, M., Germann, U., and Berne, A.: Unraveling hydrometeor mixtures in polarimetric radar measurements, Atmos. Meas. Tech., 11, 4847–4866, https://doi.org/10.5194/amt-11-4847-2018, 2018. a
Bloemink, H. I. and Lanzinger, E.: Precipitation type from the Thies disdrometer, in: WMO Technical Conference on Meteorological and Environmental Instruments and Methods of Observation (TECO-2005), 4–7, Bucharest, Romania, available at: https://www.knmi.nl/home (last access: 1 September 2020), 2005. a, b, c
Brandes, E. A., Ikeda, K., Zhang, G., Schönhuber, M., and Rasmussen, R. M.: A statistical and physical description of hydrometeor distributions in Colorado snowstorms using a video disdrometer, J. Appl. Meteorol. Climatol., 46, 634–650, https://doi.org/10.1175/JAM2489.1, 2007. a, b
Bringi, V. N., Tolstoy, L., Thurai, M., and Petersen, W. A.: Estimation of spatial correlation of drop size distribution parameters and rain rate using NASA's S-band polarimetric radar and 2D video disdrometer network: Two case studies from MC3E, J. Hydrometeorol., 16, 1207–1221, https://doi.org/10.1175/JHM-D-14-0204.1, 2015. a
Chen, B., Wang, J., and Gong, D.: Raindrop size distribution in a midlatitude continental squall line measured by Thies optical disdrometers over East China, J. Appl. Meteorol. Climatol., 55, 621–634, https://doi.org/10.1175/JAMC-D-15-0127.1, 2016. a, b
Chuang, C. C. and Beard, K. V.: A numerical model for the equilibrium shape of electrified raindrops, J. Atmos. Sci., 47, 1374–1389, https://doi.org/10.1175/1520-0469(1990)047<1374:ANMFTE>2.0.CO;2, 1990. a
Fabry, F. and Szyrmer, W.: Modeling of the melting layer. Part II: Electromagnetic, J. Atmos. Sci., 56, 3593–3600, https://doi.org/10.1175/1520-0469(1999)056<3593:MOTMLP>2.0.CO;2, 1999. a
Fassnacht, S. R.: Estimating Alter-shielded gauge snowfall undercatch, snowpack sublimation, and blowing snow transport at six sites in the coterminous USA, Hydrol. Process., 18, 3481–3492, https://doi.org/10.1002/hyp.5806, 2004. a
Fehlmann, M., Gascón, E., Rohrer, M., Schwarb, M., and Stoffel, M.: Estimating the snowfall limit in alpine and pre-alpine valleys: A local evaluation of operational approaches, Atmos. Res., 204, 136–148, https://doi.org/10.1016/j.atmosres.2018.01.016, 2018. a, b
Fehlmann, M., Rohrer, M., von Lerber, A., and Stoffel, M.: Data for journal article: “Automated precipitation monitoring with the Thies disdrometer: Biases and ways for improvement”, Zenodo, https://doi.org/10.5281/zenodo.3956815, 2020. a
Forbes, R., Tsonevsky, I., Hewson, T., and Leutbecher, M.: Towards predicting high-impact freezing rain events, ECMWF Newsletter, 141, 15–21, https://doi.org/10.21957/xcauc5jf, 2014. a
Frasson, R. P. d. M. and Krajewski, W. F.: Characterization of the drop-size distribution and velocity–diameter relation of the throughfall under the maize canopy, Agr. Forest Meteorol., 151, 1244–1251, https://doi.org/10.1016/j.agrformet.2011.05.001, 2011. a
Friedrich, K., Higgins, S., Masters, F. J., and Lopez, C. R.: Articulating and stationary PARSIVEL disdrometer measurements in conditions with strong winds and heavy rainfall, J. Atmos. Ocean. Technol., 30, 2063–2080, https://doi.org/10.1175/JTECH-D-12-00254.1, 2013. a, b
Gorgucci, E. and Baldini, L.: Influence of beam broadening on the accuracy of radar polarimetric rainfall estimation, J. Hydrometeorol., 16, 1356–1371, https://doi.org/10.1175/JHM-D-14-0084.1, 2015. a
Grazioli, J., Tuia, D., Monhart, S., Schneebeli, M., Raupach, T., and Berne, A.: Hydrometeor classification from two-dimensional video disdrometer data, Atmos. Meas. Tech., 7, 2869–2882, https://doi.org/10.5194/amt-7-2869-2014, 2014. a, b
Gunn, R. and Kinzer, G. D.: The terminal velocity of fall for water droplets in stagnant air, J. Meteorol., 6, 243–248, https://doi.org/10.1175/1520-0469(1949)006<0243:TTVOFF>2.0.CO;2, 1949. a, b
Guyot, A., Pudashine, J., Protat, A., Uijlenhoet, R., Pauwels, V. R. N., Seed, A., and Walker, J. P.: Effect of disdrometer type on rain drop size distribution characterisation: a new dataset for south-eastern Australia, Hydrol. Earth Syst. Sci., 23, 4737–4761, https://doi.org/10.5194/hess-23-4737-2019, 2019. a, b
Huang, G.-J., Bringi, V. N., Cifelli, R., Hudak, D., and Petersen, W. A.: A methodology to derive radar reflectivity–liquid equivalent snow rate relations using C-band radar and a 2D video disdrometer, J. Atmos. Ocean. Technol., 27, 637–651, https://doi.org/10.1175/2009JTECHA1284.1, 2010. a
Huang, G.-J., Bringi, V. N., Moisseev, D., Petersen, W. A., Bliven, L. F., and Hudak, D.: Use of 2D-video disdrometer to derive mean density–size and Ze–SR relations: Four snow cases from the light precipitation validation experiment, Atmos. Res., 153, 34–48, https://doi.org/10.1016/j.atmosres.2014.07.013, 2015. a
Jaffrain, J. and Berne, A.: Experimental quantification of the sampling uncertainty associated with measurements from PARSIVEL disdrometers, J. Hydrometeorol., 12, 352–370, https://doi.org/10.1175/2010JHM1244.1, 2011. a
Jolliffe, I. T. and Stephenson, D. B.: Forecast verification: A practioner's guide in atmospheric science, Wiley-Blackwell, Oxford, England, 2nd Edn., https://doi.org/10.1002/9781119960003, 2012. a, b
Juga, I., Hippi, M., Moisseev, D., and Saltikoff, E.: Analysis of weather factors responsible for the traffic “Black Day” in Helsinki, Finland, on 17 March 2005, Meteorl. Appl., 19, 1–9, https://doi.org/10.1002/met.238, 2012. a
Kämäräinen, M., Hyvärinen, O., Jylhä, K., Vajda, A., Neiglick, S., Nuottokari, J., and Gregow, H.: A method to estimate freezing rain climatology from ERA-Interim reanalysis over Europe, Nat. Hazards Earth Syst. Sci., 17, 243–259, https://doi.org/10.5194/nhess-17-243-2017, 2017. a
Kochendorfer, J., Rasmussen, R., Wolff, M., Baker, B., Hall, M. E., Meyers, T., Landolt, S., Jachcik, A., Isaksen, K., Brækkan, R., and Leeper, R.: The quantification and correction of wind-induced precipitation measurement errors, Hydrol. Earth Syst. Sci., 21, 1973–1989, https://doi.org/10.5194/hess-21-1973-2017, 2017. a
Krajewski, W. F., Kruger, A., Caracciolo, C., Golé, P., Barthes, L., Creutin, J.-D., Delahaye, J.-Y., Nikolopoulos, E. I., Ogden, F., and Vinson, J.-P.: DEVEX-disdrometer evaluation experiment: Basic results and implications for hydrologic studies, Adv. Water Resour., 29, 311–325, https://doi.org/10.1016/j.advwatres.2005.03.018, 2006. a
Lanza, L. G. and Vuerich, E.: Non-parametric analysis of one-minute rain intensity measurements from the WMO Field Intercomparison, Atmos. Res., 103, 52–59, https://doi.org/10.1016/j.atmosres.2011.04.021, 2012. a
Lanzinger, E., Theel, M., and Windolph, H.: Rainfall amount and intensity measured by the Thies laser precipitation monitor, in: WMO Technical Conference on Meteorological and Environmental Instruments and Methods of Observation (TECO-2006), 4–6, Geneva, Switzerland, 2006. a, b
Leinonen, J., Moisseev, D., Leskinen, M., and Petersen, W. A.: A climatology of disdrometer measurements of rainfall in Finland over five years with implications for global radar observations, J. Appl. Meteorol. Climatol., 51, 392–404, https://doi.org/10.1175/JAMC-D-11-056.1, 2012. a, b
Locatelli, J. D. and Hobbs, P. V.: Fall speeds and masses of solid precipitation particles, J. Geophys. Res., 79, 2185–2197, https://doi.org/10.1029/JC079i015p02185, 1974. a
Merenti-Välimäki, H.-L., Lönnqvist, J., and Laininen, P.: Present weather: Comparing human observations and one type of automated sensor, Meteorol. Appl., 8, 491–496, https://doi.org/10.1017/S1350482701004108, 2001. a, b
Mitchell, D. L.: Use of mass- and area-dimensional power laws for determining precipitation particle terminal velocities, J. Atmos. Sci., 53, 1710–1723, https://doi.org/10.1175/1520-0469(1996)053<1710:UOMAAD>2.0.CO;2, 1996. a
Nanko, K., Hotta, N., and Suzuki, M.: Assessing raindrop impact energy at the forest floor in a mature Japanese cypress plantation using continuous raindrop-sizing instruments, J. Forest Res., 9, 157–164, https://doi.org/10.1007/s10310-003-0067-6, 2004. a
Nanko, K., Watanabe, A., Hotta, N., and Suzuki, M.: Physical interpretation of the difference in drop size distributions of leaf drips among tree species, Agr. Forest Meteorol., 169, 74–84, https://doi.org/10.1016/j.agrformet.2012.09.018, 2013. a
Pickering, B. S., Neely III, R. R., and Harrison, D.: The Disdrometer Verification Network (DiVeN): a UK network of laser precipitation instruments, Atmos. Meas. Tech., 12, 5845–5861, https://doi.org/10.5194/amt-12-5845-2019, 2019. a, b
Pollock, M. D., O'Donnell, G., Quinn, P., Dutton, M., Black, A., Wilkinson, M. E., Colli, M., Stagnaro, M., Lanza, L. G., Lewis, E., Kilsby, C. G., and O'Connell, P. E.: Quantifying and mitigating wind-induced undercatch in rainfall measurements, Water Resour. Res., 54, 3863–3875, https://doi.org/10.1029/2017WR022421, 2018. a
Raupach, T. H. and Berne, A.: Correction of raindrop size distributions measured by Parsivel disdrometers, using a two-dimensional video disdrometer as a reference, Atmos. Meas. Tech., 8, 343–365, https://doi.org/10.5194/amt-8-343-2015, 2015. a, b, c, d, e, f, g, h, i
Raupach, T. H., Thurai, M., Bringi, V. N., and Berne, A.: Reconstructing the drizzle mode of the raindrop size distribution using double-moment normalization, J. Appl. Meteorol. Climatol., 58, 145–164, https://doi.org/10.1175/JAMC-D-18-0156.1, 2019. a, b
Savina, M., Schäppi, B., Molnar, P., Burlando, P., and Sevruk, B.: Comparison of a tipping-bucket and electronic weighing precipitation gage for snowfall, Atmos. Res., 103, 45–51, https://doi.org/10.1016/j.atmosres.2011.06.010, 2012. a
Schauwecker, S., Gascón, E., Park, S., Ruiz-Villanueva, V., Schwarb, M., Sempere-Torres, D., Stoffel, M., Vitolo, C., and Rohrer, M.: Anticipating cascading effects of extreme precipitation with pathway schemes – Three case studies from Europe, Environ. Int., 127, 291–304, https://doi.org/10.1016/j.envint.2019.02.072, 2019. a
Thurai, M. and Bringi, V. N.: Application of the generalized gamma model to represent the full rain drop size distribution spectra, J. Appl. Meteorol. Climatol., 57, 1197–1210, https://doi.org/10.1175/jamc-d-17-0235.1, 2018. a
Thurai, M., Bringi, V. N., Carey, L. D., Gatlin, P., Schultz, E., and Petersen, W. A.: Estimating the accuracy of polarimetric radar–based retrievals of drop-size distribution parameters and rain rate: An application of error variance separation using radar-derived spatial correlations, J. Hydrometeorol., 13, 1066–1079, https://doi.org/10.1175/JHM-D-11-070.1, 2012. a
Thurai, M., Gatlin, P., Bringi, V. N., Petersen, W., Kennedy, P., Notaroš, B., and Carey, L.: Toward completing the raindrop size spectrum: Case studies involving 2D-video disdrometer, droplet spectrometer, and polarimetric radar measurements, J. Appl. Meteorol. Climatol., 56, 877–896, https://doi.org/10.1175/JAMC-D-16-0304.1, 2017. a
Tiira, J., Moisseev, D. N., von Lerber, A., Ori, D., Tokay, A., Bliven, L. F., and Petersen, W.: Ensemble mean density and its connection to other microphysical properties of falling snow as observed in Southern Finland, Atmos. Meas. Tech., 9, 4825–4841, https://doi.org/10.5194/amt-9-4825-2016, 2016. a
Tobin, C., Rinaldo, A., and Schaefli, B.: Snowfall limit forecasts and hydrological modeling, J. Hydrometeorol., 13, 1507–1519, https://doi.org/10.1175/JHM-D-11-0147.1, 2012. a
Toivonen, K. and Kantonen, J.: Road weather information system in Finland, Transportation Research Record: J. Transport. Res. Board, 1741, 21–25, https://doi.org/10.3141/1741-04, 2001. a
Tokay, A., Petersen, W. A., Gatlin, P., and Wingo, M.: Comparison of raindrop size distribution measurements by collocated disdrometers, J. Atmos. Ocean. Technol., 30, 1672–1690, https://doi.org/10.1175/JTECH-D-12-00163.1, 2013. a
Unterstrasser, S. and Zängl, G.: Cooling by melting precipitation in Alpine valleys: An idealized numerical modelling study, Q. J. Roy. Meteorol. Soc., 132, 1489–1508, https://doi.org/10.1256/qj.05.158, 2006. a
Upton, G. and Brawn, D.: An investigation of factors affecting the accuracy of Thies disdrometers, in: WMO Technical Conference on Meteorological and Environmental Instruments and Methods of Observation (TECO-2008), 27–29, St. Petersburg, Russian Federation, available at: https://www.wmo.int/pages/prog/www/IMOP/publications/IOM-96_TECO-2008/_PROGRAMME.HTML (last access: 1 September 2020), 2008. a
von Lerber, A., Moisseev, D., Bliven, L. F., Petersen, W., Harri, A.-M., and Chandrasekar, V.: Microphysical properties of snow and their link to Ze–S relations during BAECC 2014, J. Appl. Meteorol. Climatol., 56, 1561–1582, https://doi.org/10.1175/JAMC-D-16-0379.1, 2017. a
Wolff, M. A., Isaksen, K., Petersen-Øverleir, A., Ødemark, K., Reitan, T., and Brækkan, R.: Derivation of a new continuous adjustment function for correcting wind-induced loss of solid precipitation: results of a Norwegian field study, Hydrol. Earth Syst. Sci., 19, 951–967, https://doi.org/10.5194/hess-19-951-2015, 2015. a
Yang, D.: Double Fence Intercomparison Reference (DFIR) vs. Bush Gauge for “true” snowfall measurement, J. Hydrol., 509, 94–100, https://doi.org/10.1016/j.jhydrol.2013.08.052, 2014. a
Yuter, S. E., Kingsmill, D. E., Nance, L. B., and Löffler-Mang, M.: Observations of precipitation size and fall speed characteristics within coexisting rain and wet snow, J. Appl. Meteorol. Climatol., 45, 1450–1464, https://doi.org/10.1175/JAM2406.1, 2006. a