
Abstract
Severe acute respiratory syndrome coronavirus 2 (SARS-CoV-2) rapidly spread around the world during 2020, but the precise time in which the virus began to spread locally is difficult to trace for most countries. Here, we estimate the probable onset date of the community spread of SARS-CoV-2 for heavily affected countries from Western Europe and the Americas on the basis of the cumulative number of deaths reported during the early stage of the epidemic. Our results support that SARS-CoV-2 probably started to spread locally in all western countries analysed between mid-January and mid-February 2020, thus long before community transmission was officially recognised and control measures were implemented.
Key words:
SARS-CoV-2; community spread; Europe; America
A novel Betacoronavirus, designated severe acute respiratory syndrome coronavirus 2 (SARS-CoV-2), was identified as the causative agent of a severe acute respiratory disease [now known as Coronavirus disease 2019 (COVID-19)] in Wuhan, Hubei province, China, in December 2019.11. Wu F, Zhao S, Yu B, Chen YM, Wang W, Song ZG, et al. A new coronavirus associated with human respiratory disease in China. Nature. 2020; 579(7798): 265-9.,22. Zhou P, Yang XL, Wang XG, Hu B, Zhang L, Zhang W, et al. A pneumonia outbreak associated with a new coronavirus of probable bat origin. Nature. 2020; 579(7798): 270-3. In the following weeks, SARS-CoV-2 rapidly spread around the world, infecting more than 12 million people and causing more than 500,000 deaths as of July 10th, 2020.33. Worldometer. COVID-19 coronavirus pandemic. 2020. Available from: https://www.worldometers.info/coronavirus/country.
https://www.worldometers.info/coronaviru...
The exponential growth of the COVID-19 pandemic has overloaded hospitals and governments’ response measures have disrupted social contacts for > 1 billion inhabitants worldwide.
Genomic analyses traced back the origin of SARS-CoV-2 in China to late November 2019,44. Lu J, du Plessis L, Liu Z, Hill V, Kang M, Lin H, et al. Genomic Epidemiology of SARS-CoV-2 in Guangdong Province, China. Cell. 2020; 181(5): 997-1003.e9. consistent with epidemiological findings that show local viral transmission in Wuhan by the middle December 2019.55. Li Q, Guan X, Wu P, Wang X, Zhou L, Tong Y, et al. Early transmission dynamics in Wuhan, China, of novel coronavirus-infected pneumonia. N Engl J Med. 2020; 382(13): 1199-207. The first infections of SARS-CoV-2 identified in Europe and the United States of America (USA) were documented in January 2020, related to travelers returning from China and their contacts; while the firsts cases of viral community transmission in those regions were only documented between the middle and late February 2020.66. Lescure FX, Bouadma L, Nguyen D, Parisey M, Wicky PH, Behillil S, et al. Clinical and virological data of the first cases of COVID-19 in Europe: a case series. Lancet Infect Dis. 2020; 20(6): 697-706.,77. WHO - World Health Organization. Coronavirus disease 2019 (COVID-19) - Situation Report 39. 2020. Available from: https://www.who.int/docs/default-source/coronaviruse/situation-reports/20200228-sitrep-39-covid-19.pdf?sfvrsn=5bbf3e7d_4.
https://www.who.int/docs/default-source/...
The precise onset date of the community transmission of SARS-CoV-2 in most countries, however, is difficult to estimate. The high proportion of asymptomatic/presymptomatic infectious individuals coupled with limited testing might have facilitated the undocumented dissemination of the novel coronavirus between and within countries before its detection by public health systems.88. Li R, Pei S, Chen B, Song Y, Zhang T, Yang W, et al. Substantial undocumented infection facilitates the rapid dissemination of novel coronavirus (SARS-CoV2). Science. 2020; 368(6490): 489-93.,99. Silverman JD, Hupert N, Washburne AD. Using influenza surveillance networks to estimate state-specific prevalence of SARS-CoV-2 in the United States. Sci Transl Med. 2020; 12(554): eabc1126. Consistent with this hypothesis, one study retrospectively identified the presence of SARS-CoV-2 in a patient with no history of recent travel that was hospitalised in France in late December 2019.1010. Deslandes A, Berti V, Tandjaoui-Lambotte Y, Alloui C, Carbonnelle E, Zahar JR, et al. SARS-CoV-2 was already spreading in France in late December 2019. Int J Antimicrob Agents. 2020; 55(6): 106006. This early detection of the virus in Europe in December 2019, however, did not demonstrates that community transmission chains detected several weeks later actually originated from this very first case.
Genomic epidemiology has been used to track the geographic spread of SARS-CoV-2 and to estimate when community transmission of SARS-CoV-2 was first established in western countries. Some studies traced the onset date of the largest SARS-CoV-2 community transmission clusters to around early February in Italy and Spain, mid-February in Washington State and New York city (NYC), and from late February onwards in Belgium and the United Kingdom (UK).1111. Gonzalez-Reiche AS, Hernandez MM, Sullivan MJ, Ciferri B, Alshammary H, Obla A, et al. Introductions and early spread of SARS-CoV-2 in the New York City area. Science. 2020; 369(6501): 297-301.,1212. Worobey M, Pekar J, Larsen BB, Nelson MI, Hill V, Joy JB, et al. The emergence of SARS-CoV-2 in Europe and the US. bioRxiv. 2020. Available from: https://doi.org/10.1101/2020.05.21.109322.
https://doi.org/10.1101/2020.05.21.10932...
,1313. Díez-Fuertes F, Iglesias-Caballero M, Monzón S, Jiménez P, Varona S, Cuesta I, et al. Phylodynamics of SARS-CoV-2 transmission in Spain. bioRxiv. 2020. Available from: https://doi.org/10.1101/2020.04.20.050039
https://doi.org/10.1101/2020.04.20.05003...
,1414. Dellicour S, Durkin K, Hong S, Vanmechelen B, Martí-Carreras J, Gill M, et al. A phylodynamic workflow to rapidly gain insights into the dispersal history and dynamics of SARS-CoV-2 lineages. bioRxiv. 2020. Available from: https://doi.org/10.1101/2020.05.05.078758.
https://doi.org/10.1101/2020.05.05.07875...
,1515. Lai A, Bergna A, Caucci S, Clementi N, Vicenti I, Dragoni F, et al. Molecular tracing of SARS-CoV-2 in Italy in the first three months of the epidemic. Viruses. 2020; 12(8): E798.,1616. Gámbaro F, Behillil S, Baidaliuk A, Donati F, Albert M, Alexandru A, et al. Introductions and early spread of SARS-CoV-2 in France, 24 January to 23 March 2020. Euro Surveill. 2020; 25(26): 2001200.,1717. Pybus O, Rambaut A, du Plessis L, Zarebski A, Kraemer M, Raghwani J, et al. Preliminary analysis of SARS-CoV-2 importation & establishment of UK transmission lineages. Virological.org. 2020. Available from: https://virological.org/t/preliminary-analysis-of-sars-cov-2-importation-establishment-of-uk-transmission-lineages/507.
https://virological.org/t/preliminary-an...
These results supports that rapid interventions prevented onward transmission of early symptomatic imported cases detected in Europe and the USA in January 2020 and that community outbreaks were seeded by unnoticed introductions occurred after detection of first travel-associated cases.1212. Worobey M, Pekar J, Larsen BB, Nelson MI, Hill V, Joy JB, et al. The emergence of SARS-CoV-2 in Europe and the US. bioRxiv. 2020. Available from: https://doi.org/10.1101/2020.05.21.109322.
https://doi.org/10.1101/2020.05.21.10932...
,1616. Gámbaro F, Behillil S, Baidaliuk A, Donati F, Albert M, Alexandru A, et al. Introductions and early spread of SARS-CoV-2 in France, 24 January to 23 March 2020. Euro Surveill. 2020; 25(26): 2001200.,1818. Jorden MA, Rudman SL, Villarino E, Hoferka S, Patel MT, Bemis K, et al. Evidence for limited early spread of COVID-19 within the United States, January-February 2020. MMWR. 2020; 69(22): 680-4. Other genomic studies, however, support a period of undetected community spreading of SARS-CoV-2 since mid-January 2020 in Europe, late January or early February 2020 in the USA (Washington and Illinois) and early or mid-February 2020 in Brazil.1313. Díez-Fuertes F, Iglesias-Caballero M, Monzón S, Jiménez P, Varona S, Cuesta I, et al. Phylodynamics of SARS-CoV-2 transmission in Spain. bioRxiv. 2020. Available from: https://doi.org/10.1101/2020.04.20.050039
https://doi.org/10.1101/2020.04.20.05003...
,1919. Lorenzo-Redondo R, Nam HH, Roberts SC, Simons LM, Jennings LJ, Qi C, et al. A unique clade of SARS-CoV-2 viruses is associated with lower viral loads in patient upper airways. medRxiv. 2020. Available from: https://doi.org/10.1101/2020.05.19.20107144.
https://doi.org/10.1101/2020.05.19.20107...
,2020. Bedford T, Greninger AL, Roychoudhury P, Starita LM, Famulare M, Huang ML, et al. Cryptic transmission of SARS-CoV-2 in Washington State. medRxiv. 2020. Available from: https://doi.org/ 10.1101/2020.04.02.20051417.
https://doi.org/ 10.1101/2020.04.02.2005...
,2121. Nadeau S, Vaughan T, Sciré J, Huisman J, Stadler T. The origin and early spread of SARS-CoV-2 in Europe. medRxiv. 2020. Available from: https://doi.org/10.1101/2020.06.10.20127738.
https://doi.org/10.1101/2020.06.10.20127...
,2222. Candido D, Claro I, de Jesus J, Souza W, Moreira F, Dellicour S, et al. Evolution and epidemic spread of SARS-CoV-2 in Brazil. Science. 2020; eabd2161. Available from: https://doi.org/ 10.1126/science.abd2161.
https://doi.org/ 10.1126/science.abd2161...
,2323. Resende P, Delatorre E, Gräf T, Mir D, Motta F, Appolinario L, et al. Genomic surveillance of SARS-CoV-2 reveals community transmission of a major lineage during the early pandemic phase in Brazil. bioRxiv. 2020. Available from: https://doi.org/10.1101/2020.06.17.158006.
https://doi.org/10.1101/2020.06.17.15800...
According to these studies, community outbreaks in Europe and the Americas were seeded by unnoticed viral introductions that probably occurred before detection of first travel-associated cases and long before description of the firsts cases of community transmission.
These contrasting findings expose the limitations for the accurate estimation of the onset date of domestic transmission of SARS-CoV-2 within countries (or cities) based solely on genetic data, particularly in Europe and the Americas where many outbreaks were seeded by identical (or closely related) viral strains.2424. Korber B, Fischer W, Gnanakaran S, Yoon H, Theiler J, Abfalterer W, et al. Tracking changes in SARS-CoV-2 Spike: evidence that D614G increases infectivity of the COVID-19 virus. Cell. 2020; S0092-8674(20): 30820-5. The very low levels of genetic diversity of SARS-CoV-2 genomes sampled from different regions combined with the uneven geographic sampling make the evolutionary patterns inferred from early genomic data highly uncertain.44. Lu J, du Plessis L, Liu Z, Hill V, Kang M, Lin H, et al. Genomic Epidemiology of SARS-CoV-2 in Guangdong Province, China. Cell. 2020; 181(5): 997-1003.e9.,2525. Mavian C, Marini S, Prosperi M, Salemi M. A snapshot of SARS-CoV-2 genome availability up to April 2020 and its implications: data analysis. JMIR Public Health Surveill. 2020; 6(2): e19170.,2626. Villabona-Arenas CJ, Hanage WP, Tully DC. Phylogenetic interpretation during outbreaks requires caution. Nat Microbiol. 2020; 5(7): 876-7. Here, we aimed to develop a simple inference method to estimate the probable onset date of the community spread of SARS-CoV-2 in different countries from the time series of cumulative number of reported deaths during the early stage of the epidemic. The reported number of deaths provides a more reliable tracker of the SARS-CoV-2 epidemic’s progress within a country than counts of diagnosed cases because there are less affected by substantial underreporting.2727. Subbaraman N. Why daily death tolls have become unusually important in understanding the coronavirus pandemic. Nature. 2020. Available from: https://doi.org/10.1038/d41586-020-01008-1.
https://doi.org/10.1038/d41586-020-01008...
Furthermore, the cumulative number of reported deaths represents a time-delayed tracker of the SARS-CoV-2 epidemic (median time between infection and death of around three weeks) and thus provides valuable information on early epidemic dynamics even when data is obtained after implementation of control measures to reduce the viral spread.2828. Linton NM, Kobayashi T, Yang Y, Hayashi K, Akhmetzhanov AR, Jung SM, et al. Incubation period and other epidemiological characteristics of 2019 novel coronavirus infections with right truncation: a statistical analysis of publicly available case data. J Clin Med. 2020; 9(2): 538.,2929. Verity R, Okell LC, Dorigatti I, Winskill P, Whittaker C, Imai N, et al. Estimates of the severity of coronavirus disease 2019: a model-based analysis. Lancet Infect Dis. 2020 20(6): 669-77.
To infer the probable onset date of the community spread of SARS-CoV-2 in a given location, we assumed that: (a) as soon as the virus starts spreading locally, the epidemic starts to grow exponentially and the cumulative number of deaths starts to increase exponentially 20 days later; (b) the rate of exponential growth of the number of deaths remains roughly constant during the epidemic early weeks; and (c) the infection fatality ratio of SARS-CoV-2 is around 1%.2828. Linton NM, Kobayashi T, Yang Y, Hayashi K, Akhmetzhanov AR, Jung SM, et al. Incubation period and other epidemiological characteristics of 2019 novel coronavirus infections with right truncation: a statistical analysis of publicly available case data. J Clin Med. 2020; 9(2): 538.,2929. Verity R, Okell LC, Dorigatti I, Winskill P, Whittaker C, Imai N, et al. Estimates of the severity of coronavirus disease 2019: a model-based analysis. Lancet Infect Dis. 2020 20(6): 669-77. For this study, we recovered daily death counts of COVID-19 from China and from those countries from Western Europe [Belgium, France, Germany, Italy, Netherlands, Spain, United Kingdom (UK)], North America (New York, USA) and South America (Brazil) that were most heavily affected until 5th April 2020.3030. Idogawa M, Tange S, Nakase H, Tokino T. Interactive web-based graphs of novel coronavirus COVID-19 cases and deaths per population by country. Clin Infect Dis. 2020; 71(15): 902-3. To capture the early period of constant exponential growth of virus transmission in each country while minimising both the impact of the low detection rate during the epidemic’s first days and of control measures implemented at later times, we set the start point of the time series to the day when the cumulative number of deaths was above four and then counted for a maximum time period of 15 days after that. Then, for each location, we used the Wald-Wolfowitz runs test statistic to select the time interval where the epidemic growth rate adjusted to the exponential function:
where N(t) = number of infected individuals at time t, N0 = size of the epidemic in t 0, and k = exponential growth constant. We estimate the epidemic doubling time (EDT) as EDT = ln(2)/k. Finally, to accommodate different scenarios in which the local epidemic might have been seeded by single or multiple introductions, we projected back the t when the number of total infected individuals was equal to one (TN1), 10 (TN10) and 100 (TN100). All statistical analyses were performed using Graph Pad v6 (Prism Software, La Jolla, California, USA).
Our analyses identified an initial period in each country, varying from nine to 15 days after the fourth death, during which the growth of deaths fits (r2 ≥ 0.95) an exponential curve (Fig. 1) and data were consistent with the assumption that transmission rates remain nearly unchanged in the selected period [Supplementary data (Table)]. When additional time points beyond the selected period were included, we observed a significant departure from unconstrained exponential growth and lower mean estimates of EDT were obtained (data not shown), which likely reflects the impact of control measures implemented across countries.3131. Maier BF, Brockmann D. Effective containment explains subexponential growth in recent confirmed COVID-19 cases in China. Science. 2020; 368(6492): 742-6.,3232. Pan A, Liu L, Wang C, Guo H, Hao X, Wang Q, et al. Association of public health interventions with the epidemiology of the COVID-19 outbreak in Wuhan, China. JAMA. 2020; 323(19): 1-9.,3333. Flaxman S, Mishra S, Gandy A, Unwin HJT, Mellan TA, Coupland H, et al. Estimating the effects of non-pharmaceutical interventions on COVID-19 in Europe. Nature. 2020; 584: 257-61. Available from: https://doi.org/ 10.1038/s41586-020-2405-7.
https://doi.org/ 10.1038/s41586-020-2405...
During the early growth phase here selected, the mean EDT of SARS-CoV-2 ranged between 2.2 and 2.9 days for the whole set of analysed countries (Fig. 1), which is in line with previous estimates for China, Europe and the USA.3434. Sanche S, Lin YT, Xu C, Romero-Severson E, Hengartner N, Ke R. High Contagiousness and rapid spread of severe acute respiratory syndrome coronavirus 2. Emerg Infect Dis. 2020; 26(7): 1470-7.,3535. Pellis L, Scarabel F, Stage H, Overton C, Chappell L, Lythgoe K, et al. Challenges in control of Covid-19: short doubling time and long delay to effect of interventions. medRxiv. 2020. Available from: https://doi.org/10.1101/2020.04.12.20059972.
https://doi.org/10.1101/2020.04.12.20059...
,3636. Ke R, Sanche S, Romero-Severson E, Hengartner N. Fast spread of COVID-19 in Europe and the US suggests the necessity of early, strong and comprehensive interventions. medRxiv. 2020. Available from: https://doi.org/10.1101/2020.04.04.20050427.
https://doi.org/10.1101/2020.04.04.20050...
Of note, the mean EDT of the SARS-CoV-2 estimated in Brazil was comparable to those estimated in countries from the Northern hemisphere. This supports the notion that population immunity is a much more fundamental driver of early pandemic SARS-CoV-2 dynamics than underlying demography and environmental factors.3737. Baker RE, Yang W, Vecchi GA, Metcalf CJE, Grenfell BT. Susceptible supply limits the role of climate in the early SARS-CoV-2 pandemic. Science. 2020; 369(6501): 315-9. It is also possible that similar EDT estimated from death counts across countries resulted from the complex interaction of demographic and/or environmental factors with differences in the availability of health-care facilities.2929. Verity R, Okell LC, Dorigatti I, Winskill P, Whittaker C, Imai N, et al. Estimates of the severity of coronavirus disease 2019: a model-based analysis. Lancet Infect Dis. 2020 20(6): 669-77.,3838. Wang M, Jiang A, Gong L, Luo L, Guo W, Li C, et al. Temperature significantly change COVID-19 transmission in 429 cities. medRxiv. 2020. Available from: https://doi.org/10.1101/2020.02.22.20025791.
https://doi.org/10.1101/2020.02.22.20025...
,3939. Chiyomaru K, Takemoto K. Global COVID-19 transmission rate is influenced by precipitation seasonality and the speed of climate temperature warming. medRxiv. 2020. Available from: https://doi.org/10.1101/2020.04.10.20060459.
https://doi.org/10.1101/2020.04.10.20060...
,4040. Berumen J, Schmulson M, Guerrero G, Barrera E, Larriva-Sahd J, Olaiz G, et al. Trends of SARS-Cov-2 infection in 67 countries: role of climate zone, temperature, humidity and curve behavior of cumulative frequency on duplication time. medRxiv. 2020. Available from: https://doi.org/10.1101/2020.04.18.20070920.
https://doi.org/10.1101/2020.04.18.20070...

estimation of the exponential growth parameters of severe acute respiratory syndrome coronavirus 2 (SARS-CoV-2) epidemics over time in selected countries. Red and blue symbols represent the log-transformed daily counts of new deaths and the estimated number of infections, respectively, for each country. The data were fitted on an exponential growth curve (red and blue lines, with the shaded area representing the 95% confidence intervals). The goodness of fit (r²), p-value, growth constant (GC), and estimated doubling time (EDT) for each country are presented for each graph. The gray dotted line indicates the date of the 1st reported SARS-CoV-2 case in each country.
Using our approach to estimate the onset date of local transmission of SARS-CoV-2, we traced the TN1 to late November 2019 in China, to mid-January 2020 in Italy and between mid-January and early February 2020 in other western countries (Fig. 2, Table). The estimated TN1 in China is fully consistent with molecular clock calibrations obtained from early SARS-CoV-2 genomic data from Wuhan (Table).44. Lu J, du Plessis L, Liu Z, Hill V, Kang M, Lin H, et al. Genomic Epidemiology of SARS-CoV-2 in Guangdong Province, China. Cell. 2020; 181(5): 997-1003.e9. Our estimate of the onset date of community transmission of SARS-CoV-2 in Italy is also consistent with the estimated time of the most recent common ancestor (TMRCA) of the predominant European SARS-CoV-2 clade B.1, that most likely arose in Italy and rapid spread to other European countries (Table).1212. Worobey M, Pekar J, Larsen BB, Nelson MI, Hill V, Joy JB, et al. The emergence of SARS-CoV-2 in Europe and the US. bioRxiv. 2020. Available from: https://doi.org/10.1101/2020.05.21.109322.
https://doi.org/10.1101/2020.05.21.10932...
,1313. Díez-Fuertes F, Iglesias-Caballero M, Monzón S, Jiménez P, Varona S, Cuesta I, et al. Phylodynamics of SARS-CoV-2 transmission in Spain. bioRxiv. 2020. Available from: https://doi.org/10.1101/2020.04.20.050039
https://doi.org/10.1101/2020.04.20.05003...
,2121. Nadeau S, Vaughan T, Sciré J, Huisman J, Stadler T. The origin and early spread of SARS-CoV-2 in Europe. medRxiv. 2020. Available from: https://doi.org/10.1101/2020.06.10.20127738.
https://doi.org/10.1101/2020.06.10.20127...
The TN1 projections for other western countries, by contrast, recovered dates that were older than those estimated from genomic data (Table). These results indicate that the TN1 projection method provide quite accurate results for locations like Wuhan (China) and Northern Italy where the epidemic was mostly seeded by a single founder event; but not for most urban hubs in Europe and the Americas where the epidemic was driven by multiple independent seeding events.
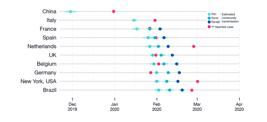
timeline of the Coronavirus disease 2019 (COVID-19) pandemic in the analysed countries. The red dot represents the date of the 1st reported severe acute respiratory syndrome coronavirus 2 (SARS-CoV-2) case in each country. Our estimates of the onset date of community transmission considering one (TN1), 10 (TN10), and 100 (TN100) seeders are represented by the blue dots according to the legend. The blue bars indicate the 95% confidence intervals of date estimates.
Coronavirus disease 2019 (COVID-19) epidemiologic timeline and implementation of related control measures in selected countries
Genomic data shown that for some places the epidemic was mostly driven by few local predominant lineages (e.g., Spain, New York and Brazil), while for others it was probably seeded by a high number of importation events and no predominant lineage was identified so far (e.g., Belgium, Germany, Netherlands and the UK).1111. Gonzalez-Reiche AS, Hernandez MM, Sullivan MJ, Ciferri B, Alshammary H, Obla A, et al. Introductions and early spread of SARS-CoV-2 in the New York City area. Science. 2020; 369(6501): 297-301.,1313. Díez-Fuertes F, Iglesias-Caballero M, Monzón S, Jiménez P, Varona S, Cuesta I, et al. Phylodynamics of SARS-CoV-2 transmission in Spain. bioRxiv. 2020. Available from: https://doi.org/10.1101/2020.04.20.050039
https://doi.org/10.1101/2020.04.20.05003...
,1414. Dellicour S, Durkin K, Hong S, Vanmechelen B, Martí-Carreras J, Gill M, et al. A phylodynamic workflow to rapidly gain insights into the dispersal history and dynamics of SARS-CoV-2 lineages. bioRxiv. 2020. Available from: https://doi.org/10.1101/2020.05.05.078758.
https://doi.org/10.1101/2020.05.05.07875...
,1616. Gámbaro F, Behillil S, Baidaliuk A, Donati F, Albert M, Alexandru A, et al. Introductions and early spread of SARS-CoV-2 in France, 24 January to 23 March 2020. Euro Surveill. 2020; 25(26): 2001200.,1717. Pybus O, Rambaut A, du Plessis L, Zarebski A, Kraemer M, Raghwani J, et al. Preliminary analysis of SARS-CoV-2 importation & establishment of UK transmission lineages. Virological.org. 2020. Available from: https://virological.org/t/preliminary-analysis-of-sars-cov-2-importation-establishment-of-uk-transmission-lineages/507.
https://virological.org/t/preliminary-an...
,1919. Lorenzo-Redondo R, Nam HH, Roberts SC, Simons LM, Jennings LJ, Qi C, et al. A unique clade of SARS-CoV-2 viruses is associated with lower viral loads in patient upper airways. medRxiv. 2020. Available from: https://doi.org/10.1101/2020.05.19.20107144.
https://doi.org/10.1101/2020.05.19.20107...
,2222. Candido D, Claro I, de Jesus J, Souza W, Moreira F, Dellicour S, et al. Evolution and epidemic spread of SARS-CoV-2 in Brazil. Science. 2020; eabd2161. Available from: https://doi.org/ 10.1126/science.abd2161.
https://doi.org/ 10.1126/science.abd2161...
,2323. Resende P, Delatorre E, Gräf T, Mir D, Motta F, Appolinario L, et al. Genomic surveillance of SARS-CoV-2 reveals community transmission of a major lineage during the early pandemic phase in Brazil. bioRxiv. 2020. Available from: https://doi.org/10.1101/2020.06.17.158006.
https://doi.org/10.1101/2020.06.17.15800...
To estimate the beginning of domestic spread in these locations, we made the TN10 and TN100 projections. The onset date of community transmission of SARS-CoV-2 was traced back to between late January and early February by the TN10 projections and to between early and mid-February by the TN100 projections (Fig. 2, Table). For Spain, NYC and Brazil, the TN10 projections point the origin of local viral transmissions 10-15 days earlier than the estimated TMRCA of major transmission lineages detected (Table).1111. Gonzalez-Reiche AS, Hernandez MM, Sullivan MJ, Ciferri B, Alshammary H, Obla A, et al. Introductions and early spread of SARS-CoV-2 in the New York City area. Science. 2020; 369(6501): 297-301.,1313. Díez-Fuertes F, Iglesias-Caballero M, Monzón S, Jiménez P, Varona S, Cuesta I, et al. Phylodynamics of SARS-CoV-2 transmission in Spain. bioRxiv. 2020. Available from: https://doi.org/10.1101/2020.04.20.050039
https://doi.org/10.1101/2020.04.20.05003...
,2222. Candido D, Claro I, de Jesus J, Souza W, Moreira F, Dellicour S, et al. Evolution and epidemic spread of SARS-CoV-2 in Brazil. Science. 2020; eabd2161. Available from: https://doi.org/ 10.1126/science.abd2161.
https://doi.org/ 10.1126/science.abd2161...
,2323. Resende P, Delatorre E, Gräf T, Mir D, Motta F, Appolinario L, et al. Genomic surveillance of SARS-CoV-2 reveals community transmission of a major lineage during the early pandemic phase in Brazil. bioRxiv. 2020. Available from: https://doi.org/10.1101/2020.06.17.158006.
https://doi.org/10.1101/2020.06.17.15800...
For UK and Belgium, by its turn, the TN10 and TN100 projections recovered dates that were 15-20 days earlier than the estimated TMRCA of local lineages detected (Table).1414. Dellicour S, Durkin K, Hong S, Vanmechelen B, Martí-Carreras J, Gill M, et al. A phylodynamic workflow to rapidly gain insights into the dispersal history and dynamics of SARS-CoV-2 lineages. bioRxiv. 2020. Available from: https://doi.org/10.1101/2020.05.05.078758.
https://doi.org/10.1101/2020.05.05.07875...
,1717. Pybus O, Rambaut A, du Plessis L, Zarebski A, Kraemer M, Raghwani J, et al. Preliminary analysis of SARS-CoV-2 importation & establishment of UK transmission lineages. Virological.org. 2020. Available from: https://virological.org/t/preliminary-analysis-of-sars-cov-2-importation-establishment-of-uk-transmission-lineages/507.
https://virological.org/t/preliminary-an...
The TMRCA of local SARS-CoV-2 transmission lineages in France, Germany and Netherlands were not described so far. Thus, despite of accommodating for multiple seedings events, our projections of the onset date of community transmission of SARS-CoV-2 in most western countries provide timelines that were 10-20 days earlier than those estimated by molecular clock analyses (Table).
Overall, our results support a period of untracked (cryptic) community transmission of SARS-CoV-2 in Europe and the Americas from mid-January to late February 2020. According to our estimations, SARS-CoV-2 probably started to spread locally before community transmission was officially recognised and control measures for social distancing and air travel restrictions were implemented in all countries analysed and even before detection of the first imported cases in some locations (Fig. 2). The existence of sustained community transmission in Italy since the mid-January and in other western countries since late January or early February is consistent with the early establishment of the pandemic viral lineage B.1 in Italy and its rapid dissemination in Europe and the Americas.1111. Gonzalez-Reiche AS, Hernandez MM, Sullivan MJ, Ciferri B, Alshammary H, Obla A, et al. Introductions and early spread of SARS-CoV-2 in the New York City area. Science. 2020; 369(6501): 297-301.,2222. Candido D, Claro I, de Jesus J, Souza W, Moreira F, Dellicour S, et al. Evolution and epidemic spread of SARS-CoV-2 in Brazil. Science. 2020; eabd2161. Available from: https://doi.org/ 10.1126/science.abd2161.
https://doi.org/ 10.1126/science.abd2161...
,2323. Resende P, Delatorre E, Gräf T, Mir D, Motta F, Appolinario L, et al. Genomic surveillance of SARS-CoV-2 reveals community transmission of a major lineage during the early pandemic phase in Brazil. bioRxiv. 2020. Available from: https://doi.org/10.1101/2020.06.17.158006.
https://doi.org/10.1101/2020.06.17.15800...
,2424. Korber B, Fischer W, Gnanakaran S, Yoon H, Theiler J, Abfalterer W, et al. Tracking changes in SARS-CoV-2 Spike: evidence that D614G increases infectivity of the COVID-19 virus. Cell. 2020; S0092-8674(20): 30820-5. Our findings also agree with epidemiological data from syndromic surveillance of severe acute respiratory illness (SARI) that detected an excess of non-influenza SARI cases above the seasonal average in France, the USA and Brazil since late-February/early-March and further confirm SARS-CoV-2 positive samples among hospitalised SARI cases in Brazil since mid-February (16th-22nd February) (Available from: http://info.gripe.fiocruz.br).99. Silverman JD, Hupert N, Washburne AD. Using influenza surveillance networks to estimate state-specific prevalence of SARS-CoV-2 in the United States. Sci Transl Med. 2020; 12(554): eabc1126.,4141. Boelle PY, Souty C, Launay T, Guerrisi C, Turbelin C, Behillil S, et al. Excess cases of influenza-like illnesses synchronous with coronavirus disease (COVID-19) epidemic, France, March 2020. Euro Surveill. 2020; 25(14): 2000326.,4242. Bastos LS, Niquini RP, Lana RM, Villela DAM, Cruz OG, Coelho FC, et al. COVID-19 and hospitalizations for SARI in Brazil: a comparison up to the 12th epidemiological week of 2020. Cad Saude Publica. 2020; 36(4): e00070120.
The TN1 projections and the molecular clock analyses provide quite convergent estimates of the probable onset date of community transmission of SARS-CoV-2 in those locations where the epidemic was mostly driven by one seeding event. For countries with evidence of few and multiple independent seeding events, however, our TN10 and TN100 projections push back the timeline of community spread 10-20 days earlier than molecular clock estimates, respectively. If epidemics in most western countries actually resulted from the concurrent dissemination of hundreds or thousands independent SARS-CoV-2 transmission lineages, then our projections will produce estimates systematically biased toward older dates. Alternatively, given the dissemination of identical (or very similar) SARS-CoV-2 strains across different western countries over a short-time interval, the TMRCA of country-specific viral variants carrying one or a few synapomorphic mutations represent and upper bound of the time when SARS-CoV-2 became established in different locations. Interestingly, a recent study that estimate the establishment of local transmission of SARS-CoV-2 in the US using a metapopulation transmission model, concluded that the virus had been spreading in New York since the beginning of February, thus consistent with our TN1 or TN10 projections for this city and earlier than molecular clock estimates.4343. Davis JT, Chinazzi M, Perra N, Mu K, Piontti AP, Ajelli M, et al. Estimating the establishment of local transmission and the cryptic phase of the COVID-19 pandemic in the USA. medRxiv. 2020. Available from: https://doi.org/10.1101/2020.07.06.20140285.
https://doi.org/10.1101/2020.07.06.20140...
These results suggest that the combined use of projections based on epidemiological and genomic data could provide a more accurate picture of the early SARS-CoV-2 epidemic history in different settings.
Our model has several limitations. First, the narrow confidence intervals of our estimates should be interpreted with caution because our method does not account for uncertainty and geographic variability in the mortality rate and lag-time between infection and death.2828. Linton NM, Kobayashi T, Yang Y, Hayashi K, Akhmetzhanov AR, Jung SM, et al. Incubation period and other epidemiological characteristics of 2019 novel coronavirus infections with right truncation: a statistical analysis of publicly available case data. J Clin Med. 2020; 9(2): 538.,2929. Verity R, Okell LC, Dorigatti I, Winskill P, Whittaker C, Imai N, et al. Estimates of the severity of coronavirus disease 2019: a model-based analysis. Lancet Infect Dis. 2020 20(6): 669-77. As more clinical and epidemiological data becomes available, it will be possible to refine these estimates by using more accurate regional-specific parameters. Despite this, data from countries that implement wide-scale testing for SARS-CoV-2 since the beginning of the outbreak, including people who have mild or no symptoms, supports that the mortality rate will probably not exceed 1% of the total number of infected individuals.4444. Potluri R, Lavu D. Making sense of the global Coronavirus data: the role of testing rates in understanding the pandemic and our exit strategy. medRxiv. 2020. Available from: https://doi.org/10.1101/2020.04.06.20054239.
https://doi.org/10.1101/2020.04.06.20054...
Second, our method is sensitive to underestimation of the true number of deaths from SARS-CoV-2 and does not take into account the time-delay between dead to report. Overestimation of the mortality rate, substantial underreporting of deaths, and/or significant time-delayed of deaths counts during the initial phase would lead an underestimation of the total number of infected individuals and, consequently, to more recent projections of the TN1, TN10 and TN100. Hence, the estimates presented here should be regarded as a conservative lower limit for the onset date of local spread.
In summary, our results suggest that community transmission of SARS-CoV-2 probably started in many western countries between mid-January to mid-February 2020, thus long before control measures to restrict air travels and promote social distancing were implemented. That quite long period of putative cryptic community transmission in Europe and the Americas draws attention to the great challenge of tracking the early global and local spread of SARS-CoV-2 and supports that control measures should be adopted at least as soon as first imported cases are detected in a new geographic region. This is especially important in the light of studies showing that SARS-CoV-2 very likely will enter in a regular circulation after the initial pandemic wave, causing recurrent outbreaks in the next years whose frequency and intensity are dependent upon virus’ biological features that are still not well understood, like the duration of immunity that SARS-CoV-2 can induce.4545. Kissler SM, Tedijanto C, Goldstein E, Grad YH, Lipsitch M. Projecting the transmission dynamics of SARS-CoV-2 through the postpandemic period. Science. 2020; 368(6493): 860-8. Retrospective virological surveillance of people with SARI will be pivotal to trace the precise time of community transmission of SARS-CoV-2 in western countries, while active virological surveillance will be crucial for early detection of the virus re-emergence and rapid implementation of appropriate control measures.
ACKNOWLEDGEMENTS
To Nicolás Wschebor, César J Niche, Thais CO Fonseca and Matheus AM Lara for their helpful comments and advice on early version of this manuscript.
REFERENCES
-
1Wu F, Zhao S, Yu B, Chen YM, Wang W, Song ZG, et al. A new coronavirus associated with human respiratory disease in China. Nature. 2020; 579(7798): 265-9.
-
2Zhou P, Yang XL, Wang XG, Hu B, Zhang L, Zhang W, et al. A pneumonia outbreak associated with a new coronavirus of probable bat origin. Nature. 2020; 579(7798): 270-3.
-
3Worldometer. COVID-19 coronavirus pandemic. 2020. Available from: https://www.worldometers.info/coronavirus/country
» https://www.worldometers.info/coronavirus/country -
4Lu J, du Plessis L, Liu Z, Hill V, Kang M, Lin H, et al. Genomic Epidemiology of SARS-CoV-2 in Guangdong Province, China. Cell. 2020; 181(5): 997-1003.e9.
-
5Li Q, Guan X, Wu P, Wang X, Zhou L, Tong Y, et al. Early transmission dynamics in Wuhan, China, of novel coronavirus-infected pneumonia. N Engl J Med. 2020; 382(13): 1199-207.
-
6Lescure FX, Bouadma L, Nguyen D, Parisey M, Wicky PH, Behillil S, et al. Clinical and virological data of the first cases of COVID-19 in Europe: a case series. Lancet Infect Dis. 2020; 20(6): 697-706.
-
7WHO - World Health Organization. Coronavirus disease 2019 (COVID-19) - Situation Report 39. 2020. Available from: https://www.who.int/docs/default-source/coronaviruse/situation-reports/20200228-sitrep-39-covid-19.pdf?sfvrsn=5bbf3e7d_4.
» https://www.who.int/docs/default-source/coronaviruse/situation-reports/20200228-sitrep-39-covid-19.pdf?sfvrsn=5bbf3e7d_4. -
8Li R, Pei S, Chen B, Song Y, Zhang T, Yang W, et al. Substantial undocumented infection facilitates the rapid dissemination of novel coronavirus (SARS-CoV2). Science. 2020; 368(6490): 489-93.
-
9Silverman JD, Hupert N, Washburne AD. Using influenza surveillance networks to estimate state-specific prevalence of SARS-CoV-2 in the United States. Sci Transl Med. 2020; 12(554): eabc1126.
-
10Deslandes A, Berti V, Tandjaoui-Lambotte Y, Alloui C, Carbonnelle E, Zahar JR, et al. SARS-CoV-2 was already spreading in France in late December 2019. Int J Antimicrob Agents. 2020; 55(6): 106006.
-
11Gonzalez-Reiche AS, Hernandez MM, Sullivan MJ, Ciferri B, Alshammary H, Obla A, et al. Introductions and early spread of SARS-CoV-2 in the New York City area. Science. 2020; 369(6501): 297-301.
-
12Worobey M, Pekar J, Larsen BB, Nelson MI, Hill V, Joy JB, et al. The emergence of SARS-CoV-2 in Europe and the US. bioRxiv. 2020. Available from: https://doi.org/10.1101/2020.05.21.109322
» https://doi.org/10.1101/2020.05.21.109322 -
13Díez-Fuertes F, Iglesias-Caballero M, Monzón S, Jiménez P, Varona S, Cuesta I, et al. Phylodynamics of SARS-CoV-2 transmission in Spain. bioRxiv. 2020. Available from: https://doi.org/10.1101/2020.04.20.050039
» https://doi.org/10.1101/2020.04.20.050039 -
14Dellicour S, Durkin K, Hong S, Vanmechelen B, Martí-Carreras J, Gill M, et al. A phylodynamic workflow to rapidly gain insights into the dispersal history and dynamics of SARS-CoV-2 lineages. bioRxiv. 2020. Available from: https://doi.org/10.1101/2020.05.05.078758
» https://doi.org/10.1101/2020.05.05.078758 -
15Lai A, Bergna A, Caucci S, Clementi N, Vicenti I, Dragoni F, et al. Molecular tracing of SARS-CoV-2 in Italy in the first three months of the epidemic. Viruses. 2020; 12(8): E798.
-
16Gámbaro F, Behillil S, Baidaliuk A, Donati F, Albert M, Alexandru A, et al. Introductions and early spread of SARS-CoV-2 in France, 24 January to 23 March 2020. Euro Surveill. 2020; 25(26): 2001200.
-
17Pybus O, Rambaut A, du Plessis L, Zarebski A, Kraemer M, Raghwani J, et al. Preliminary analysis of SARS-CoV-2 importation & establishment of UK transmission lineages. Virological.org. 2020. Available from: https://virological.org/t/preliminary-analysis-of-sars-cov-2-importation-establishment-of-uk-transmission-lineages/507
» https://virological.org/t/preliminary-analysis-of-sars-cov-2-importation-establishment-of-uk-transmission-lineages/507 -
18Jorden MA, Rudman SL, Villarino E, Hoferka S, Patel MT, Bemis K, et al. Evidence for limited early spread of COVID-19 within the United States, January-February 2020. MMWR. 2020; 69(22): 680-4.
-
19Lorenzo-Redondo R, Nam HH, Roberts SC, Simons LM, Jennings LJ, Qi C, et al. A unique clade of SARS-CoV-2 viruses is associated with lower viral loads in patient upper airways. medRxiv. 2020. Available from: https://doi.org/10.1101/2020.05.19.20107144
» https://doi.org/10.1101/2020.05.19.20107144 -
20Bedford T, Greninger AL, Roychoudhury P, Starita LM, Famulare M, Huang ML, et al. Cryptic transmission of SARS-CoV-2 in Washington State. medRxiv. 2020. Available from: https://doi.org/ 10.1101/2020.04.02.20051417
» https://doi.org/ 10.1101/2020.04.02.20051417 -
21Nadeau S, Vaughan T, Sciré J, Huisman J, Stadler T. The origin and early spread of SARS-CoV-2 in Europe. medRxiv. 2020. Available from: https://doi.org/10.1101/2020.06.10.20127738
» https://doi.org/10.1101/2020.06.10.20127738 -
22Candido D, Claro I, de Jesus J, Souza W, Moreira F, Dellicour S, et al. Evolution and epidemic spread of SARS-CoV-2 in Brazil. Science. 2020; eabd2161. Available from: https://doi.org/ 10.1126/science.abd2161
» https://doi.org/ 10.1126/science.abd2161 -
23Resende P, Delatorre E, Gräf T, Mir D, Motta F, Appolinario L, et al. Genomic surveillance of SARS-CoV-2 reveals community transmission of a major lineage during the early pandemic phase in Brazil. bioRxiv. 2020. Available from: https://doi.org/10.1101/2020.06.17.158006
» https://doi.org/10.1101/2020.06.17.158006 -
24Korber B, Fischer W, Gnanakaran S, Yoon H, Theiler J, Abfalterer W, et al. Tracking changes in SARS-CoV-2 Spike: evidence that D614G increases infectivity of the COVID-19 virus. Cell. 2020; S0092-8674(20): 30820-5.
-
25Mavian C, Marini S, Prosperi M, Salemi M. A snapshot of SARS-CoV-2 genome availability up to April 2020 and its implications: data analysis. JMIR Public Health Surveill. 2020; 6(2): e19170.
-
26Villabona-Arenas CJ, Hanage WP, Tully DC. Phylogenetic interpretation during outbreaks requires caution. Nat Microbiol. 2020; 5(7): 876-7.
-
27Subbaraman N. Why daily death tolls have become unusually important in understanding the coronavirus pandemic. Nature. 2020. Available from: https://doi.org/10.1038/d41586-020-01008-1
» https://doi.org/10.1038/d41586-020-01008-1 -
28Linton NM, Kobayashi T, Yang Y, Hayashi K, Akhmetzhanov AR, Jung SM, et al. Incubation period and other epidemiological characteristics of 2019 novel coronavirus infections with right truncation: a statistical analysis of publicly available case data. J Clin Med. 2020; 9(2): 538.
-
29Verity R, Okell LC, Dorigatti I, Winskill P, Whittaker C, Imai N, et al. Estimates of the severity of coronavirus disease 2019: a model-based analysis. Lancet Infect Dis. 2020 20(6): 669-77.
-
30Idogawa M, Tange S, Nakase H, Tokino T. Interactive web-based graphs of novel coronavirus COVID-19 cases and deaths per population by country. Clin Infect Dis. 2020; 71(15): 902-3.
-
31Maier BF, Brockmann D. Effective containment explains subexponential growth in recent confirmed COVID-19 cases in China. Science. 2020; 368(6492): 742-6.
-
32Pan A, Liu L, Wang C, Guo H, Hao X, Wang Q, et al. Association of public health interventions with the epidemiology of the COVID-19 outbreak in Wuhan, China. JAMA. 2020; 323(19): 1-9.
-
33Flaxman S, Mishra S, Gandy A, Unwin HJT, Mellan TA, Coupland H, et al. Estimating the effects of non-pharmaceutical interventions on COVID-19 in Europe. Nature. 2020; 584: 257-61. Available from: https://doi.org/ 10.1038/s41586-020-2405-7
» https://doi.org/ 10.1038/s41586-020-2405-7 -
34Sanche S, Lin YT, Xu C, Romero-Severson E, Hengartner N, Ke R. High Contagiousness and rapid spread of severe acute respiratory syndrome coronavirus 2. Emerg Infect Dis. 2020; 26(7): 1470-7.
-
35Pellis L, Scarabel F, Stage H, Overton C, Chappell L, Lythgoe K, et al. Challenges in control of Covid-19: short doubling time and long delay to effect of interventions. medRxiv. 2020. Available from: https://doi.org/10.1101/2020.04.12.20059972
» https://doi.org/10.1101/2020.04.12.20059972 -
36Ke R, Sanche S, Romero-Severson E, Hengartner N. Fast spread of COVID-19 in Europe and the US suggests the necessity of early, strong and comprehensive interventions. medRxiv. 2020. Available from: https://doi.org/10.1101/2020.04.04.20050427
» https://doi.org/10.1101/2020.04.04.20050427 -
37Baker RE, Yang W, Vecchi GA, Metcalf CJE, Grenfell BT. Susceptible supply limits the role of climate in the early SARS-CoV-2 pandemic. Science. 2020; 369(6501): 315-9.
-
38Wang M, Jiang A, Gong L, Luo L, Guo W, Li C, et al. Temperature significantly change COVID-19 transmission in 429 cities. medRxiv. 2020. Available from: https://doi.org/10.1101/2020.02.22.20025791
» https://doi.org/10.1101/2020.02.22.20025791 -
39Chiyomaru K, Takemoto K. Global COVID-19 transmission rate is influenced by precipitation seasonality and the speed of climate temperature warming. medRxiv. 2020. Available from: https://doi.org/10.1101/2020.04.10.20060459
» https://doi.org/10.1101/2020.04.10.20060459 -
40Berumen J, Schmulson M, Guerrero G, Barrera E, Larriva-Sahd J, Olaiz G, et al. Trends of SARS-Cov-2 infection in 67 countries: role of climate zone, temperature, humidity and curve behavior of cumulative frequency on duplication time. medRxiv. 2020. Available from: https://doi.org/10.1101/2020.04.18.20070920
» https://doi.org/10.1101/2020.04.18.20070920 -
41Boelle PY, Souty C, Launay T, Guerrisi C, Turbelin C, Behillil S, et al. Excess cases of influenza-like illnesses synchronous with coronavirus disease (COVID-19) epidemic, France, March 2020. Euro Surveill. 2020; 25(14): 2000326.
-
42Bastos LS, Niquini RP, Lana RM, Villela DAM, Cruz OG, Coelho FC, et al. COVID-19 and hospitalizations for SARI in Brazil: a comparison up to the 12th epidemiological week of 2020. Cad Saude Publica. 2020; 36(4): e00070120.
-
43Davis JT, Chinazzi M, Perra N, Mu K, Piontti AP, Ajelli M, et al. Estimating the establishment of local transmission and the cryptic phase of the COVID-19 pandemic in the USA. medRxiv. 2020. Available from: https://doi.org/10.1101/2020.07.06.20140285
» https://doi.org/10.1101/2020.07.06.20140285 -
44Potluri R, Lavu D. Making sense of the global Coronavirus data: the role of testing rates in understanding the pandemic and our exit strategy. medRxiv. 2020. Available from: https://doi.org/10.1101/2020.04.06.20054239
» https://doi.org/10.1101/2020.04.06.20054239 -
45Kissler SM, Tedijanto C, Goldstein E, Grad YH, Lipsitch M. Projecting the transmission dynamics of SARS-CoV-2 through the postpandemic period. Science. 2020; 368(6493): 860-8.
-
Financial support: CNPq, FAPERJ. GB is a recipient of CNPq fellowship for Productivity in technological Development and Innovative Extension (Grant 302317/2017-1) and is funded by grant from FAPERJ (Grant E-26/202.896/2018). DM is member of the Sistema Nacional de Investigadores (National Research System- SNI-ANII, UY).
Publication Dates
-
Publication in this collection
04 Sept 2020 -
Date of issue
2020
History
-
Received
20 Apr 2020 -
Accepted
12 Aug 2020


