Long Term Energy Storage in Highly Renewable Systems
 Jeremy J. Hargreaves
 Ryan A. Jones
- Evolved Energy Research, San Francisco, CA, United States
Increasing penetrations of intermittent renewable energy generation introduce novel balancing and reliability challenges for electricity systems. Mismatches between renewable energy production and electricity demand cause periods of overgeneration and periods of undergeneration. These latter energy deficit periods will result in reliability challenges unless additional balancing solutions are employed. Energy deficits can range from a few hours to days to seasons to years. A least cost energy system will best meet these balancing challenges with diverse investments in energy infrastructure, depending on technology costs, natural resource availability, interconnectedness, and evolving load patterns, including flexible loads. Short-term and long-term storage (LTS) applications may both be part of this portfolio. This study looks at storage in isolation to show the types of tradeoffs present between one storage resource and another in providing balancing services. The best storage technologies to balance the system depend on the duration of deficit events it is designed to mitigate. This paper compares the economics of different storage technology types in providing the range of short-term to long-term storage applications. The results compare quantities of conceptual storage technologies at different price points and quantities of clean gas generation to serve balancing needs as part of a least cost portfolio. We examine the tradeoffs between gas generation with low capital costs but high variable costs when burning clean fuels, and the alternative conceptual storage technologies, showing why clean gas capacity may play a role in least cost resource portfolios in decarbonized electricity systems.
Introduction
Long-term energy storage is an essential component of our current and future energy systems. Today, long-term storage (LTS) is easily accessed: energy sits in the form of hydrocarbons and we “discharge” energy from hydrocarbon reserves but never recharge them – fossil resource consumption that is driving our changing climate. Sustainable energy consumption demands new ways of producing, storing, and consuming energy, underpinned by renewable energy1. Novel balancing and reliability challenges of high renewable energy penetrations define the need for LTS in future energy systems.
Renewable energy is clean, plentiful, increasingly affordable, and the cornerstone of cost-effective decarbonized economies of the future. An inconvenient feature of renewables, however, is lack of dispatchability. Assuming a plurality of annual energy is met by wind and solar in the future, system operators will frequently encounter times when renewable generation exceeds electricity load. Setting aside large dispatchable loads2, this surplus electricity can be stored for use later, or curtailed. At other times when load exceeds renewable generation, stored energy can be discharged. The mismatch that renewables create between customer electric loads and generation requires operational solutions that fall into three categories:
1. Discharging stored energy – increasing energy supply to meet load. Stored energy can take many forms including electrochemical, hydro, kinetic energy, gas, and liquid fuels.
2. Curtailing or storing energy production – decreasing energy supply to meet load. Renewable energy production can exceed load when solar, wind and hydro are plentiful.
3. Flexible loads – increasing or decreasing loads to match the output of renewable resources.
This familiar challenge is a feature of systems with significant renewable penetrations today. Together with fossil generation, electrochemical storage and hydro have been deployed to solve diurnal balancing challenges at current penetrations, with lithium ion batteries taking the lead among electrochemical options for diurnal use cases, offering energy, capacity, and ancillary services benefits.
However, renewable output also varies over longer time scales. Weather events that last for several days or weeks limit renewable production. Because of trends in weather and insolation differences, renewable output varies seasonally, and even annually, particularly for hydro and wind. Residual “net load3” is currently dealt with through dispatch, or “discharge,” of fossil energy. The availability of fossil energy is set to decline as we enforce stricter carbon emissions limits. In this paper we examine the tradeoffs between different energy storage options available to balance a highly renewable and carbon constrained system over the full range of timescales. The concept of the tradeoff we examine is illustrated through a simple thought experiment with low variable cost storage vs. low capital cost storage in section “Conceptualizing the Relative Strengths of Different Storage Options.” We then examine the tradeoffs using a least cost model of the US electricity grid, showing storage investments made as part of a least cost resource portfolio and how storage cost and efficiency impact the solution.
Storage Duration, Capacity, and Frequency of Use
Balancing challenges on different timescales require different types of response from storage, influencing what types of storage technology will best serve the system. Two important elements of the required response that determine the best technology option include duration and frequency of discharge. With diurnal balancing, the duration of discharge necessary is short because the system energy deficit is, by definition, less than 12 h long. In contrast, an extended weather event that shuts down renewable production for several days may only happen a few times a year, but the cumulative energy deficit could be considerable. Over the course of the year, deficit events across a range of durations will occur, driving the choice of storage solutions.
A third element of responding to balancing challenges is capacity, or the maximum size of discharge. Capacity of a fossil generator with effectively unlimited access to stored energy in the form of fossil fuels can be considered constant, regardless of electricity system conditions. Therefore, planning a reliable system with predominantly fossil generation and no carbon constraints is most concerned with peak load, i.e., determining whether there is enough total capacity to meet even the largest loads.
Maintaining reliability in a highly renewable and carbon constrained system becomes more complicated. Stored energy is finite, based on the total energy storage available and the state of charge of that storage, i.e., how much is left in the tank. A battery with 4 h of discharge duration at maximum capacity cannot contribute its full capacity reliably during an energy deficit period of, say, 8 h. The capacity contribution of storage is limited by the energy it has available to release. A highly renewable and carbon constrained system is therefore energy constrained as well as capacity constrained in meeting system reliability needs. Building a reliable system requires options that can respond in both capacity and energy constrained conditions such that a system’s reliability design criteria are met. In highly renewable and carbon constrained systems, the conditions that drive new infrastructure build may not be peak end-use load as is traditionally the case, but long energy deficit periods, where large amounts of stored energy must be released to maintain reliability.
Storage Technology Characteristics
The most cost-effective portfolio of storage will contain different types of storage technology, selected based on their relative strengths and weaknesses in responding to energy deficit events with different capacity, duration, and frequency. Characteristics of storage technologies that determine their value to the system at a basic level include capital cost per MW, capital cost per MWh, variable operating cost, roundtrip efficiency, lifetime, and carbon emissions.
To illustrate the tradeoffs between different storage options, we use two technologies with fundamentally different characteristics. The first is a stylized high capital cost, but low variable cost storage technology. The second technology is gas generation. Gas is a medium of stored energy, and in a 100% clean electricity system gas generation can take the form of hydrogen, biogas, or synthetic gas combustion. Charging these forms of gas storage would involve electrolysis, biomass processing, or electrolysis and methanation of hydrogen using captured carbon, respectively, or some other form of synthetic gas production process. One key advantage to this pathway is that existing gas capacity may be reused in the future with clean fuels, avoiding some cost.
In the earlier juxtaposition of diurnal balancing vs. weather related longer-duration storage need, the tradeoffs that occur between different storage technologies based on the characteristics above are apparent. Diurnal balancing happens frequently so the storage device is cycled frequently, yet the duration of discharge may only be a few hours. The installed storage infrastructure is therefore highly utilized, favoring technologies that have low operating costs and high efficiencies. Longer duration energy deficits due to weather events happen less frequently, but the duration is much longer. The installed storage infrastructure is infrequently utilized, favoring technologies that have lower capital costs.
Conceptualizing the Relative Strengths of Different Storage Options
To introduce the types of tradeoffs between storage technologies with different characteristics we use a simple thought experiment. Though stylized, it demonstrates the reasons why low variable cost and low capital cost technologies are suited to different applications by looking at the two extreme ends of the energy deficit duration range. Assume an electricity system with the following characteristics:
1. Zero annual carbon emissions.
2. An identical daily load shape that peaks at 20 GW and has a load factor of 50% (240 GWh daily energy).
3. 362 days with an identical renewable output shape where supply and demand can be balanced by shifting 40 GWh using a storage device with 10 GW capacity (4 h duration).
4. On the remaining 3 days, the one storm of the year arrives and shuts down all renewable production. In these 72 h, the system needs capacity to meet peak load (20 GW) and 720 GWh to meet the need for energy across the 3 days. Due to the risk of even longer storm events, system planners want at least 10% more energy available than used during this period to ensure reliability.
5. The battery storage technology is available to install for $300/kW and $70/kWh, with 100% efficiency4 and a 15-year lifetime.
6. Gas can be installed for $900/kW at a heat rate of 6,406 BTU/kWh and a 40-year lifetime5.
7. Carbon neutral biogas is available at $20/MMBTU to comply with the zero emissions policy, which assumes:
a. A biogas conversion plant costing $2000/kW-output.
b. Lifetime of 25 years.
c. Capital recovery factor of 0.11.
d. Average utilization of 85%.
e. Fixed O&M of 3% of capital cost per year.
f. Delivered biomass cost of $100/dry-ton ($5.56/GJ).
g. Conversion efficiency of 1.52 GJ biomass per GJ produced biogas.
The above example that assumes identical conditions on 362 days followed by 3-days of fallow renewable production is highly stylized, but it illustrates the varying strengths of low variable cost and low capital cost storage options. Prices are illustrative and battery costs are lower than today to reflect a period sometime in the future with a net zero emissions policy.
We consider two hypothetical situations for gas plants. In the first, the existing gas plants can be repurposed to burn clean gas to satisfy the zero emissions policy. In the second, the existing gas fleet must be retired due to age and further use of gas requires construction of new plants.
Figure 1 shows the relative cost of offering diurnal balancing and dealing with the annual storm event. In the repurposed gas case, the cost is just for the fuel burned. When gas is newly built, annualized capacity investments are added to the fuel cost. Battery costs are also annualized6.
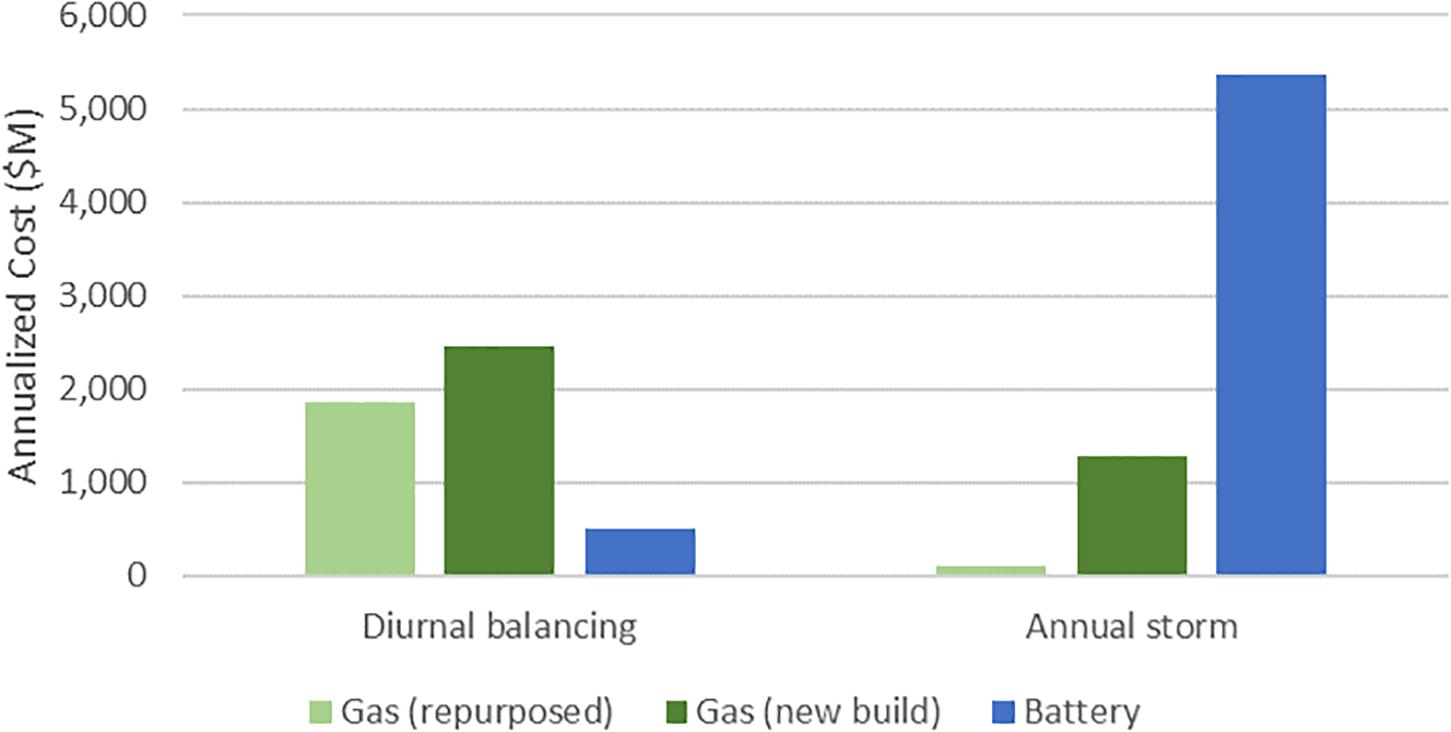
Figure 1. Cost of balancing the electricity grid.
The battery is the clear winner in offering diurnal balancing. The quantity of expensive clean gas needed to offer the same service exceeds the battery cost. Building gas generation from scratch, the capital cost alone exceeds the battery cost. In the annual storm case, the opposite is true. The quantity of fuel burned to balance the system is lower than required for a year of diurnal balancing. However, the quantity of energy required in storage to respond to the storm event is higher. A significant investment in the battery is required to store that much energy, whereas storage costs for clean gas are assumed to be low, utilizing existing gas network infrastructure.
In reality, the dynamics of the tradeoff between different storage technologies are far more complicated. Real-world load and renewable data produce a distribution of storage events with different durations and frequencies. That distribution and the competition between resources changes year by year based on load growth and changes in load pattern, renewable build and composition of the renewable fleet, changes in available technology and technology pricing, changes in fuel prices, emissions policy, and many other factors. These complications are picked up in the next section when we model the competition between storage technologies on the United States grid.
The relatively low quantity of gas required for the storm event means that the cost of clean gas is of secondary importance in this example. Clean gas could be significantly higher in cost and the battery would still be more expensive. While simple, this thought experiment illustrates the fundamental advantage for low variable cost technologies in high utilization storage applications, and for low capital cost technologies in low utilization storage applications. The price of $70/kWh is prohibitively high for the conceptual storage device to compete in LTS applications. In the above example, the capital cost of the battery is 3× cheaper than for the gas power plant (300/kW vs. 900/kW), however, the cost of providing 720 GWh in sustained peaking capability is 18× higher for the battery on a $/kWh basis than for the gas plant. The question becomes how would a storage technology with reduced $/kWh costs compete against gas in offering LTS services?
In the next section we investigate this question. The conceptual storage technology is redesigned with low $/kWh options and modeled in the context of a real system using a capacity expansion planning model to capture the more complex interactions between resources, loads, and across time. We show at different price points and efficiencies for the storage technology how much would be adopted as part of a least cost resource portfolio.
Battery Adoption in Least Cost Portfolio Planning
Background
To illustrate the tradeoffs while considering the complex dynamics of planning a real electricity system over time, we model the United States electricity grid from 2020 through 2050 on the trajectory to net zero emissions shown in Figure 2 Left. We use the Regional Investment and Operations (RIO) and EnergyPATHWAYS (EP) models developed by Evolved Energy Research to investigate least cost electricity infrastructure investments and operations over time as we change the cost of storage7.
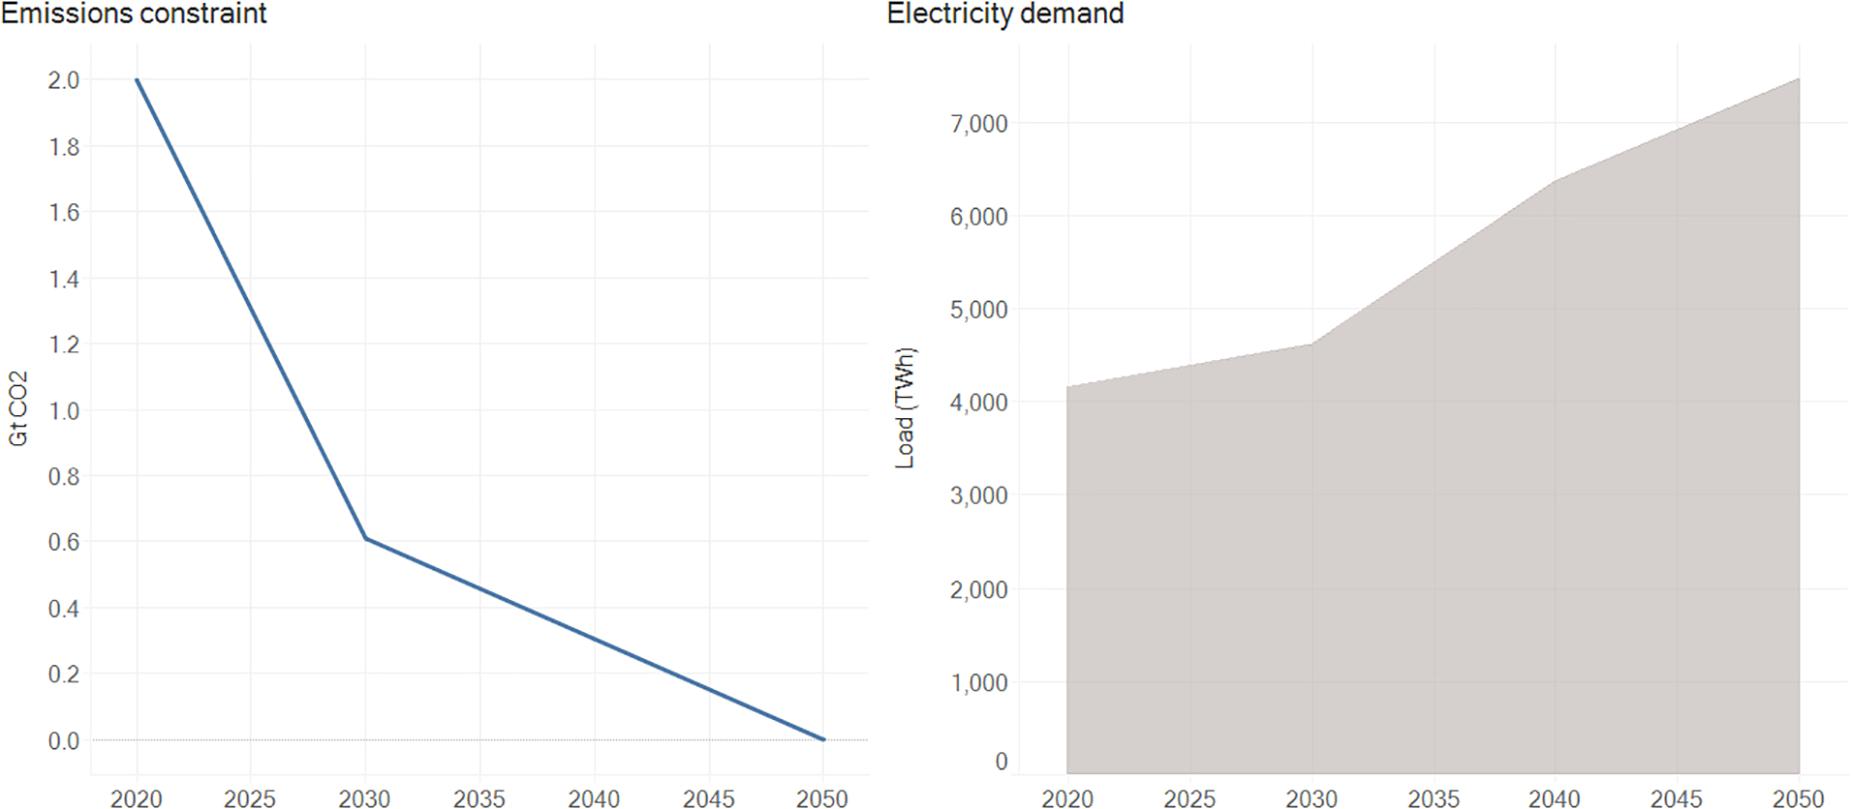
Figure 2. Left: United States emissions constraint. Right: Electricity load growth.
EnergyPATHWAYS8 is a bottom-up energy sector model with stock-level accounting of all energy infrastructure. EP was specifically built to explore a range of potential energy system transformations. On the demand side, EP represents the stocks of all energy consuming technologies across all sectors of the economy. This includes the type of technology and vintage, for example vehicles or appliances in homes or businesses, their efficiencies, and the service demand for the service they provide. Assumptions on sales of new equipment that replace these technologies changes the overall stock over time, changing fleet characteristics such as efficiencies and fuel sources. For example, an increasing proportion of internal combustion vehicles may be replaced upon retirement with electric vehicles over time, increasing overall energy efficiency and switching final energy demand from gasoline to electricity. By tracking the stocks of technologies in the economy, EP acts as a detailed accounting system to determine cost and energy implications of detailed user scenario decisions.
For this study, we have assumed aggressive demand side measures to reduce energy consumption and electrify technology stocks. The net result of these assumptions is that final energy demand for electricity grows from 3,775 TWh in 2020 to 7,000 TWh in 2050 (Figure 2 Right). Fuel based final demand, including feedstocks, falls from 52 quads to 25 quads. To reach this level of transformation, 96% of on road transportation service demand is met with electricity or hydrogen, 89% of building energy consumption is electrified, and aggressive efficiency measures are applied across industry and aviation. These assumptions are not central to this paper’s conclusions on long duration storage, but do create an important backdrop of rapid electricity growth that is consistent with net-zero emissions scenarios for the U.S. by 2050.
The Regional Investment and Operations model takes the energy demands produced in EP as inputs. RIO determines what the least cost way of serving the economy’s energy needs are, including decisions on infrastructure investment in the electricity grid, conventional and decarbonized fuels, and the infrastructure required to produce and transport those fuels. The model blends capacity expansion and sequential hourly system operations to effectively capture the value each resource can offer the system as part of an optimally dispatched portfolio. When investigating storage at different price points and efficiencies in the next section, the resulting storage build is part of a least cost resource portfolio to reach the decarbonization goals. As storage prices change, the build of other resources in the portfolio, such as the location and quantity of renewables over time, will also change as economic dependencies between resources shift with changing storage prices.
In contrast to the assumed equilibrium of conditions experienced every year by the storage resources in the thought experiment above, the model captures dynamics over the lifetime of each resource in a changing system. Emissions policy, fuel and technology pricing, and electricity demands are example changes that a resource will experience over its lifetime. Resources are also part of a complex system geographically, with diversity of load and resource potential between regions interconnected by transmission. The model identifies least cost investments in the context of this complex system and changing conditions.
A feature of the model we draw upon in the investigation below is the ability to optimally invest in LTS resources. The model tracks energy storage reservoirs across each modeled year, determining the least cost portfolio investment in storage capacity and energy. A part of this feature is evaluating the contribution of storage toward maintaining reliable system operations. As described above, reliability in highly renewable systems becomes dependent on not only capacity, but energy as well. Storage needs enough state of charge in energy deficit events to contribute to reliability as well as provide energy.
While the model can determine optimal investment in all resource types and their associated infrastructure, including energy storage such as hydro, hydrogen, synthetic fuels production, and novel battery chemistries, in this example we have limited storage investment to gas capacity and a set of conceptual storage technologies of varying price and efficiency. Gas has the option of burning fossil gas or a carbon neutral gas at $20/MMBtu9, representing the low capital cost, high variable cost storage option.
In this example system, the goal for the United States is to achieve zero carbon emissions from electricity by the year 2050. The trajectory to reach that goal has steeper declines in the early years, acknowledging: (1) coal to gas switching opportunities for large emissions savings; and (2) staying on a straight-line emissions reductions path between now and 2050 requires frontloading emissions reductions in electricity while sales shares of efficient and electric technologies grow elsewhere (Haley et al., 2019).
The model is populated with the latest publicly available data on resource costs, potentials, operating characteristics such as renewable production shapes by location, transmission capacity and cost of expansion, and fuel costs. The sources drawn upon for these inputs are listed in Table 1. Load growth was determined through detailed modeling of demand side technology stocks, their lifetimes, and sales of new technology on replacement using the EP model. Though not central to the analysis conducted in this paper, the modeled load growth used gives a realistic projection for a cost-effective pathway to zero emissions economy wide by 2050.
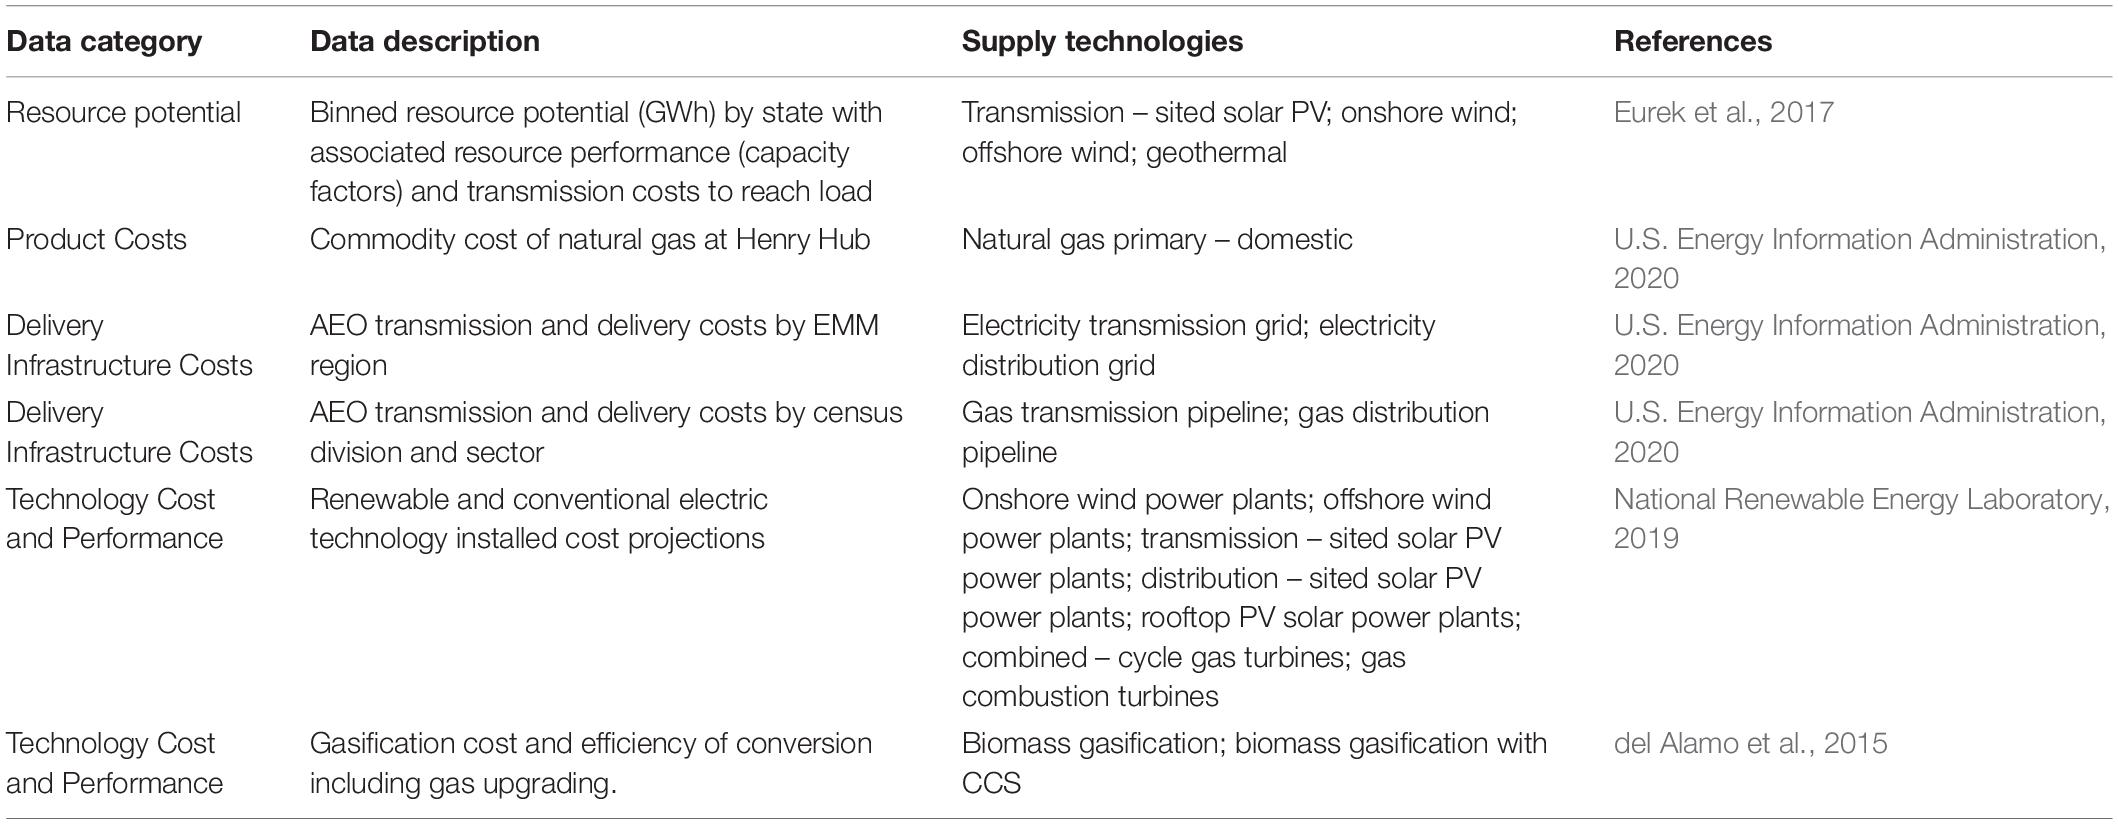
Table 1. Resource and technology data sources.
Problem Statement
To clearly show the tradeoffs between storage resources, the model is limited to investing in three resource types as loads grow, load and net load patterns change, and existing resources retire. These include renewable generation such as wind and solar, gas generation, either combined cycle or combustion turbine, fueled by fossil gas or clean gas, and a conceptual LTS technology of varying characteristics. We assume that LTS technologies can ramp to full charge or discharge within an hour. Some future LTS technology may not be able to meet this requirement, in which case they may be supplemented with faster responding resources if necessary for system operations.
The problem is narrowly defined to investigate the competitiveness of LTS against carbon neutral gas generation. To focus on this tradeoff, we have omitted the option to invest in large, flexible industrial loads such as electrolysis from the analysis. We often find these are cost effective for reducing both short-term and long-term balancing challenges in decarbonized systems and can reduce the need for LTS and gas generation. In this respect, the analysis in this paper presents an upper bound on the need for LTS and gas that may have otherwise been reduced through using flexible loads for balancing the grid.
We investigate how much of the gas resource vs. LTS is part of the least cost resource portfolio in meeting the zero emissions target by 2050 as we drop the price of the generic storage resource. By doing so we characterize the competition between high capital cost, low variable cost, and low capital cost, high variable cost storage resources in providing services for reliable electricity system operations.
The costs of the gas generation and generic storage options are shown in Table 2. Each combination of $/kW and $/kWh capital costs, and efficiency, shown for LTS constitutes a different cost scenario. In total we ran 24 different storage cost scenarios. Fuel cost assumptions are shown in Table 3. In reality, multiple different storage technologies with varying costs will be available and may be suited to providing different types of service. If LTS offers LTS services as part of a least cost portfolio, it will also offer short-term storage services. However, if LTS is not part of the least cost portfolio, a shorter duration storage technology, like lithium ion deployments on the current electricity grid, may cost effectively offer diurnal balancing services. At lower efficiencies for LTS, higher efficiency short duration storage options may also be part of a least cost resource portfolio. For simplicity of presenting the LTS tradeoffs in this analysis however, we model only one long term storage pricing option at a time.
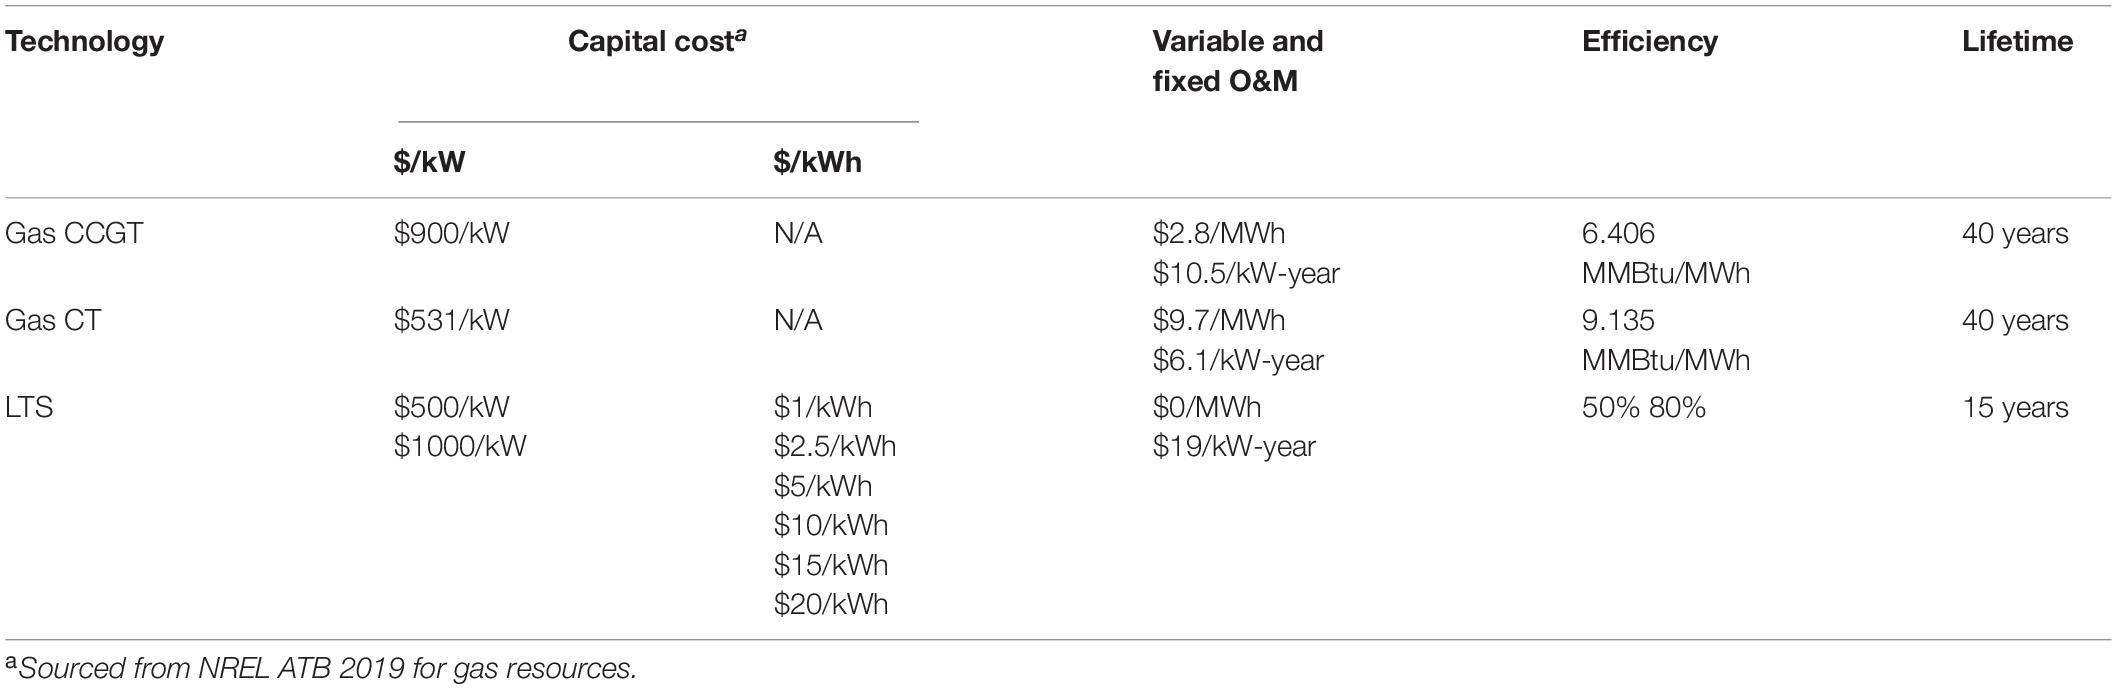
Table 2. Cost assumptions for gas and LTS.
Table 3. Fuel cost assumptions.
Results and Discussion
Investment outcomes depend on changing system conditions over resource lifetimes; therefore, all years are important in determining capacity present in any single year. However, it is also useful to look at 2050 to compare the relative success of gas vs. LTS at the point of zero carbon emissions.
Figure 3 shows the total capacity and duration of LTS built at varying LTS capital costs and efficiencies. The left-hand axis and bar chart shows the total number of GWs of LTS present in 2050, while the right-hand axis and line chart shows LTS duration. Figure 4 shows the corresponding CCGT and CT capacity build and Figure 5 shows the utilization of the gas fleet.
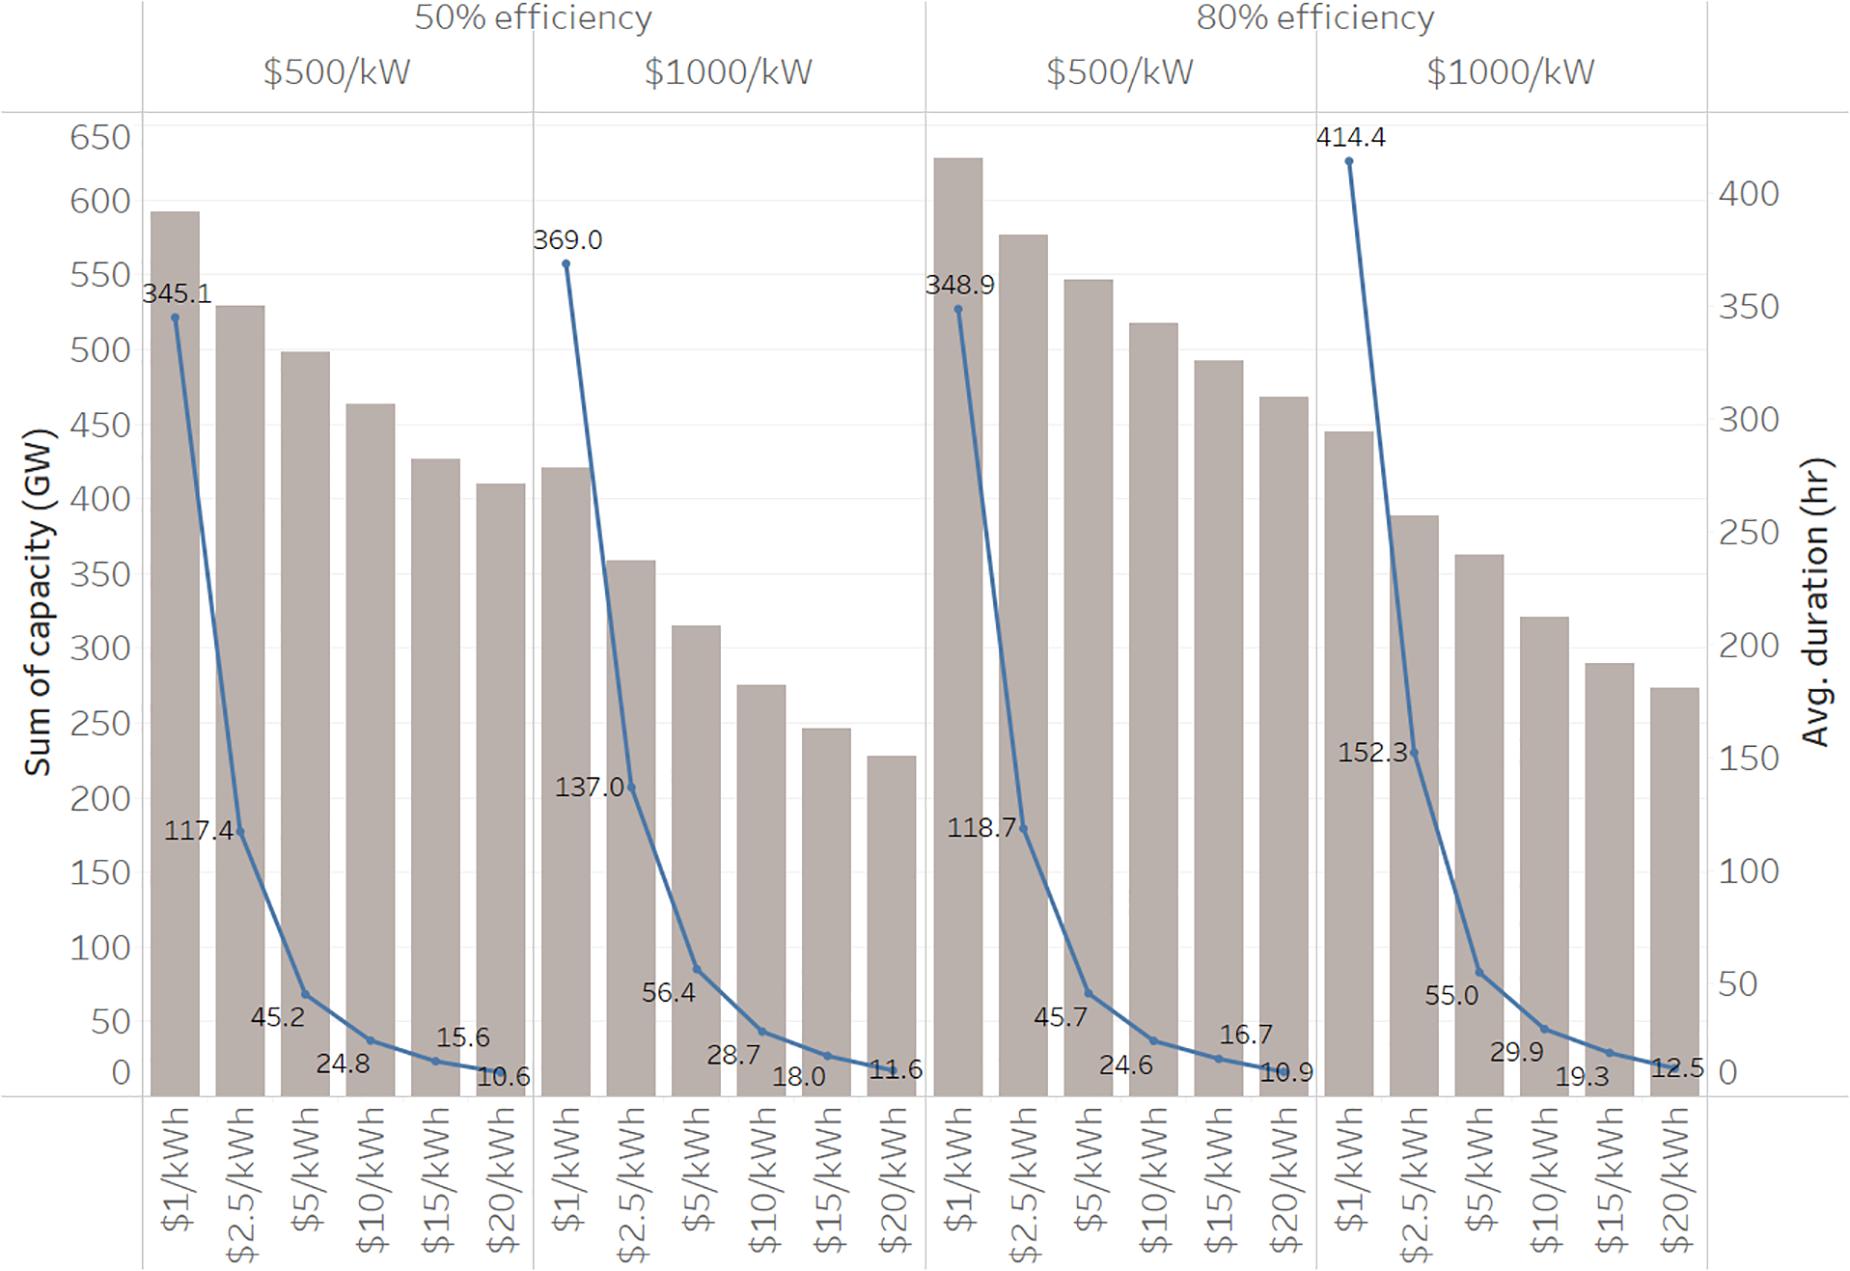
Figure 3. LTS capacity and duration in 2050 at different LTS costs (top labels: efficiency and $/kW cost, bottom labels: $/kWh cost).
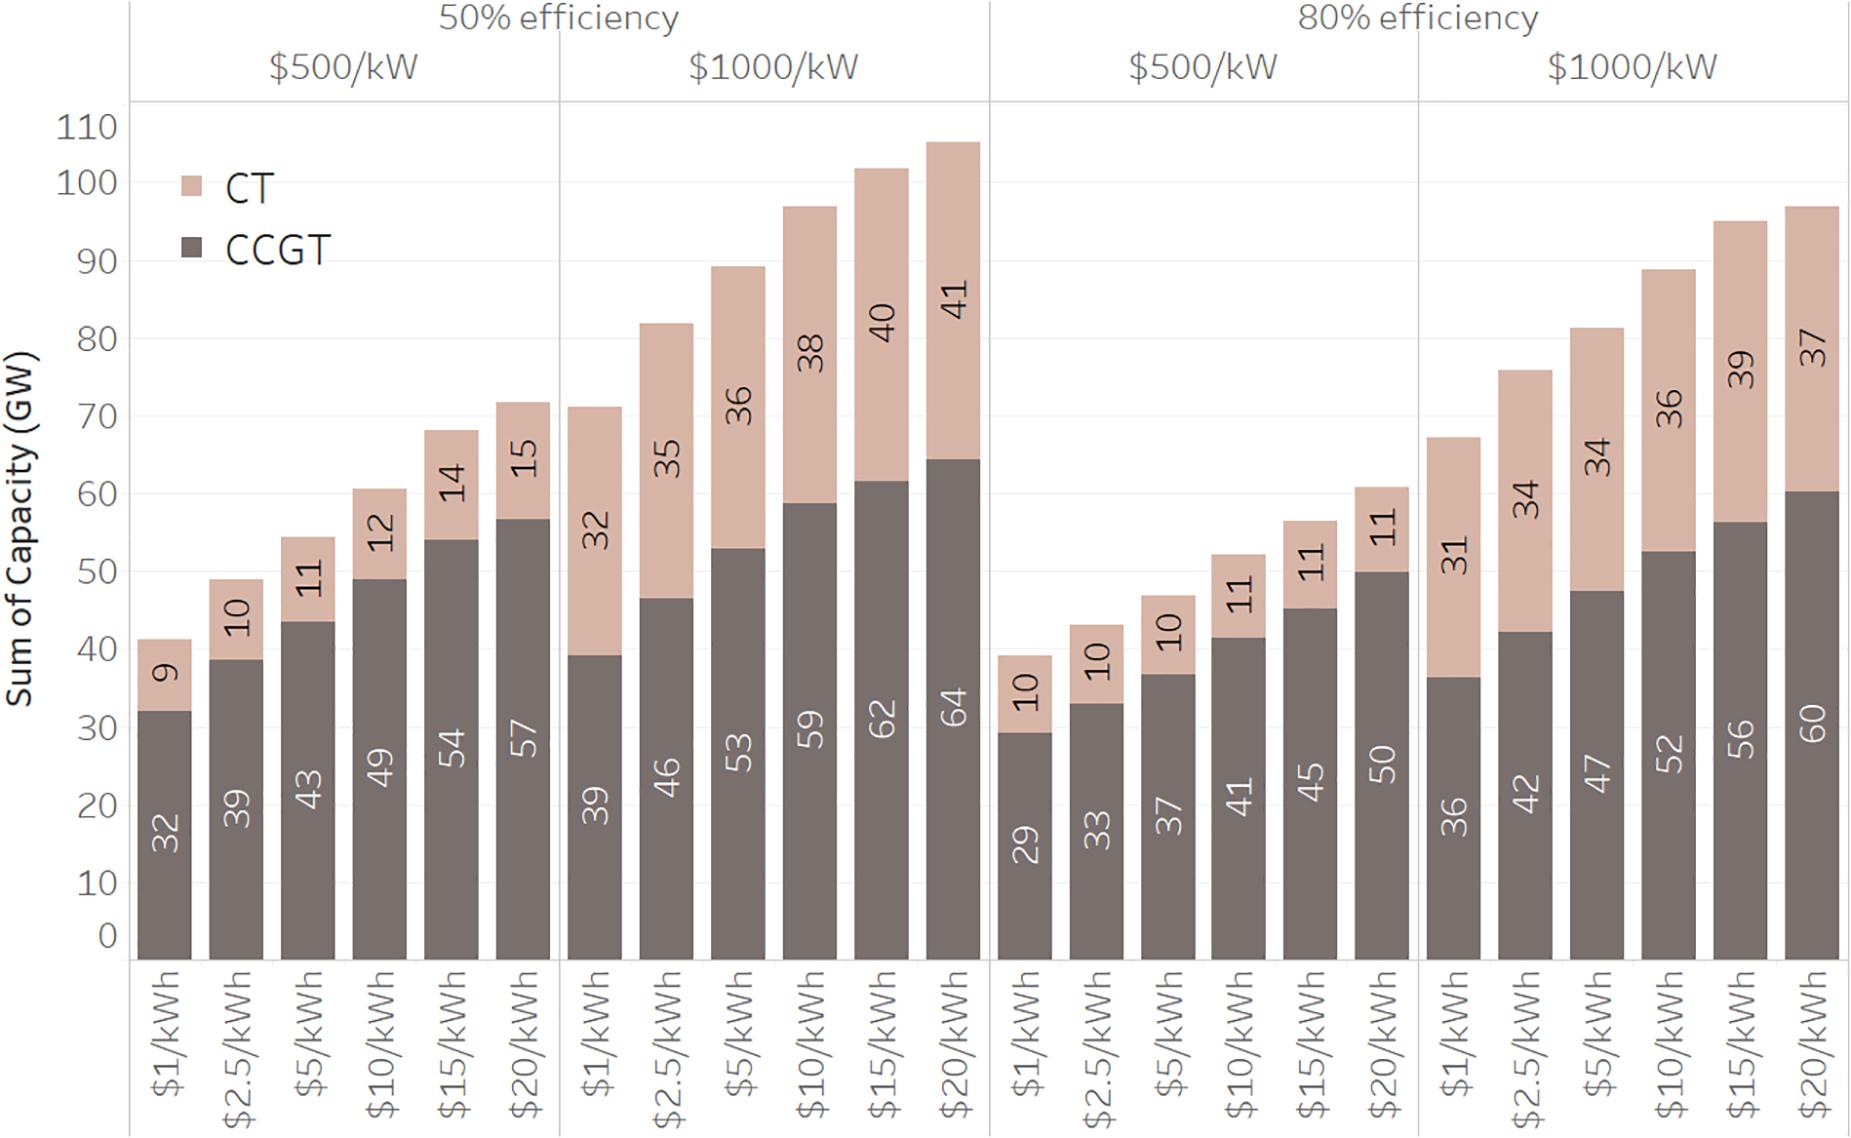
Figure 4. Gas capacity in 2050 at different LTS costs (top labels: efficiency and $/kW cost, bottom labels: $/kWh cost).
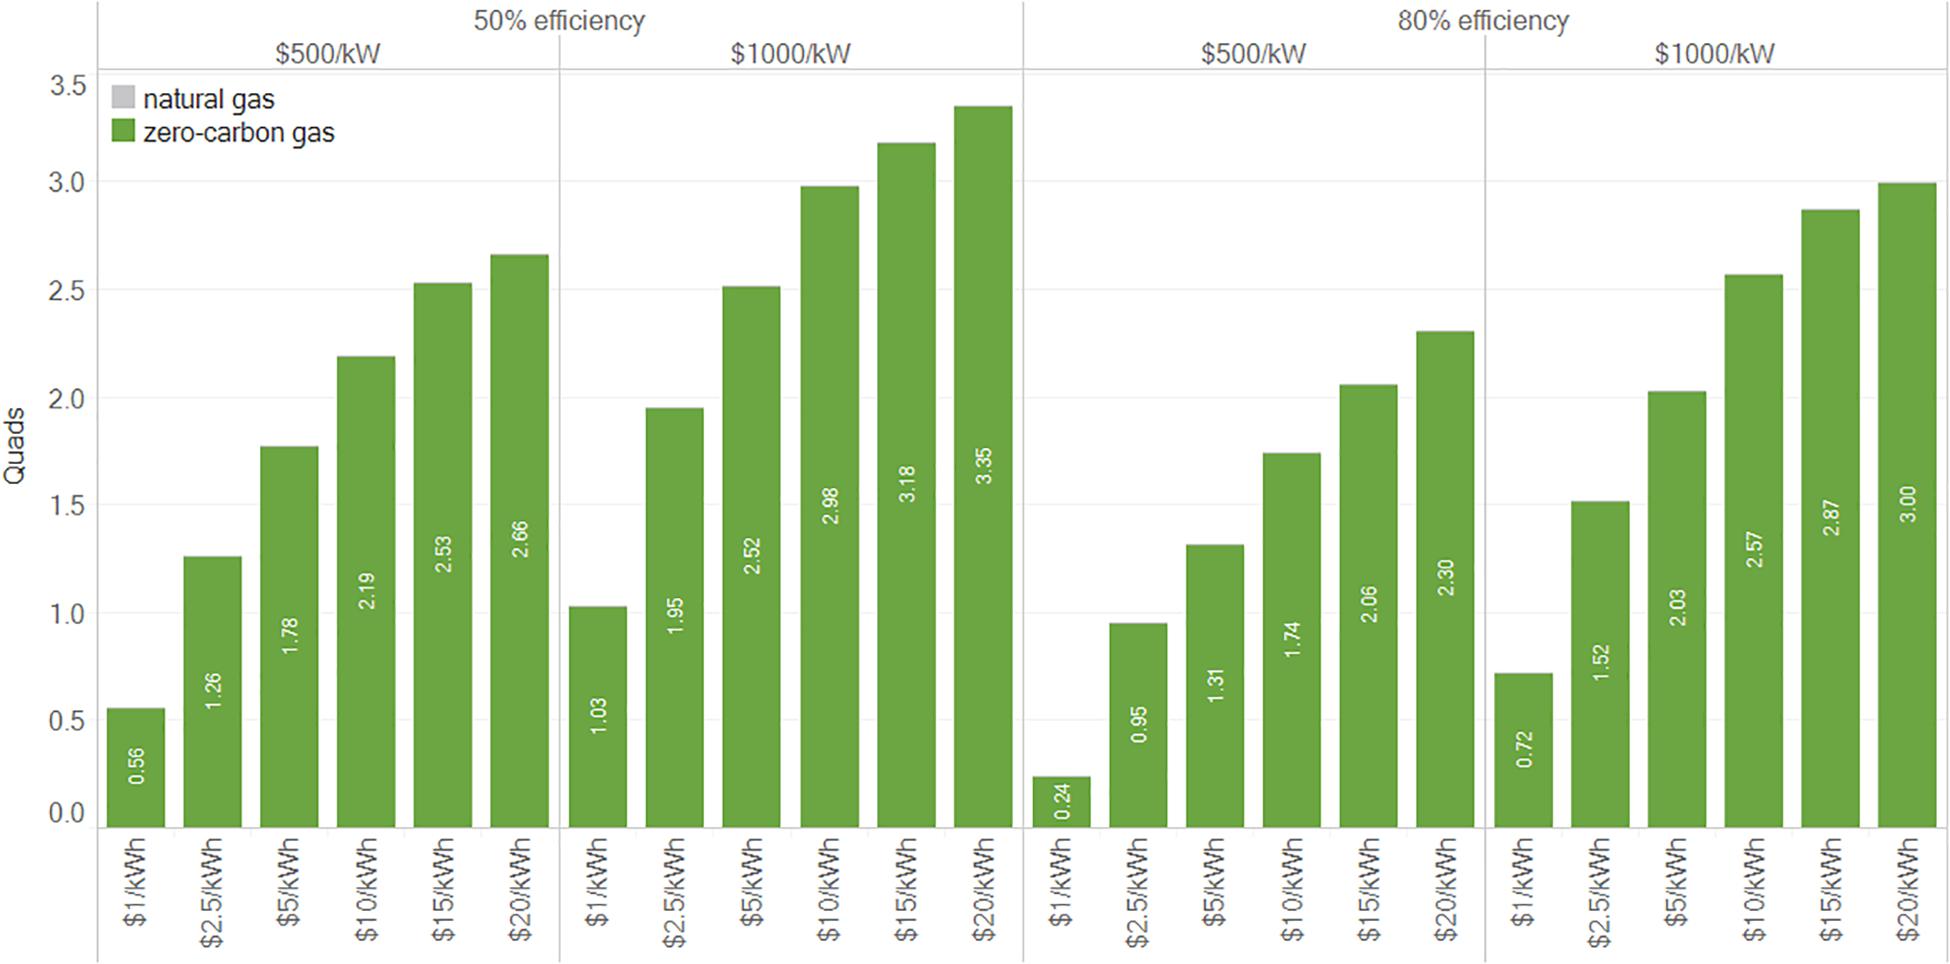
Figure 5. Clean gas utilization in 2050 at different LTS costs (top labels: efficiency and $/kW cost, bottom labels: $/kWh cost).
Long term storage, whether gas or the conceptual LTS resource, offers energy and capacity to the system to maintain reliability during long-duration energy deficit periods. As discussed in the previous section, longer, infrequent energy deficit events favor low capital cost resources because the capacity is seldom used, incurring fewer variable costs. Variable costs become more important in shorter duration events that occur with greater frequency. These results illustrate this concept.
When the capital cost is $20/kWh, the model selects LTS with 10–12 h duration, demarking the duration at which a storage resource can go through a single charge and discharge cycle in a day (diurnal balancing) from the storage duration where cycling behavior extends over multiple days.
As LTS $/kWh costs are reduced, durations steadily increase, displacing gas capacity and gas utilization. Below $5/kWh storage durations selected by the model increase significantly from 45 h at $5/kWh to 345 h at $1/kWh ($500/kW and 50% efficiency). However, even with significantly increased durations, LTS does not have a proportional impact on gas capacity. Each new increment of avoided gas capacity requires an LTS technology with a longer discharge duration than did the last increment because of a long tail of reliability events with progressively longer durations that form the proximal tradeoff point between LTS and thermal capacity. Gas capacity contributes close to nameplate, regardless of event duration with a single $/kW capital cost investment (existing gas infrastructure means gas plants are effectively unconstrained by sequential run hours). LTS, on the other hand, requires the same capacity investment, but also an energy (kWh) investment necessary to respond to the worst-case net load events, requiring a progressively decreasing $/kWh cost to compete against gas on the margin.
The story for gas power plant run hours is different than that of gas capacity. As can be seen in Figure 5, gas generation at $1/kWh for LTS almost never generates, so incurs very little variable cost, but ensures enough dependable capacity to maintain system reliability. Rather than fully displacing gas capacity build, LTS at less than $5/kWh is largely displacing consumption of fuel. At such low costs, it is more economic to build additional LTS energy storage, store renewable energy and discharge it than to burn clean gas.
Efficiency of 80 vs. 50% has more impact on LTS build proportionally at costs of $20/kWh than at costs of $1/kWh. This is because of the LTS duration and the resulting operating regime – energy deficit events of short duration are more frequent than longer duration events. Since the 12th hour of storage is utilized far more frequently than the 300th hour of storage, lost energy is a larger component of its total costs and efficiency has a greater impact on cost effectiveness at low durations. Even at longer durations a portion of the LTS capacity is used for more frequent, shorter duration events, such as diurnal balancing. Efficiency differences are impactful on this portion of the storage device and lead to slightly lower total investment in the 50% efficiency case than the 80% case at $1/kWh.
Conclusion
We have shown that short-term balancing challenges are best served by low variable cost resources (high-efficiency short-duration storage) whereas long-term balancing challenges with infrequent cycles favor low capital cost resources (thermal gas). The Advanced Research Projects Agency-Energy (ARPA-E) has targeted LTS devices that can provide between 10 and 100 h of storage with a levelized cost of 5 cents/kWh or less (Tuttman and Litzelman, 2020). A known issue demonstrated again in this paper, is that as the duration of the storage device increases, its utilization declines, which then makes low levelized cost of storage targets increasingly difficult to achieve. Our analysis shows that competitiveness for a storage device with between 10 and 100 h of storage occurs at a marginal capital cost of between $20/kWh and $2.5/kWh (the longer duration storage requires a lower energy cost to stay competitive due to the declining hours of utilization as stated above). These $/kWh capital cost targets are aggressive. In flow batteries, for example, just the tank to hold electrolytes may take up a significant portion of this cost. In addition, for several reasons10, our analysis may represent a best-case scenario for LTS deployment. This demonstrates the low target prices LTS must achieve to be cost competitive at durations greater than ∼24 h.
Our analysis has shown that efficiency is of secondary importance to LTS when competing with thermal gas and its importance declines further as renewables continue to become cheaper. We’ve also demonstrated that lower cost storage is more effective at reducing the run-hours of thermal powerplants rather than offsetting the need for thermal capacity for reliability. This raises questions about the ongoing need for thermal capacity and whether advocacy for rapid retirement reflects the lowest cost pathway to a low carbon electricity system, or simply an attribution of carbon emissions to plant capacity rather than energy (i.e., recognizing that a power plant that runs only a handful of hours doesn’t produce many emissions but can still play an important reliability role).
Finally, the dynamics of sustained peaking capability in high renewable systems and the interaction between LTS and reliability is still at a nascent stage in planning, operations, and electricity markets. On the planning side, models that can evaluate loss of load probability with energy-limited resources must be developed before resource planners will feel confident in their dependability (models that study reliability in high hydro systems are the closest analog today, but LTS is more constrained than hydro in system operations). System operators need to develop the forecasting capability and operational heuristics that allow an LTS resource to provide value on a diurnal basis without compromising its longer-term role in reliability. And markets will need to develop capacity products of different durations or ensure sustained peaking capability is adequately incentivized under an energy-market-only structure. The question of planning, operations, and markets also extends to the use of carbon neutral gas. Our analysis assumes that gas storage and delivery infrastructure is available, given the extensive gas transmission and distribution network that exists today. However, markets and operations of this network will look different in a decarbonized future with new, sustainable gas sources and potentially significant levels of electrification in formerly gas consuming end uses.
Each of these questions will require further research, which can in turn help inform technology targets for LTS. This paper has taken a small step toward this end by contextualizing the role for LTS in future power systems with different cost sensitivities and has indicated that LTS must meet a difficult set of design criteria to be relevant in zero-carbon power systems.
Data Availability Statement
The raw data supporting the conclusions of this article will be made available by the authors, without undue reservation, to any qualified researcher.
Author Contributions
JH wrote the manuscript and worked with RJ on the setup of the analysis conducted with the RIO model. RJ conducted the RIO modeling work, developed results graphics, and provided edits to the manuscript. Both authors contributed to the article and approved the submitted version.
Conflict of Interest
The authors are principals at the company Evolved Energy Research. The authors declare that the research was conducted in the absence of any commercial or financial relationships that could be construed as a potential conflict of interest.
Footnotes
- ^ In the context of this paper, “renewables” is primarily a reference to the variable generation resources of wind and solar due to their low cost and relative abundance.
- ^ Examples include electrolysis, electric steam production, or desalinization. These loads are ignored in this paper for an easier conceptual comparison between electricity balancing strategies.
- ^ The difference between gross load and renewable production.
- ^ Perfect efficiency assumed to simplify the example.
- ^ A 2020 vintage gas combined cycle plant sourced from NREL Annual Technology Baseline 2019, https://atb.nrel.gov/electricity/2019/.
- ^ We assume a cost of capital of 6%.
- ^ Further details of the Regional Investment and Operations model are included in https://docs.wixstatic.com/ugd/294abc_95dfdf602afe4e11a184ee65ba565e60.pdf.
- ^ EnergyPATHWAYS is an open-source modeling framework maintained by Evolved Energy Research. Databases used in analyses conducted with the EnergyPATHWAYS source code can public or maintained as proprietary. More detail can be found here: https://github.com/energyPATHWAYS/energyPATHWAYS.
- ^ See assumptions in section “Conceptualizing the Relative Strengths of Different Storage Options” for derivation of this fuel price.
- ^ The reasons to believe this analysis may be a best-case scenario for storage economics include: (1) The omission of large flexible industrial loads from fuels and electricity coupling (e.g., hydrogen electrolysis). Flexible load hurts the competitiveness of LTS because it creates competing economic uses for excess renewable generation needed for LTS charging and allows economic overbuild of renewables that helps in stretches of fallow renewable output where LTS or gas would otherwise be needed. (2) The analysis did not address multiple weather years and whether appropriate conservatism in operations and planning for the tails of the distribution on persistent renewable deficits mean that fewer gas plants are avoidable than shown in the analysis. (3) The zero emissions target in electricity did not include sequestration or compliance flexibility with the rest of the economy, both of which have the ability to reduce the marginal cost of fuel below the $20/MMBtu assumed. These three factors were not included in the analysis because it makes the basic illustration between low capital cost vs. low variable cost resources more difficult.
References
del Alamo, G., Sandquist, J., Vreugdenhil, B. J., Aranda, A. G., and Carbo, M. (2015). Implementation of Bio-CCS in Biofuels Production.” IEA Bioenergy Task 33 Special Project ISBN 978-1-910154-44-1. IEA Bioenergy. Available online at: https://www.ieabioenergy.com/wp-content/uploads/2018/08/Two-page-summary-Implementation-of-bio-CCS-in-biofuels-production-IEA-Bioenergy-Task-33-special-report.pdf (accessed August 23, 2020).
Eurek, K., Cole, W., Bielen, D., Blair, N., Cohen, S., Frew, B., et al. (2017). “Regional Energy Deployment System (ReEDS) Model Documentation: Version 2016.” NREL/TP-6A20-67067. Golden, CO: National Renewable Energy Laboratory. doi: 10.2172/1332909
Haley, B., Jones, R., Kwok, G., Hargreaves, J., Farbes, J., and Williams, J. (2019). 350 PPM Pathways for the United States”. Evolved Energy Research. Available online at: https://www.ourchildrenstrust.org/350-ppm-pathways (accessed August 23, 2020).
National Renewable Energy Laboratory (2019). Annual Technology Baseline. Golden, CO: National Renewable Energy Laboratory.
Tuttman and Litzelman (2020). Why Long Duration Energy Storage Matters. Advanced Research Projects Agency – Energy (ARPA-E). Available online at: https://arpa-e.energy.gov/?q=news-item/why-long-duration-energy-storage- matters (accessed August 23, 2020).
Keywords: energy policy, energy storage, battery storage, electricity planning, capacity expansion, least cost planning, renewable energy, deep decarbonization pathways
Citation: Hargreaves JJ and Jones RA (2020) Long Term Energy Storage in Highly Renewable Systems. Front. Energy Res. 8:219. doi: 10.3389/fenrg.2020.00219
Received: 18 April 2020; Accepted: 10 August 2020;
Published: 03 September 2020.
Edited by:
Zhiwen Ma, National Renewable Energy Laboratory (DOE), United StatesReviewed by:
Nate Blair, US National Renewable Energy Laboratory, United StatesJosh Eichman, National Renewable Energy Laboratory (DOE), United States
Copyright © 2020 Hargreaves and Jones. This is an open-access article distributed under the terms of the Creative Commons Attribution License (CC BY). The use, distribution or reproduction in other forums is permitted, provided the original author(s) and the copyright owner(s) are credited and that the original publication in this journal is cited, in accordance with accepted academic practice. No use, distribution or reproduction is permitted which does not comply with these terms.
*Correspondence: Jeremy J. Hargreaves, jeremy.hargreaves@evolved.energy