


Abstract
The Cumberland drill sample from the Sheepbed mudstone in Gale Crater, Mars, revealed the first evidence of an indigenous Martian organic molecule, chlorobenzene, with the Sample Analysis at Mars (SAM) instrument on Curiosity. We created in the laboratory a mineralogical analog of the Cumberland sample (CBA) to aid in the understanding of the precursor organic molecule(s) that led to the detection of chlorobenzene. The CBA was analyzed by visible/near-infrared spectrometry, and the results are in accordance with Mastcam multispectral and the Chemical Camera passive analyses of Cumberland on Mars, demonstrating that the CBA is a relevant analog. CBA aliquots were spiked with 0.5 wt. % of benzoic acid and 1–2 wt. % of magnesium perchlorate and were run in SAM Testbed (TB). The TB evolved gas analysis (EGA) showed similarities with the Cumberland EGA on Mars in terms of the major volatiles H2O, CO2, and O2. The TB gas chromatography mass spectrometry displayed the presence of chlorobenzene at 23–28 pmol and dichlorobenzene. CBA aliquots were also analyzed in the laboratory with SAM-like EGA and the results on the laboratory setup confirmed the generation of chlorobenzene by a reaction between the benzoic acid and the magnesium perchlorates. The case for benzoic acid as a potential precursor for the chlorobenzene detected in the Martian regolith is strengthened with this new supporting laboratory data from the CBA. The quantification of chlorobenzene in the TB led to prediction of organic precursor abundance on Mars of hundreds, if not thousands, of parts per millions by weight.
Export citation and abstract BibTeX RIS

Original content from this work may be used under the terms of the Creative Commons Attribution 4.0 licence. Any further distribution of this work must maintain attribution to the author(s) and the title of the work, journal citation and DOI.
1. Introduction
The Mars Science Laboratory (MSL) Curiosity rover carries a suite of instruments that provide complementary geochemical and mineralogical data to investigate the possibility of habitable conditions throughout Martian history (Grotzinger et al. 2012). The Chemistry and Mineralogy (CheMin; Blake et al. 2012) instrument employs X-ray diffraction (XRD) for identification and quantification of crystalline mineral phases. The Chemical Camera (ChemCam; Maurice et al. 2012; Wiens et al. 2012) is a laser-induced breakdown spectroscopy (LIBS) instrument that can measure the chemical compositions of the target and—when used without firing the laser–retrieve its reflectance in the 400–840 nm region (i.e., the visible/near-infrared (VNIR)). This wavelength range shows spectral features of iron-bearing oxides, pyroxenes, and calcium sulfates (Johnson et al. 2015). Mastcam (1600 × 1200 pixel) uses an eight-position filter wheel of broadband near-infrared cutoff filter for red green blue Bayer imaging and 12 narrow band geology filters distributed between the two cameras, spanning the 445–1013 nm wavelength range (Bell et al. 2012; Wellington et al. 2017). The Sample Analysis at Mars (SAM; Mahaffy et al. 2012) instrument suite is devoted to the analysis of organic and inorganic compounds from Mars atmosphere and Mars' subsurface. All of the instruments have been successfully working since MSL landed in Gale Crater in 2012.
The Cumberland (CB) sample was drilled on sol 279 from the Sheepbed mudstone, which constitutes the lowest exposed member of the Yellowknife Bay formation (Grotzinger et al. 2014). It was subsequently analyzed by MSL instruments between sols 282 and 408 (Vaniman et al. 2014; Freissinet et al. 2015; Jackson et al. 2016). ChemCam was able to investigate compositional changes with depth inside the drill hole. Little to no variation in chemistry was detected. The contribution of alteration materials in the drill tailings was also assessed. The first evidence for an indigenous Martian organic molecule, chlorobenzene (C6H5Cl), was identified by SAM during pyrolysis gas chromatography mass spectrometry (GCMS) of this sample (Freissinet et al. 2015). Although it cannot be entirely ruled out that the chlorobenzene was present as such in the Mars sample, its high volatility at Mars ambient conditions (Hodgman 1963) has led to the conclusion that chlorobenzene was formed in the SAM oven from a reaction between a Martian organic precursor and a Martian oxychlorine phase. Laboratory support experiments demonstrated that the chlorine released from the perchlorates replaces more electronegative functional groups, such as alcohols or carboxylic acids, but does not easily substitute for H or methyl groups (Miller et al. 2013). In other words, benzene (C6H6) and toluene (C7H8) are not good precursor candidates, while phenol, benzoic, phthalic, and mellitic acids (C6H6O, C7H6O2, C8H6O4, and C12H6O12, respectively) are (Miller et al. 2016). To test the hypothesis of benzoic acid as a precursor molecule in similar conditions (mineralogical and instrumental) as those carried out on Mars, we created an analog of the CB (CBA) sample and performed the experiment on the SAM Testbed (TB).
The SAM TB is a duplicate of the Flight Model (FM) currently on board the Curiosity rover in Gale Crater, Mars. The TB is placed in a Mars chamber at the NASA Goddard Space Flight Center, simulating the thermal and atmospheric conditions at Gale Crater. The TB is designed to test SAM's components in Mars-like conditions, providing high-fidelity boundary conditions with interfaces developed to recreate how SAM's components are mounted in the spacecraft (Malespin et al. 2016).
The mineralogical CBA sample was created in the laboratory. It was based on mineral abundances determined by the CheMin instrument (Vaniman et al. 2014) (Figure 1). A later update to the CB mineralogy was published in 2018, in which the CheMin team no longer includes pyrrhotite, ilmenite, or halite in the CB composition (Morrison et al. 2018). Although the CBA was based on the first characterization from 2014, the low abundance of those three additional minerals would negligibly impact our work. The CBA mixture includes 14 minerals that were individually characterized by XRD, an evolved gas analysis (EGA), and GCMS. These analyses were also used to account for any trace mineral and organic components in the individual component minerals. The CBA includes several key components such as a fine-grained palagonite material (Morris et al. 2001) to represent the poorly constrained X-ray amorphous portion of the sample (Dehouck et al. 2014; Vaniman et al. 2014), and griffithite, a close terrestrial analog to the Fe-smectite found in the CB drill sample (Treiman et al. 2014; Bristow et al. 2015). Constructing the very high-fidelity CBA required some components that were only available in small abundances. As a result, less than 500 mg were made and distributed within the MSL team.
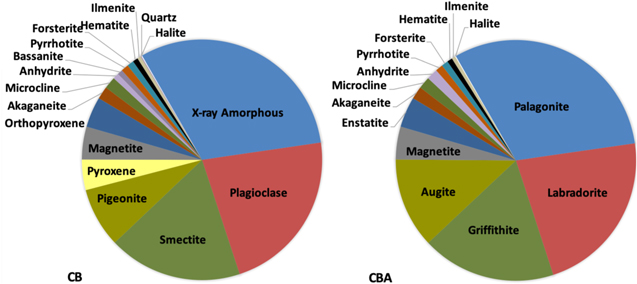
Figure 1. Pie chart of the minerals in (A) CB (Mars) and (B) the CBA sample created for this study. Additional augite was substituted for pigeonite, additional anhydrite was substituted for bassanite, and quartz was intentionally omitted, as trace amounts exist in other components.
Download figure:
Standard image High-resolution imageThe CBA was characterized by the SAM-like EGA in a laboratory setup and in the SAM TB, as well as SAM-like GCMS in the SAM TB, and ChemCam-like VNIR spectrometry and LIBS (Lasue et al. 2019), and the results were compared to the Martian data.
2. Material and Methods
2.1. CBA—Mineral Characterization
2.1.1. Individual Components XRD
Each of the individual phases used in the analog were crushed using a mortar and pestle and sieved to <150 μm for XRD analyses on a Bruker D8 Discover X-ray diffractometer (Cu Ka radiation, l = 1.54059 Å) to check for trace minerals. Data were collected from 2 to 70 °2theta. The data were interpreted using the International Centre for Diffraction Data, Powder Diffraction File-4 (ICDD PDF-4) Minerals database and the Materials Data, Inc. (MDI) JADE software. The palagonite used in the CBA is a natural sample collected from Maunakea, on the Big Island of Hawaii, USA (HWMK101, R. Morris Collection; Morris et al. 2001); this sample contains significant X-ray amorphous material and also plagioclase, which is normal for a natural palagonite sample. The plagioclase component used in the CBA is a labradorite from Labrador, Canada, with very minor amounts of muscovite, quartz, and carbonate. The clay mineral used in the analog is a Fe-saponite from Griffith Park in Los Angeles, California, USA (Treiman et al. 2014). This particular saponite was chosen because CheMin analyses of the CB drill sample indicated that the smectite was a Fe-rich trioctahedral clay mineral, like a Fe-saponite. XRD analyses of this sample indicated that is contains minor quartz. The pyroxene phases of augite and pigeonite identified by CheMin analyses of the CB were grouped together and a natural sample of augite from Fone, Norway, was used to represent pyroxene in the CBA. The augite was not pure as it contained approximately 10 wt. % of quartz. The magnetite was also a natural sample, from Franklin, New Jersey, USA, and contained very minor (<3 wt. %) quartz. The enstatite was a natural sample purchased from Ward's Science and contained a very minor amount (<1 wt. %) of phyllosilicate. A laboratory synthesized akaganeite (DC11202008-11B-SC, R. Morris Collection) was also chosen for the analog to ensure a known composition. The microcline is a natural sample, again from Ward's Science and is dominated by the K-feldspar; however, it does contain <50 wt. % of a Na-rich feldspar, which is common for natural samples. The CheMin analyses of the CB drill sample indicated that both anhydrite and bassanite were present in the CB sample; the bassanite in the analog was substituted with anhydrite since bassanite dehydrates at low temperatures during SAM EGA and GCMS analyses and should not affect reactions occurring at higher temperatures in the SAM oven. The anhydrite was purchased from Sigma-Aldrich (Lot #MKBW9429V) and it contains minor (<2 wt. %) gypsum. The pyrrhotite is a pure, natural sample from Santa Eulaia, Mexico (SAEUMX01, R. Morris Collection). The olivine used for the CBA is a forsterite from San Carlos, Arizona, USA, and contained minor (<5 wt. %) enstatite. The hematite is a synthetic sample from Sigma Aldrich (Batch #0712BE) and contained minor (<5 wt. %) magnetite. The ilmenite was another natural sample from Ward's Science, from St. Urbain, Quebec, Canada, and contained minor amounts (<5 wt. % each) of pyrite and hematite. The halite used in the CBA was pure and was also a Ward's Science sample, from Carlsbad, New Mexico, USA. The last phase present in the CB drill sample as described in Vaniman et al. (2014) is quartz, present at approximately 0.1 wt. %. Since many of the other phases used to create the CBA already contained minor amounts of quartz, no additional quartz was added to the sample (Table 1).
Table 1. Summary of the Mineral Samples, Their Major Additional Phases, and Their Sources
| Main Phase | Additional Phases | Sample Source Details |
|---|---|---|
| Palagonitea | Plagioclase | Mauna Loa, Hawaii, USA (HWML101) |
| (Fe-Smectite) Griffithitea | Quartz | Griffith Park, Los Angles, California, USA |
| (Plagioclase) Labradoritea | Muscovite, quartz, carbonate | Ward's Science, 470025-660, Nain, Labrador, Canada |
| (Pyroxene) Augitea | Quartz | Ward's Science, Fone, Norway |
| Magnetitea | Quartz | Ward's Science, Franklin, New Jersey, USA |
| (Orthopyroxene) Enstatitea | Phyllosilicate | Ward's Science |
| Akaganeite | Synthetic, R.V. Morris (DC11202008) | |
| Microclinea | Na-rich feldspar | Ward's Science |
| Pyrrhotite | Santa Eulaia, Mexico (SAEUMX01) | |
| (Olivine) Forsterite | Enstatite | San Carlos, Arizona, USA |
| Hematite | Magnetite | Sigma-Aldrich (Batch #07124BE) |
| Ilmenite | Pyrite, hematite | Ward's Science, St. Urbain, Quebec, Canada (Lot #298055) |
| Halite | Ward's Science, Carlsbad, New Mexico, USA | |
| Anhydrite | Gypsum | Sigma-Aldrich (Lot #MKBW9429V) |
Note.
aIndicates a natural sample.Download table as: ASCIITypeset image
2.1.2. Individual Components EGA
The natural samples used in the CBA (e.g., labradorite, enstatite, and augite) were also characterized with an EGA to assess the presence of trace volatile evolving phases present below XRD detection limits. A SAM-like EGA of selected individual CBA components was performed with either a Hiden Analytical HPR-20 quadrupole mass spectrometer (QMS) coupled upstream to a custom-built manifold and pyrolysis oven or on a Setaram Labsys Evo Thermogravimeter/Differential Scanning Calorimeter coupled to a Pfieffer OmniStar QMS. For samples analyzed on the Hiden system, evolved gases were monitored as samples were heated at 20°C minute−1 from ∼50°C to ∼1000°C, under SAM-like He pressures (∼30 mbar) and gas flow conditions (∼1 mL minute−1 ). The manifold lines between the oven and the mass spectrometer (MS) were heated to approximately 100°C to mitigate for organics condensing in the lines before reaching the MS and to reduce water background in the lines. Target mass-to-charge (m/z) values focused on were 45 to represent CO2 (the m/z for the 13CO2 isotopolog because the main m/z 44 for CO2 is often saturated), 20 to represent H2O (the m/z for the H218O isotopolog because the main m/z at 18 for H2O is often saturated), and 66 to represent SO2 (the m/z for the 34SO2 isotopolog, in the case that the main m/z at 64 for SO2 is saturated). For samples analyzed on the Seteram system, evolved gases were monitored as samples were heated at a SAM-like ramp rate (modeled after temperature profiles from flight experiments) from 60°C to 850°C, under SAM-like He gas pressure of approximately 25 mbar in the pyrolysis oven, and with a He carrier gas flow rate of 5 mL minute−1 modified for this system. Mass-to-charge values up to m/z 200 were monitored. Due to our strategy of choosing the purest minerals out of multiple samples available for making the analog, no phases in addition to those identified by the XRD analyses were identified by EGA in the minerals used in the CBA.
2.1.3. Individual Components GCMS
All individual components of the mixture were characterized by pyrolysis GCMS to assess qualitatively the background organics present in the mineral matrices. Samples were loaded in precombusted quartz tubes and analyzed in a pyroprobe 5200 (CDS Analytical Inc.) coupled to a Trace gas chromatograph (GC), ISQ TM QMS (ThermoFisher). A first pyrolysis step to 500°C allowed us to characterize semi-volatile adsorbed organics and was followed by a control pyrolysis GCMS run at the same pyrolysis temperature. The second heating step to 950°C (followed by a control, similar to the first step) allowed for the detection and characterization of refractory adsorbed organic compounds as well as organics released during the breakdown of a mineral structure. GCMS separation was performed with an Agilent DB-5ms column (length of 30 m, internal diameter of 0.25 mm, and film thickness of 0.25 μm) heated at 5°C minute−1 from 30°C to 200°C and held for 30 minutes at this temperature, with a helium carrier gas flowing at 1 mL minute−1 . Detection was carried out with MS in full scan mode with a mass range of 5–555 u. A 10 minutes cleanup run at 300°C was performed between each analysis and blank.
The results show that most of the minerals are free of organics or contain only minor traces of them, both quantitatively and qualitatively. The labradorite, augite, and magnetite contain traces of aromatic compounds released at both low and high temperatures and long-chain hydrocarbons at low temperatures. Benzene, styrene, and naphthalene are the most abundant traces. Akaganeite is the most contaminated mineral, with the presence of aromatic compounds including some benzoic and phthalic acids, as well as chlorobenzonitrile at low temperatures. At high temperatures, the Cl released from the decomposition of the mineral chlorinates the organic background to form a low abundance of chlorobenzenes. Overall, although some minerals contain traces of organic compounds, they are considered clean in the sense that the contamination is present at traces levels only, is well characterized, and is not known to interfere with the further experiments and interpretations.
2.1.4. Preparation of the CBA
Each of the 14 individual phases were weighed out and mixed using a mortar and pestle to create a homogeneous analog sample of 500 mg (Figure 2). That mixture was weighed out into 12 portions of approximately 40 mg each and distributed to members of the SAM, CheMin, and ChemCam teams for analyses.
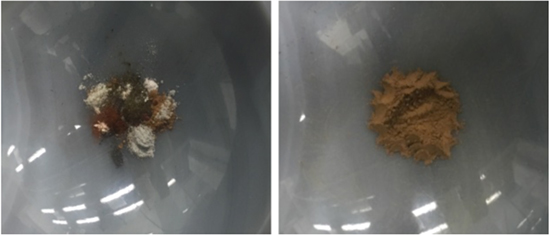
Figure 2. The 14 individual mineral phases weighted out in the mortar (A) before mixing and (B) mixed together.
Download figure:
Standard image High-resolution image2.2. TB Investigations—EGA and GCMS
Two CBA samples (Table 2) were prepared and investigated in SAM TB (Figure 3) nickel cups, which were specially designed for the TB to fit into the SAM regular quartz cups. The Ni cups have the advantage of being easily loaded and unloaded via magnets from the TB apparatus. CBA-BA-MgP-1 consisted of 19.16 mg of the CBA sample, spiked with 0.5 wt. % of benzoic acid and 1 wt. % of Mg-perchlorate in water solutions, and was then dried out at room temperature. CBA-BA-MgP-2 consisted of 9.73 mg of CBA sample, spiked with 0.5 wt. % of benzoic acid and 2 wt. % of Mg-perchlorate in water solutions, and was then dried out at room temperature. Mg-perchlorate was chosen as the most likely form of oxychlorine present at the CB (Sutter et al. 2017). A following control experiment consisted of 10.342 mg of organics-clean fused silica (<150 μm, heated to 750°C in air for 3 hr) spiked with 2 wt. % (2.028 mg) Mg-perchlorate in 20 μL of a water solution. CBA-BA-MgP-1 was loaded in the TB in 2017 May and run in 2018 October, while CBA-BA-MgP-2 was loaded and run in 2018 November. Blank runs were performed before each sample run to assure no contamination came from the apparatus. The blank runs were done on cups in the TB containing fused silica. Blank-1, performed before CBA-BA-MgP-1 sample, was run on SAM TB cup #37. This cup was loaded with fused silica in 2012 and has be regularly used as a blank over the years. Blank-2, performed before CBA-BA-MgP-2 sample, was run on freshly loaded fused silica sample in SAM TB cup #39.

Figure 3. SAM TB inside the Mars environment chamber at NASA GSFC, shown with an open access door.
Download figure:
Standard image High-resolution imageTable 2. Summary of the Experiments Performed on CBA
| Sample–mass (mg) | Additions | Experiment |
|---|---|---|
| CBA-BA-MgP-1—19.16 | 0.5 wt. % Benzoic acid + | |
| 1 wt. % Mg-perchlorate | ||
| CBA-BA-MgP-2—9.73 | 0.5 wt. % Benzoic acid + | SAM TB EGA + GCMS |
| 2 wt. % Mg-perchlorate | ||
| Control-MgP—10.34 | (Fused silica + 2 wt. % | |
| Mg-perchlorate) | ||
| CBA—2.7 | None | |
| CBA-BA—5.04 | 0.5 wt. % benzoic acid | |
| CBA-MgP—5.25 | 2 wt. % Mg-perchlorate | Laboratory SAM-like EGA |
| CBA-BA-MgP-2—5.09 | 0.5 wt. % benzoic acid + | |
| 2 wt. % Mg-perchlorate | ||
| CBA—∼40 | None | ChemCam-like VNIR and LIBS |
Download table as: ASCIITypeset image
The TB EGA and GCMS runs on CBA-BA-MgP samples were performed under similar experimental conditions used during the SAM analyses of the CB on Mars. TB conditions were set as follows: the sample was preheated to ∼40°C for 20 minutes, and the temperature was then ramped to ∼850°C at a rate of 35°C minute−1 . The EGA–MS signal was recorded in a nominal Smartscan mode (Mahaffy et al. 2012). The portion of evolved gases between 486°C and 590°C (oven temperature) were diverted to the SAM hydrocarbon trap for the GCMS analysis. This corresponds roughly to a sample temperature range of 230°C–350°C, although we based the range on the oven temperatures that were used on Mars. The GCMS was done on column 4 (Chirasil-Dex, 30 m × 0.25 mm × 0.25 μm) under a He flow of 870 mbar. GC-4 is preceded by an injection trap, held at 17°C during trapping and then flash heated to ∼300°C to release the volatiles sharply into the GC capillary column. The GC column started at 38°C and was ramped after 300 s to 190°C at a rate of 10°C minute−1 . The temperature was held at 190°C for about 10 minutes before ending the run. The MS scanning mode used a specific vector scanning between 150 and 210 s to enhance the deconvolution of non- to poorly retained compounds. The rest of the GC run was performed using the nominal smartscan mode.
2.3. Laboratory Setup Investigations
2.3.1. SAM-like EGA
SAM-like EGA experiments were performed on an Agilent 5975T LTM-GC/MSD coupled to a Frontier Lab 3030D pyrolyzer and an AS-1020E auto-shot sampler. The samples (Table 2) were weighed out in precombusted Frontier Lab stainless steel Eco-Cups, which were then dropped into the pyrolysis oven by the autosampler in a programmed sequence of EGA runs. In each sample run, the oven was held at 75°C for 25 minutes, then ramped at 35°C minute−1 to 1050°C, and then held for a further six minutes. The sample cups sat in a quartz liner within the pyrolysis oven during heating; a new liner was used for this work to ensure that chlorine contamination from previous runs was not present. Pyrolysis was conducted under 30 mbar helium with a 100:1 split directed to the mass spectrometer via a transfer line held at 135°C. The mass spectrometer scanned a 2–200 u range.
2.3.2. ChemCam-like VNIR and LIBS
VNIR reflectance spectra were measured using the Spectrophotometer with cHanging Angles for the Detection Of Weak Signals (SHADOWS) spectro-gonio-radiometer available at the Laboratoire de Planétologie de Grenoble (IPAG, France); details of the instrumentation can be found in Potin et al. (2018). Bidirectional reflectance spectra are measured with a photometric accuracy below 1% in the 0.5–3.0 μm range with a sampling interval of 10 nm. These spectra can be compared to the VNIR spectra normalized obtained by Mastcam and ChemCam on board MSL. LIBS analyses were also attempted. However, due to the small mass available for the sample, difficulties arose in focusing the laser to the sample at the bottom of the sample holder, and the plasma shock wave generated by the LIBS ablation under Mars atmosphere quickly ejected the sample from the holder. Unfortunately, the measurements did not lead to exploitable results.
3. Results and Discussion
3.1. Characterization of the CBA and Comparison to the Mars CB Drill Hole
3.1.1. EGA—Laboratory and TB
Laboratory EGA. The EGA of the unspiked CBA produced a minor benzene peak at 380°C, which was accompanied by small organic fragments (m/z 27, 39, 41, and 43) from the known contamination, and the onset of broad CO2 and H2O releases, which peaked at 450°C. The traces for H2O, CO2, and benzene are shown in Figure 4(a). A small CO2 peak was seen at 615°C, which likely originated from decomposition of the carbonate impurity known to be present in the labradorite sample used in making the analog (Table 1). As the organic contamination produced both aliphatic and aromatic components during pyrolysis, it was important to determine if these contaminants could react with magnesium perchlorate to generate detectable levels of chlorobenzene.

Figure 4. Evolved H2O (m/z 18), CO2 (m/z 44), benzene (m/z 78), benzoic acid (m/z 105), and chlorobenzene (m/z 112) vs. temperature detected during the SAM-like laboratory EGA of (a) the CBA, (b) the CBA with 2 wt. % magnesium perchlorate (CBA-MgP), and (c) the CBA with 0.5 wt. % benzoic acid and 2 wt. % magnesium perchlorate (CBA-BA-MgP-2). In (d) the m/z 112 produced by CBA-BA-MgP-2 is compared to that evolved by a mixture of the CBA with 0.5 wt. % benzoic acid and no magnesium perchlorate (CBA-BA). The traces for benzoic acid, benzene, and chlorobenzene have a multiplying factor to enable their plotting on the same axes as CO2 and H2O. In (a) and (b), no benzoic acid nor chlorobenzene were detected and their traces were intentionally omitted to keep the graph legible.
Download figure:
Standard image High-resolution imageThe addition of 2 wt. % magnesium perchlorate to the CBA increased the oxidation of benzene, resulting in a significantly weakened benzene peak and a low-temperature CO2 peak developing at 370°C (Figure 4(b)). The CO2 peak at 615°C became more prominent due to the lower-temperature release of the CO2 from the organic contaminants in the presence of the perchlorate. Crucially, no chlorobenzene (m/z 112) was detected during the EGA run.
A subsample of the benzoic acid standard was pyrolyzed to confirm that m/z 105 was the major fragment during the SAM-like EGA. When benzoic acid was mixed with the CBA and Mg-perchlorate (CBA-BA-MgP-2), an m/z 105 peak was detected at 435°C, which was accompanied by benzene and chlorobenzene, and a sharp CO2 peak developed at 450°C (Figure 4(c)). The simultaneous release of benzoic acid and chlorobenzene suggests that Cl2 initiated partial benzoic acid chlorination. HCl (not shown) began to evolve at the same temperature as benzoic acid, benzene, and chlorobenzene. The benzene release continued to high temperatures and increased after perchlorate decomposition was complete, producing a second peak at 575°C. The extended benzene release was associated with a broad CO2 shoulder and was suggestive of decarboxylation of the remaining benzoic acid. An additional CO2 peak occurred at 485°C and was associated with the O2 release from the perchlorate, indicating oxidation.
Because the CBA contains akaganeite and halite, benzoic acid was added to the analog and pyrolyzed without perchlorate to determine if chlorobenzene could be generated by a reaction between benzoic acid and chlorides. The CBA + benzoic-acid mixture (CBA-BA) produced a small peak for m/z 112 at 500°C, in contrast to the strong m/z 112 peak evolved at 435°C by CBA-BA-MgP-2 (Figure 4(d)). The CBA-BA-MgP-2 chlorobenzene peak exhibited a prominent shoulder that occurred at the same temperature as the minor chlorobenzene formed by chlorides and benzoic acid in the CBA-BA sample. Mg-perchlorate forms an MgO residue during pyrolysis, but in some studies, MgCl2 has also been observed (Acheson & Jacobs 1970). The presence of MgCl2, in addition to akaganeite and halite, could explain the significant chlorobenzene shoulder seen in CBA-BA-MgP-2, while the reaction with perchlorate is responsible for the major peak at 435°C.
TB EGA and comparison with Mars data. EGA trends for several major volatiles from CBA-BA-MgP-1 and CBA-BA-MgP-2 were similar to each other and broadly similar to the EGA data from the run of the CB drill sample in SAM on Mars (Figure 5). CB drill sample EGA traces were extensively discussed ahead of time (Freissinet et al. 2015; Sutter et al. 2017). CBA-BA-MgP-1, CBA-BA-MgP-2 and CB all show a broad evolution of H2O less than ∼500°C and a subtle high temperature evolution near ∼700°C–750°C. They also all exhibit a relatively sharp CO2 peak occurring at temperatures between 200°C and 400°C, but CBA-BA-MgP-1 and CBA-BA-MgP-2 show those peaks followed by a lesser CO2 evolution at higher temperatures. In CBA-BA-MgP-2 there is a significant CO2 evolution centered around 500°C, overlapping with benzene evolution at similar temperatures. Both CBA-BA-MgP-1 and CBA-BA-MgP-2 developed m/z 78 and (low intensity) m/z 77 peaks near 500°C, attributed to benzene evolution. CB evolved a substantial O2 peak, attributed to the thermal decomposition of Mg-perchlorate in that sample (black trace, Figure 5(a)). Though CBA-BA-MgP-1 and CBA-BA-MgP-2 had perchlorate added, no O2 evolution was observed. The control sample made by doping inert and organically clean fused silica with Mg-perchlorate (Control-MgP) did show an O2 evolution, however. This sample also showed very small amounts of CO2 (possibly from oxidation of trace organic compounds by the large amount of evolved O2) and H2O (from dehydration of the perchlorate salt).

Figure 5. Thermograms of (a) a representative CB sample on Mars with the SAM instrument, (b) CBA-BA-MgP-2 sample on SAM TB (CBA spiked with 0.5 wt. % of benzoic acid, and 2 wt. % magnesium perchlorate), (c) CBA-BA-MgP-1 sample on SAM TB (CBA spiked with 0.5 wt. % of benzoic acid, and 1 wt. % magnesium perchlorate), and (d) a control sample on the TB consisting of Fused silica spiked with 2 wt. % of magnesium perchlorate. Traces for major volatiles (H2O, CO2, and O2), benzene, and chlorobenzene are represented. Chlorobenzene was not detected in graphs (b), (c), and (d), and its traces were intentionally omitted to keep the graph legible.
Download figure:
Standard image High-resolution imageThe H2O evolved below ∼500°C, from CB and CBA samples, derives from the amorphous material, dehydroxylation of akaganeite, dehydration of perchlorate salt, and any interlayer H2O present in the samples' Fe-saponite, though both in SAM and the TB, the interlayer of the smectite clay minerals should have been largely dehydrated. The higher temperature H2O evolution results from the dehydroxylation of the Fe-saponite in the CB and CBA samples. The sharp CO2 peak <400°C in CB and CBA samples may result from a combination of oxidation of organic materials by evolved O2 from perchlorate and perhaps some oxygen from evolved H2O, in addition to CO2 from the oxidation of the benzoic acid in the case of CBA. In both the CB samples and the CBA samples, the CO2 is evolved at approximately the same temperature as O2 evolution starts to rise (in the case of CB) or would be expected to rise (in the case of CBA-BA-MgP-1 and CBA-BA-MgP-2). In the CBA samples, O2 would be expected to evolve at the same temperature as it evolves from the Control-MgP samples, though no distinct peak of O2 was detected. We think no O2 was detected from the CBA samples because it was all consumed by reaction with organics such as the benzoic acid and trace organics present in the CBA's component minerals to produce CO2 before O2 could be detected by the MS. In both the CB sample and CBA, it is likely that this oxidation of the organic compounds in the sample by O2 was incomplete since, in both cases, enough remained to form the chlorobenzene and dichlorobenzene detected by the GC. Also, in the case of the CBA-BA-MgP samples, some benzene was observed at higher temperatures and presumably was a decarboxylation product of benzoic acid. Carboxylic acids have been shown to decarboxylate at high temperatures when adsorbed or embedded into a mineral matrix (Glavin & Bada 1998). We demonstrated in the laboratory that phthalic acid undergoes a first decarboxylation to benzoic acid at 520°C and a second decarboxylation to benzene at 560°C when heated with a SAM-like ramp in presence of montmorillonite. A similar decarboxylation of phthalic acid was observed in presence of hematite (Francois et al. 2016). Thus, the higher temperature CO2 near 500°C coincident with the benzene evolution can either result from thermal decarboxylation of the benzoic acid, ongoing oxidation of the benzoic acid by the tail end of the O2 peak, and/or the H2O that continued to evolve at those temperatures. The non-detection of benzoic acid and chlorobenzene in the TB EGA runs, as opposed to its detection in laboratory EGA, may be explained by the lower sensitivity of the TB detector compared to a commercial MS. Additional occurrence may happen in the TB, such as a lower transport rate of heavy molecules throughout the lines.
3.1.2. VNIR Investigations
We compared the CBA with a Rocknest (RN) analog and with the CB and RN measurements made by MSL. The RN windblown deposit is the best-characterized Martian soil to date, with precise mineralogical measurements done by MSL (Blake et al. 2012; Bish et al. 2013; Achilles et al. 2017). The similarity with soils analyzed at Gusev Crater and Meridiani Planum could imply globally similar basaltic materials deposited locally. The mineralogy of RN (26 wt. % plagioclase, 20 wt. % pyroxene, 13 wt. % olivine, 2 wt. % magnetite, and 1 wt. % hematite; Bish et al. 2013; Achilles et al. 2017) was used to generate the RN analog: the Mars Global Simulant-1 (MGS-1; Cannon et al. 2019). The 35 wt. % amorphous phase is simulated by 22.9 wt. % of basaltic glass, 5.0 wt % of hydrated silica, 4.0 wt. % of Mg-sulfates, 1.7 wt. % ferrihydrite, and 1.4 wt. % Fe-carbonate (Cannon et al. 2019). The simulant grain size is <1 mm and its spectral properties have been favorably compared to both rover and orbiter observations of Mars soils.
Figure 6 presents the VNIR spectra obtained for the two analogs compared to Mastcam's observations of RN scoop 4 and ChemCam's observations of RN scoop 2 Kenyon soils (sol 97) and the observations of the CB drill hole tailings (Johnson et al. 2015; Wellington et al. 2017). The three types of measurements follow the same trends. The CBA exhibits greater reflectance >600 nm than the RN analog, which is in agreement with Mastcam and ChemCam measurements. The CBA also presents a less prominent ferric absorption near 535 nm than the RN analog, which may be due in part to the different materials used to represent their amorphous components. The ChemCam passive spectra (Johnson et al. 2015) of the Martian targets also confirm this assessment, while presenting variations in overall albedo likely resulting from a combination of dust cover, surface texture, and photometric effects.
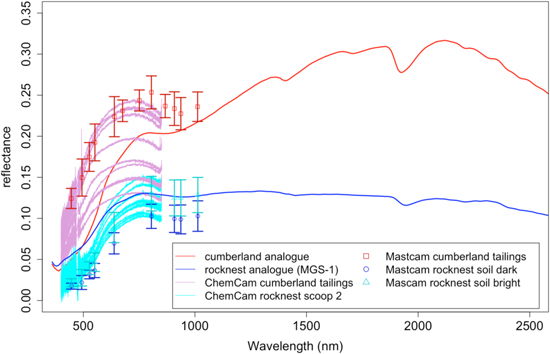
Figure 6. Comparison of the VNIR reflectance spectra for CB (red) and RN (blue) analogs with the ones measured by ChemCam (thin lines) and Mastcam (data points) on Mars. The variations in reflectance of the two analogs in the VNIR region of the spectrum follow the ChemCam and Mastcam observations of the Martian targets.
Download figure:
Standard image High-resolution imageThe greater band depth at 1.9 μm in the CBA compared to the RN analog is peculiar, since CB and RN are supposed to have similar amounts of H2O based on SAM measurements (∼2 wt. %; Sutter et al. 2017). Note that the water content of the CBA was not constrained, for practical reasons. While we took care to keep the samples under low-humidity conditions, the depth of the 1.9 μm band may indicate that some mineral phases present in the CBA sample (e.g., smectite and palagonite) are more hydrated than their Martian counterparts. This could also be related to variations in grain size of the hydrated phases in the mixtures (Cooper & Mustard 1999).
The bands around 1.4 and 1.9 μm in the CBA spectrum are mainly due to the presence of the ferrian saponite griffithite used in the mixture (Figure 6). The metal-OH bands associated with smectites around 2.3 μm are not obvious but do exist in the spectra, also indicating the presence of the ferrian saponite in the mixture (Treiman et al. 2014). This is a reminder that clay minerals within complex mixtures may not be easy to detect from orbit, even at the ∼20 wt. % level and without dust cover.
3.2. TB GCMS: Investigation of the Potential Precursors for Martian Chlorobenzene
TB GCMS was performed on the CBA samples doped with benzoic acid, Mg-perchlorate, CBA-BA-MgP-1, and CBA-BA-MgP-2. The TB chromatogram displayed the presence of chlorobenzene in both CBA experiments, confirmed by both GC retention time and identification via MS (Figure 7). The variation in retention time between chlorobenzene on Mars and chlorobenzene in the TB is explained by the different GC capillary column in use: GC-5 (MXT-CLP) on Mars and GC-4 (Chirasil-Dex) on the TB. The Chirasil-Dex retains more of the compounds under investigation, elongating the retention time.

Figure 7. Reconstructed chromatograms with m/z 112 × 10 + m/z 146 × 50 show the detection of chlorobenzene and the tentative detection of dichlorobenzene in the CBA-BA-MgP-2 sample (top) and on Mars (bottom).
Download figure:
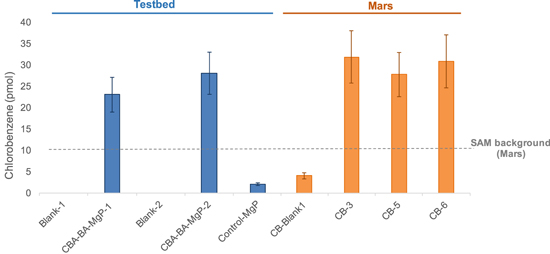
Standard image High-resolution imageThe quantification of chlorobenzene on CBA runs, 23 ± 4 and 28 ± 5 pmol, respectively (Figure 8), is comparable with the abundance of chlorobenzene detected at the CB on Mars, between 27 ± 5 and 31 ± 6 pmol after background subtraction (Freissinet et al. 2015). Figure 7 presents the chlorobenzene GC peak for CB-5, which is raw, uncorrected data. This is why the area of this peak is bigger than the ones from the CBA, while having a similar abundance. The blank GCMS TB runs did not show any sign of chlorobenzene, while the control GCMS run with perchlorate and fused silica only had an abundance of chlorobenzene (2 ± 0.4 pmol) less than the expected background level of chlorobenzene in the presence of HCl (∼10 pmol; Freissinet et al. 2015). The CB-Blank-1 Mars run also displayed a background level of chlorobenzene, due to the reaction of SAM Tenax adsorbent with the the permanent HCl carryover present in SAM after several experiments involving pyrolysis of samples containing oxychlorine salts.
Figure 8. Quantification of chlorobenzene in TB (blue) vs. three distinct subsamples of Mars runs (orange). The presence of a below-background level of chlorobenzene in Control-MgP and CB-Blank-1 is explained by the interaction of HCl or other chlorinated molecules with the SAM hydrocarbon or injection traps, composed of Tenax. The chlorinated molecule in Control-MgP originates from the Mg-perchlorate, while in CB-Blank-1, it likely originates from the permanent HCl carryover in SAM lines. Blank-1 and Blank-2 are TB runs with no sample.
Download figure:
Standard image High-resolution image
We also tentatively detected two isomers of dichlorobenzene (Figure 7) in CBA-2. The two compounds were detected close to the background noise, with a selected ion at the dichlorobenzene base peak m/z 146 (the signal-to-noise ratio on m/z 146 of 2.3 and 3.1, respectively). The respective retention times of 1035 and 1162 s are compatible with those of the dichlorobenzene isomers estimated from laboratory experiments performed with a SAM spare chromatographic column, at 1049 and 1164 s (Millan 2016). The strict identification of dichlorobenzene cannot be confirmed with other diagnostic ions (e.g., m/z 148 and m/z 111) because those masses are too close to the instrumental limit of detection. The limit of detection was previously estimated at ∼0.2 pmol (Szopa et al. 2020), and the abundance of dichlorobenzene in CBA-2 did not exceed tenths of picomoles. Isomers of dichlorobenzene were detected among the chemical species outgassed from the CB sample pyrolyzed in SAM on Mars (Szopa et al. 2020), and the ratio chlorobenzene to dichlorobenzene is very similar to the one obtained for the CBA. We can thus assume that the nature and the amount of the materials (perchlorates and organic molecules) selected to simulate the CB sample are reasonably representative of the Martian sample.
The quantification of chlorobenzene was done as described in Freissinet et al. (2015), using the sum of the peak areas of m/z 50, 51, 77, 112, and 114, and an ionization cross section of 19.4 relative to hexane. However, it is acknowledged that the hexane calibration was performed on the FM, and that the MS response is lower in the TB than in the FM. Moreover, and despite the TB being the closest representation of SAM FM, the TB and FM are two separate apparatus that have experienced different environments. Lastly, the sample size differs from CB (Freissinet et al. 2015) to the CBA. Thus, the abundances of chlorobenzene in the TB and FM can only be compared from their order of magnitude. The similar abundance of chlorobenzene detected in the TB and on Mars, from a sample containing a similar measured abundance of perchlorate (2 wt. %; Sutter et al. 2017), suggests that the abundance of benzoic acid used in the TB experiment may be representative of the abundance of this same molecule in the Sheepbed mudstone. The abundance of benzoic acid (0.5 wt. %, or 5000 parts per millions by weight (ppmw)) may seem considerable; however, due to the presence of perchlorates, the majority of benzoic acid would oxidize and be seen as CO2 (Navarro-Gonzalez et al. 2006), while only a slight proportion would be converted to chlorohydrocarbons (Steininger et al. 2012). The detection of benzene during the CBA TB EGA shows that incomplete oxidation of benzoic acid also occurred during pyrolysis. Thus, a detection of chlorobenzene in the tens of picomoles level may indicate hundreds, if not thousands, of ppmw of organic precursors at the surface of Mars. The variety, as well as the quantity, of organic matter present in the CB drill hole may exceed all previous estimations (Freissinet et al. 2015; Eigenbrode et al. 2018). This would reconcile the experiments with the predicted levels of up to 500 ppmw of benzencarboxylates from meteoritic infall (Benner et al. 2000). The high abundance of CO2 detected with SAM in Mars samples could thus be explained by oxidation and decarboxylation of organic matter (Sutter et al. 2017).
The results presented here show that in the closest SAM py-GCMS conditions we could reach in laboratory; e.g., using a homemade CBA sample and the SAM TB, we were able to form chlorobenzene from benzoic acid and Mg-perchlorates in abundances similar to those detected on Mars. The case for benzoic acid as a potential precursor for the chlorobenzene detected in sedimentary rocks at Mars' surface is strengthened with this new supporting laboratory data from the CBA. The source of benzoic acid cannot be constrained and may result from exogenous or indigenous supply. It is interesting to note that benzoic acid may be a metastable oxidation product, at Mars' surface, of more complex molecules of an abiotic or biological origin (Benner et al. 2000). In addition, the quantification of chlorobenzene in the TB led to a prediction of chlorobenzene organic precursor abundance on Mars of hundreds to thousands of ppmw. This work is a step forward to unveiling the mystery of the "missing organic molecules on Mars" (Benner et al. 2000).
4. Conclusion
The CBA was made based on the CheMin mineralogical data to mimic the CB drill hole's sample on Mars. After XRD, EGA, and GCMS characterization of the individual components of the CBA to assure the purity of the minerals, the mixture was made and investigated with SAM and ChemCam-like experiments. Although the hydration state of the CBA was not constrained, the CBA VNIR spectrum is overall in good agreement with Mastcam and ChemCam VNIR analyses of the CB drill tailings on Mars. This result links the mineralogy of Mars as seen by MSL, with the potential VNIR measurements that could be made by orbital science.
The two CBA samples spiked with 0.5 wt. % of benzoic acid and magnesium perchlorate (1 wt % and 2 wt. %, respectively) and run in the SAM TB confirmed the CBA as a relevant analog for CB; the TB thermogram from the EGA investigation showed similarities between the major volatiles H2O, CO2, and O2 evolved from the CB EGA on Mars and the CBA EGA. Benzene was detected above 500°C and was attributed to the decarboxylation of benzoic acid. This result was confirmed with the laboratory EGA. The TB chromatograms displayed the presence of chlorobenzene in both CBA experiments. Dichlorobenzene was also tentatively identified at a retention time compatible with that of laboratory experiments. The quantification of chlorobenzene on CBA TB runs, 23 ± 4 and 28 ± 5 pmol, respectively, is comparable with the abundance of chlorobenzene detected at CB on Mars. Laboratory EGA results were consistent with the TB EGA data and confirmed chlorobenzene as being a reaction product between the benzoic acid and the magnesium perchlorate added to the CBA sample. The combination of the laboratory and the TB results confirmed benzoic acid as the preferred precursor for the chlorobenzene detected at CB, with a complex chemistry occurring to benzoic acid; chlorination, decarboxylation and oxidation of the carboxylic acid are all observed. The extrapolation of the abundance of the benzoic acid precursor suggests a higher level of organics may be present at Mars' near-surface than previously expected: up to hundreds, if not thousands, of ppmw.
Future MSL-like investigation are planned on the precious and quantity-limited CBA sample. A SAM-like derivatization experiment of a CBA portion spiked with benzoic acid and perchlorate may indicate the detectability potential of derivatized benzoic acid on Mars and bring valuable insights to determine the future SAM experiments to be performed on Mars.
We acknowledge the help of Pierre Beck and the use of the spectro-gonio-radiometer SHADOWS available at IPAG, Grenoble, France, for the infrared laboratory measurements. We acknowledge Jeff Johnson for his calibration of Martian ChemCam IR data, Maëva Millan for her help in preparing the doped samples for the TB investigation, and Slavka Andrejkovicova for her help in the XRD analyses of the individual components of the CBA.