
Abstract
Although the fuse is one of oldest components of electrical engineering, its operating remains very complex because of the extreme rapidity of the phenomena and the fact that they take place in an opaque environment. Until now, engineers and researchers have only studied the fuse operation by indirect method, simulation or post mortem fuse state. But, a collaboration between mixed research units with the European Synchrotron for Research Facilities allowed filming the fuse operating by x-ray imaging. The method specification is to record the sequence with 5 million frames per second. The conductive material is thus observed to pass from a solid-liquid phase to an initiation of the plasma, thereby establishing the initial conditions of the arcing phase. The high speed films also permit to observe the lengthening of the arc in a few microseconds. The images can be synchronized with the voltage and the current, which makes it possible to return to the calculation of the electric field in function of time. Data analysis has been compared with simulation models and the separation of the curves prove the lack of knowledge of arc ignition phase due to the plasma which is out of its thermodynamic equilibrium.
Export citation and abstract BibTeX RIS
1. Introduction
The fuse, this simple device, is operating by a post pre-arcing phase when the heating becomes too high. The melting phase that follows the pre-arcing phase, is associated with the arc ignition and extension at the reduced sessions level. But the observation of the arc is particularly difficult because of the extreme rapidity of the phenomena and the opaque environment. Indeed, the fuse operations following can be do with indirect methods and the study of the post-mortem fuse state. In consequence of this leak of technical solutions, engineers and researchers have developed many studies and proposed a lot of mathematical models and simulations.
Recently, collaboration between the research units allowed filming the fuse operating by x-ray imaging [1]. This project based on an x-ray high speed equipment of 5.106 frames per second, has the objective to film the pre-arcing phase, the arc ignition and the arc phase under Voltage Source Inverter (VSI) short circuit conditions.
Thanks to their very high frequencies, the films carried out at ESRF allow visualizing how the fuse element conductive material turns from a solid-liquid phase to an ionic plasma phase. At the end of this transition, the conditions of temperature, pressure, ionization and energy are combined for the growth of the arc in section and length. Furthermore, by synchronizing pictures with the electrical parameters, i.e. voltage and current, a large amount of information becomes available. In this paper, we have chosen to take into consideration the arc lengthening for the calculations of the electric field E in the arc-plasma with a comparative evaluation of the literature data.
2. Fuse operating under high di/dt conditions for VSI converters
Developments in high DC voltage applications are correlated with progress in semiconductors efficiency with high withstand voltage [2, 3]. To protect the power converters from the explosion in case of overload, specific fuse components are added on the electrical circuit [4]. The fuses have to fulfill two main functions: conduction and breaking. It is defined that the fuse must give the most optimized conductivity capacity and a fast fault clearing. Its breaking function operates according to two steps: pre-arcing and arcing (figure 1). The pre-arcing step corresponds to warming up of the metal reduced section by the overload. After the metal melting, an arc is ignited to oppose the fault current. Figure 1 compares the operation of a fuse under maximal energy conditions according to IEC 60269.1 for AC voltage at 50 Hz and the operation under VSI-conditions according to IEC 60269.4 since 2012. For example, with a fault current I2 the pre-arcing time is estimated to approximately 3 ms and the arcing time at about 7 ms with a post pre-arcing time less than 1% of the total operation time. By contrast, in a case of short-circuit in a Voltage Source Inverter (VSI), the current breaking becomes a very high speed di/dt due to the very low inductance loop of the capacitor discharge. The protection of these VSI requests a specific fuse development for a breaking time down to 100 μs.
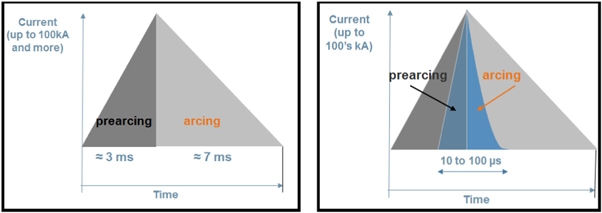
Figure 1. Current-curve for pre-arcing and arcing periods. Left : Principle-graphic of breaking at I2-current according to IEC 60269.1 standard. Right: Principle graphic for VSI-short circuit according to IEC 60269.4.
Download figure:
Standard image High-resolution imageFigure 2 is schematic representation of the fuse operation from the pre-arcing phase to the arc extension. It represents the evolution of the thermodynamic phenomena with the melting of the sand during the arc extension. Many research programs have been attached to investigate on complex phenomena related to the energy transfer between arc and sand. Due to the fuse composition, most of their observations could only be made in the post mortem state. A few of them approached the idea to film the fuse melting by using diversion methods such as spectroscopy through a window or a matrix of magnetic sensors. Nevertheless, despite deficient information, very relevant conclusions have been drawn out. W. Bussière [5] built an experiment around special fuses fitted with a window allowing observing and making records with a fast-camera at 35,000 frames per second. Its experiments are oriented for a measurement of the burn back-rate during AC-operations. Unfortunately the experiments were biased as the energy absorbent environment did not fully surround the arc. Also, the rate of shooting seems to be sufficient as it offers 350 images for half a period at 50 Hz, but it remains low for looking at quicker phenomena such as the establishment of the arc-voltage and for operations under VSI conditions. According to this application, one objective of our study is to observe a simple standard fuse in operation under di/dt conditions by high speed x-ray imaging.
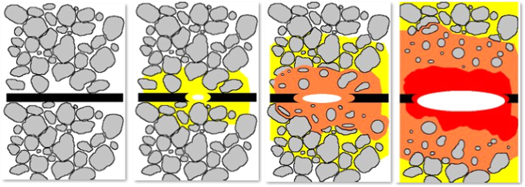
Figure 2. 4-pictures description of the continuous phenomenon of an arc in granular system.
Download figure:
Standard image High-resolution image3. X-ray imaging and experimental method
A team composed of engineers and researchers have done ultra-fast x-ray imaging of the arc across the envelope. Observations up to 5,000,000 frames per second have been performed [1, 6]. The experimental method includes the fuse in the capacitive discharging circuit (figure 3). Discharging conditions are adjusted by the inductance of a wiring cable. In addition, the fuse is illuminated by a parallel x-ray beam whose energy was previously tuned according to the absorbance of the materials integrated in the fuse-sample. The image is processed by a scintillator that converts the x-ray information into visible light. This image is captured by a CCD-camera in the back of a lens in order to adapt the magnification. The synchronization of the beam-opening, of the closing of the discharging circuit and of the CCD-camera shooting is ensured by a programmable microcontroller.

Figure 3. Simplified organization of the test equipment, showing its principal parts.
Download figure:
Standard image High-resolution imageThe selected fuse sample has a cylindrical shape (diameter 10 mm, length 38 mm) and it comes from commercial range. The fuse is a gR-class, with 20A nominal current rating and 690 V nominal operation voltage.
The experimental protocol is based on an evaluation of the samples following several electrical conditions (voltage, length of the loop of the circuit), setting of the fuse element so that it presents its edge or its surface toward the x-ray beam, and finally under different shooting frequencies (table 1). Indeed, the memories of the CCD-camera allow recording only 128 frames. Thus, this parameter limits the possibility of acquisition over the entire arc or only the beginning of the arc, but the acquisition frequency can be adapted. At 1 frame for 100 microseconds, it will be possible to record all the duration of the arc. Higher frequencies, such as 1 frame for 0.2 microseconds will be used for focusing on the transition from pre-arcing to arcing and the first moments of the arc. Good repeatability of fuse operation allows optimizing acquisition of information, by reproducing several times the same electric conditions under different shooting frequencies and for the two perpendicular positions of the fuse-element.
Table 1. Differents parameters of the experimentals breaking tests.
| Capacitor discharge Voltage | 450 V/400 V/300 V |
| Current and di/dt | Short loop/Large loop |
| Position of the conductor towards x-ray-beam | edge/surface |
| Shooting-frequency | 1 im./0,2 μs./1 im./0,5 μs./1 im./1 μs. |
| 1 im./2 μs./1 im./5 μs./1 im./10 μs. | |
| 1 im./20 μs./1 im./100 μs./1 im./200 μs. |
4. Breaking tests measurements and analysis
The first analysis concerned standard fuses tested under capacitor discharges at 300, 400 and 450 V with a short loop. The current and voltage curves are represented in function of time in the figure 4. The graph (a) which corresponds to a breaking test of 5 fuses shows clearly the reproducibility of the experiment. The pre-arcing time and the current or voltage evolution are very similar between each fuse. The second graph (b) corresponds to a voltage variation following 3 values: 300, 400, 450V DC. The results show a typical fuse behavior by a stable I2t pre-arcing (lower max current value but longer pre-arcing time) because of the variation of the power and di/dt with the charge voltage.
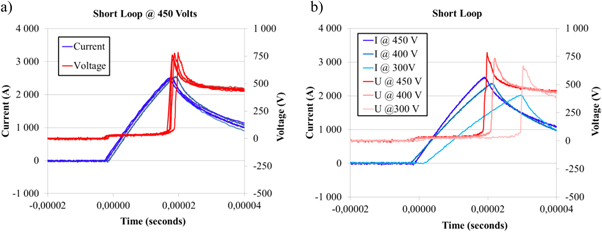
Figure 4. Current and voltage curves. (a) five samples have been tested under 450 V and a short loop. (b) samples have been tested under 300, 400 and 450 V.
Download figure:
Standard image High-resolution imageDuring the tests at ESRF, x-ray films have been recorded at up to 1 frame per 0.2 micro-second. They make it possible to observe fuse element melting, the transition from pre-arcing to arcing and to measure the arc lengthening with the dynamic progression of fuse element melting. A series of pictures is illustrated in the figure 5 [7]. The main phenomena seem to be correlated with internal nucleation, magneto-hydro-dynamics and surface vaporization. More precisely, at the beginning, the narrowest area of the reduced section inflates and then gradually separates from both sides of the remaining conductor. At t = 23,4 μs, an explosion occurs when the liquid metal is replaced by the arc plasma with estimated temperatures up to 20 000 K. Considering the limited number of frames, the last picture set at t = 24 μs, it has been considered that the arc is not completely established.
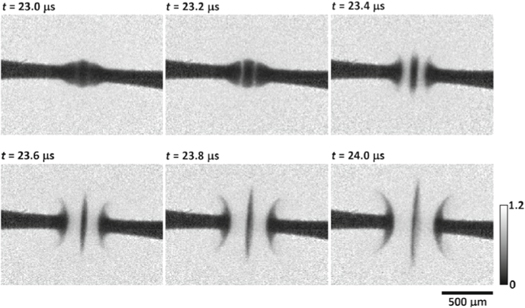
Figure 5. Series of pictures extracted from a film of the post pre-arcing phase on a reduced section; shooting-frequency is 1 frame per 0.2 μs.
Download figure:
Standard image High-resolution imageFrame by frame, arc lengths have been measured for all the tests carried out on standard fuse samples under 300, 400 and 450 V with the short loop. For high shooting frequencies (1 frame/μs and more), only the first instants of the arc are recorded; corresponding arc lengths are plotted on the left side of the graph hereafter. For low shooting frequencies (1 frame for 10 to 100 μs.), the entire arc duration is recorded; corresponding arc lengths are plotted on the full width. All the points, recorded at both high and low shooting frequencies, have been fitted with a piecewise linear law in log axis (figure 6). The arc lengthening value can be correlated to time and electrical data (current and voltage). In addition, the paper written by Turner and Turner in 1977 [8] can be mention as the reference document about lengthening of the arc.
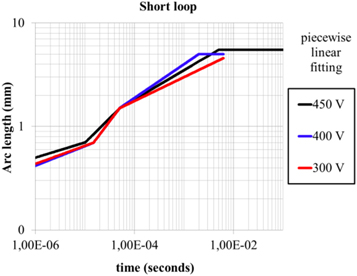
Figure 6. Arc lengthening measurements: effect of the capacitor voltage, piecewise linear law for each voltage.
Download figure:
Standard image High-resolution imageWith this collected parameters, the electric field in the arc can be calculated in function of the fuse operation current and time (figure 7). It will be assumed that the field is homogenous within the arc column and the voltage at the electrodes will be estimated with equations from the literature. Authors like Dolegowsli [9], Onuphrienko [10], and Wright and Beaumont [11] have proposed equation for electrode voltage calculation in function of the current. For our following calculations, a model given by Gnanalingam and Wilkins [12] has been used:

Consequently, the electrical field has been calculated according to the following expression [11]:

The last equation (2) which is dependent on the arc lengthening will be compared to the simpler equations developed by Wheeler [12]:


or

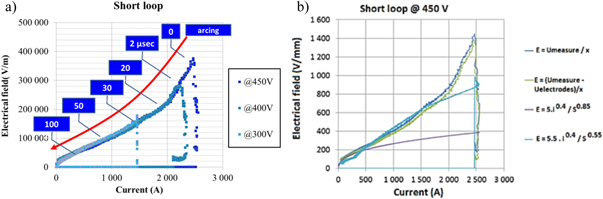
The electrical field calculated with experiments results or following the equation (2) gives various correlation domains as shown in figure 7. Slope values can be associated to different steps of the arc phase:
Figure 7. Curves of measured electrical field versus current. (a) For 450, 400, 300V applied. (b) For 450V (E in dark bleu and green) and curves calculated at 450V from Wheeler (light bleu and purple).
Download figure:
Standard image High-resolution image
_From 2500 A to 1650 A: Established over 20μs, the slope has its highest value. The arc probably should not be in its thermodynamic equilibrium. The ionic species of the plasma are in a transition step until reaching their thermodynamic equilibrium. Furthermore, the simulation models do not fit with experimental data.
_From 1650 A to 620 A: the slope is stable during a long period of 90 μs which corresponding to the stable arc extension. Plasma phase is in equilibrium. The electrical field can be fitted with the equation for cylindrical geometry (4)
_Under 620 A: the slope starts to decrease until the null electrical field. The arc has entered in its extinction phase. The electrical field can be fitted with the equation for plan geometry (5).
This new method of fuse operation analysis coupled with high-speed x-ray images has improved the precision of parameters and it proves the divergence with simulation models during the post pre-arcing phase. The need to improve models of plasma phenomena, especially with the arc ignition when the plasma is out of thermodynamic equilibrium is essential to predict and simulate the correct fuse operation.
5. Conclusion
Tests sessions of the fuse observation under x-ray high speed imaging brought a new and better knowledge of arcing in a fuse. First very valuable information concerns the determination of the initial conditions for any arc model. Very spectacular pictures of the transition between pre-arcing and arcing give tiny precision of the arc ignition. They also allow to observe the 'explosion' of the metallic conductor and to validate or not different hypothesis of the literature i.e. internal nucleation, magneto-hydro-dynamics or surface vaporization. Second valuable information comes from the comparison of the curve of the electrical field versus the current with models available in the literature and concerns a possible preliminary phase of arcing during which the plasma is out of thermodynamic equilibrium. It has not been yet demonstrated that this phase is specific to high di/dt-arcing, but it is probably necessary to take it into account in the design of the fuses. The large database collected at the ESRF will continue to be analyzed in order to improve knowledge of arc phenomena.
Acknowledgments
The authors would like to sincerely thank all contributors to the experiments and the data analysis which led to the production of this paper. At first their gratitude goes to Alexander RACK and Margie OLBINADO from ESRF in Grenoble for their very professional way to solve the requirements of the experiments. They also would like to thank Xavier JUST, PhD student and Pierre LUISSIER, researcher at the SIMAP-lab in Grenoble who initiated the rapprochement with the ESRF. Are also to be thanked Jean-Marc CHAIX and Rémy DENDIEVEL from the SIMAP-lab in Grenoble and Olivier BONNEFOY and Gérard THOMAS from ECOLE des MINES in Saint-Etienne who brought their large amount of scientific and technological skills about granular media. In addition, a special thanks to Jean Louis GELET, formerly from MERSEN's R&D team, for his important contribution to this paper.