Improved Kalman Filtering-Based Information Fusion for Crack Monitoring Using Piezoelectric-Fiber Hybrid Sensor Network
 Yishou Wang
 Mengyue He
 Lei Sun1
  Di Wu
Di Wu- 1School of Aerospace Engineering, Xiamen University, Xiamen, China
- 2China Academy of Launch Vehicle Technology, Beijing, China
- 3State Key Laboratory of Structural Analysis for Industrial Equipment, School of Naval Architecture, Dalian University of Technology, Dalian, China
- 4Collaborative Innovation Center for Advanced Ship and Deep-Sea Exploration, Shanghai, China
Multifunctional sensor network has become a research focus in the field of structural health monitoring. To improve the reliability and stability of the diagnosis results, it is necessary to fuse heterogeneous signals under the interference of the external load and damage. In this paper, a piezoelectric-fiber hybrid sensor network is integrated to monitor the crack growth around the hole in the aviation aluminum plate. The effect of the load change on the signals of piezoelectric transducers (PZTs) and optical fiber sensors is analyzed. To improve the damage diagnosis result obtained by ultrasonic guided wave imaging diagnosis based on PZTs and strain damage identification based on distributed optical fiber sensor, a fusion strategy of heterogeneous signals based on a two-stage Kalman filtering algorithm is proposed. In the first stage, the features extracted from two types of sensors are fused at a specific time at the feature level, and then the location of the damage center is predicted. Then, the second fusion is to fuse the predicted damage location results at multiple specific times at the decision level. Crack growth monitoring experiments in hot spots of metallic material under bending moment loading is carried out to verify the feasibility of the proposed fusion method. The experimental results indicate that the fusion damage diagnosis results are more stable, moreover, the accuracy of damage location and quantification is improved than the single signal diagnosis results.
Introduction
In recent years, structural damage and failure have led to some dramatic accidents in the field of aeronautical and ocean engineering. With the complexity of the structural load and the harsher environment, the demand for obtaining real-time information on the structural state becomes more and more urgent. Structural health monitoring (SHM) techniques have been widely used to assess the structural state and improve the structural safety of aircraft (Qing et al., 2012) and ocean platform (Tang et al., 2020) in recent years. Different types of lightweight sensor networks are permanently integrated on the surface or embedded within the structure to obtain information on load, deformation, and damage expansion of key structural regions. Many advanced SHM techniques have emerged, such as ultrasonic guided waves (Villegas, 2019; Wang et al., 2019), optical fiber gratings (Lau, 2014), vibration-based (Zhang et al., 2018), eddy current (Bohacova, 2013), acoustic emission (Michalcová and Růžek, 2016), and mechanical impedance (Min et al., 2012). However, most of these techniques are based on single-type sensors, which is difficult to meet the requirements of complex structure and multi-physical field monitoring. The monitoring results are also easily disturbed by the surrounding environment and external scenarios such as temperature, vibration, and different forms of the load.
Recently, a multi-functional sensor network composed of different kinds of sensors has become a research focus (Qing et al., 2005; Wu et al., 2009). However, the research of multi-source sensor interaction in the multi-physics field is still insufficient. To improve the reliability and stability of the diagnosis results, it is necessary to make full use of various sensor information (data or signals) when the structural load and damage are considered comprehensively (Wu et al., 2017; Sun et al., 2018). Multi-sensor information fusion technology integrates the redundant or complementary information of each sensor in space or time. The reliability and robustness of the system can be improved by overcoming the uncertainty and limitation of single-type sensors and obtaining consistent interpretation or description of the structure. Information fusion can be carried out at different levels, including data level, feature level, and decision level, which correspond to three fusion methods. Among them, data-level fusion is mainly used to preprocess multi-source information such as strain, modal parameters, acceleration, temperature, and pressure. Feature-level fusion is to extract characteristic indices by damage sensitivity analysis and data mining. Decision-level fusion is used to predict the state characteristics of the structure. Gravina et al. (2017) provided a comprehensive and systematic review of the latest technologies from three levels: data-level, feature-level, and decision-level. They pointed out that multiple homogeneous sensors can be directly fused, while for heterogeneous sensors, feature-level or decision-level fusion techniques are required. Besides, common fusion methods were listed, including the Kalman filtering method (Kalman, 1960), weighted average method, Bayesian estimation method, Dempster-Shafer evidence theory, artificial neural network, fuzzy theory, genetic algorithm, support vector machine and so on. Su et al. (2009) evaluated mono- and multi-delamination of carbon fiber-epoxy (CF/EP) composite structures using three fusion schemes, namely disjunctive, conjunctive, and compromise fusion. The difference between the three fusion schemes lies in whether the signal feature extraction and pattern recognition are carried out at single-type sensors or the whole network. They found that disjunctive and conjunctive fusion might exaggerate and minimize the possibility of damage, respectively, while compromise fusion scheme showed high robustness and reliability.
The Multi-sensor system is the hardware foundation of data fusion. In the field of SHM, an ultrasonic guided wave technique based on piezoelectric transducers (PZTs) (Liu et al., 2016b; Memmolo et al., 2016; Miniaci et al., 2019) and optical fiber sensing (Liang and Yuan, 2015) have been widely used. The guided wave monitoring technique has high monitoring efficiency and sensitivity and can realize large area active monitoring. It is mainly used to monitor fatigue crack, fracture, delamination, and other damages. However, the guide wave signal is easily restricted by actuator-sensor paths, which makes the signal interpretation very complicated. Besides, temperature, stress, and other external environmental factors have a greater impact on the signal fluctuations. In contrast, the optical fiber sensor is light in weight, small in size, and easy to install, it can realize multi-point continuous passive monitoring relatively stably. Especially, a distributed optical fiber sensor can replace multiple strain gauges to realize high-density monitoring, thus greatly reducing the weight of connecting cables and sensor networks. However, the monitoring area of optical fiber sensors is limited, which can only be detected after temperature changes and structural deformation, and only the signal along the fiber length direction can be monitored. Therefore, based on the above advantages and disadvantages of guided wave and optical fiber monitoring, it is important to fuse ultrasonic guided wave signals with optical fiber signals to make up for the shortage of single-type sensors. The accuracy and stability of SHM can be improved by constructing a hybrid sensor network and integrating multi-source sensor information to monitor the load state, damage state, and other information of the structure.
In this paper, a two-stage Kalman filtering-based heterogeneous signal fusion of the piezoelectric-fiber hybrid sensor network is proposed to monitor crack growth at the feature level and decision level. The remaining work is organized as follows. Section “Sensing Principle of Damage Monitoring” describes the damage monitoring principle of the piezoelectric transducer and the optical fiber sensor, respectively. Section “Heterogeneous Signal Fusion based on Kalman Filtering” depicts the heterogeneous signal fusion technology based on Kalman filtering. Section “Experiment” conducts a crack growth monitoring experiment in the hot spot area of metal material under bending moment loading. In section “Two-Stage Fusion of Kalman Filtering for Damage Location Monitoring,” a Kalman filtering fusion algorithm based on two-stage fusion is proposed, which firstly fuses the multi-sensor signals at a specific time at the feature level and predicts the damage location, and then fuses the prediction results at multiple specific times at the decision level. The whole process of two-stage heterogeneous signal fusion of multi-sensing is shown in Figure 1.
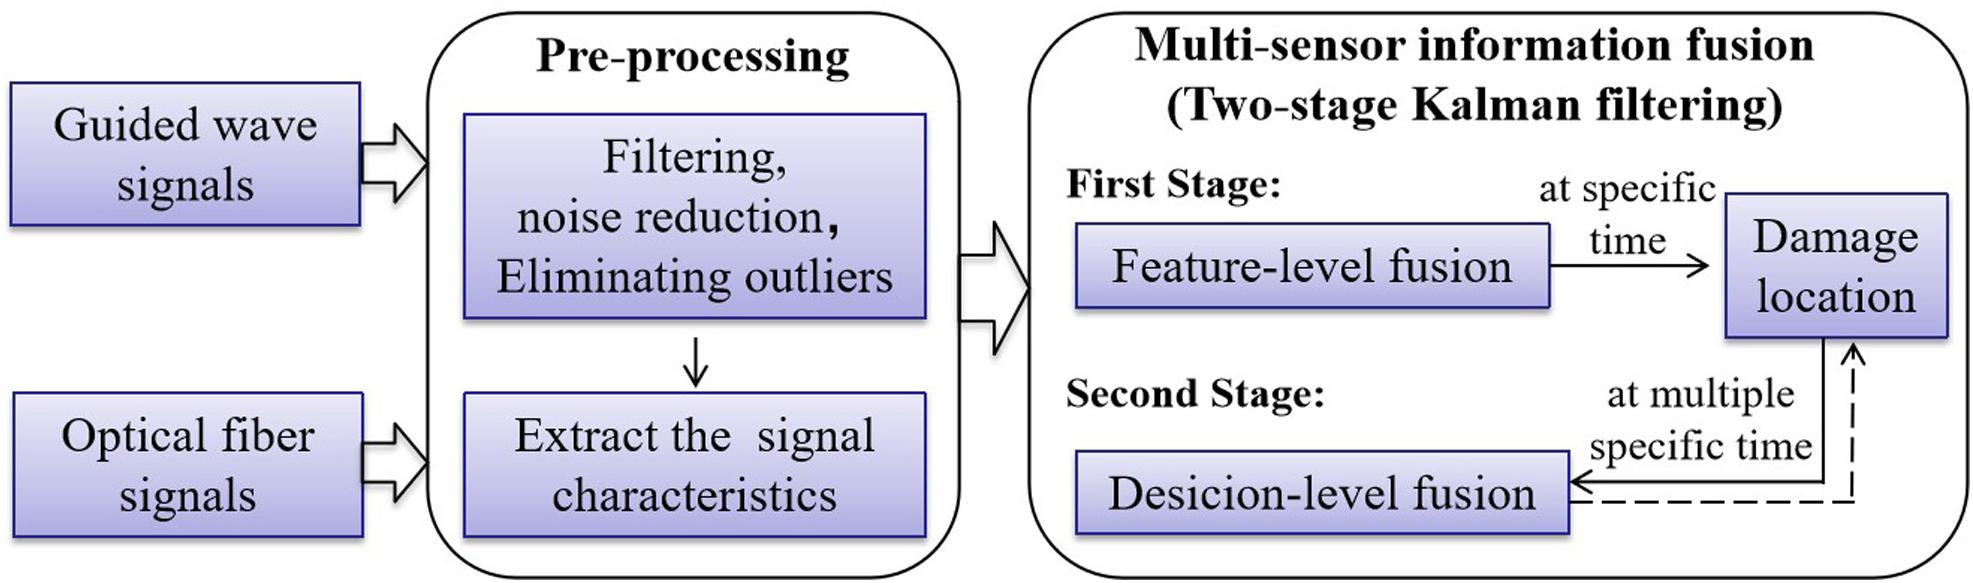
Figure 1. The heterogeneous signal fusion process based on a piezoelectric-fiber hybrid sensor network.
Sensing Principle of Damage Monitoring
Structural health monitoring (SHM) is mainly concerned with the diagnosis of damage in large and local areas. It is very important to select sensors with reliable performance and high-cost performance. Piezoelectric transducers (PZTs) and optical fiber sensors were commonly used because of their small size and lightweight. In sections “Guided Wave Method based on Piezoelectric Transducers” and “Optical Fiber Sensing,” the sensing theory of PZTs and the optical fiber sensors are introduced, corresponding to the elliptic probabilistic weighted damage imaging method and the damage diagnosis method based on strain change, respectively.
Guided Wave Method Based on Piezoelectric Transducers
Guided wave damage monitoring is suitable for both large and local areas with the advantages of high detection efficiency and damage sensitivity. Different types of damage such as fatigue crack, fracture, and delamination can be monitored. As is shown in Figure 2, the ultrasound signals are excited by the actuator on the surface of the detected structure and the other sensors receive the structural response signal at one or more locations of the structure (Qing et al., 2019). When the structure is damaged, the structure boundary changes accordingly, which leads to the scattering and energy absorption of the ultrasonic guided waves propagating in the structure. Therefore, the structural health state can be judged by analyzing the signal changes of each actuator-sensor path before and after damage (Wu et al., 2015). PZTs are often used to excite and receive guided wave signals and can be regarded as exciter and receiver due to their positive and negative piezoelectric effects.
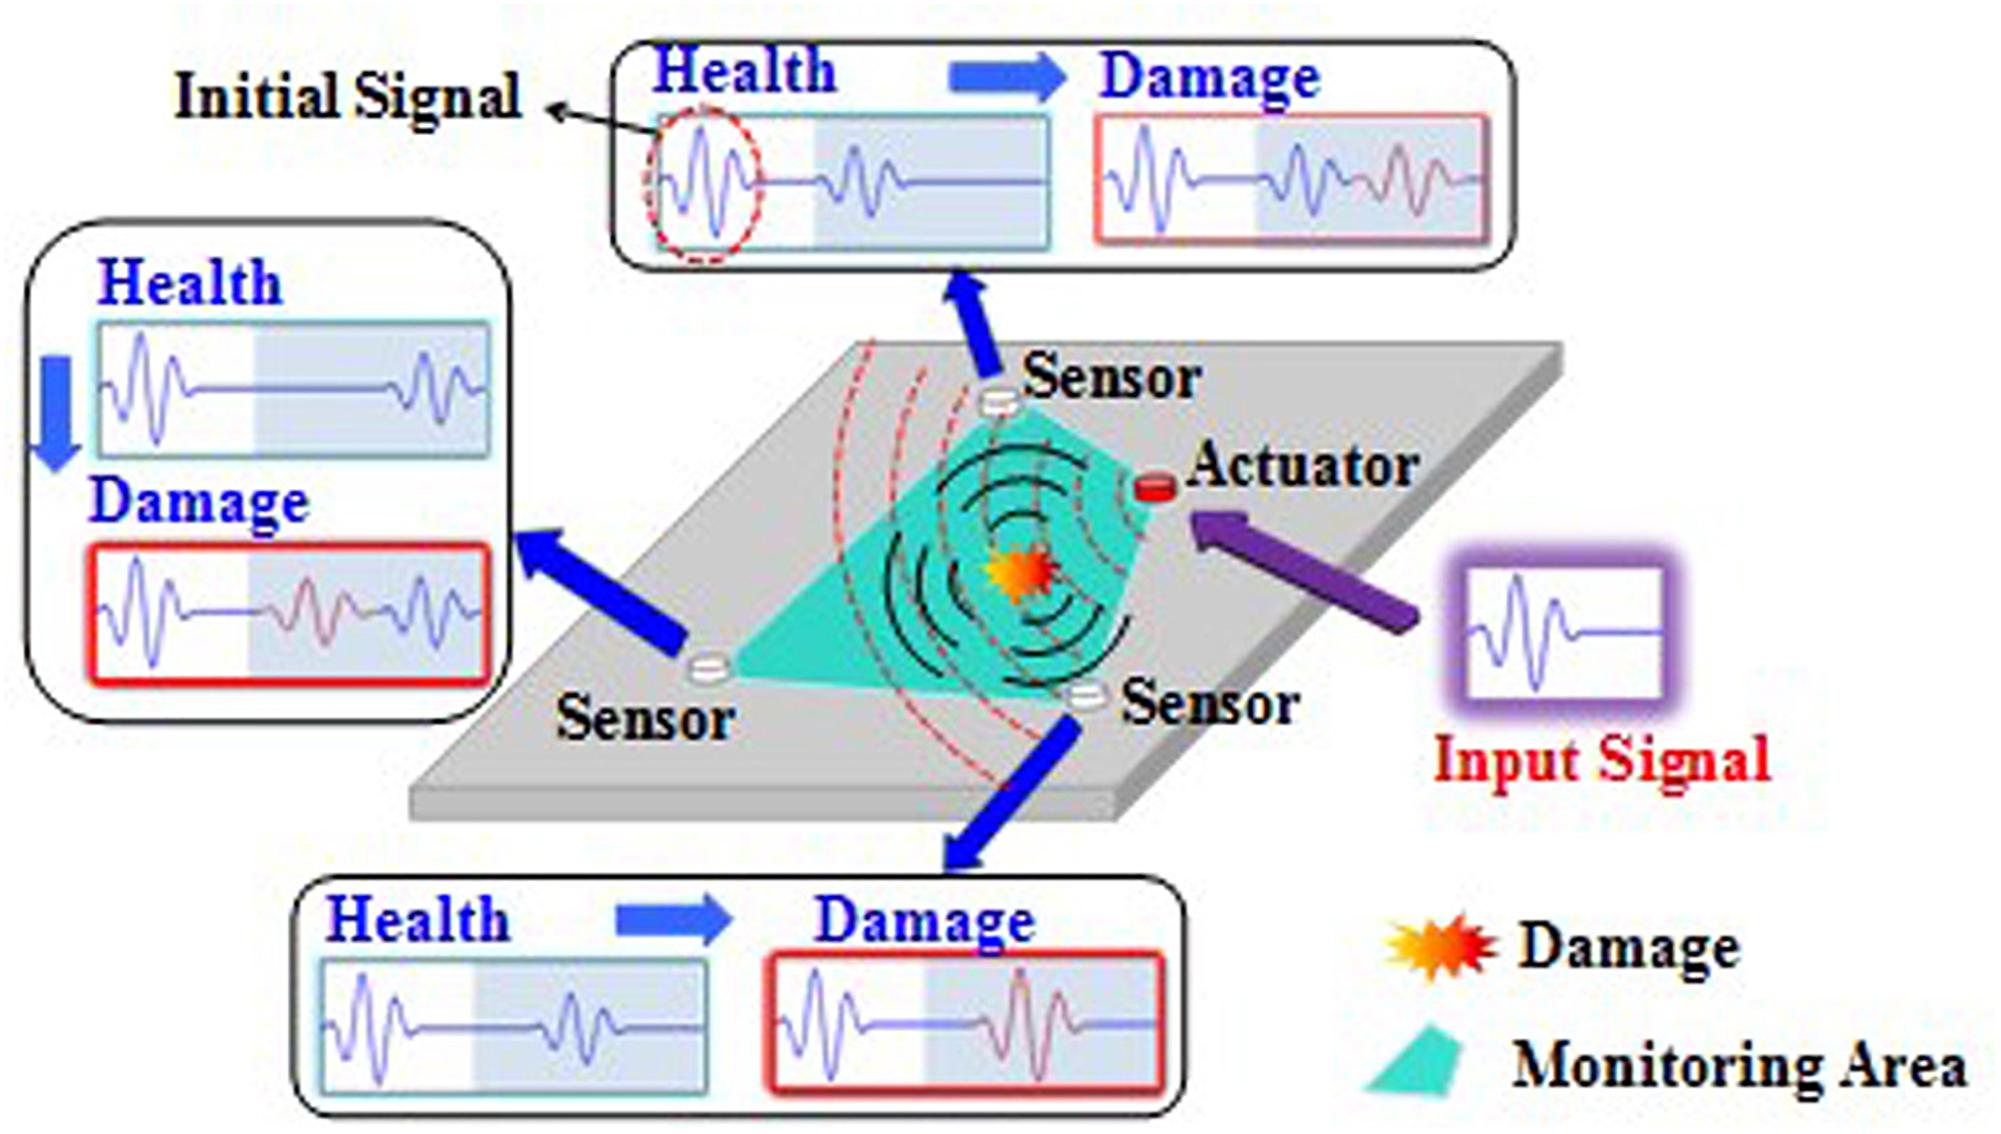
Figure 2. The monitoring principle of the Guided wave method (Wu et al., 2015; Liu et al., 2016a).
Damage imaging diagnosis methods based on guided waves mainly include the probability weighting method (Wu et al., 2015), phase control array method, time of flight method, delay superposition method, time-reversal method, etc. Considering that damage diagnosis cannot be realized only based on the change of the guided wave signal in the single actuator-sensor path, the change of the wave signal in the multi-actuator-sensor path is needed. Therefore, the elliptic probability weighting method was used in this paper because of its high efficiency and strong applicability (Wu et al., 2015; Liu et al., 2016a). The damage indicator (DI) of each actuator-sensor path was first calculated. Then the damage probability of each point on the structure was obtained by integrating the DI information of all actuator-sensor paths with the weighted function, thus the damage diagnosis and imaging of the whole monitoring area can be carried out.
DI has a great influence on the sensitivity of damage diagnosis and can be expressed in the time domain, frequency domain, and other characteristic forms, such as wave velocity, amplitude, and energy. The time-domain energy of the scattered signal not only contains the attenuation information of the ultrasonic guided wave caused by damage but also reflects the phase delay information of the guided wave signal, so it is highly sensitive to damage. Therefore, the time-domain energy (i.e., eng) of the direct wave, S0 scattered signal was selected to represent DI of the guided wave monitoring method. The form of eng and DI are as follows:
Where t0 and tf represent the range of time-domain signals used for signal comparison, u is the signal amplitude, the subscripts C and B of eng represent the measured signal and the baseline signal of the guided wave, respectively.
Optical Fiber Sensing
Optical fiber sensor monitoring is to judge the damage state of the structure according to the change of strain field and its correlation with the damage. The damage near the actuator-sensor path of the optical fiber sensor can be determined by accurate strain field measurement (Shan et al., 2019). The location and severity of damage can be determined by comparing the signal differences of optical fiber sensing before and after the damage. Optical fiber sensor has the characteristics of lightweight, flexibility, strong anti-interference, and high sensitivity, and can realize long-distance measurement. The most commonly used optical fiber sensors are fiber Bragg gratings (FBGs) and distributed optical fiber sensors. In this paper, a distributed fiber sensor was selected because the strain information at any point along the length of the fiber can be obtained.
When strain or temperature is measured by the distributed fiber sensor, the variation of temperature or strain will cause the deviation of the Raleigh scattering spectrum of backscattering in the fiber. By observing the spectrum of the scattered light, it can be determined which part of the fiber has changed in temperature or strain (Kreger et al., 2009). The relationship among the backscatter spectral shift (similar to the wavelength λ), the strain ε, and the temperature T in fiber Bragg gratings (Kreger et al., 2009) is:
Where Kε and KT are the calibration constants of strain and temperature respectively, whose values are related to the characteristics of the optical fiber.
For optical fiber monitoring, the variation of strain before and after the damage is usually taken as the DI, which is specifically expressed as follows:
Where ε and ε0 are the strain values collected after and before the damage. The higher the DI value, the greater the probability or severity of the damage.
Heterogeneous Signal Fusion Based on Kalman Filtering
Kalman Filtering is an important and widely used information fusion algorithm based on the theory of closed-loop feedback information estimation (Kalman, 1960). In the field of damage identification, Kalman filtering is commonly used to detect large civil and mechanical structures. By establishing the Kalman filtering system model, the sensor data are predicted and corrected recursively, so that the system processing does not need a large number of data storage and calculation. Especially, the Kalman filter can estimate the state of a dynamic system from a series of data with measurement noise when measurement variance is known. It is convenient for computer programming and can update and process the data collected on-site in real-time. These advantages are conducive to information fusion of piezoelectric plate and optical fiber sensor, especially their complementary advantages (global detection and local detection). By monitoring different information such as load state and damage state of the structure at the same time, the deficiency of the damage diagnosis method based on a single-type sensor is avoided, and thus have a more comprehensive understanding of structure state.
However, for other common fusion methods, such as weighted average method, Kalman filtering method, Bayesian estimation method, Dempster-Shafer (D-S) evidence theory, artificial neural network, fuzzy theory, genetic algorithm, support vector machine, etc., they all have various disadvantages. For example, the weighted average method is not suitable for complex signal processing, Bayesian estimation requires the prior probability to be given, D-S evidence theory’s exponent is extremely complex, the artificial neural network has a large amount of computation and is difficult to find the local optimal solution.
Kalman filtering (Kalman, 1960) is an optimal state estimation method, mainly including prediction and correction (Woods and Radewan, 1977). The current state is predicted according to the previous state and control quantity, and then the credibility of sensor data and overall estimate is judged by correction, and the current state is updated by repeated prediction and correction. Assume that the system state is expressed by a state vector X (X ∈ Rn), and the state equation of the system at time k is (Cui and Huang, 2001):
Where Uk and Wk are the control input and state noise of the system respectively, and A and B are the state transition matrices.
The observation equation of the system at the corresponding time k is:
Where Z ∈ Rm, H and Vk are the observation matrix and the observation noise, respectively. Wk and Vk are two independent white noises with a mean value of zero and a covariance matrix of Q and R, respectively.
The state estimation at time k is divided into a prior estimate and a posterior estimate. The prior estimate is to estimate the state at time k according to the state before time k, while the posterior estimate is an estimate of the state at time k given the observed quantity Zk at time k.
The prior estimate and its error Ek_ pre and covariance Pk_ pre of the system at time k are:
Where is the posterior estimate of time k−1, is the covariance of the posterior estimate of time k−1, E is a unit matrix, is the transposed matrix of Ek_pre.
The posterior estimate , error Ek, and covariance Pk of the posterior estimate at time k are:
Where is the transpose matrix of Ek, Kk is the Kalman gain at time k, and the expression of Kk is:
The common multi-sensor Kalman filtering fusion needs to calculate the Kalman factor of each sensor at each time, which is a huge amount of computation. In this paper, when the Kalman filtering fusion algorithm is used to fuse the signals of the PZTs and optical fiber signals, assume that the sensor error conforms to the normal distribution. The measurement error of the PZTs is M, and the measurement error of the optical fiber sensor is N. When piezoelectric and optical fiber sensors are used to measure the same damage, the measurement values of the two sensors are weighted and averaged to obtain the best measurement value. Taking Eqs (7)–(13), Kalman optimal estimated weight can be obtained by:
Where WPZT and WOP are the fusion weights of the measured values of the PZTs and the optical fiber sensors, respectively during the first fusion. WF is the covariance of the estimated value after the first fusion.
Experiment
The experiment is to monitor the crack growth in the hot spot area of metal materials under bending moment loading. The specimen is a 300 mm × 300 mm × 2 mm 7075 aircraft aluminum plate with a 10 mm diameter through-hole in the center specimen. The material properties of the specimen are shown in Table 1. As is shown in Figure 3, the crack growth of the specimen starts from the point (155, 150) and extends along the positive direction of the X-axis.

Table 1. The material properties of the 7075 aircraft aluminum plate.
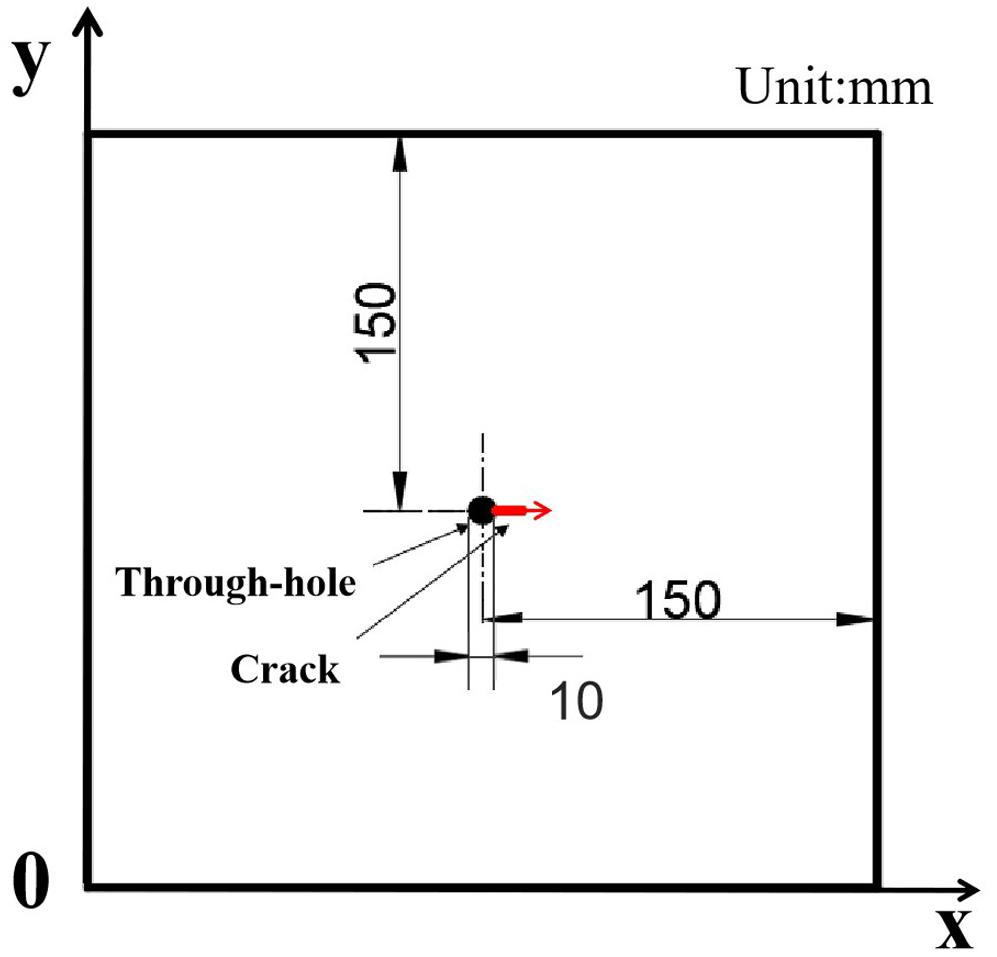
Figure 3. The schematic diagram of through-hole on the aluminum plate.
As is shown in Figure 4, eight circular PZTs and a distributed optical fiber sensor with a length of one meter were set on the surface of the same aluminum plate by high-temperature AB glue. For PZTs sensing, the diameter and thickness of the circular piezoelectric sensor are 8 and 0.48 mm, respectively, and each PZT acted as excitation or receiver. For optical fiber sensing, the distributed optical fiber sensor was used to monitor the strain information at predefined points. The effective strain monitoring path of the optical fiber sensor consists of four parts, i.e., AB, CD, EF, and GH segments. The AB and EF segments of the fiber monitored the strain in the X direction and the CD and GH segments monitored the strain in the Y direction. Table 2 lists the positions of initial points of four segments in the coordinate system and on the entire distributed optical fiber sensor (relative to head end). There are seventeen equispaced strain measuring points for each segment on the optical fiber sensor. The position range of strain measuring points in AB, CD, EF, and GH segments are 205–285, 435–515, 690–770, and 905–985 mm, respectively. The distance between two adjacent measurement points is 5 mm.
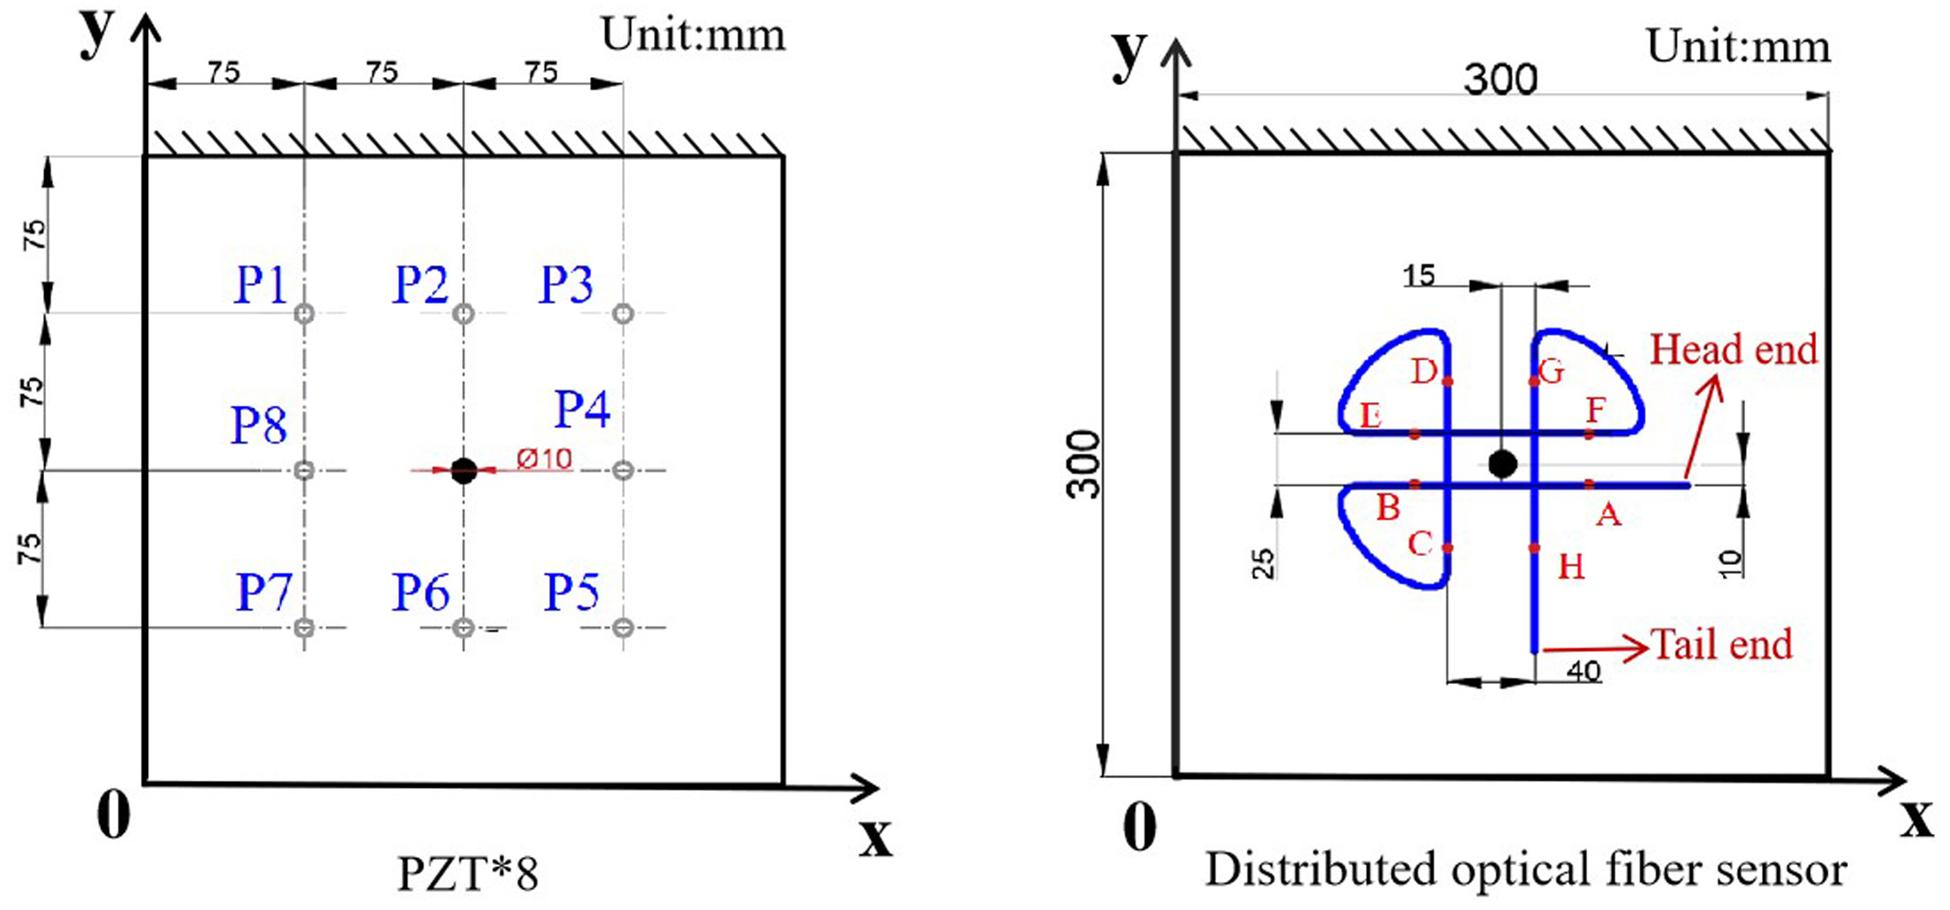
Figure 4. The sensor layout of the PZTs and distributed optical fiber sensor on the same aluminum plate.
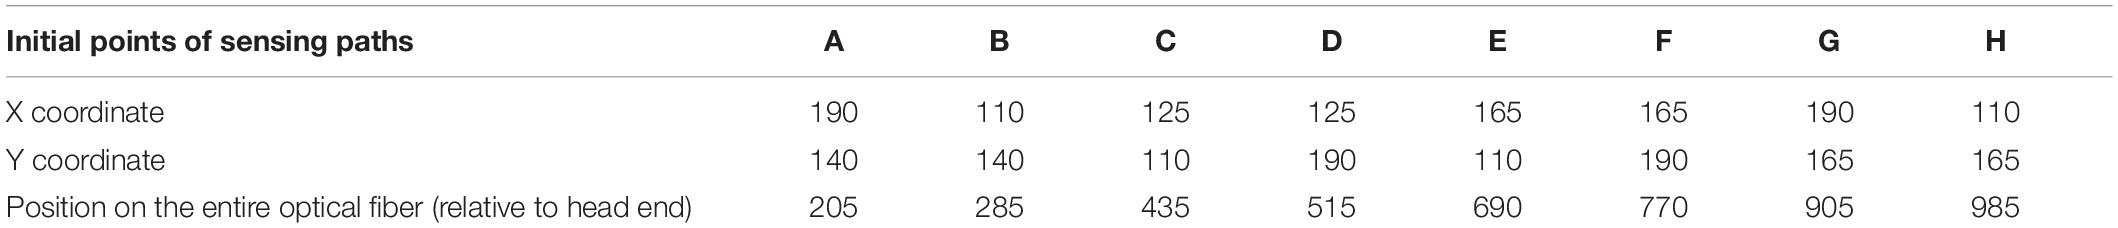
Table 2. The starting points of each optical fiber monitoring path (Unit: mm).
Figure 5 shows the layout of the piezoelectric-fiber hybrid sensor network of the aluminum alloy plate. To simulate the stress scenario of the wing skin, the bending test was conducted with five G-clamp fixed the aluminum plate evenly on the experimental rack. Five loading points distributed uniformly by magnets hooks at the free end of the aluminum plate. The baseline signal of the structure under the health state without load and the damage signal under crack growth were collected, respectively. Considering the magnet and hook will change the structure of the specimen, which will affect the propagation of the ultrasonic guided wave, the state of the magnet hook was served as the baseline of no load.
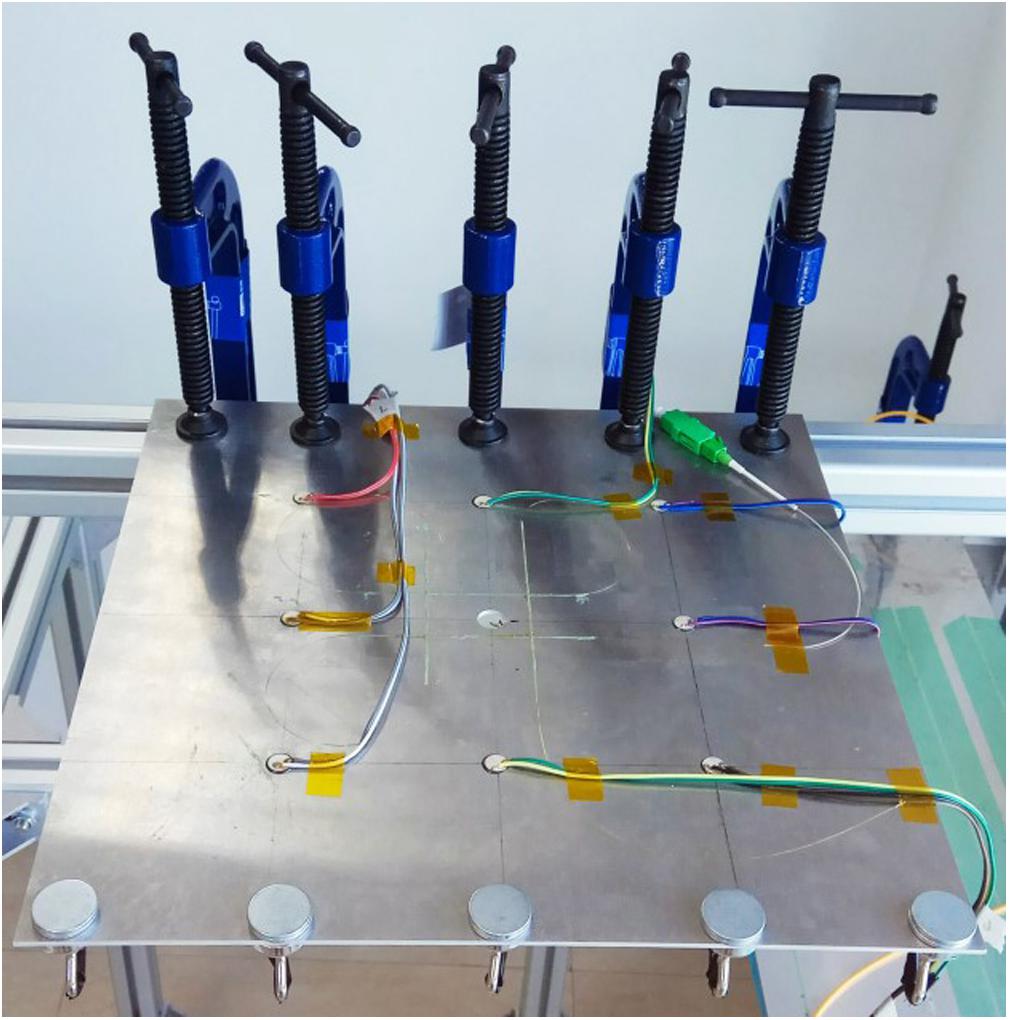
Figure 5. The layout of the fiber-piezoelectric hybrid sensor network.
The specific loading process mainly includes four steps:
Step 1: Collect the signals when the load is 0 g;
Step 2: Load weights in turn from 250 to 1500 g with intervals of 250 g for sampling;
Step 3: Prefabricate 1 mm long cracks at the edge of the circular hole, then repeat Steps 1 and 2;
Step 4: After the crack generated in Step 3 extended by 1 mm, repeat Step 1 and 2 until the crack extended to 6 mm.
In Figure 6A, the ScanGenie II monitoring system developed by Acellent was adopted as the monitoring system of ultrasonic guided waves, mainly completing the generation of excitation signals required by sensors and the collection of sensing signals. The signal of ultrasonic guided wave adopts the five-cycle sinusoid Hanning-modulated tone bursts, the frequency range of the excitation signal is 160–260 kHz with an interval of 20 kHz, and the amplitude of the excitation is 30 V. The selection of excitation signal frequency was mainly based on the quality of the direct S0 signal received by the sensor. For signals of multiple excitation frequencies, the S0 signal with little or no crosstalk was selected for analysis. In Figure 6B, the strain monitoring based on distributed optical fiber sensor was conducted by high-resolution fiber sensor interrogating system ODiSI-A (Optical Distributed Sensor Interrogator) of the American Luna Technology company. The optical fiber signal with a resolution of 0.5 cm/point was selected. It should be noted that since the two sensors are based on different working principles, data acquisition can be carried out simultaneously without affecting each other. During the experiment, all the tests were conducted within 10 min after the system was loaded to avoid the impact of vibration on the signal. To avoid the occurrence of accidental abnormal signals, outliers were removed from all signals, and the average value is taken for three times. Besides, the air conditioner was used to adjust the temperature of the laboratory, and a thermometer was placed around the specimen to control the temperature change in the range of 24.9–25.1°C.
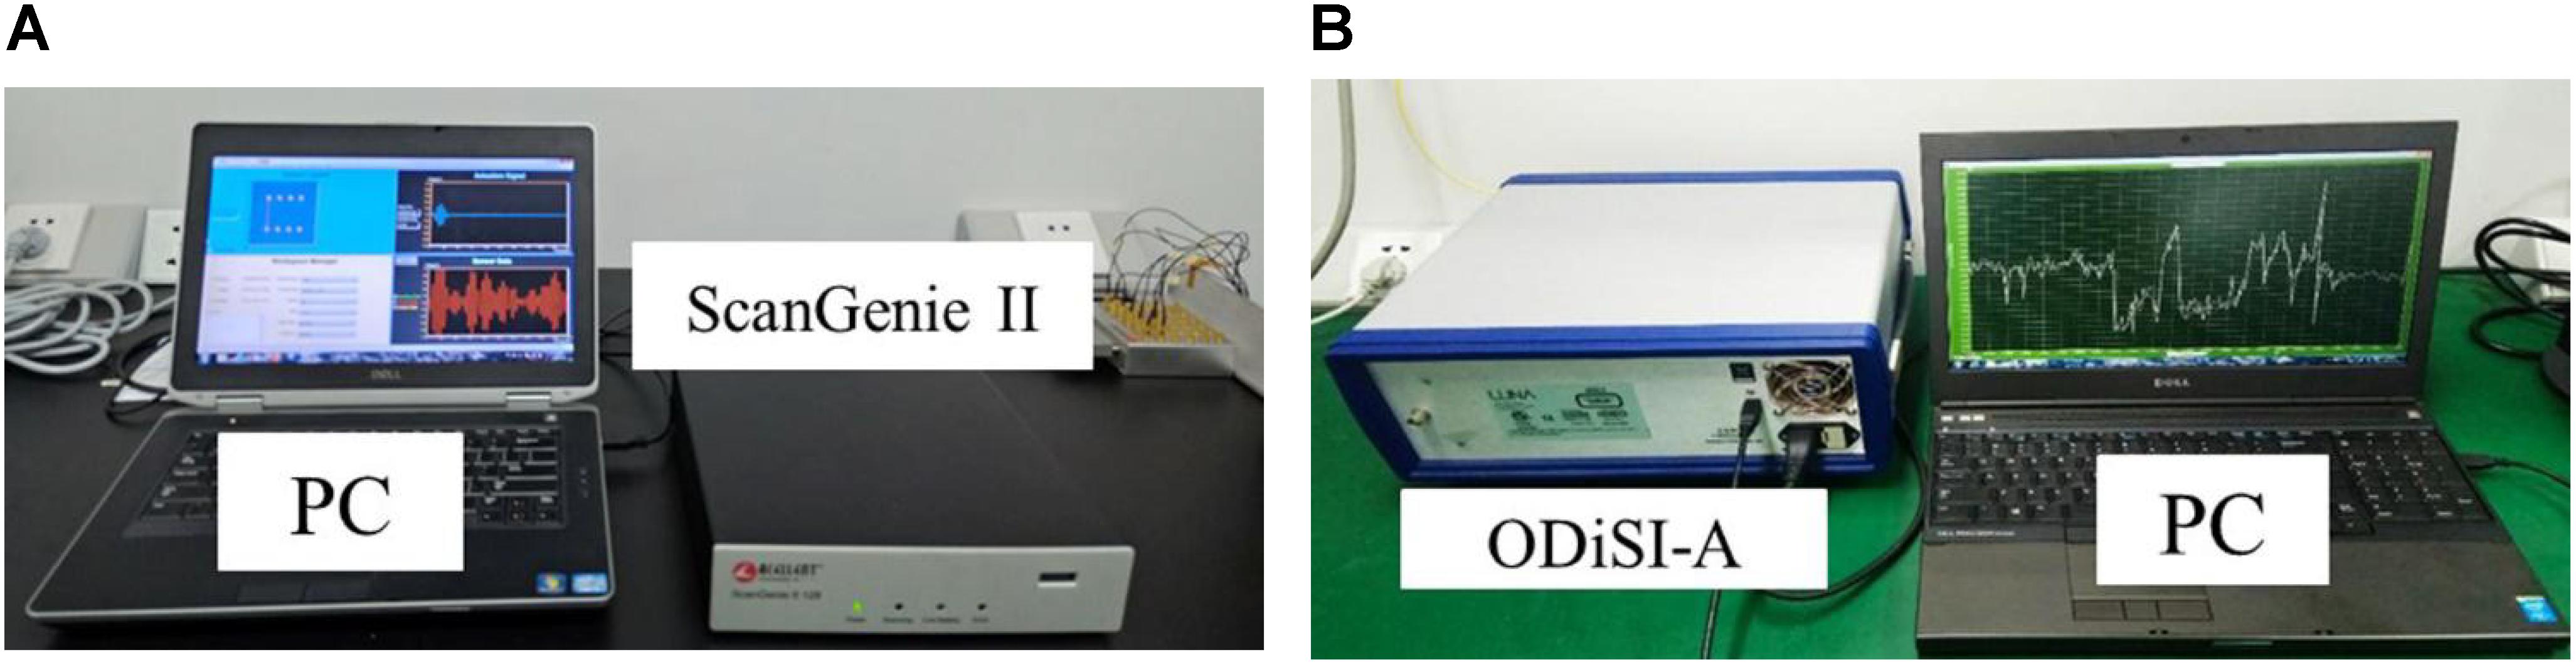
Figure 6. Experimental monitoring system for measuring signals of optical fibers and guided waves: (A) ScanGenie II, (B) ODiSI.
Two-Stage Fusion of Kalman Filtering for Damage Location Monitoring
According to the advantages and disadvantages of PZTs and optical fiber sensors, a two-stage Kalman filtering fusion was proposed to achieve damage location monitoring. The first stage is to fuse the features extracted from two types of sensors at a specific time at the feature level and predict the damage location. Then, the predicted damage location results at multiple specific times are fused at the decision level in the second fusion. In sections “Guided Wave Signal Analysis” and “Optical Fiber Signal Analysis,” the effects of load and crack length on the signals of PZTs and distributed optical fiber sensors were analyzed, respectively. In section “Multi-sensor Information Fusion Based on Two-Stage Kalman Filtering,” two-stage multi-sensor heterogeneous signal fusion for damage monitoring was conducted, and the monitoring results were compared with those of single-type sensors.
Guided Wave Signal Analysis
The guided wave signal based on PZTs was analyzed by the elliptic probability weighting method. It is easier to distinguish the damaged area from the healthy area by using the square value of DI for damage imaging. Figure 7 shows the damage diagnostic imaging of guided wave signals for 5 mm crack under the load from 0 to 1500 g. Different colors in the figure represent different DI squared values and correspond to different damage probabilities. The seven imaging results were all based on the health signal, and the maximum of DI was regarded as the position of damage center. Take 250 g as an example, the predicted damage was obtained by analyzing the difference between health signal and damage signal under the 250 g load. It can be seen that the position of the damage center does not change with the load.
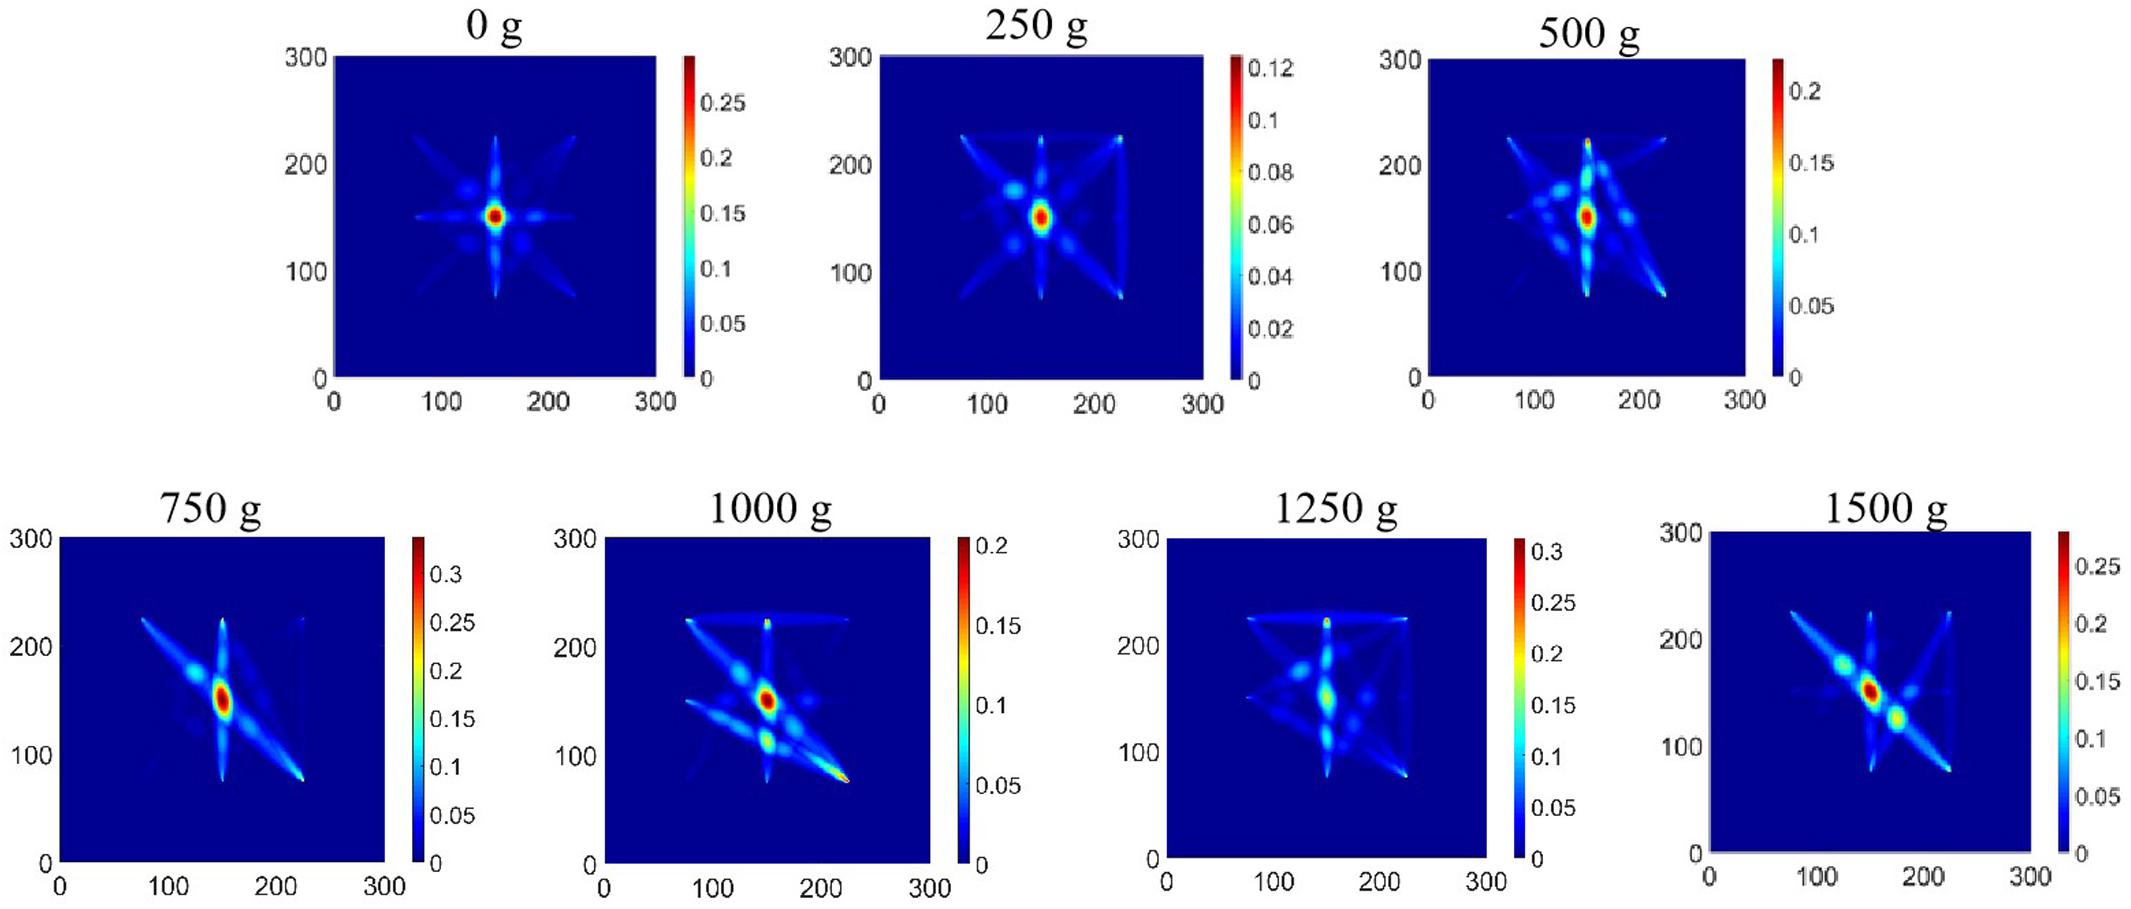
Figure 7. Guided wave damage imaging diagnosis under different loading quality (Load from 0 g to 1500 g at intervals of 250 g).
To compare DI values of different crack lengths under different loads, Figure 8 shows the DI value of optical fiber sensor for 1–8 mm crack under the load of 0–1500 g. It can be seen intuitively that the DI value of the 6 mm crack increases by leaps and bounds under different loads, and the damage is easily predicted. However, when the crack length is less than or equal to 5 mm, the DI value fluctuates within a lower range. Therefore, the sensitivity of the guided wave to the monitoring results with small damage is not high in this actuator-sensor path.
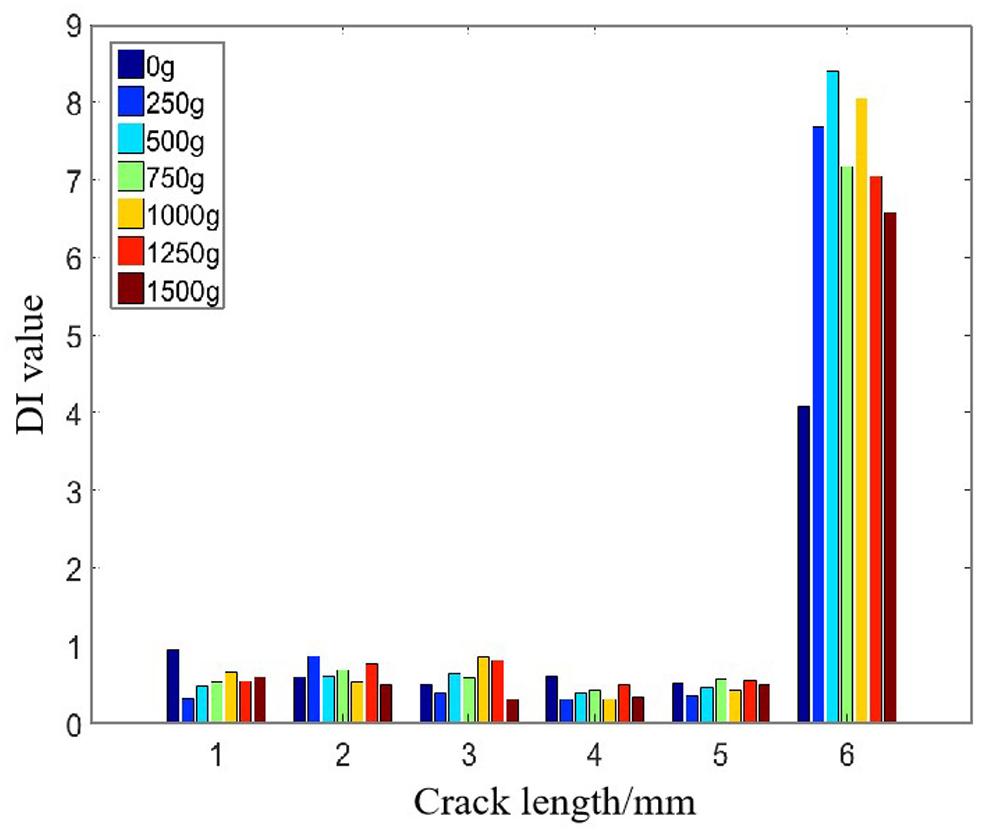
Figure 8. The effect of load and crack length on the guided wave damage imaging.
Considering that different loads have different effects on ultrasound guided wave diagnostic imaging, Table 3 lists four cases with a different combination of load and guided wave signals, corresponding to the guided wave imaging results in Figure 9. Take Case 1 as an example, the baseline signal is the health signal with no load, and the diagnostic signal is the damage signal with no load. However, the special reason for Case 3 is that the aluminum plate has not been damaged with no load, so it only corresponds to the health signal. It can be seen from Figure 9 that the change of baseline of guided wave damage imaging seriously affects the diagnosis result, and even leads to the misdiagnosis of damage location and number especially in Case 2. From Case 1–3, it can be seen that under the same baseline signal, i.e., no-load healthy signal, different diagnostic signals lead to completely different imaging diagnosis results. However, by comparing Case 3 and Case 4, no matter the no-load health signal or the 150 0g health signal as the baseline signal, the imaging results of the 1500 g damage signal are similar.

Table 3. The baseline and diagnostic signals of different cases.
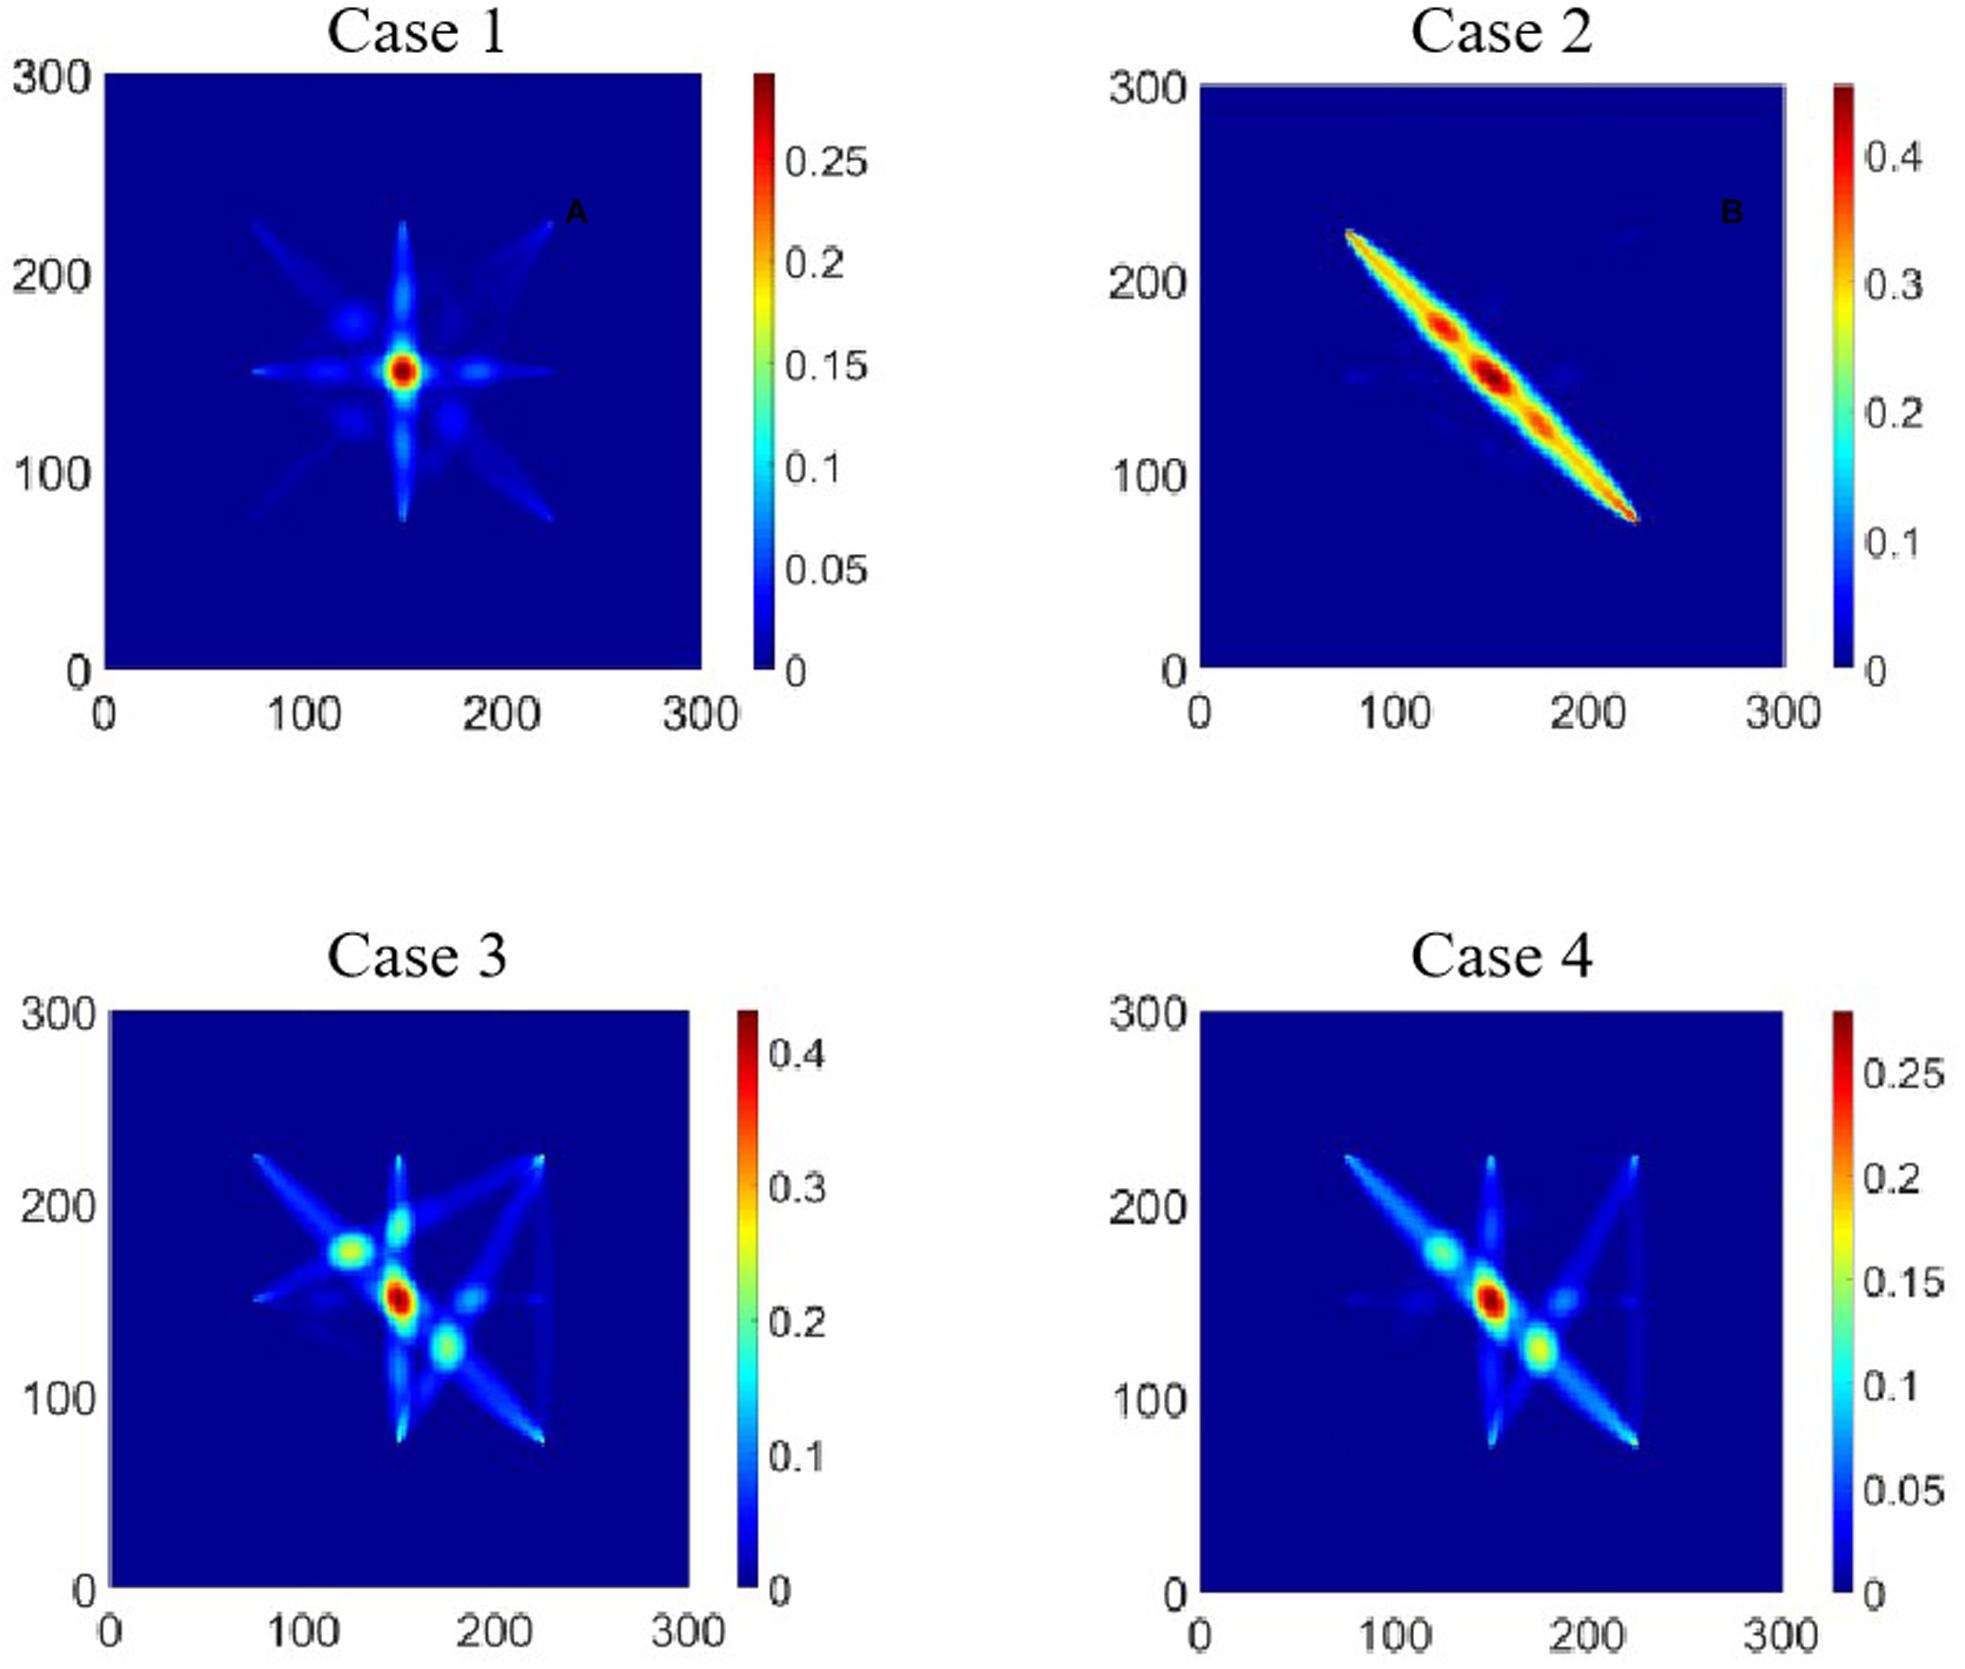
Figure 9. Damage location based on guided wave damage diagnosis in Cases 1–4.
Optical Fiber Signal Analysis
The DI values of optical fiber monitoring with crack growth in different segments were monitored under the load from 0 to 1500 g. Figure 10 shows the DI value of four segments (AB, CD, EF, and GH) with an undamaged and 1–6 mm crack under the load 1500 g. The points on the X-axis represent the position of each strain measurement point on the entire length of the distributed optical fiber sensor, which can be referred to in Table 2. The DI value of optical fiber monitoring is calculated by Equation (4), and the larger the DI value is, the greater the probability of damage or the more serious the damage is. It can be seen that with the increase of crack length, the DI values monitored by the four-segment optical fiber sensor increases. The changes of DI near the damage was more obvious than in the undamaged area, especially for AB and GH segments. This is because AB and GH segments are closer to the damage in the X direction than EF and CD segments in the X and Y direction.
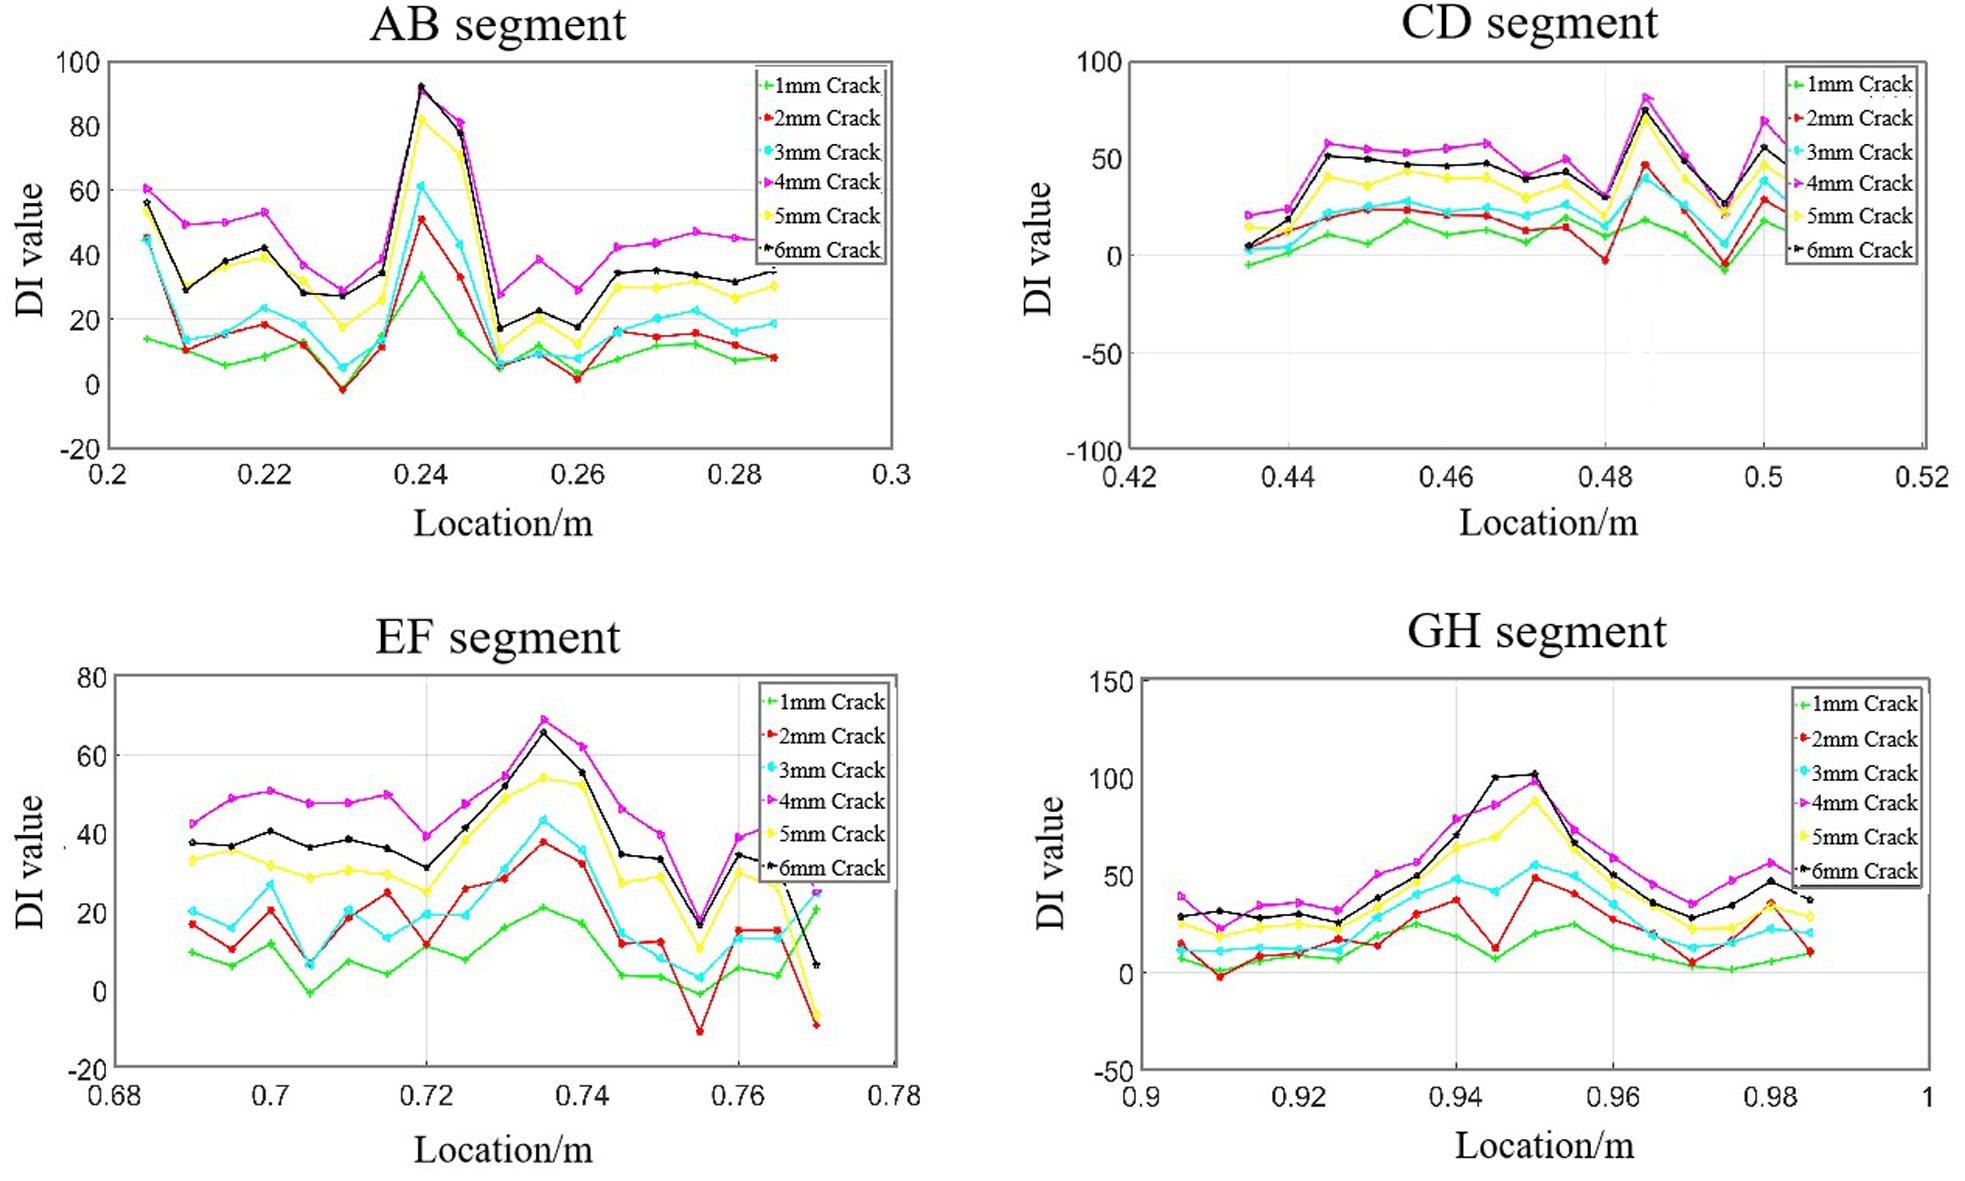
Figure 10. The DI changes of distributed optical fiber signal segments (AB, CD, EF, GH) with crack growth.
Figure 11 shows the DI values of optical fiber monitoring under the load from 0 to 1500 g under the 5 mm crack. The green marked area corresponding to the X-axis is the circular hole position in the center of the specimen, and the red marked signal area is the crack damage at the edge of the hole. Combined with the crack growth extending from point (155, 150) to the positive direction of the X-axis in Figure 3, the relative position relationship between the green region and the red region in Figure 11 can be verified. For the X direction of AB and EF segments, the crack is close to point A and F and away from point B and E, so the red areas are to the left and right of the green range. For the Y direction of CD and GH segments, the crack is in the middle of the circular hole, so the red area is within the green range. It can be seen from Figure 11 that the DI variation of AB, CD, and EF segments has a peak near the damage, while the DI value of the CD segment changes irregularly. This phenomenon indicates that the strain method based on optical fiber sensors has the shortcoming of monitoring area limitation. Therefore, a further fusion of optical fiber signals with other technology is necessary.
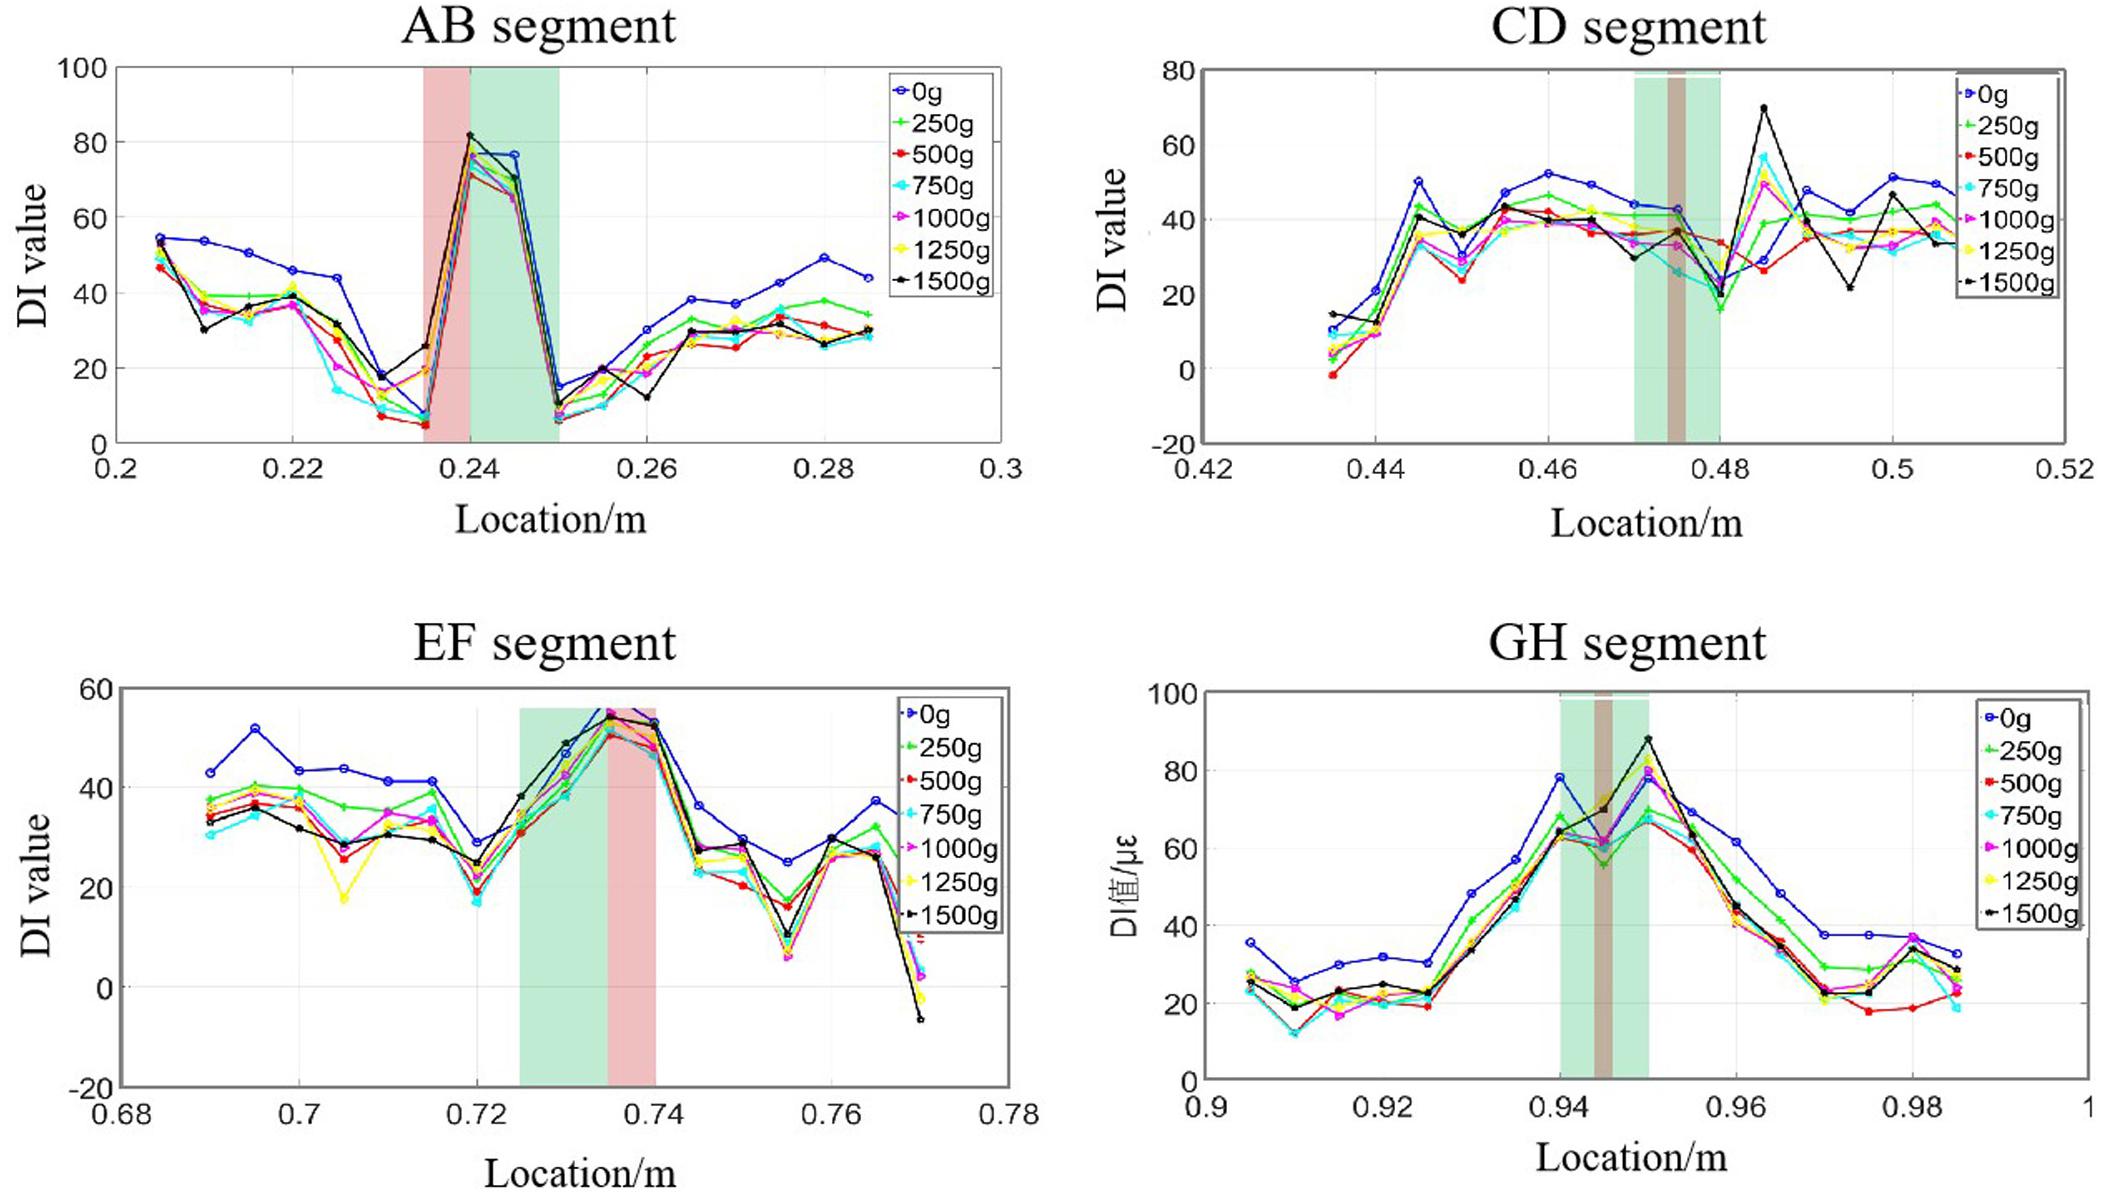
Figure 11. The effect of load under 5 mm crack on the DI value of distributed optical fiber segments (AB, CD, EF, GH).
According to Figure 4, AB and GH segments are closer to the damage center than CD and EF segments, the severity of damage can be represented by strain values at the damage center of the AB segment and GH segment. Figure 12 shows the strain value of the AB and GH segments of distributed optical fiber near the hole varies with load and crack length. It can be seen that the strain of damage center in AB and GH segment increases with the increase of load and crack length. The difference between AB and GH segment is that the strain value of the GH segment is relatively larger with better linearity, which is attributed to the strain change in Y direction mainly caused by the bending load.
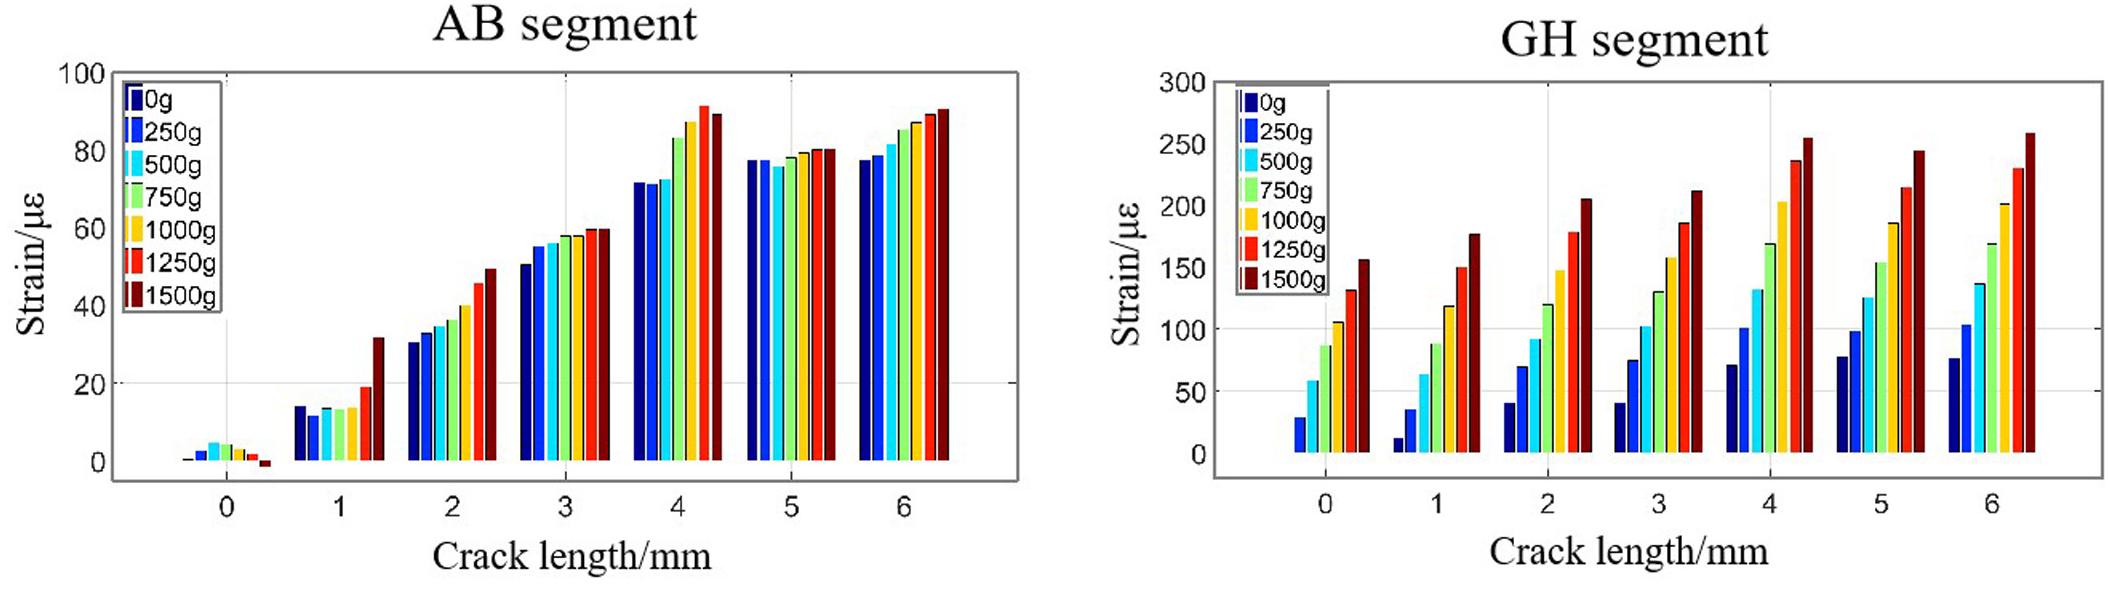
Figure 12. The effect of load and crack length on the strain of the distributed optical fiber segments (AB, GH) near the hole.
Multi-Sensor Information Fusion Based on Two-Stage Kalman Filtering
By analyzing the effects of loads and crack length on guided wave imaging and optical fiber strain in sections “Guided Wave Signal Analysis” and “Optical Fiber Signal Analysis,” it is found that both guided wave and fiber monitoring methods have advantages and disadvantages. For example, guided wave imaging diagnosis based on PZTs is prone to misjudgment due to baseline signal, and the monitoring area of fiber sensor monitoring is limited, only the signal along the fiber length direction can be monitored, etc. Therefore, the fusion of these two heterogeneous signals is very significant. However, the common multi-sensor Kalman filtering fusion needs to calculate the Kalman factor of each sensor at each moment, which requires a huge amount of computation. In this paper, an improved Kalman filtering, i.e., two-stage Kalman filtering fusion was proposed to achieve damage location monitoring at the feature level and decision level. In the first stage, the characteristics of the heterogeneous signal of PZTs and optical fiber sensors at time k were fused by Kalman filtering at the feature level, and predict the damage location which is also known as the weighted least square method. Then the second stage is to fuse the predicted damage location by the Kalman filtering at the decision level.
Table 4 shows a comparison of the damage center location predicted by single-type sensors and two-stage Kalman filtering fusion under different loads. Among them, the distance between the predicted damage center and the actual damage center is regarded as location error. It can be seen that the location error of the two-stage fusion method is less than that of the single-type sensors, and the location error of the single-type PZTs monitoring is less than that of single-type optical fiber monitoring. Besides, by comparing the location errors under different loads, it is found that the location errors of single-type PZTs monitoring remain unchanged, which confirms the conclusion in Figure 7. However, the location errors of single-type optical fiber sensor monitoring under high load are more accurate than those under low load, which means that the larger the structure deformation is, the more favorable it is for optical fiber monitoring.
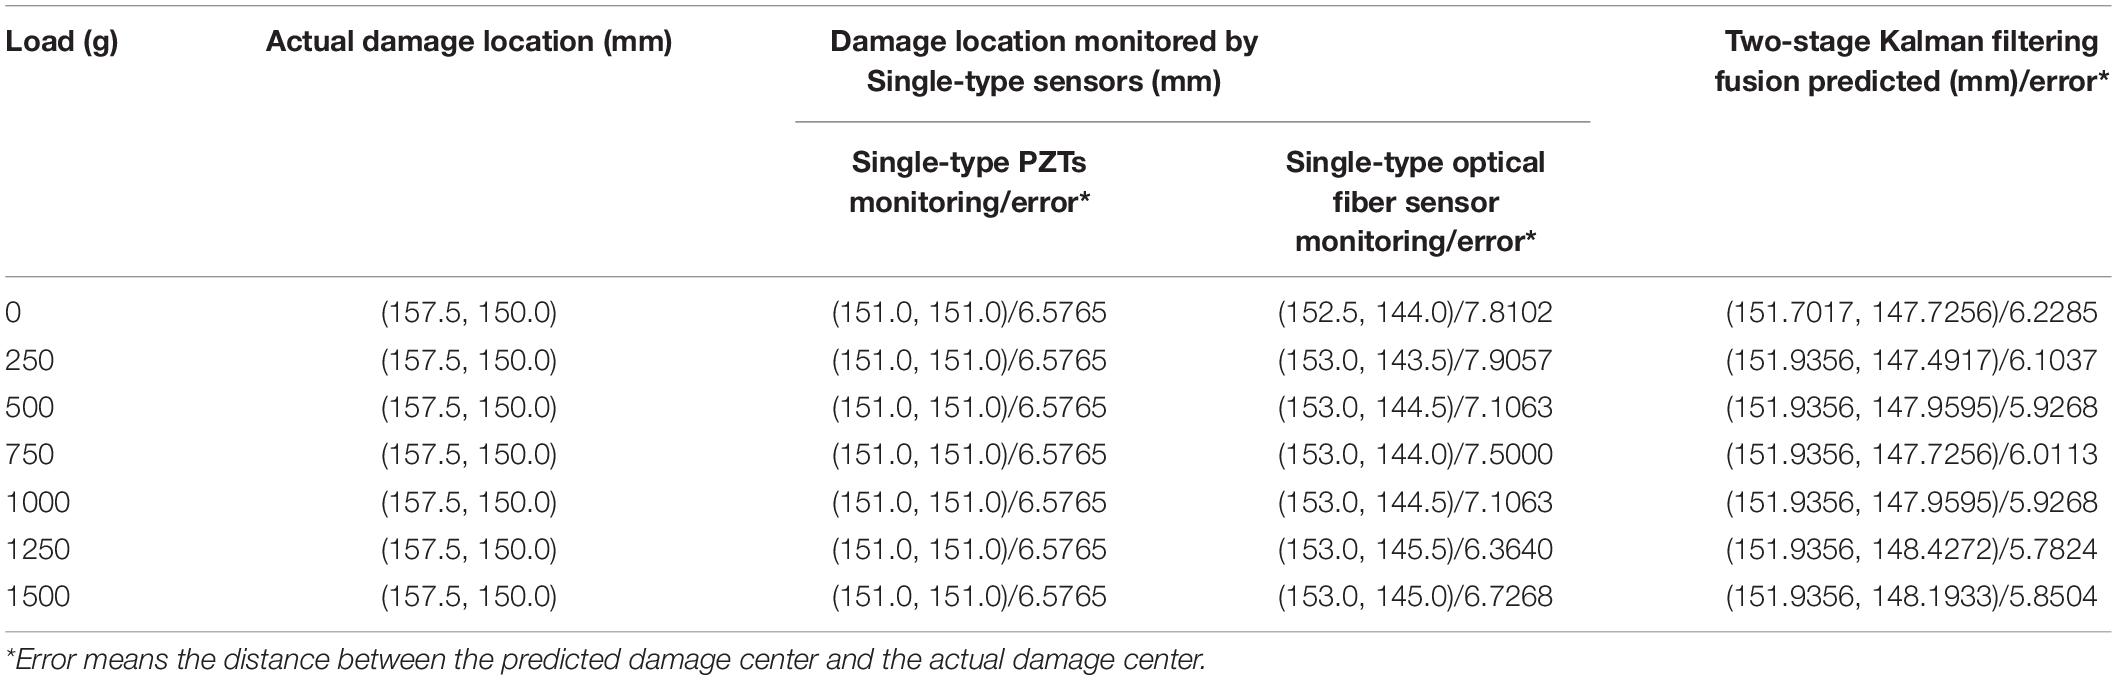
Table 4. The predicted damage center location and location error of single-type sensors and two-stage Kalman filtering fusion.
To further verify the accuracy of the proposed two-stage Kalman filtering fusion method, the reduction rate of location error was used, as shown in Formula (15). The higher the location error reduction rate means the higher the damage monitoring accuracy. Figure 13 shows the location error reduction rate of piezoelectric-fiber information fusion compared with single-type PZTs and single-type optical fiber sensor monitoring under different loads. It can be seen that the location error reduction rate of two-stage piezoelectric-fiber fusion is 5–12% compared with that of the single-type PZTs monitoring, and 9–23% compared with that of single optical fiber sensor monitoring. This indicates that the damage monitoring accuracy by two-stage fusion is higher, and the accuracy of optical fiber monitoring is greatly improved than that of PZTs monitoring.
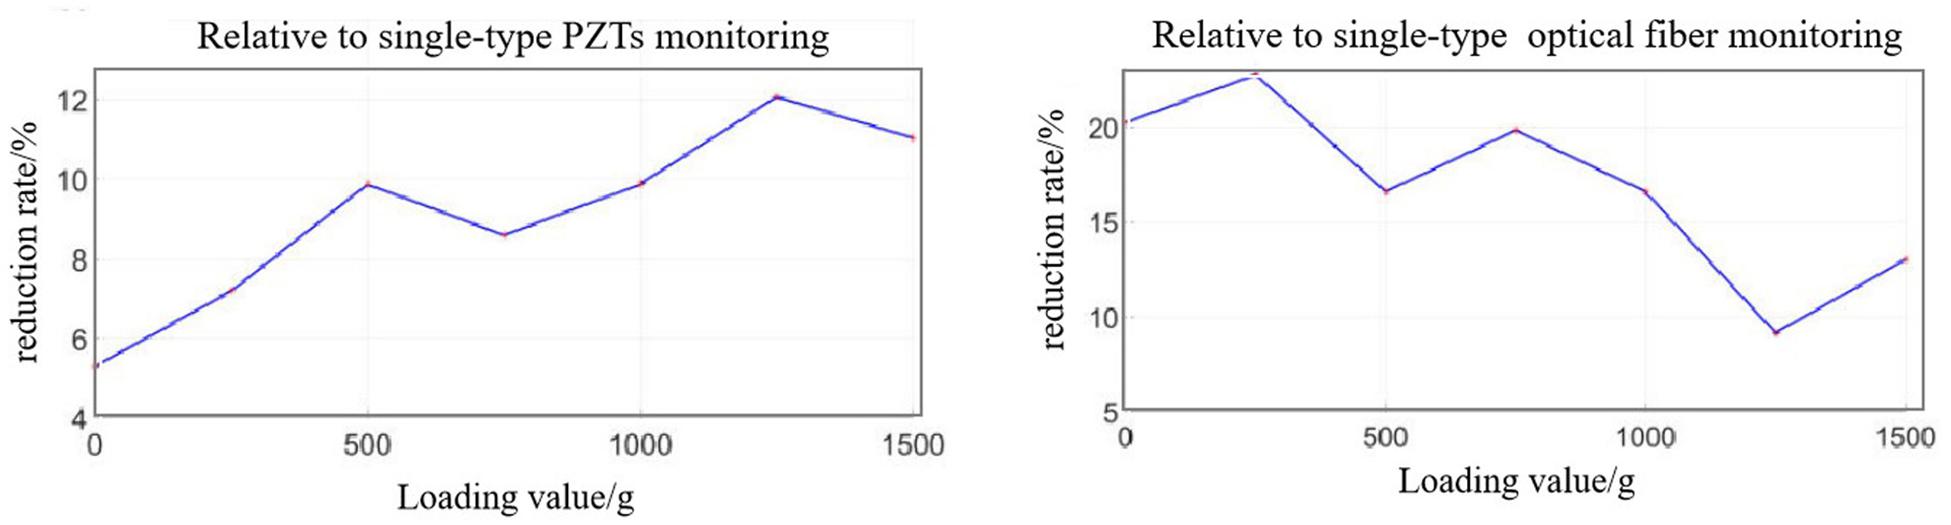
Figure 13. The location error reduction rate of the two-stage fusion relative to single-type PZTs and single-type optical fiber sensor monitoring.
Where RE is the reduction rate of the location error, Ri is the location error of the single-type sensors monitoring, and Ef is the location error by two-stage fusion.
Besides, to compare the predicted results of second-stage fusion with the first-stage fusion, Figure 14 shows the location error reduction rate of second-stage fusion relative to the first-stage fusion. The location error reduction rate of the second-stage fusion is within 0–7%, which is the highest when the load is 500g. This indicates that the predicted location is more accurate than that of the first-stage fusion. Therefore, the two-stage Kalman filtering fusion method reduces the damage misjudgment and the damage location error effectively.
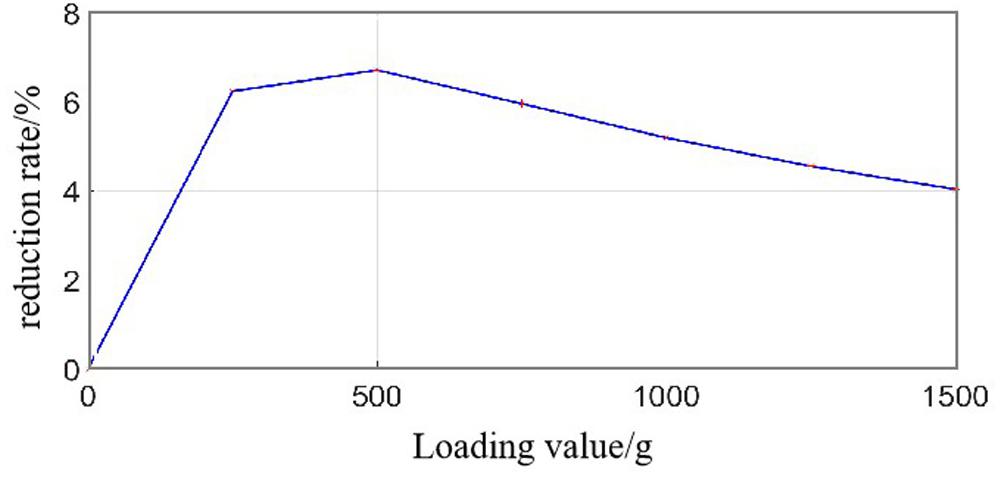
Figure 14. The location error reduction rate of second-stage fusion relative to the first-stage fusion.
Conclusion
In this paper, a two-stage Kalman filtering fusion method for crack growth location monitoring of the aviation aluminum plate is proposed. The heterogeneous signals are collected by piezoelectric-fiber hybrid sensor networks composed of piezoelectric transducers (PZTs) and distributed optical fiber sensors. The first stage is to fuse the features extracted from two types of sensors at a specific time at the feature level, and then predict the damage location. In the second fusion, the predicted damage location results at multiple specific times are fused at the decision level. The proposed two-step fusion method is verified by the experiment of hole edge crack growth monitoring under the bending moment load, and the effect of load on two kinds of sensor signals is analyzed. The experimental results show that, compared with single-type PZTs and single-type optical fiber sensor monitoring, multi-source sensing information fusion based on the two-stage Kalman filtering can reduce the damage misjudgment and improve the damage monitoring accuracy. The proposed two-step fusion method is expected to fuse other heterogeneous signals, such as acoustic emission, impedance, and eddy current signals, and can be extended to the fusion of more than two types of signals. Furthermore, multi-sensor data fusion can be further combined with artificial intelligence technology.
Data Availability Statement
The original contributions presented in the study are included in the article/supplementary material, further inquiries can be directed to the corresponding author.
Author Contributions
YSW, LS, and MH designed the experiments and conducted the data analysis. LS and MH carried out the experiments. YW, LZ, and DW contributed to the planning and coordination of the project. YSW, MH, and LS wrote and edited the manuscript. All authors participated in a discussion about the results and the manuscript.
Funding
The present work was supported by the National Key Research and Development Program of China (2019YFC0312400 and 2017YFE0132000) and the State Key Laboratory of Structural Analysis for Industrial Equipment (S18408).
Conflict of Interest
The authors declare that the research was conducted in the absence of any commercial or financial relationships that could be construed as a potential conflict of interest.
References
Bohacova, M. (2013). Methodology of short fatigue crack detection by the eddy current method in a multi-layered metal aircraft structure. Eng. Failure Anal. 35, 597–608. doi: 10.1016/j.engfailanal.2013.06.009
Cui, P. Y., and Huang, X. R. (2001). Multi-sensor information fusion algorithm based on federal Kalman filter and its application. Electr. Mach.Control 5, 204–207.
Gravina, R., Alinia, P., Ghasemzadeh, H., and Fortino, G. (2017). Multi-sensor fusion in body sensor networks: state-of-the-art and research challenges. Inform. Fusion. 35, 68–80. doi: 10.1016/j.inffus.2016.09.005
Kalman, R. E. (1960). A new approach to linear filtering and prediction problems. J. Basic. Eng. 82, 35–45. doi: 10.1115/1.3662552
Kreger, S. T., Sang, A. K., Gifford, D. K., and Froggatt, M. E. (2009). “Distributed strain and temperature sensing in plastic optical fiber using Rayleigh scatter,” in Proceedings of SPIE - The International Society for Optical Engineering, Orlando, FL, doi: 10.1117/12.821353
Lau, K. (2014). Structural health monitoring for smart composites using embedded FBG sensor technology. Mater. Sci. Technol. 30, 1642–1654. doi: 10.1179/1743284714Y.0000000608
Liang, D., and Yuan, S. F. (2015). Decision fusion system for bolted joint monitoring. Shock Vib. 2015, 1–11. doi: 10.1155/2015/592043
Liu, K., Ma, S., Wu, Z. J., Zheng, Y. B., Qu, X. X., Wang, Y. S., et al. (2016a). A novel probability-based diagnostic imaging with weight compensation for damage localization using guided waves. Struct. Health Monit. 15, 162–173. doi: 10.1177/1475921715627491
Liu, K., Wu, Z. J., Jiang, Y. Q., Wang, Y. S., Zhou, K., and Chen, Y. P. (2016b). Guided waves based diagnostic imaging of circumferential cracks in small-diameter pipe. Ultrasonics 65, 34–42. doi: 10.1016/j.ultras.2015.10.025
Memmolo, V., Maio, L., Boffa, N. D., Monaco, E., and Ricci, F. (2016). Damage detection tomography based on guided waves in composite structures using a distributed sensor network. Opt. Eng. 55:011007. doi: 10.1117/1.OE.55.1.011007
Michalcová, L., and Růžek, R. (2016). Fatigue test of an integrally stiffened panel: prediction and crack growth monitoring using acoustic emission. Proc. Struct. Integr. 2, 3049–3056. doi: 10.1016/j.prostr.2016.06.381
Min, J., Park, S., Yun, C. B., Lee, C. G., and Lee, C. (2012). Impedance-based structural health monitoring incorporating neural network technique for identification of damage type and severity. Eng. Struct. 39, 210–220. doi: 10.1016/j.engstruct.2012.01.012
Miniaci, M., Mazzotti, M., Radzienski, M., Kudela, P., Kherraz, N., Bosia, F., et al. (2019). Application of a laser-based time reversal algorithm for impact localization in a stiffened aluminum plate. Front. Mater. 6:30. doi: 10.3389/fmats.2019.00030
Qing, X. L., Kumar, A., Zhang, C., Gonzalez, I. F., Guo, G. P., and Chang, F. K. (2005). A hybrid piezoelectric/fiber optic diagnostic system for structural health monitoring. Smart Mater. Struct. 14:S98. doi: 10.1088/0964-1726/14/3/012
Qing, X. L., Li, W. Z., Wang, Y. S., and Sun, H. (2019). Piezoelectric transducer-based structural health monitoring for aircraft applications. Sensors 19:545. doi: 10.3390/s19030545
Qing, X. L., Wang, Y. S., and Zhao, L. (2012). Structural health monitoring technology and its application in aeronautics and astronautics. J. Exp. Mech. 27, 517–526.
Shan, Y. N., Xu, H., Zhou, Z. H., Yuan, Z. Y., Xu, X. S., and Wu, Z. J. (2019). State sensing of composite structures with complex curved surface based on distributed optical fiber sensor. J. Intell. Mater. Syst. Struct. 30, 1951–1968. doi: 10.1177/1045389X19849287
Su, Z. Q., Wang, X. M., Cheng, L., Yu, L., and Chen, Z. P. (2009). On selection of data fusion schemes for structural damage evaluation. Struct. Health. Monit. 8, 223–241. doi: 10.1177/1475921708102140
Sun, L., Wang, Y. S., Miao, B. R., Wu, D., Sun, H., and Qing, X. L. (2018). “Research on structural health monitoring method based on multi-source sensing information fusion,” in Proceedings of the 7th Asia-Pacific Workshop on Structural Health Monitoring, APWSHM 2018, Hongkong, 670–681.
Tang, D., Chen, J., Wu, W. H., Jin, L. Y., Yue, Q. J., Xie, B., et al. (2020). Research on sampling rate selection of sensors in offshore platform shm based on vibration. Appl. Ocean. Res. 101, 102–192. doi: 10.1016/j.apor.2020.102192
Villegas, I. F. (2019). Ultrasonic welding of thermoplastic composites. Front. Mater. 6:291. doi: 10.3389/fmats.2019.00291
Wang, Y. S., Gao, T., Liu, D. B., Sun, H., Miao, B. G., and Qing, X. L. (2019). Propagation characteristics of ultrasonic weld-guided waves in friction stir welding joint of same material. Ultrasonics 102:106058. doi: 10.1016/j.ultras.2019.106058
Woods, J., and Radewan, C. (1977). Kalman filtering in two dimensions. IEEE Trans. Inf. Theory. 23, 473–482. doi: 10.1109/tit.1977.1055750
Wu, J., Su, Y., Zhu, Y., and Deng, C. (2017). Real-time remaining useful life prediction of cutting tool based on information fusion. J. Huazhong Univ. Sci. Technol. 45, 1–5. doi: 10.13245/j.hust.170401
Wu, Z. J., Liu, K. H., Wang, Y. S., and Zheng, Y. B. (2015). Validation and evaluation of damage identification using probability-based diagnostic imaging on a stiffened composite panel. J. Intell. Mater. Syst. Struct. 26, 2181–2195. doi: 10.1177/1045389X14549873
Wu, Z. J., Qing, X. L., and Chang, F. K. (2009). Damage detection for composite laminate plates with a distributed hybrid PZT/FBG sensor network. J. Intell. Mater. Syst. Struct. 20, 1069–1077. doi: 10.1177/1045389X08101632
Keywords: structural health monitoring, multi-sensor information fusion, Kalman filtering, piezoelectric transducers, guided waves, optical fiber sensor
Citation: Wang Y, He M, Sun L, Wu D, Wang Y and Zou L (2020) Improved Kalman Filtering-Based Information Fusion for Crack Monitoring Using Piezoelectric-Fiber Hybrid Sensor Network. Front. Mater. 7:300. doi: 10.3389/fmats.2020.00300
Received: 28 June 2020; Accepted: 11 August 2020;
Published: 31 August 2020.
Edited by:
Jun Wu, Huazhong University of Science and Technology, ChinaReviewed by:
Lingling Lu, Institute of Mechanics (CAS), ChinaCheng Liu, Stanford University, United States
Bo Ye, Kunming University of Science and Technology, China
Copyright © 2020 Wang, He, Sun, Wu, Wang and Zou. This is an open-access article distributed under the terms of the Creative Commons Attribution License (CC BY). The use, distribution or reproduction in other forums is permitted, provided the original author(s) and the copyright owner(s) are credited and that the original publication in this journal is cited, in accordance with accepted academic practice. No use, distribution or reproduction is permitted which does not comply with these terms.
*Correspondence: Yue Wang, wangjk1977@vip.sina.com; Li Zou, lizou@dlut.edu.cn