Detections of Whale Vocalizations by Simultaneously Deployed Bottom-Moored and Deep-Water Mobile Autonomous Hydrophones
 Selene Fregosi1*
  Danielle V. Harris2
  Haruyoshi Matsumoto1
  David K. Mellinger1 Jay Barlow3
  Simone Baumann-Pickering4
  Holger Klinck5,6
- 1Cooperative Institute for Marine Resources Studies, NOAA Pacific Marine Environmental Laboratory and Oregon State University, Hatfield Marine Science Center, Newport, OR, United States
- 2Centre for Research into Ecological and Environmental Modelling, The Observatory, Buchanan Gardens, University of St Andrews, St Andrews, United Kingdom
- 3NOAA National Marine Fisheries Service, Southwest Fisheries Science Center, Marine Mammal and Turtle Division, La Jolla, CA, United States
- 4Scripps Institution of Oceanography, University of California, San Diego, La Jolla, CA, United States
- 5Center for Conservation Bioacoustics, Cornell Lab of Ornithology, Cornell University, Ithaca, NY, United States
- 6Marine Mammal Institute, Department of Fisheries and Wildlife, Oregon State University, Newport, OR, United States
Advances in mobile autonomous platforms for oceanographic sensing, including gliders and deep-water profiling floats, have provided new opportunities for passive acoustic monitoring (PAM) of cetaceans. However, there are few direct comparisons of these mobile autonomous systems to more traditional methods, such as stationary bottom-moored recorders. Cross-platform comparisons are necessary to enable interpretation of results across historical and contemporary surveys that use different recorder types, and to identify potential biases introduced by the platform. Understanding tradeoffs across recording platforms informs best practices for future cetacean monitoring efforts. This study directly compares the PAM capabilities of a glider (Seaglider) and a deep-water profiling float (QUEphone) to a stationary seafloor system (High-frequency Acoustic Recording Package, or HARP) deployed simultaneously over a 2 week period in the Catalina Basin, California, United States. Two HARPs were deployed 4 km apart while a glider and deep-water float surveyed within 20 km of the HARPs. Acoustic recordings were analyzed for the presence of multiple cetacean species, including beaked whales, delphinids, and minke whales. Variation in acoustic occurrence at 1-min (beaked whales only), hourly, and daily scales were examined. The number of minutes, hours, and days with beaked whale echolocation clicks were variable across recorders, likely due to differences in the noise floor of each recording system, the spatial distribution of the recorders, and the short detection radius of such a high-frequency, directional signal type. Delphinid whistles and clicks were prevalent across all recorders, and at levels that may have masked beaked whale vocalizations. The number and timing of hours and days with minke whale boing sounds were nearly identical across recorder types, as was expected given the relatively long propagation distance of boings. This comparison provides evidence that gliders and deep-water floats record cetaceans at similar detection rates to traditional stationary recorders at a single point. The spatiotemporal scale over which these single hydrophone systems record sounds is highly dependent on acoustic features of the sound source. Additionally, these mobile platforms provide improved spatial coverage which may be critical for species that produce calls that propagate only over short distances such as beaked whales.
Introduction
Passive acoustic monitoring (PAM) is a cost-effective, non-invasive tool for surveying marine mammal populations, particularly cryptic species such as deep-diving beaked whales (Zimmer et al., 2008; Yack et al., 2013) and minke whales (Balaenoptera acutorostrata; Martin et al., 2013; Risch et al., 2013) for which visual sighting methods are less effective (Rankin and Barlow, 2005; Barlow and Gisiner, 2006). Commonly used PAM methodologies include fixed (autonomous or cabled) platforms as either single sensors or arrays of sensors, and arrays of hydrophones towed behind a vessel (Mellinger et al., 2007; von Benda-Beckmann et al., 2010; Martin et al., 2013; Yack et al., 2013; Baumann-Pickering et al., 2014; Širović et al., 2015; Henderson et al., 2016; Norris et al., 2017). Different recording platforms have tradeoffs in survey coverage over space and time (Van Parijs et al., 2009).
Fixed autonomous recorders are valuable tools for monitoring marine mammals, but they have a variety of limitations. They are typically deployed for long time periods (months to years), but spatial coverage is limited to a specific detection radius around the unit (Mellinger et al., 2007). This detection radius is dependent on various factors including source level and frequency of the target signal, the location, directivity, and behavior of the vocalizing animal, local sound propagation conditions, and ambient noise levels (Urick, 1983; Kuperman and Roux, 2007; Mellinger et al., 2007; Zimmer et al., 2008; Ward et al., 2011; Helble et al., 2013; Gkikopoulou, 2018). Mean detection radii can range from many tens of kilometers for a low-frequency baleen whale call (Stafford et al., 2007; Širović et al., 2007) to only a few hundred meters for a highly directional and ultrasonic porpoise echolocation click (Kyhn et al., 2012). Deployment locations may be limited by accessibility to the monitoring area and seafloor depth. For example, deploying a fixed autonomous recorder in offshore, deep waters can be logistically difficult. Multiple fixed recorders can be deployed in an array configuration to cover a larger spatial area than a single instrument, and some instruments are cabled to land to provide real-time data streams (Jarvis et al., 2014; Klinck et al., 2016). However, increasing the number of recorders increases costs and produces terabytes of data that can be difficult to analyze efficiently (Van Parijs et al., 2009; Roch et al., 2016).
Towed arrays solve some of the spatial limitations of fixed hydrophones but have additional logistical constraints. They provide improved spatial coverage; a ship can survey across a variety of habitat types in a short time period (Mellinger et al., 2007). Additionally, visual observers on ship-borne surveys can visually confirm recorded species and identify non-vocalizing animals (Rankin and Barlow, 2005; Rankin et al., 2007) and link acoustic and surface behaviors (Miller and Tyack, 1998). Towed arrays, like fixed arrays, can be used to identify and track vocalizing individual animals (Thode, 2004; Quick and Janik, 2012) and allow for estimation of density or abundance through a distance sampling framework (Buckland et al., 2001; Barlow and Taylor, 2005; Norris et al., 2017). However, towed-array surveys are typically limited to only a few weeks to a few months in duration (Mellinger and Barlow, 2003). They are also limited to seasons with workable weather, are not ideal for monitoring low-frequency vocalizing baleen whales because calls are masked by ship and flow noise, and vessel presence can alter vocal behavior of the study animals (Lesage et al., 1999; Thode, 2004; Norris et al., 2012; Guerra et al., 2014; Heinemann et al., 2016).
Mobile autonomous systems have the potential to address the spatiotemporal tradeoff of long-duration, but low spatial coverage possible with fixed recorders and greater spatial coverage, but short durations typical of vessel-based surveys. Untethered platforms can cover large areas in space over longer time periods than a typical vessel-based survey. While there are several additional types of mobile autonomous systems we will not discuss here (e.g., autonomous sailboats, Klinck et al., 2014; Wave Gliders, Wiggins et al., 2010; near-surface drifting recorders, Griffiths and Barlow, 2015; see Verfuss et al., 2019 for a thorough review), this study focused on two deep-water mobile autonomous systems: deep-water profiling floats and underwater gliders. Deep-water profiling floats are buoyancy-driven sensor platforms that drift at a pre-programmed depth for weeks to months (Matsumoto et al., 2006; Roemmich et al., 2009). Horizontal movement of deep-water profiling floats follows that of the deep-water currents. Underwater gliders are similar to deep-water profiling floats in their operation and communication, but have the added advantage of being able to traverse currents (Rudnick et al., 2004). However, this horizontal movement comes at the cost of increased low-frequency (<100 Hz) noise from water flow and noise from platform operation which could mask cetacean sounds of interest (Fregosi et al., 2020). Further, the continual movement (both horizontally and vertically) means that local sound propagation conditions and therefore the detection radius around a mobile platform may be continually changing (Helble et al., 2013; Gkikopoulou, 2018). Estimating the exact area surveyed, which is necessary for understanding species distributions and density estimation, is non-trivial (Gkikopoulou, 2018; Thomas et al., 2019; Fregosi, 2020).
Acoustically equipped mobile autonomous platforms, such as underwater gliders and profiling floats, can effectively record a variety of marine mammal species (Baumgartner et al., 2013; Matsumoto et al., 2013; Nieukirk et al., 2016; Küsel et al., 2017) including beaked whales (Klinck et al., 2012), delphinids (Silva et al., 2019), and minke whales (Klinck et al., 2015). Detection rates of the low-frequency fin whale (Balaenoptera physalus) 20-Hz pulse have been quantitatively compared to a cabled bottom-mounted hydrophone array (Fregosi et al., 2020). However, no quantitative comparison has been made of detection capabilities for these platforms relative to other well-characterized bottom-moored systems, such as the High-frequency Acoustic Recording Package (HARP; Wiggins and Hildebrand, 2007). This comparison is helpful as mobile autonomous recorders become more widely used for marine mammal monitoring. In order to ensure that any differences in results collected by different systems are in fact indicative of real differences in animal distribution, abundance, and/or behavior, it is important we understand the differences introduced by each PAM recorder and platform.
We present results from an experiment in which a glider (Seaglider) and a deep-water profiling float (QUEphone) outfitted with autonomous hydrophone recorders were deployed simultaneously in the vicinity of two fixed recorders (HARPs). The recorders were deployed in the Catalina Basin within the Southern California Bight, where many marine mammal species are known to occur (Barlow, 2016). We compare detection rates for three types of marine mammal vocalizations – beaked whale echolocation clicks, small delphinid whistles and clicks, and minke whale boings – at several temporal scales (by call, encounter, hour, and day). We compare and contrast each vehicle’s capabilities and discuss likely causes of observed differences. Finally, we provide recommendations for future applications of mobile autonomous vehicles for monitoring a variety of marine mammal species.
Materials and Methods
Recording Platforms and PAM Systems
The SeagliderTM (Huntington Ingalls Industries, Lynnwood, WA, United States; Eriksen et al., 2001) is a buoyancy-driven, deep-diving autonomous vehicle capable of descending and ascending between the surface and 1000 m depth. Buoyancy is controlled by pumping oil between a reservoir in the glider’s pressure housing and an external bladder, changing the glider’s volume and hence density. The resultant vertical motion is converted to horizontal motion by the glider’s wings. Longitudinal and rotational movement of the internal batteries moves the glider’s center of gravity and provide changes in vehicle roll and pitch, allowing the vehicle to be steered toward a waypoint. When at the surface, the glider is remotely programmed by a shore-based pilot via IridiumTM satellite communications to transit between specified waypoints. Typical speeds are 0.25 m/s (0.5 knots) horizontally and 0.10–0.15 m/s (0.2–0.3 knots) vertically. Dive cycle durations are dive-depth dependent and typically last 4–6 h, with brief (5–10 min) surface intervals for communication with the shore-based pilot. Additionally, the Seaglider is outfitted with an unpumped conductivity-temperature-depth (CTD) sensor (Sea-Bird Electronics, Inc., Bellevue, WA, United States) that provides in situ measurements of salinity and temperature. Therefore sound speed profiles for the study area can be accurately measured throughout the survey.
The QUEphone is a modified APEXTM float (Teledyne Webb Research, North Falmouth, MA, United States; Matsumoto et al., 2006). The QUEphone’s depth is controlled by changes in buoyancy in a manner similar to the Seaglider. It is capable of descending to 1500 m. Once at the programmed depth, it drifts passively with the currents rather than navigating between specified waypoints. Dive depth and timing of surface intervals are controlled remotely via satellite.
Both the Seaglider and QUEphone were outfitted with an acoustic recording system, the Wideband Intelligent Signal Processor and Recorder (WISPR; Embedded Ocean Systems, Inc., Boston, MA, United States). WISPR can record continuously at a 125 kHz sampling rate with 16-bit resolution (±5 V clipping level; Matsumoto et al., 2015). The recording system on both the glider and float can be programmed to turn on and off at a specific depth and can be reconfigured remotely via satellite. Both the Seaglider and QUEphone were equipped with HTI-92-WB hydrophones with sensitivities of −162.5 (Seaglider) and −174.7 dB (QUEphone) and a flat frequency response (±3 dB) from 2 Hz to 50 kHz (High Tech Inc., Gulfport, MS, United States). The WISPR system applies a pre-whitening filter configured for typical deep ocean ambient noise to optimize the dynamic range of the system; the spectral effects of this filter were reversed (removed) before the analysis described below. The WISPR system has a relatively low system noise floor. Above 20 kHz the noise floor is approximately 28 dB re 1 μPa2/Hz and approaches ambient sound levels at sea state zero.
The HARP is a stationary autonomous recorder that has been used in many marine mammal PAM studies (e.g., Hildebrand et al., 2015; Širović et al., 2015; Wiggins and Hildebrand, 2016). It can record continuously or at a pre-programmed duty cycle at up to 320 kHz and 16-bit resolution for extended periods, and in this configuration, had a relatively flat system sensitivity across all frequencies. The noise floor of the HARP above 20 kHz was higher than that of low wind and low sea state ambient sound levels (Wiggins et al., 2018). From 30 to 60 kHz, the noise floor of the HARP was about 10 dB higher (38 dB re 1 μPa2/Hz) than that of the WISPR system. Clipping levels were reached at about 170 dB re 1 μPa2/Hz with the HARP. This resulted in a smaller detection range than the WISPR system yet allowed animals closer to be recorded without clipping.
Field Experiment
Two HARPs (H01 and H02), one Seaglider (SG607), and one QUEphone (Q003) were deployed and operated in the Catalina Basin from 19 July to 2 August 2016. The Catalina Basin is a steep-walled ocean basin between Santa Catalina and San Clemente Islands, California, with a basin floor depth of approximately 1000–1300 m. The HARPs were deployed on 19 July near the center of the basin at a depth of roughly 1,250 m with 4 km of separation (Figure 1). The two instruments were aligned to follow the dominant surface current observed in situ (from deployed surface floats) on the day of deployment. The two HARPs began recording 20 July 2016 at 1100 UTC (H02) and 1200 UTC (H01) and recorded continuously at 200 kHz sample rate with 16-bit resolution. They were recovered at approximately 0800 UTC on 2 August 2016.
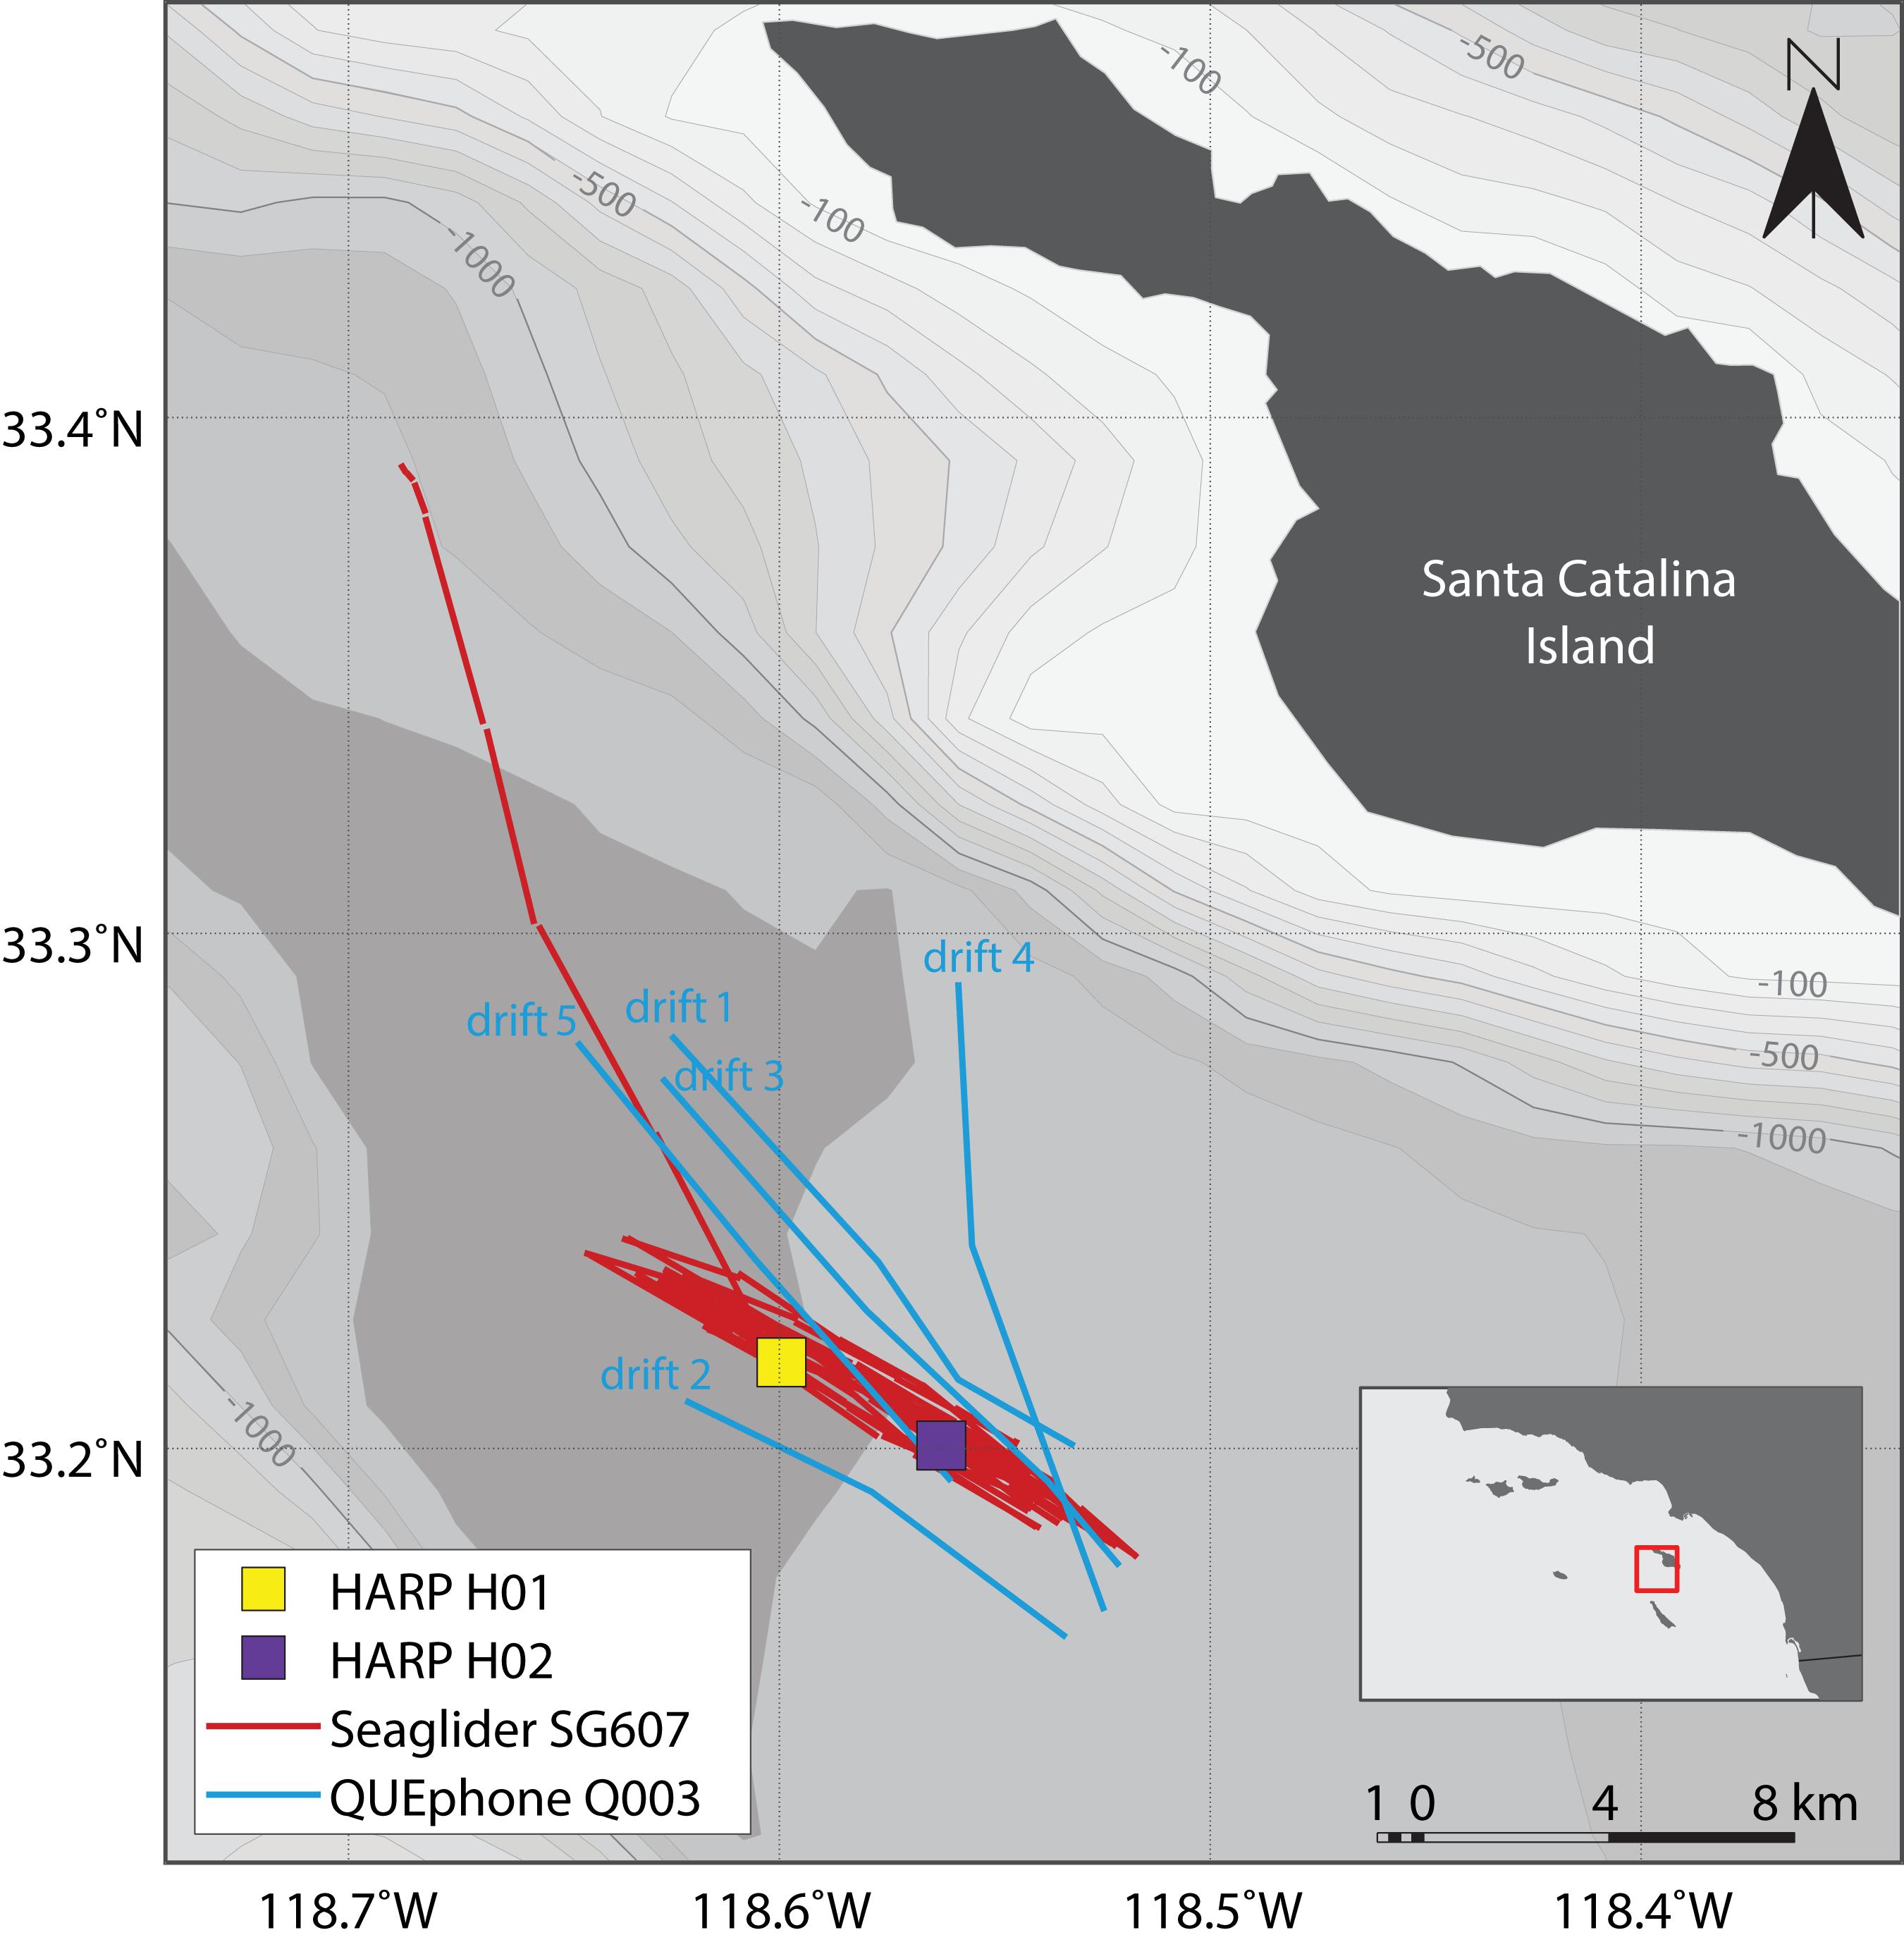
Figure 1. Map of deployment area and recording platform locations. HARPs H01 and H02 are shown as colored squares (yellow and purple). Red lines indicate the glider track; the portion departing to the north was when the glider was directed closer to shore for recovery at the end of the experiment. Blue lines indicate QUEphone drift tracks and are labeled in chronological order. Drift direction of the QUEphone was generally from the southeast to the northwest. Mobile platform tracks are straight line interpolations between known GPS surface locations. Bathymetry is shown in 100 m contours from –100 m (lightest gray) to –1300 m (darkest gray). Bathymetry data is from NOAA’s National Centers for Environmental Information (Amante and Eakins, 2009). The inset shows the Channel Islands and Southern California Bight Region of Southern California with the study area outlined in red.
The Seaglider was also deployed 19 July 2016 and transited back and forth over the HARPs. The track lines extended 4 km (approximate distance covered in one dive cycle) to the northwest of H01 and 4 km to the southeast of H02 to also follow the dominant surface current (Figure 1). The Seaglider was programmed to dive to 990 m depth (maximum possible depth) and each dive cycle lasted approximately 4–5 h. The glider was recovered on 1 August 2016 after being piloted away from the HARPs toward the shore of Catalina Island. The QUEphone was deployed 20 July 2016 approximately 4 km southeast of H02 and allowed to drift at 500 m depth for 48 h before being recovered. This drift depth was selected to keep the QUEphone relatively deep but reduce the risk it would hit the seafloor if it drifted toward the steep walls of the basin. It was repeatedly recovered and redeployed over the next 13 days for a total of five drifts (Table 1). The QUEphone drifted generally northwest in line with the glider’s transits and HARP deployment locations, but current variation changed the drift pattern slightly from day to day (Figure 1). All deployments occurred within a 5 km2 area, with adjustments made each day based on the previous day’s observed drift patterns. Acoustic data were collected by the glider and QUEphone continuously at a 125 kHz sample rate when the platforms were at depths greater than 25 m (to exclude near-surface periods with unusable recordings due to loud surface noise); frequencies in the recordings could be used up to approximately 60 kHz.
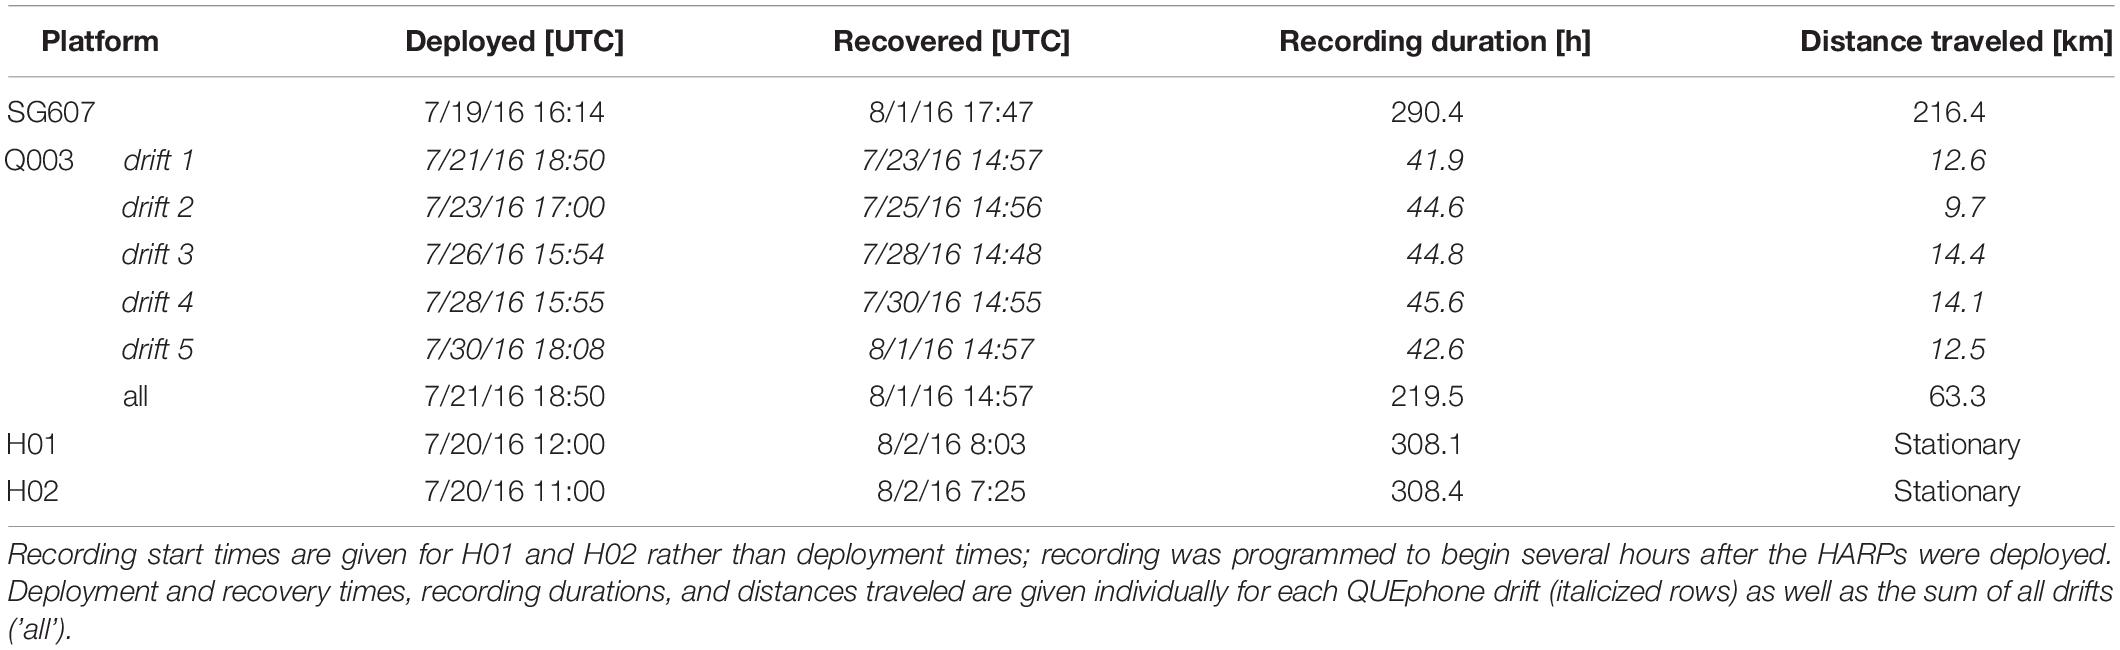
Table 1. Deployment and recovery times for each recording platform (Seaglider – SG607, QUEphone – Q003, and HARPs – H01 and H02).
Acoustic Analyses
Beaked Whales
A two-step detection and validation method, modified from Baumann-Pickering et al. (2013), was used to identify acoustic detections of beaked whales and other odontocetes on all platforms. The general method involved stages of click detection, grouping of clicks into an event, and grouping of events into an encounter. Click detection included running a two-step click detector (Soldevilla et al., 2008) in the MatlabTM-based (v2013b, Mathworks, Natick, MA, United States) software package “Triton” (v1.63, Scripps Whale Acoustics Lab, Scripps Institution of Oceanography, La Jolla, CA, United States), and measuring spectral and temporal features of each click using custom Matlab code (Baumann-Pickering et al., 2013). Detected clicks were classified as possible beaked whale clicks if peak frequency was above 32 kHz, center frequency above 25 kHz, duration at least 0.355 ms, and slope at least 23 kHz/ms (Baumann-Pickering et al., 2013). To be included in further analysis, a minimum of seven clicks in each event was required (events were defined as a 75-s segment for HARP recordings and a 120-s segment for WISPR recordings, selected from recorded file durations). If more than 13% of all initially detected echolocation signals remained after applying these criteria, the event was classified to have beaked whale clicks. Experienced analysts, under the supervision of co-author SBP, visually assessed each event’s clicks to classify it as either a beaked whale [to the species level, using Baumann-Pickering et al. (2013) when possible] or “other.” Beaked whale species that are known to occur in this region and are identifiable by echolocation clicks include Baird’s (Berardius bairdii), Blainville’s (Mesoplodon densirostris), Cuvier’s (Ziphius cavirostris), and Stejneger’s (Mesoplodon stejnegeri) beaked whales (Dawson et al., 1998; Madsen et al., 2005; Zimmer et al., 2005; Johnson et al., 2006; Baumann-Pickering et al., 2014, 2018; Stimpert et al., 2014; Keating et al., 2016). Additionally, three unknown beaked whale click types, BW37V, BW40, and BW43 have been recorded in Southern California. These signals may be attributed to Hubbs’ (Mesoplodon carlhubbsi, BW37V and BW40) and Perrin’s (Mesoplodon perrini, BW43) beaked whales (Baumann-Pickering et al., 2014; Griffiths et al., 2018). Inter-click-interval and mean click spectra were used as the primary discriminating features for species identification of each event.
Click presence or absence per 1-min bin was quantified; a minute containing a beaked whale click is here called a click-positive minute. The total number of 1-min bins containing clicks was normalized by the total number of 1-min bins recorded by each hydrophone. Click-positive minutes that were within 30 min of each other were merged into a single encounter. The mean encounter length was calculated for each platform type. If encounters overlapped in time by at least 1 min, they were identified as a simultaneously detected encounter across platform types. To ensure no encounters of beaked whales were missed, if an encounter occurred on one platform but not one or more others, recordings on the other platforms during the encounter time were visually inspected for beaked whales clicks. Additionally, percent of recorded hours and number of days containing click-positive minutes were quantified for each platform.
Spatial distribution of each platform at the time of each click-positive minute and encounter was used to help inform our interpretation of differences in detection rates of click-positive minutes and number and timing of encounters across platform type. First, an estimated “listening space,” using a 3.5 km radius circle (area: 38.5 km2), was created around each platform location for every minute of the experiment. This buffer size was selected as an estimate of the maximum detection range of beaked whales by a HARP, as modeled in Hildebrand et al. (2015). While we may expect the maximum listening radius for the Seaglider and QUEphone to be further than the HARPs because of the lower noise floor above 20 kHz, we used 3.5 km for all recorders as a conservative estimate. This estimated listening space is not an empirical measure of maximum detection volume, which continuously changes with horizontal and especially vertical location of the mobile systems, but is a very simplified estimate used to illustrate the potential spatial drivers of detection rate differences. Locations for mobile platforms were calculated from straight-line interpolations between surfacing GPS positions. Percentages were quantified of recording minutes in which each mobile recorder’s 3.5 km radius listening space overlapped with the listening space around both HARPs by at least 33%. A threshold of 33% overlap was selected to match the spatial overlap percentage of the two HARPs’ listening space with one another. Then, the number of click-positive minutes (for each species identified) that occurred within this buffer overlap period was summed and the percentage of overlapped recording time with clicks was calculated.
Additionally, the horizontal distance from each recorder to the other three deep-water recorders was measured for each beaked whale encounter. Encounter location for the mobile platforms was defined as the median latitude and longitude of the platform within the encounter start and end time. Histograms were generated for distances to other recorders both when encounters were and were not simultaneously detected on other recorders.
To investigate whether beaked whale detections varied with mobile platform depth, the depth at the start of each recording minute was extracted and grouped into 10-m bins. Bins of 10 m depth were selected because the glider typically does not descend or ascend greater than 10 m in 1 min. Then the proportion of the recording minutes in each depth bin that contained Cuvier’s beaked whale clicks was calculated.
Delphinids
Recordings of whistles and/or echolocation clicks produced by small, shallow-diving delphinids (in this area mostly Delphinus delphis and Tursiops truncatus) were identified manually through visual inspection of Long Term Spectral Average plots (LTSAs; Wiggins and Hildebrand, 2007) created and viewed in the Triton Software Package (v1.93). LTSAs were calculated on the full-bandwidth recordings using a 5 s time average and 100 Hz frequency average. Start and end times of clicking or whistling bouts were marked, and occurrence was quantified as hourly and daily presence or absence of clicks and/or whistles. Percentage of total hours and days with delphinid clicks or whistles was calculated. Similarity in the temporal patterns of delphinid presence was assessed by calculating Pearson’s correlation coefficients for hourly presence or absence of clicks or whistles, pairwise between each platform. Because delphinid clicks and whistles were so prevalent, and encounter durations could span tens of hours, no encounter-based analysis was conducted.
Minke Whales
A simple whistle and moan (tonal sound) detector (Mellinger et al., 2011) in Ishmael 3.0 beta (compiled June 14, 2018; Mellinger et al., 2018) was used to identify minke whale (B. acutorostrata) boings in recordings from the glider, QUEphone, and both HARPs. Boing sounds (Thompson and Friedl, 1982) produced by minke whales in the Central Pacific have peak frequencies between 1 and 2 kHz with energy up to 10 kHz (Rankin and Barlow, 2005). They are highly stereotyped and often occur in long bouts of consecutive boings, and therefore are readily detected on multiple hydrophones (Martin et al., 2013). Detector settings are available in the Supplementary Material. Call quality was generally poor, so a low detection threshold was selected to maximize recall. Because this resulted in a high number of false positives, all detections were manually checked by an experienced analyst (SF) to remove false positives. To further ensure no boings were missed, for any occasions when boings were detected on one recorder but not the others, that period was manually inspected on all recorders for possible missed boings in Raven Pro 1.6 (Cornell Lab of Ornithology, Ithaca, NY, United States). Hourly and daily presence or absence of minke whale boings was then quantified for each recorder, and percentage of total recording hours containing boings was calculated.
Consecutive hours of boings were grouped into encounters, with an encounter defined here as boings with a gap of less than an hour before subsequent boings. Mean location of each mobile platform was extracted for each encounter, and distances between recorders were calculated. Distances between recorders when encounters were and were not simultaneously detected on other recorders were compared with histograms.
Results
Recording Durations
Total recording duration varied across recording systems due to differences in platform operation and deployment durations. Because they recorded continuously, both HARPS recorded during 309 1-h bins over 14 days, a total of 308.1 h for H01 and 308.4 h for H02. The glider recorded for 290.4 h over 14 days (314 1-h bins, including partial hours). The reduction in total hours recorded compared to the HARPs was because the recording system was turned off at depths shallower than 25 m. The glider traveled over 200 km. The QUEphone recorded for a total of 219.5 h over 12 days (229 1-h bins, including partial hours). The QUEphone experienced buoyancy and programmatic issues and was not deployed on all days, resulting in the reduced recording hours (see deployment schedule in Table 1). Each of the five QUEphone drifts spanned 42–45 h, and in total, the QUEphone drifted 63.3 km.
Beaked Whales
The QUEphone had the most beaked whale click detections at all analysis scales, with 125 min containing Cuvier’s beaked whale clicks (0.95% of the total recording minutes; Table 2). Beaked whale clicks were detected on the QUEphone during 13 of 229 total hours of recording (5.68%) and on 6 of 12 (50%) recording days (Table 2 and Figure 2). The glider had the second-most beaked whale detections, with 66 min of Cuvier’s beaked whale clicks (0.38% of recorded minutes) recorded during 8 of 314 recording hours (2.55%), on 5 of 14 (36%) recording days (Table 2 and Figure 2). H01 recorded both Cuvier’s beaked whale clicks (51 min, 0.28%) and click type BW43 clicks (7 min, 0.038%) spanning 8 of 309 recording hours (2.59%), on 5 of 14 (36%) recording days (Table 2 and Figure 2). H02 recorded 60 min containing Cuvier’s beaked whale clicks (0.32% of recorded minutes), during 5 of 309 h (1.62%) over 4 of 14 (29%) recording days (Table 2 and Figure 2). H01 and Q003 recorded the longest duration encounters (less than 30 min silence between consecutive click-positive minutes) of 46 and 47 min, respectively. H02 encounters were the longest on average (mean 19.8 min, SD 13.1 min), while SG607’s encounters were the shortest (mean 11.6 min, SD 8.7; Table 2).
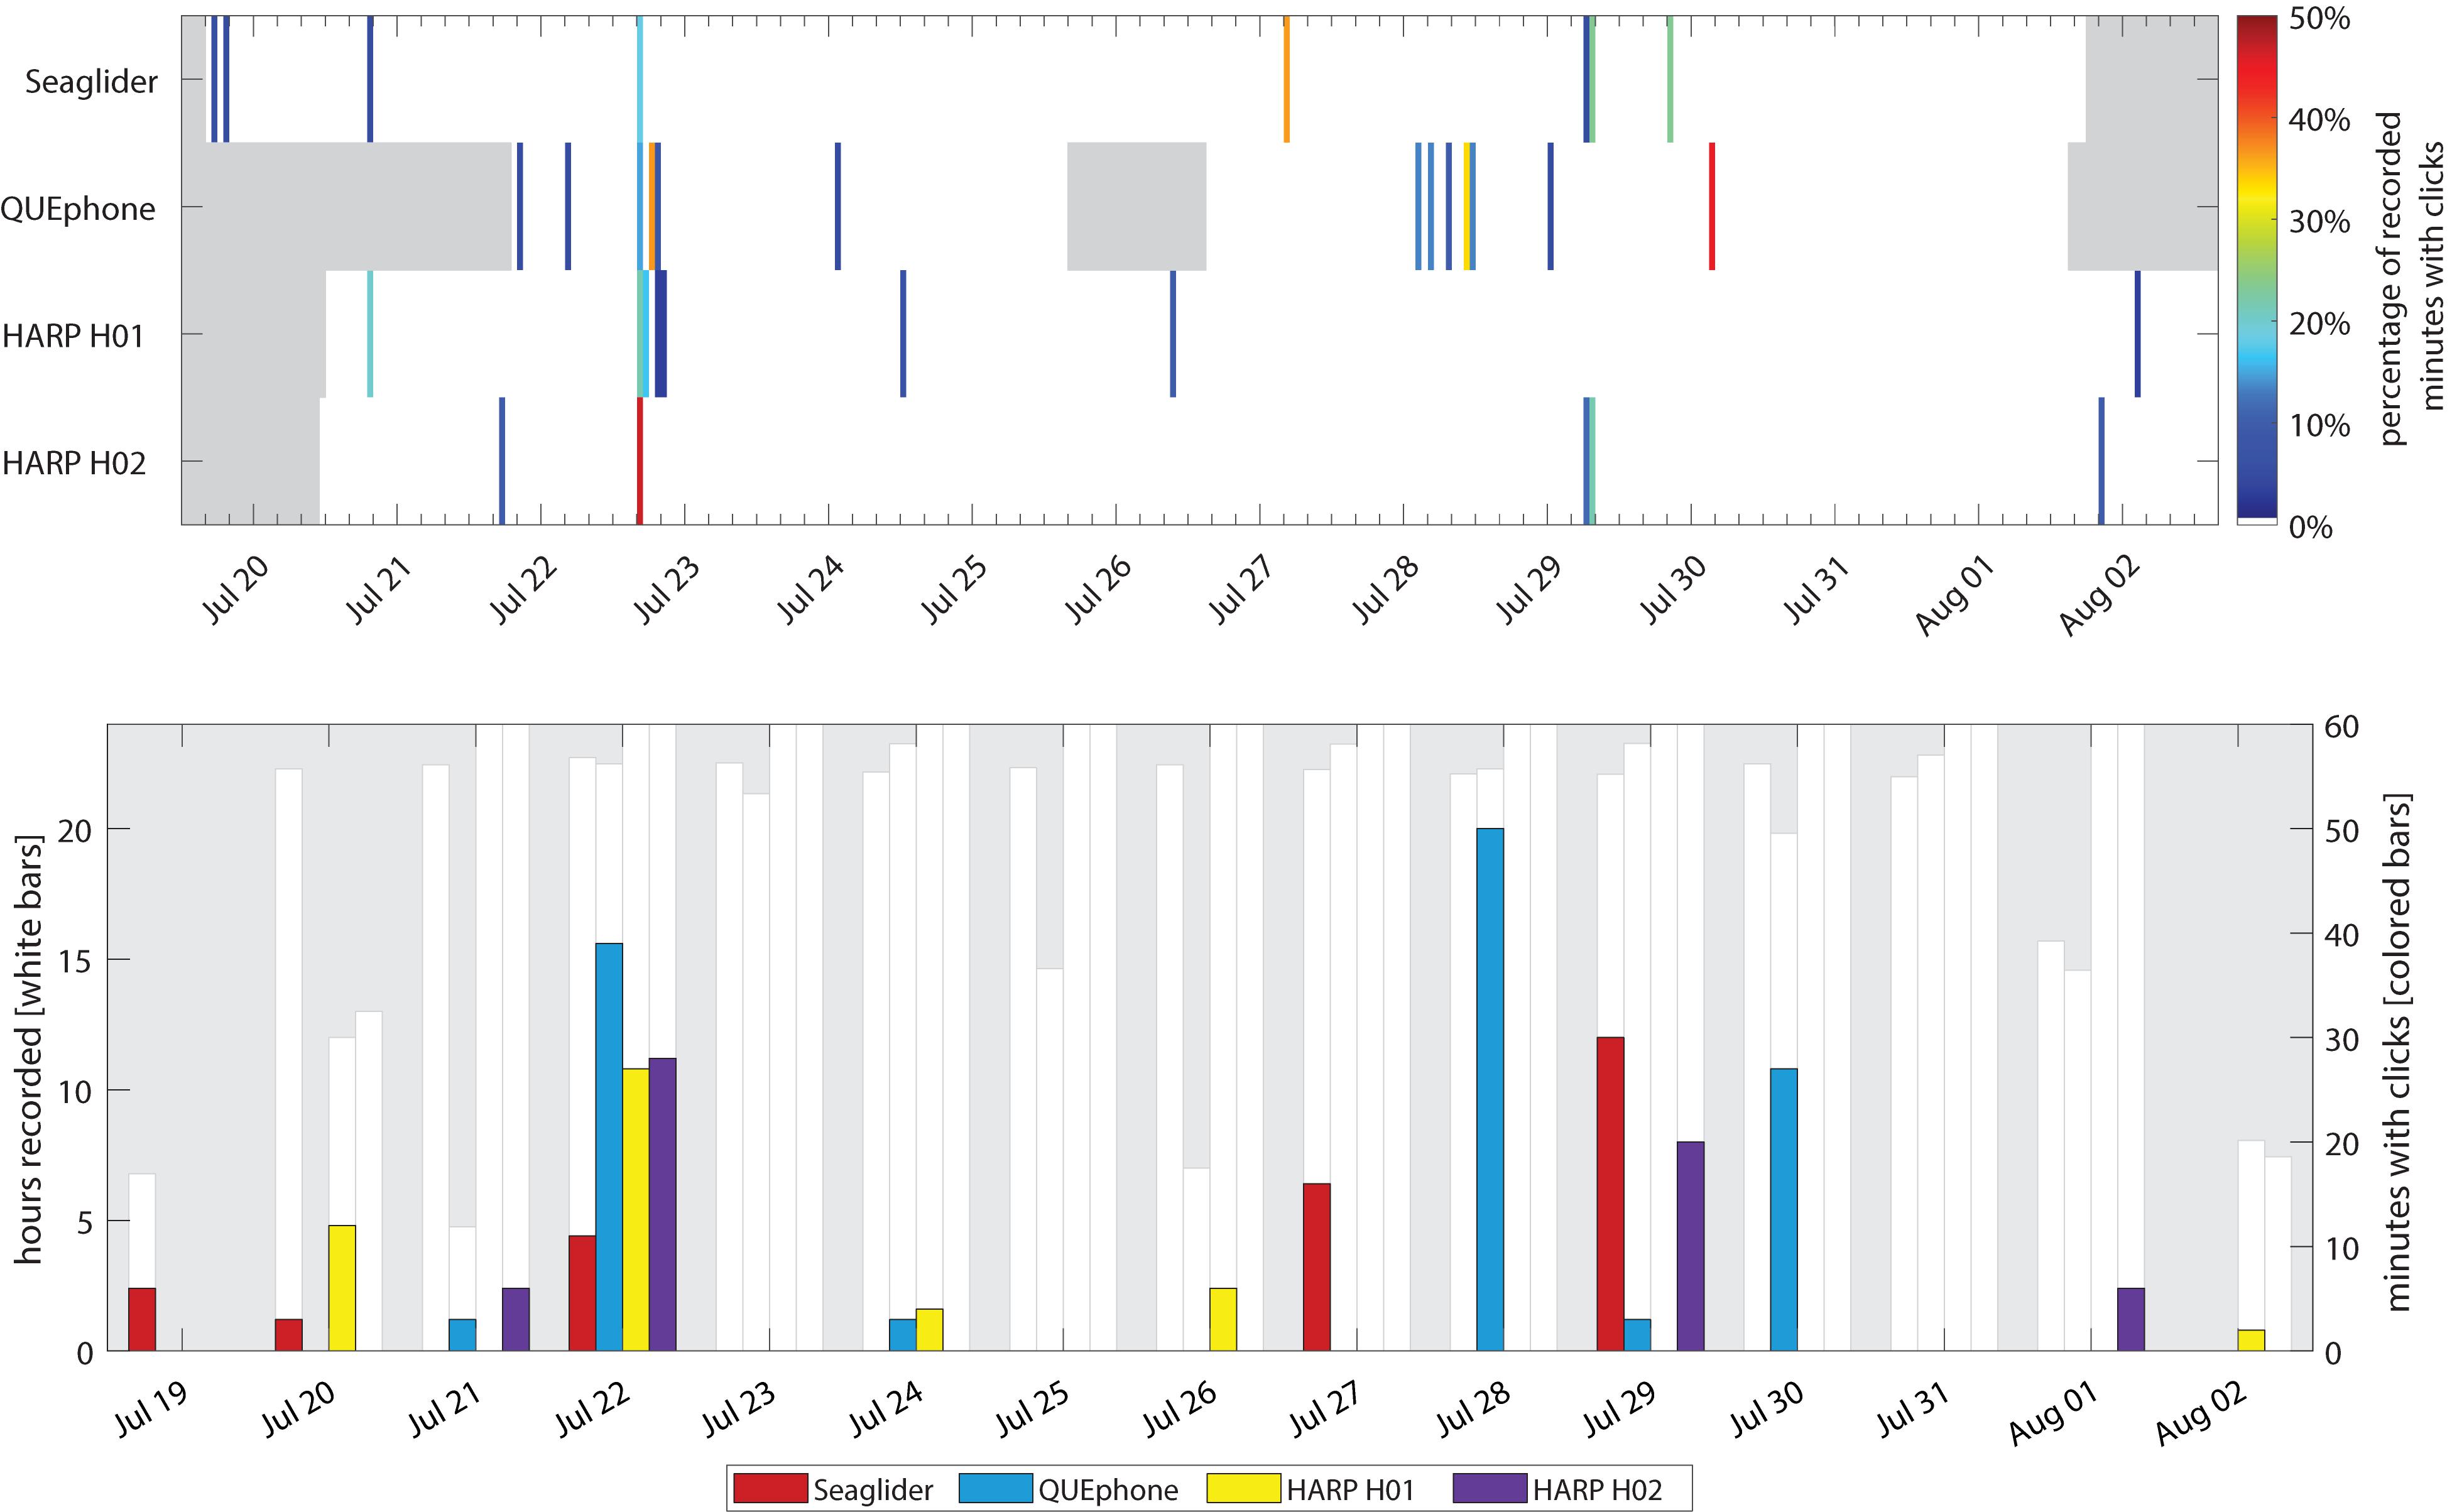
Figure 2. Occurrence of Cuvier’s beaked whale clicks by recorder platform. Top panel: Percentage of recorded minutes with clicks in each hour. Gray areas indicate times when recorders were not deployed. Color of each 1-h bar corresponds to percentage of total minutes recorded in that hour with clicks (if 0%, no colored bar is displayed). Bottom panel: Minutes with Cuvier’s beaked whale clicks per day. The white bars and left y-axis indicate the total hours recorded per day. No white bar indicates a day where that recorder was either not deployed or not yet recording. The right y-axis and colored bars indicate total minutes per day containing beaked whale clicks.
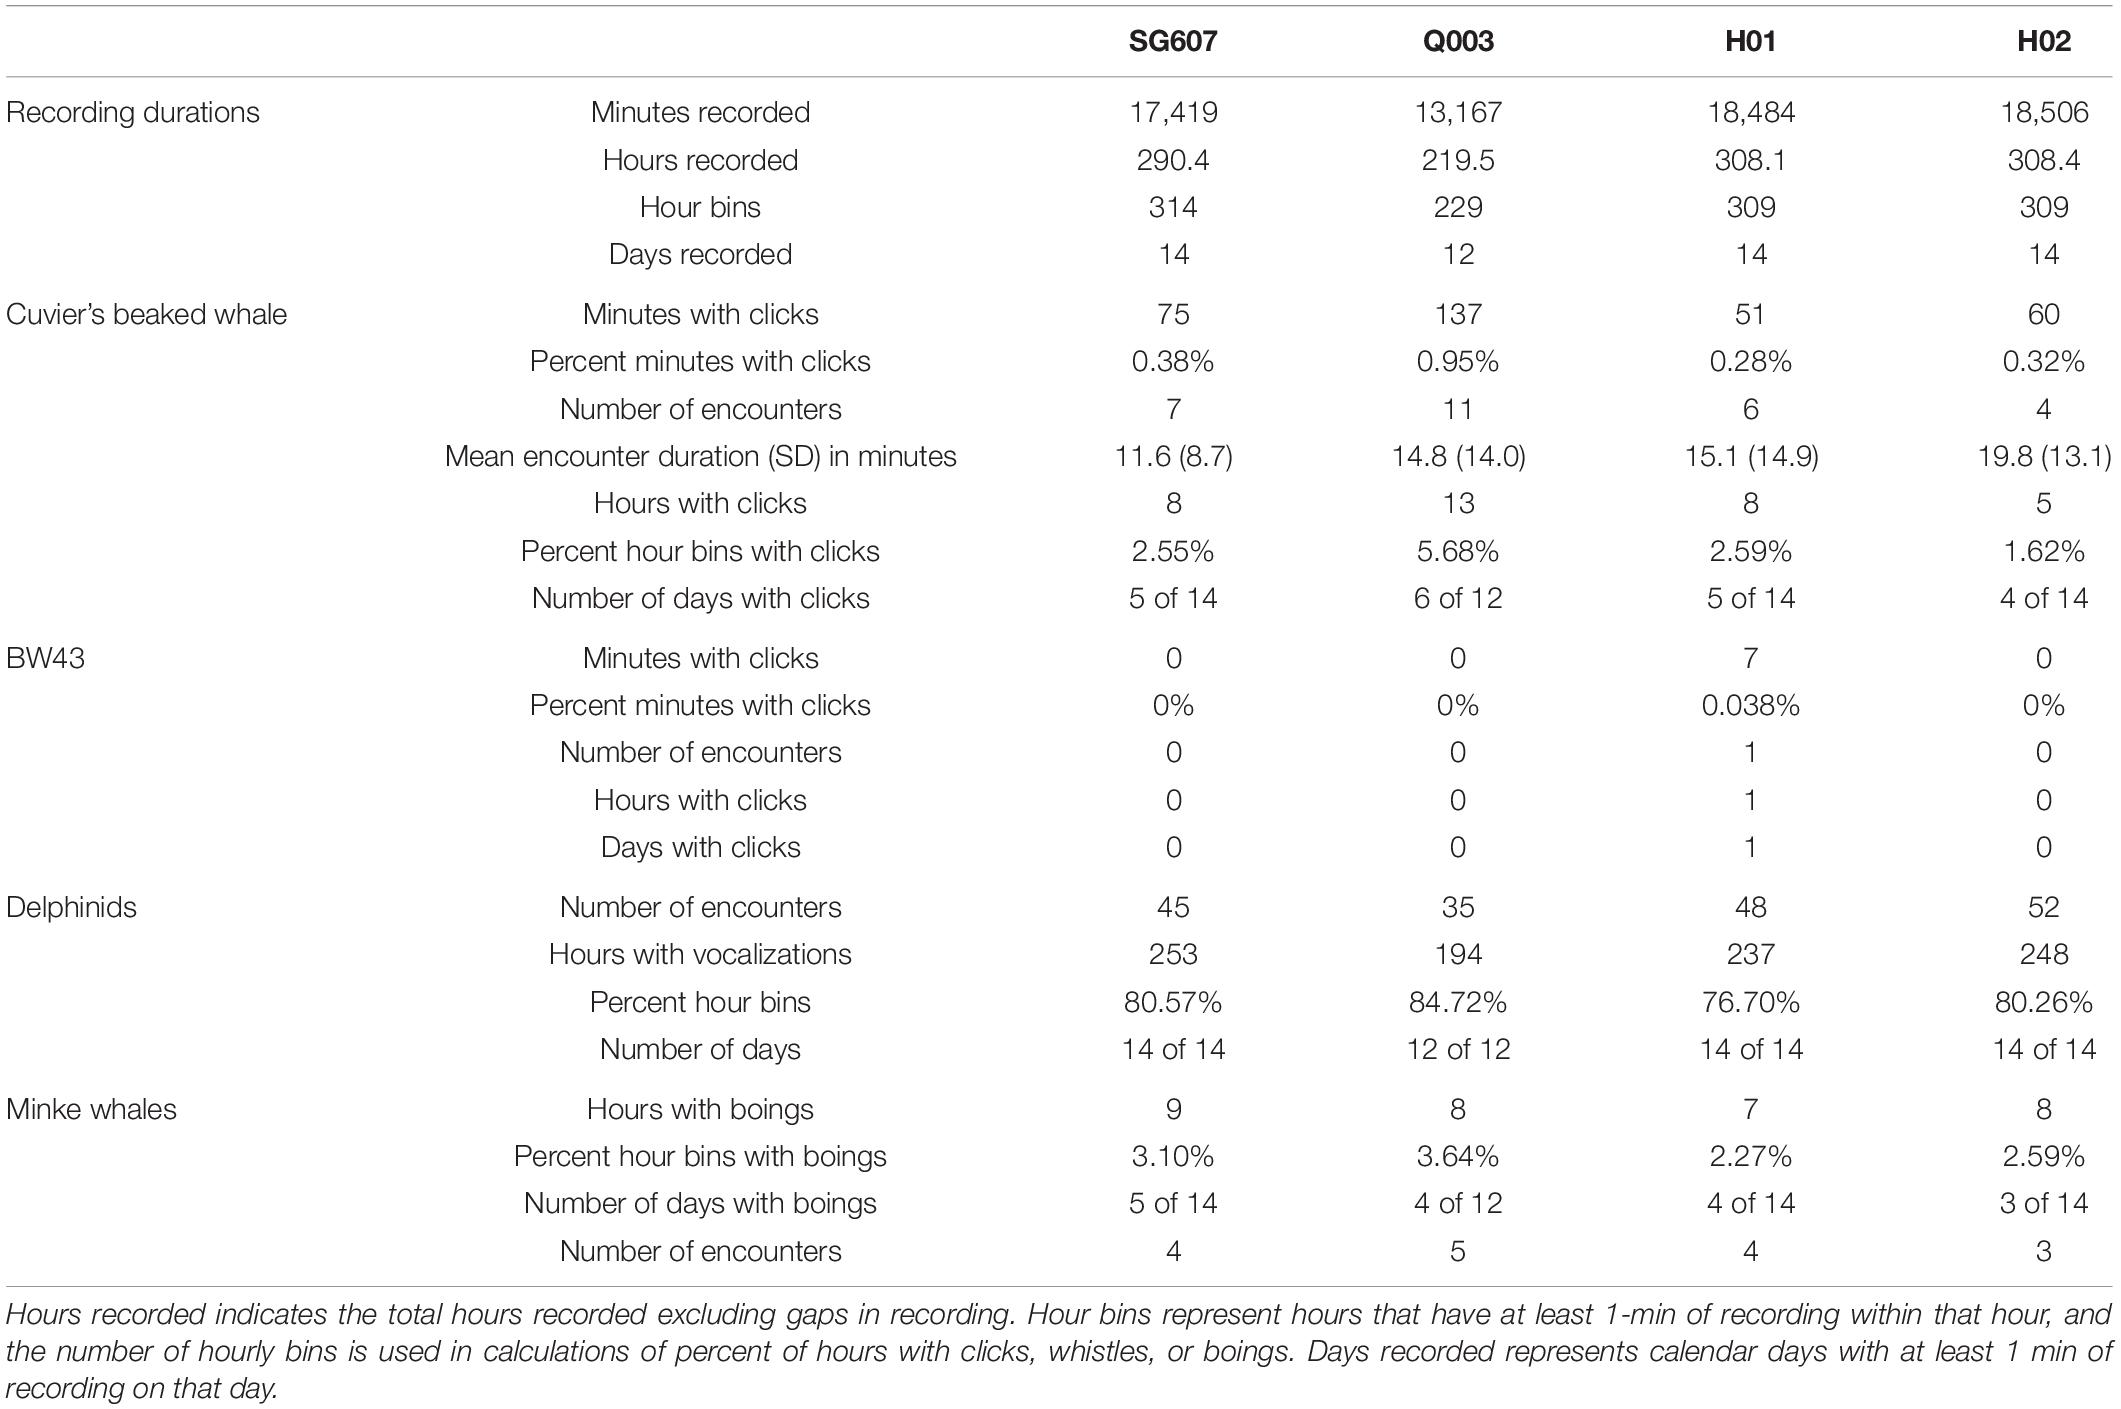
Table 2. Summary of total durations of acoustic data recorded by each platform and minutes, hours, days, and/or encounters for four types of marine mammal vocalization: Cuvier’s beaked whale echolocation clicks, beaked whale echolocation click type BW43 clicks, small delphinid whistles and clicks, and minke whale boings.
The glider recorded beaked whale clicks throughout its traveled path (Figure 3A). QUEphone beaked whale detections occurred primarily on drifts 1, 3, and 4 when the QUEphone was drifting to the north of the HARPs and glider path (Figure 3A). A single encounter of Cuvier’s beaked whales was detected on all four deep-water recorders on 22 July 2016 from 16:32 to 17:17 UTC (09:32 to 10:17 local time; Figure 3B and Table 3). Distances between recording platforms during the encounter ranged from 1.6 to 5.5 km. The glider had two additional encounters that were also detected by the HARPs: on 20 July 2016 at 19:23 UTC (12:23 local time), when the glider was 1.0 km from H01, and on 29 July 2016 at 06:58 UTC (23:58 local time) when the glider was 2.8 km away from H02 (Figure 3C and Table 3).
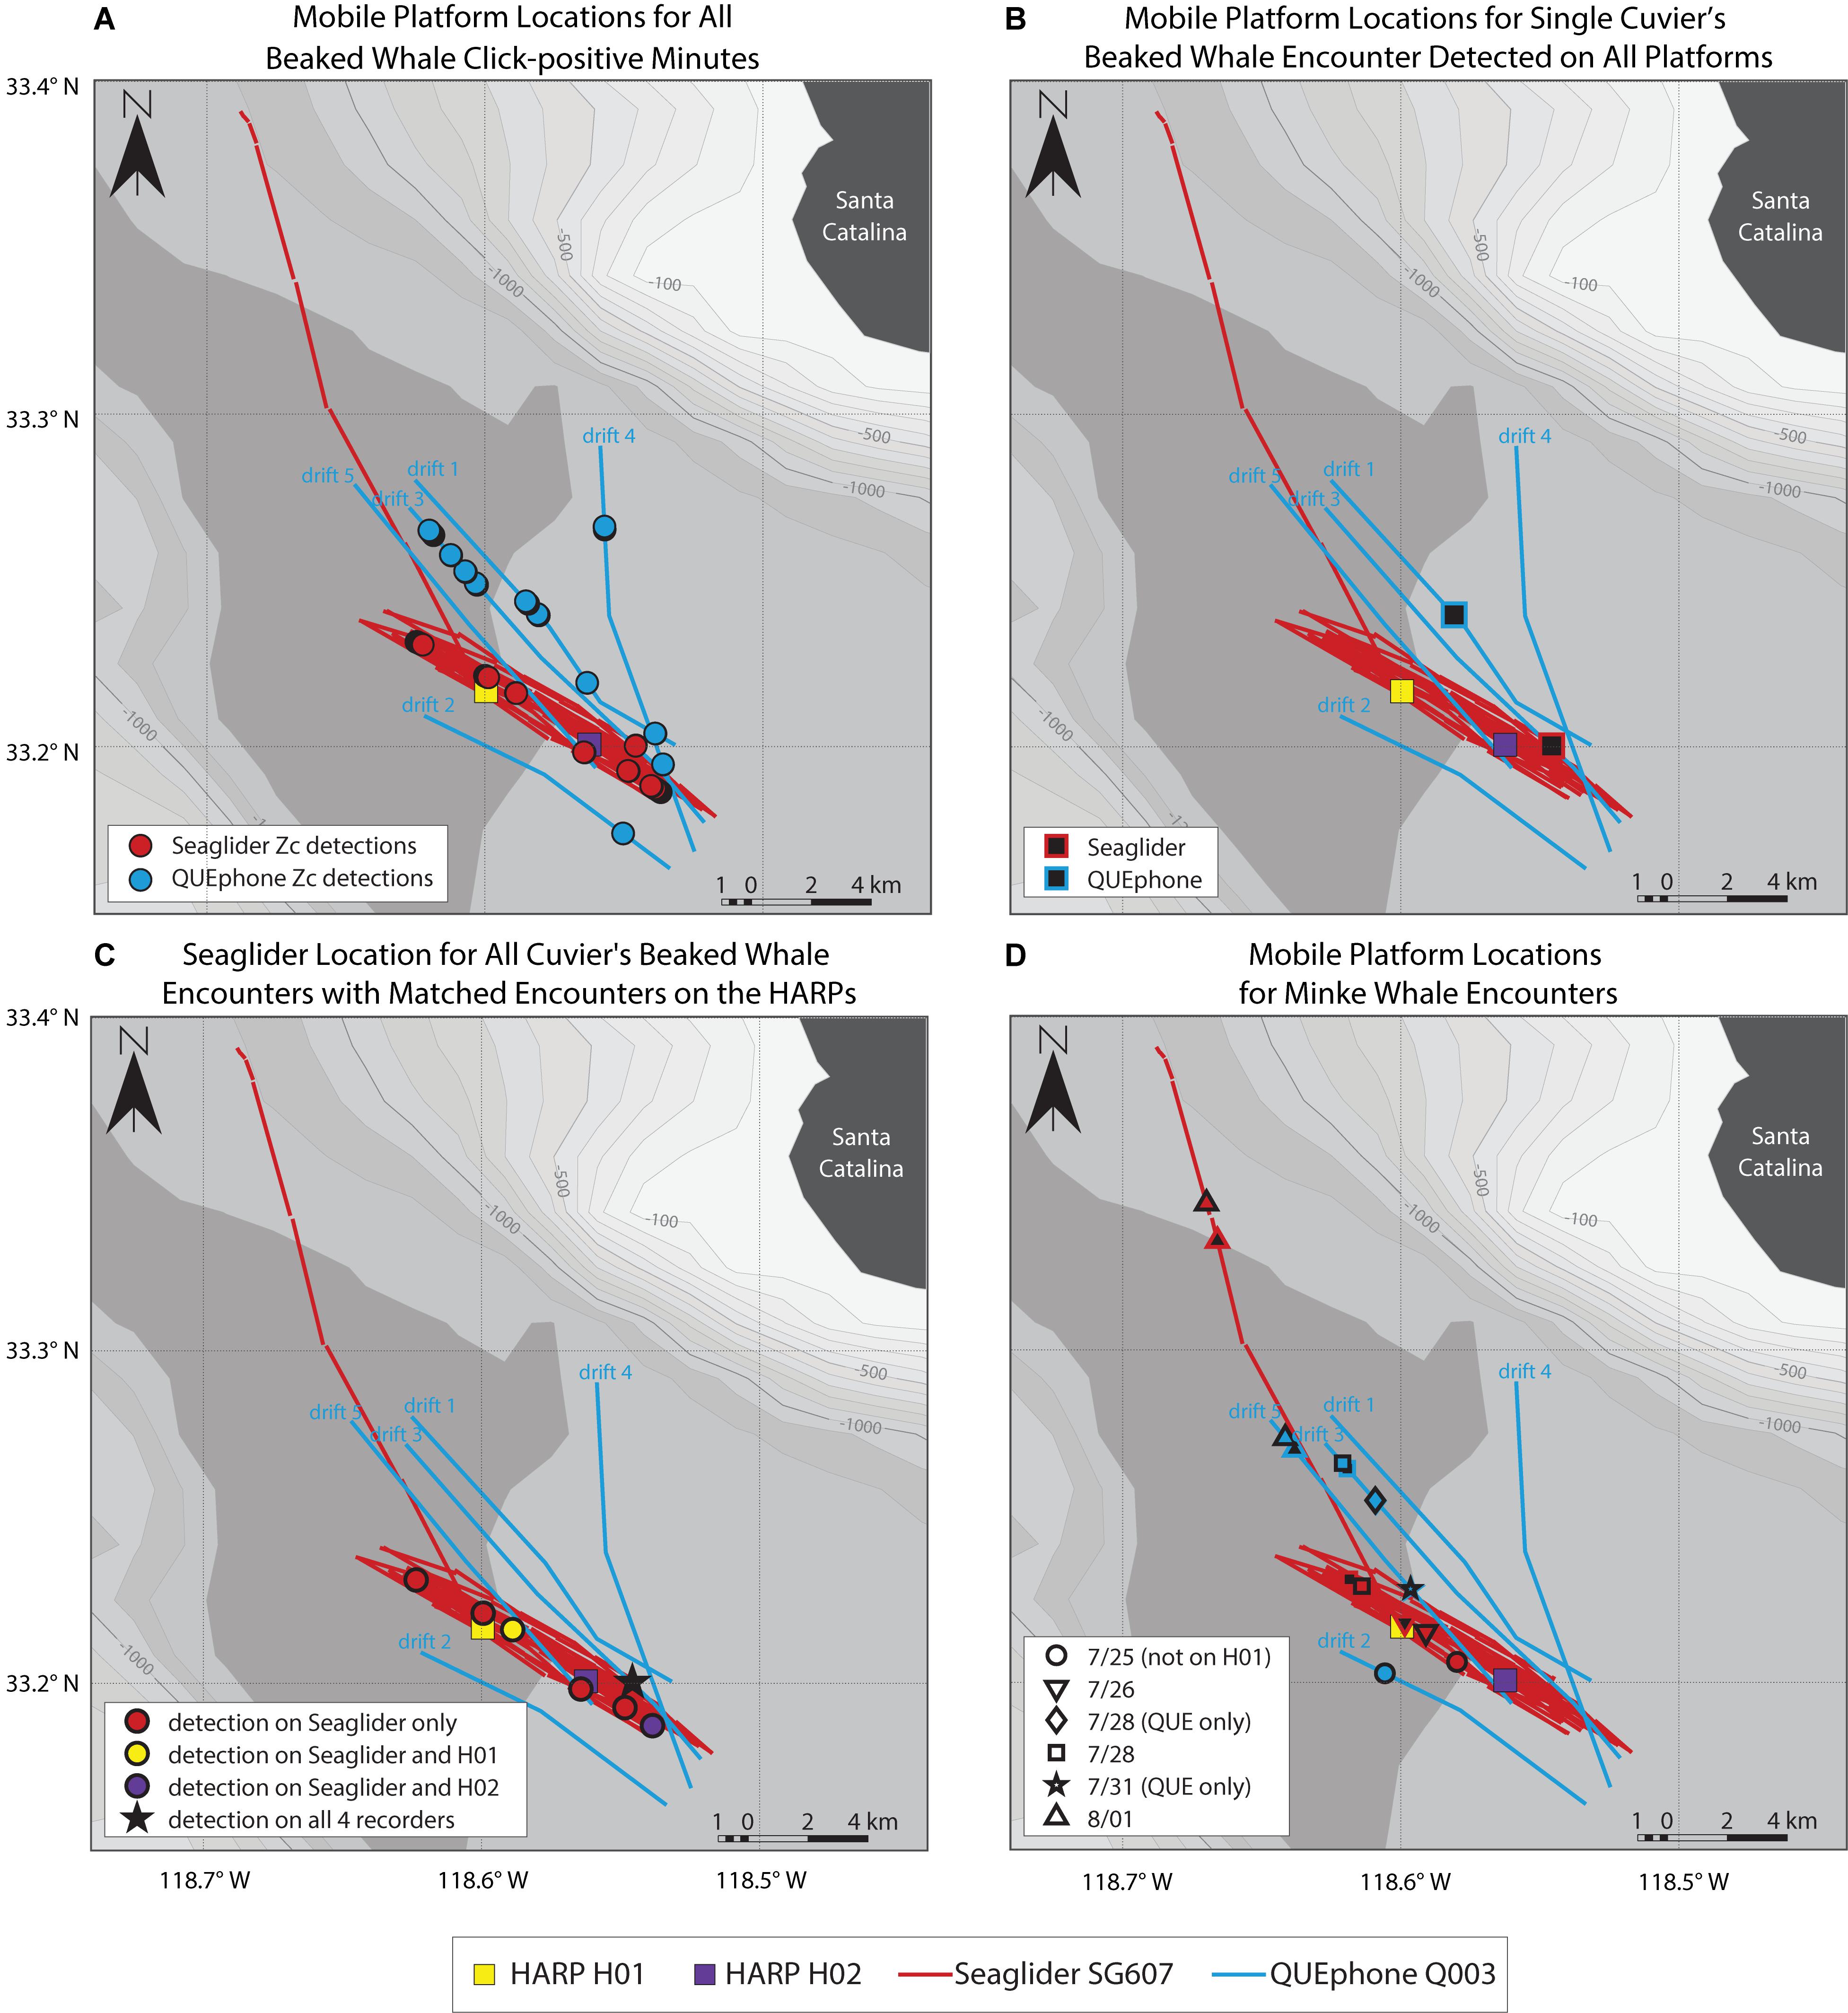
Figure 3. Mobile platform locations where beaked whales (A–C) and minke whales (D) were detected. The Seaglider track is shown as red lines; the track departing to the northwest was for glider recovery at the end of the experiment. The QUEphone drift tracks are shown as blue lines and labeled by drift number. Tracks for both platforms are straight-line interpolations of GPS surface positions. HARP locations are shown as squares (H01 – yellow, H02 – purple). (A) shows the estimated location of each mobile platform for all beaked whale echolocation click-positive minutes. Cuvier’s beaked whale (Zc) click-positive minutes are indicted by circles (Seaglider – red, QUEphone – blue). (B) shows the estimated median location of the Seaglider (red outlined black square) and QUEphone (blue outlined black square) when a single encounter of Cuvier’s beaked whales was recorded by all four deep-water recorders on 07/22/2016 16:32 to 17:17 UTC (09:32 to 10:17 local time). All recorders were within 5.5 km of one another at the time of the encounter. (C) shows the estimated median Seaglider location when it recorded a Cuvier’s beaked whale encounter. Circle color corresponds to which HARP simultaneously recorded the same encounter (encounter detected only on the glider – red, H01 – yellow, H02 – purple). The single encounter recorded by the glider and both HARPs is indicated by a black star (same encounter as in B). (D) shows the estimated locations of the Seaglider and QUEphone when minke whales boings were detected. Each of six encounters is symbolized by a different shape and encounters were present on all recorders unless otherwise specified in the legend. Platform location at the start (black filled symbol) and end (color fill, black outline symbol) is shown for each encounter. The symbol outline or fill color corresponds to the mobile platform track color (glider – red, QUEphone – blue). If no end symbol (filled black) exists, the encounter was of very short duration with negligible platform movement over the encounter duration, so only a single location is shown.
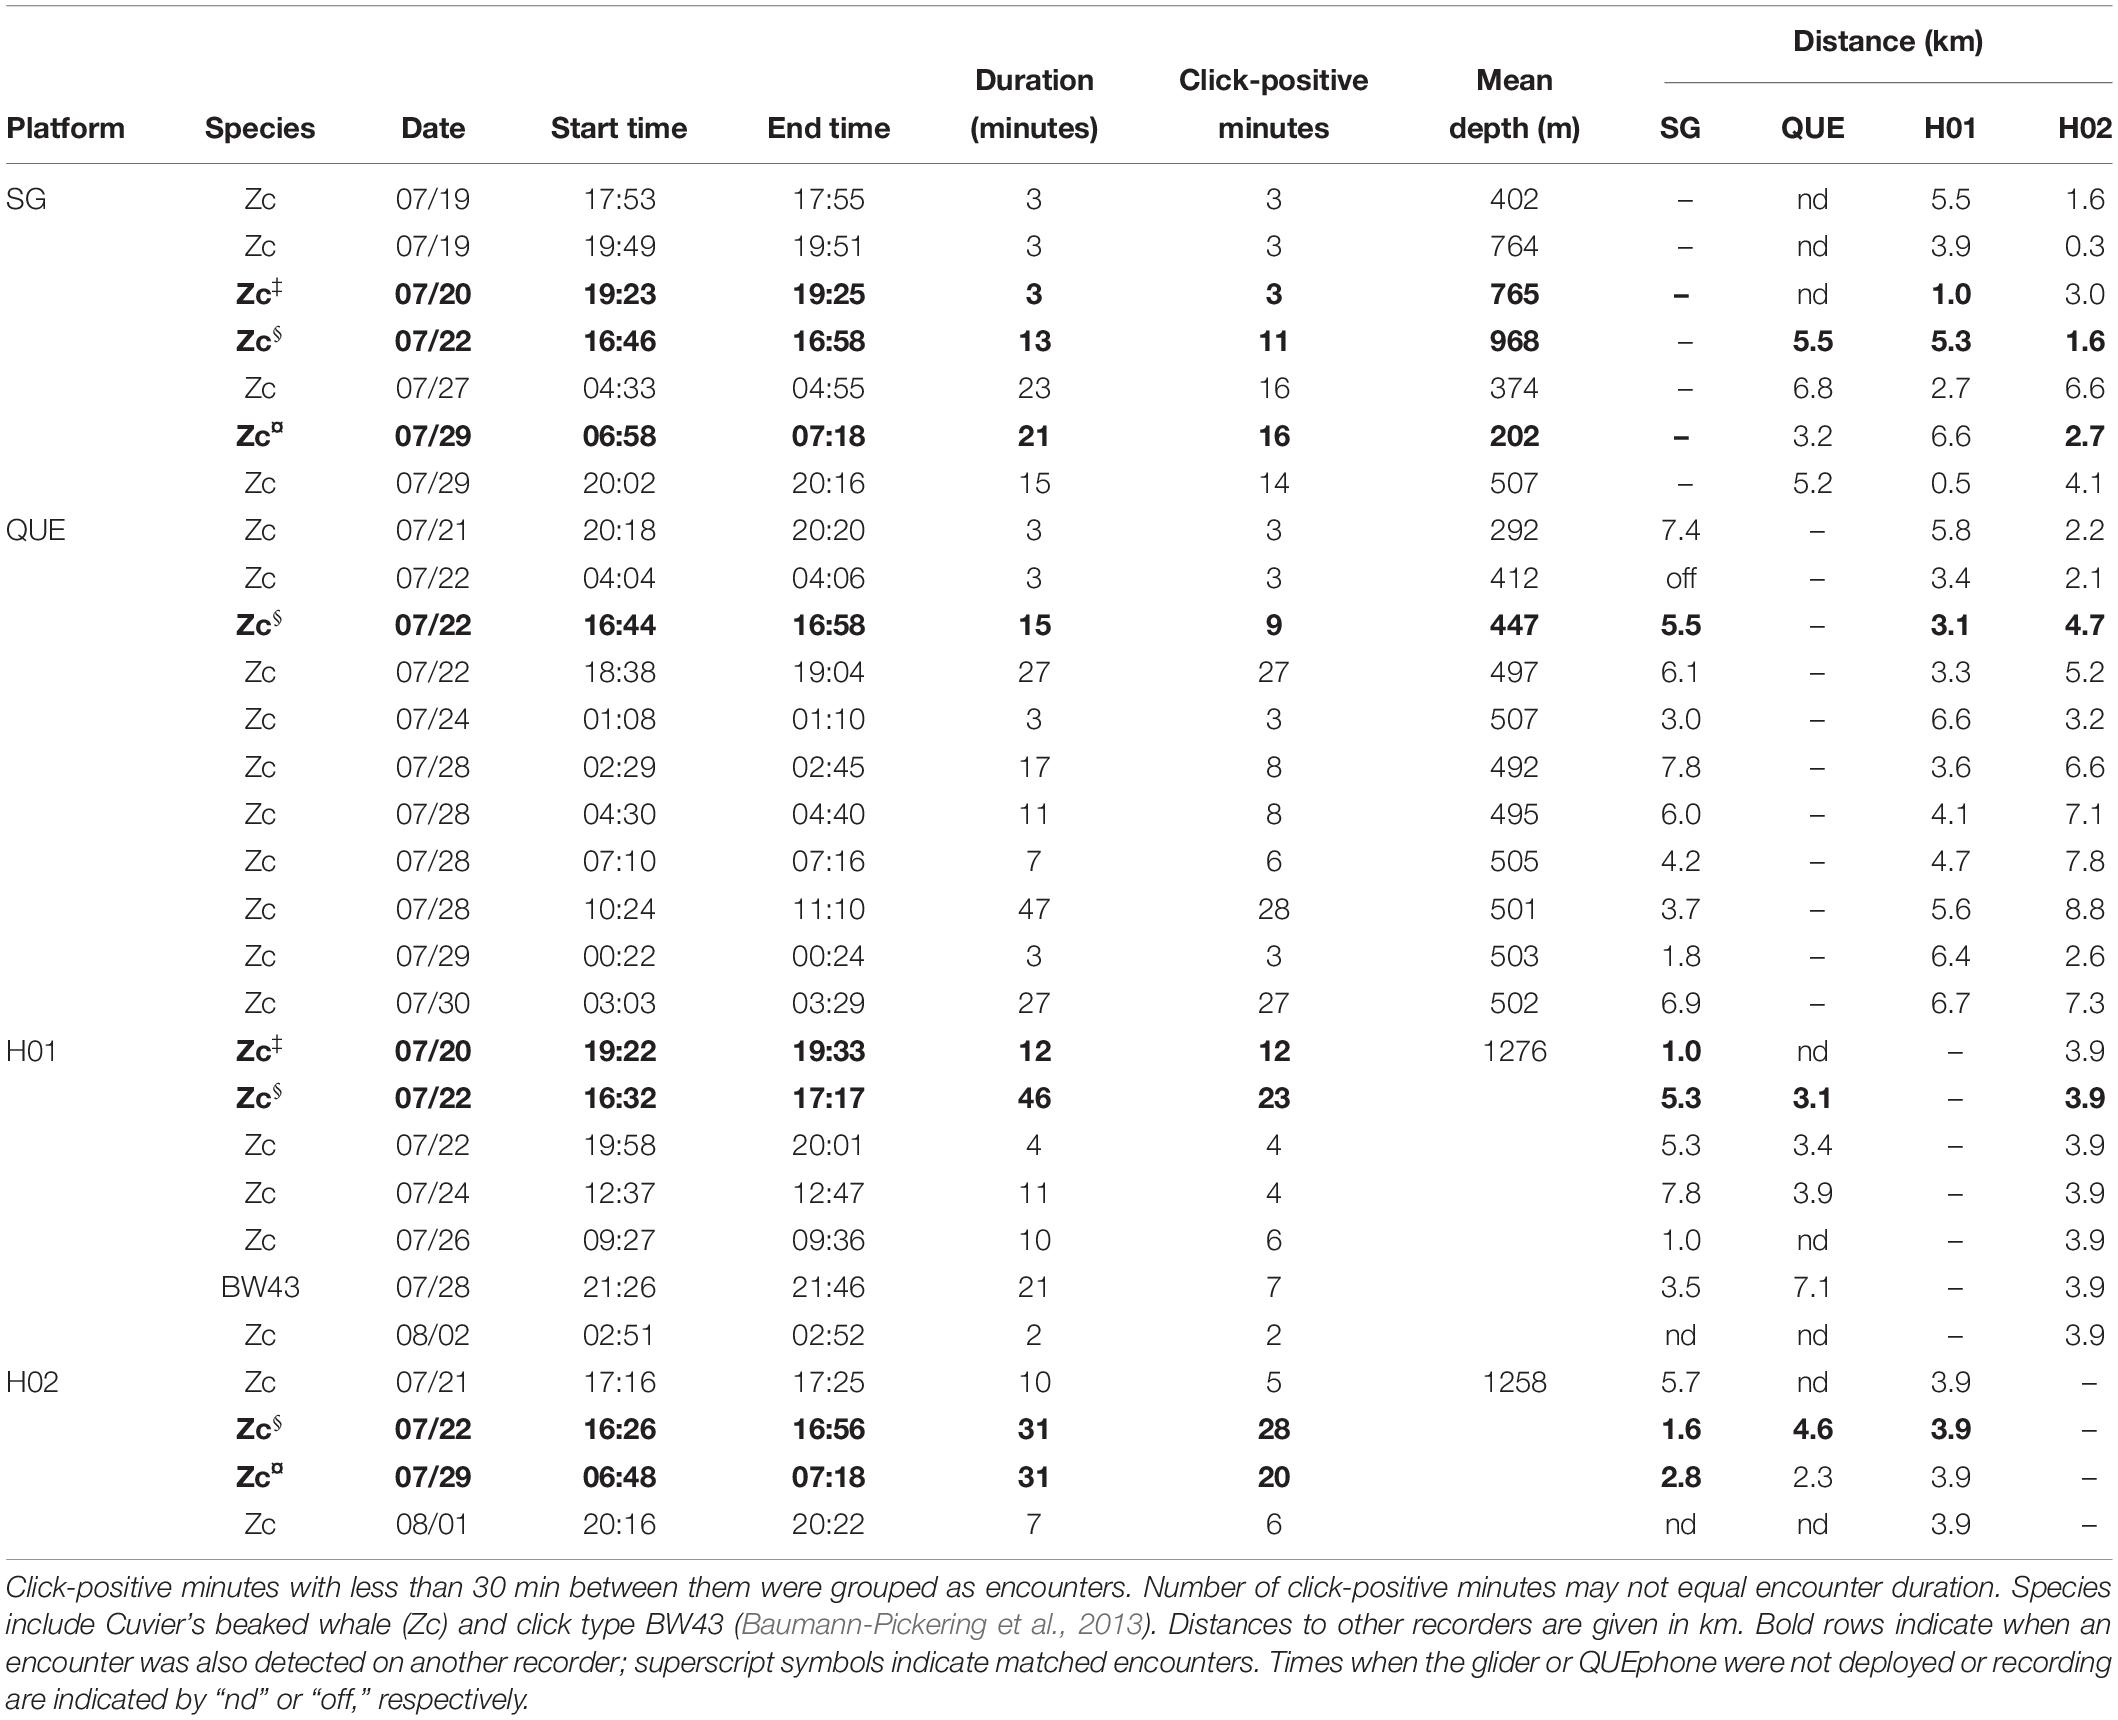
Table 3. Beaked whale encounters by the Seaglider (SG), QUEphone (QUE), and HARPs (H01 and H02).
The estimated 3.5 km listening spaces around the HARPs overlapped spatially with one another by 33% of each instrument’s total listening area (12.7 of 38.5 km2 overlapped). The single encounter of Cuvier’s beaked whale clicks detected on both HARPs constituted 43% (H01; 21 min) and 47% (H02; 28 min) of each HARPs total minutes with Cuvier’s beaked whale clicks. The glider’s estimated 3.5 km listening radius overlapped in space by 33% or more with one or both HARPs for 92% of the glider’s total recording time, and 100% of the glider’s total click-positive minutes (66 min). Three encounters, or 45% (30 min) of the click-positive minutes while the glider was assumed to overlap in range with the HARPs, were simultaneously detected on either or both HARPs (Table 3 and Figure 3C). The QUEphone movement could not be controlled once it was drifting, and thus its proximity to the HARPS was harder to control. The QUEphone was assumed to overlap in space by 33% or more with one or both HARPs for 66% of the QUEphone’s total recording time. This overlapping period contained 56 click-positive minutes recorded on the QUEphone (45% of click-positive minutes). One Cuvier’s beaked whale encounter detected by the QUEphone and simultaneously detected by both HARPs spanned just 16% (9 min) of the Cuvier’s click-positive minutes recorded by the QUEphone within the spatial overlap. The glider and QUEphone’s estimated listening space overlapped with one another by at least 33% for only 35 and 47% of their total recording times, respectively. Click-positive minutes during these potential overlap periods made up 21% (glider) and 23% (QUEphone) of their respective total Cuvier’s beaked whale click positive minutes.
Simultaneous detection of Cuvier’s beaked whale encounters by multiple recorders was not guaranteed, even when recording platforms were positioned within a few kilometers of one another, and estimated listening spaces overlapped substantially (Figure 3C and Table 3 and Supplementary Figure S2). Two of the encounters recorded on the glider occurred when the glider was less than 1 km horizontally from a HARP, but that HARP did not have detections at that time. Conversely, two of the encounters on H01 occurred when the horizontal distance between the glider and HARP was 1 km, but only one of those encounters was simultaneously detected by the glider. Visual checks for encounters across platforms did not result in any encounters in addition to what was found with the detector.
The QUEphone drifted at depths below 450 m for 80% of its recorded minutes; it typically hovered between 480 and 520 m (77% of recorded minutes). Aside from a single encounter (3 min duration) when the QUEphone was at 292 m, all minutes with clicks occurred when the QUEphone was drifting at or near its designated maximum depth (Figure 4). Because the glider moved up and down through the water column, recorded minutes were evenly distributed from 25 to 1000 m (Figure 5). The glider had the greatest proportion of recorded minutes containing clicks at 400–500 m, 75–800 m, and 950–1000 m and none at 600–750 m and 800–900 m (Figure 5 and Table 3).
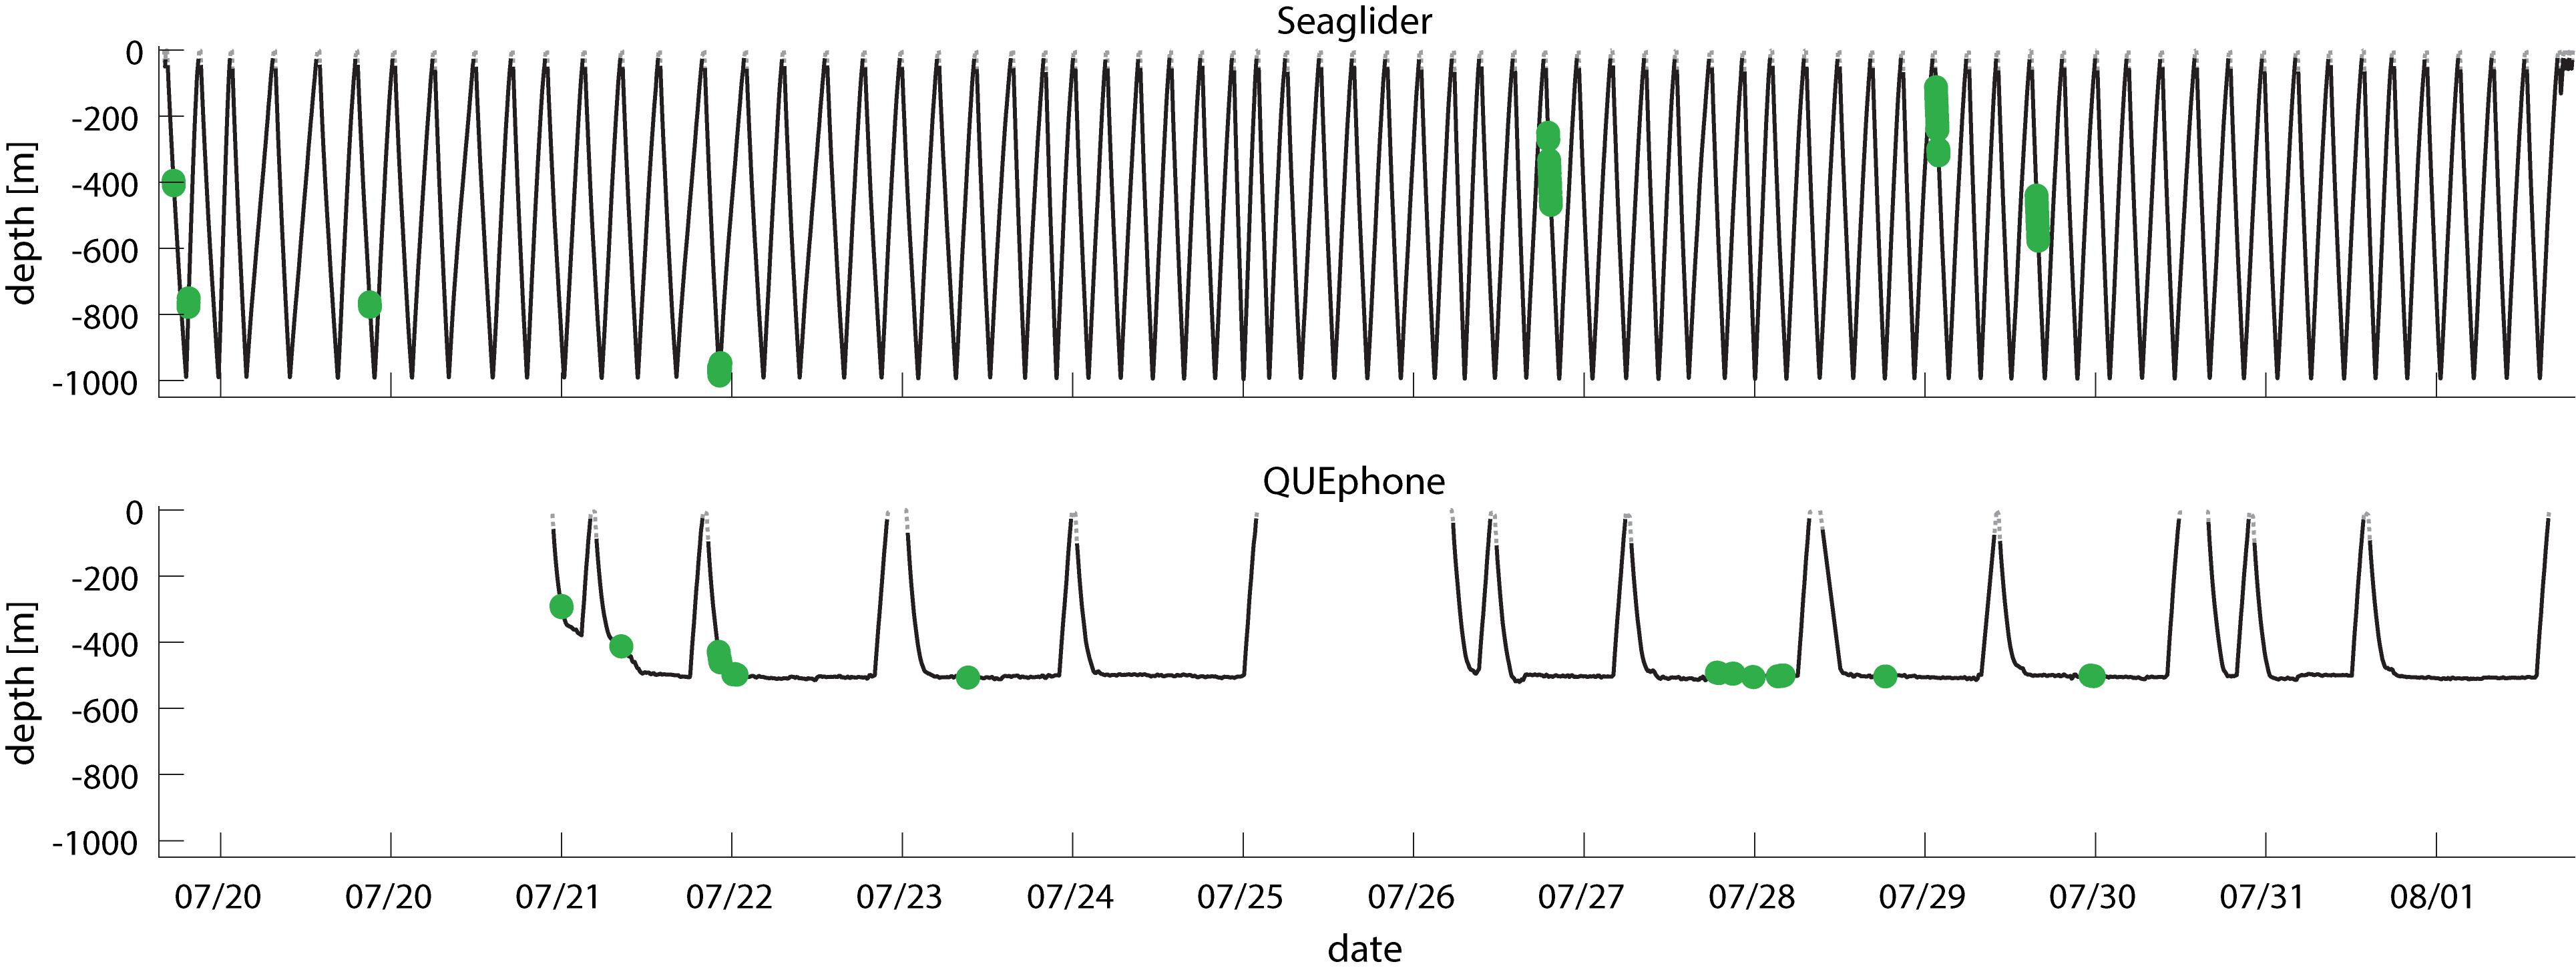
Figure 4. Dive profile of Seaglider (top panel) and QUEphone (bottom panel) showing platform depth over time. Minutes with Cuvier’s beaked whales clicks present are shown by green dots. Date ticks are at 00:00 UTC.
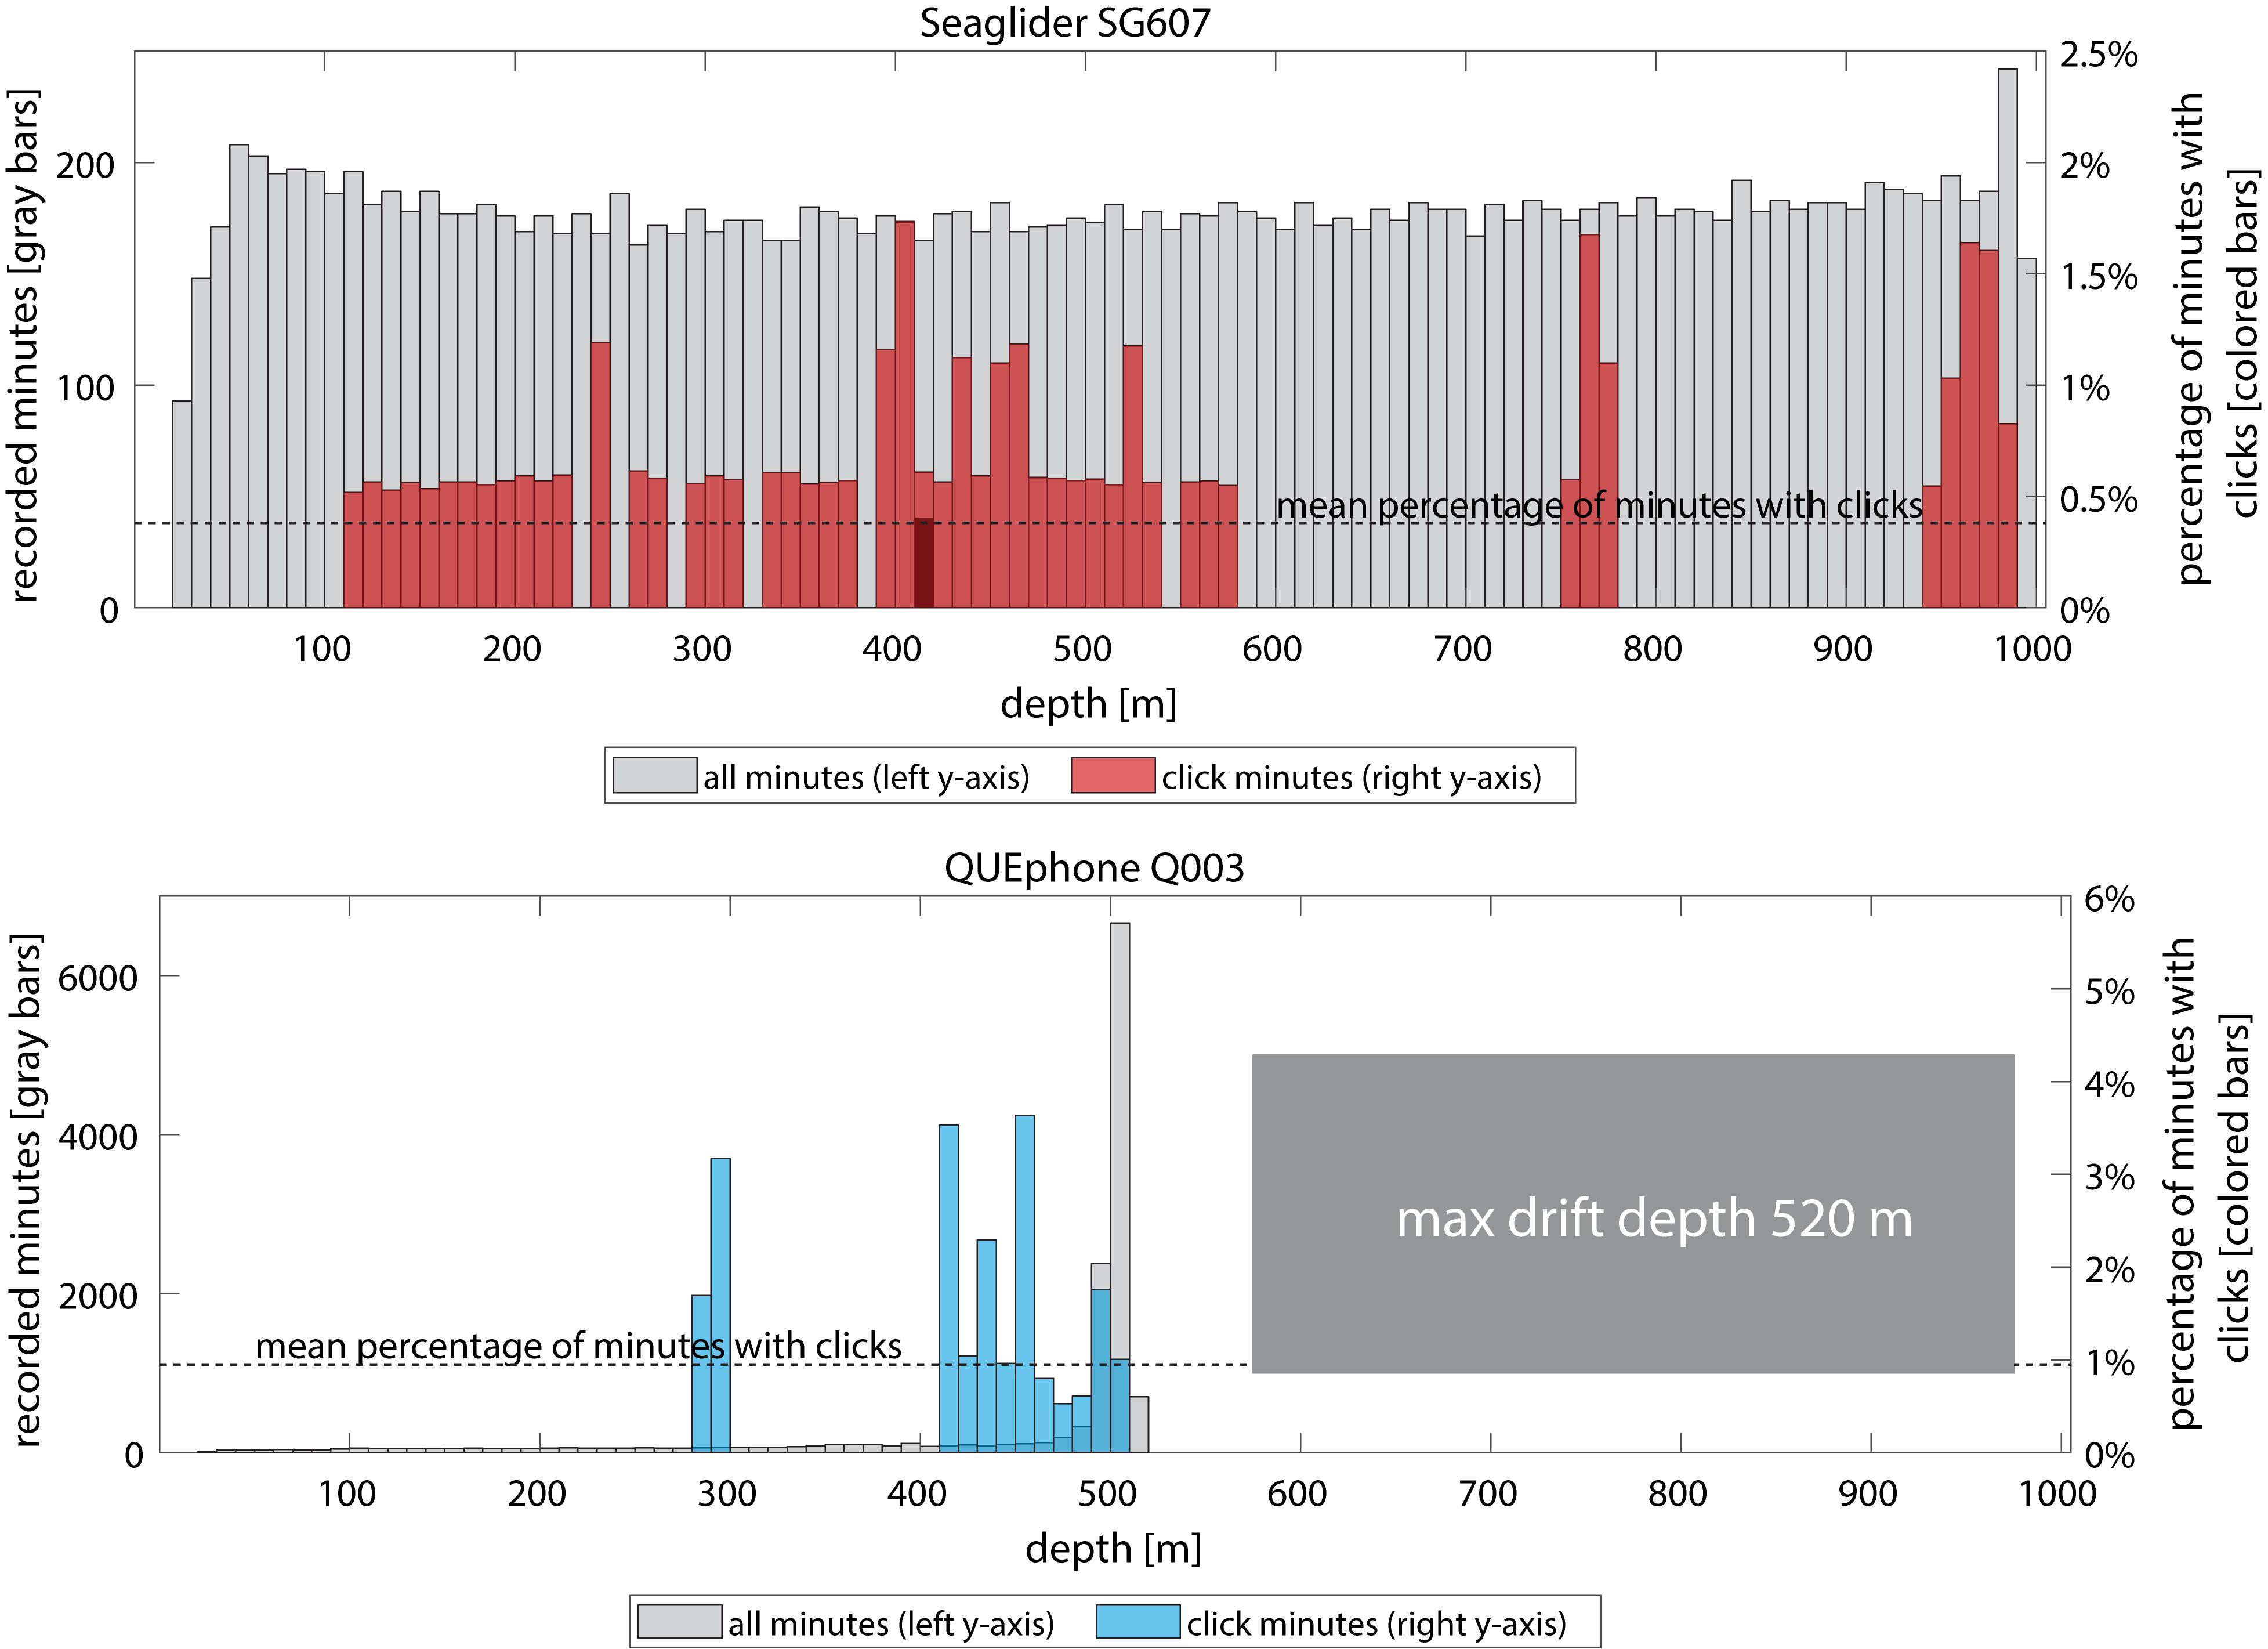
Figure 5. Distribution of mobile platform (Seaglider – top panel, red and QUEphone – bottom panel, blue) depths when Cuvier’s beaked whale clicks were detected. Gray bars and left y-axis indicate total recorded minutes in each 10 m depth bin. Colored bars and right y-axis indicate percentage of recorded minutes in that depth bin that contained Cuvier’s beaked whale clicks. Mean percentage of minutes with clicks across all depths is indicated by the dotted line. Q003’s maximum depth was 520 m; it typically drifted between 480 and 520 m.
Delphinid Clicks and Whistles
Delphinid clicks and whistles were very common on the recordings of all platforms; they were recorded on all days by all systems (Figure 6). Total percentages of recording hours containing delphinid clicks and whistles were similar across platforms, with the recordings from mobile platforms containing slightly more hours with clicks and/or whistles (Table 2) than the fixed platforms. The glider and QUEphone recordings contained delphinid vocalizations in 80.6% and 84.7% of hourly bins, respectively, while H01 and H02 contained them in 76.7% and 80.3% of 1-h bins, respectively. The pattern of hours with delphinid clicks or whistles present was positively correlated for all platforms (correlation coefficients between 0.32 and 0.57, p < 0.01 for all pairwise comparisons). The glider was most highly correlated with H02 (correlation coefficient 0.57) and least correlated with the QUEphone (0.43). The QUEphone was the least correlated with the HARPS (0.33 and 0.32 for H01 and H02, respectively). Correlation of hourly presence of delphinid clicks was 0.52 between both HARPs. Qualitatively, whistles were more commonly recorded than echolocation clicks by the HARPs. Bouts of both echolocation clicks and whistles were more common on the mobile platforms.
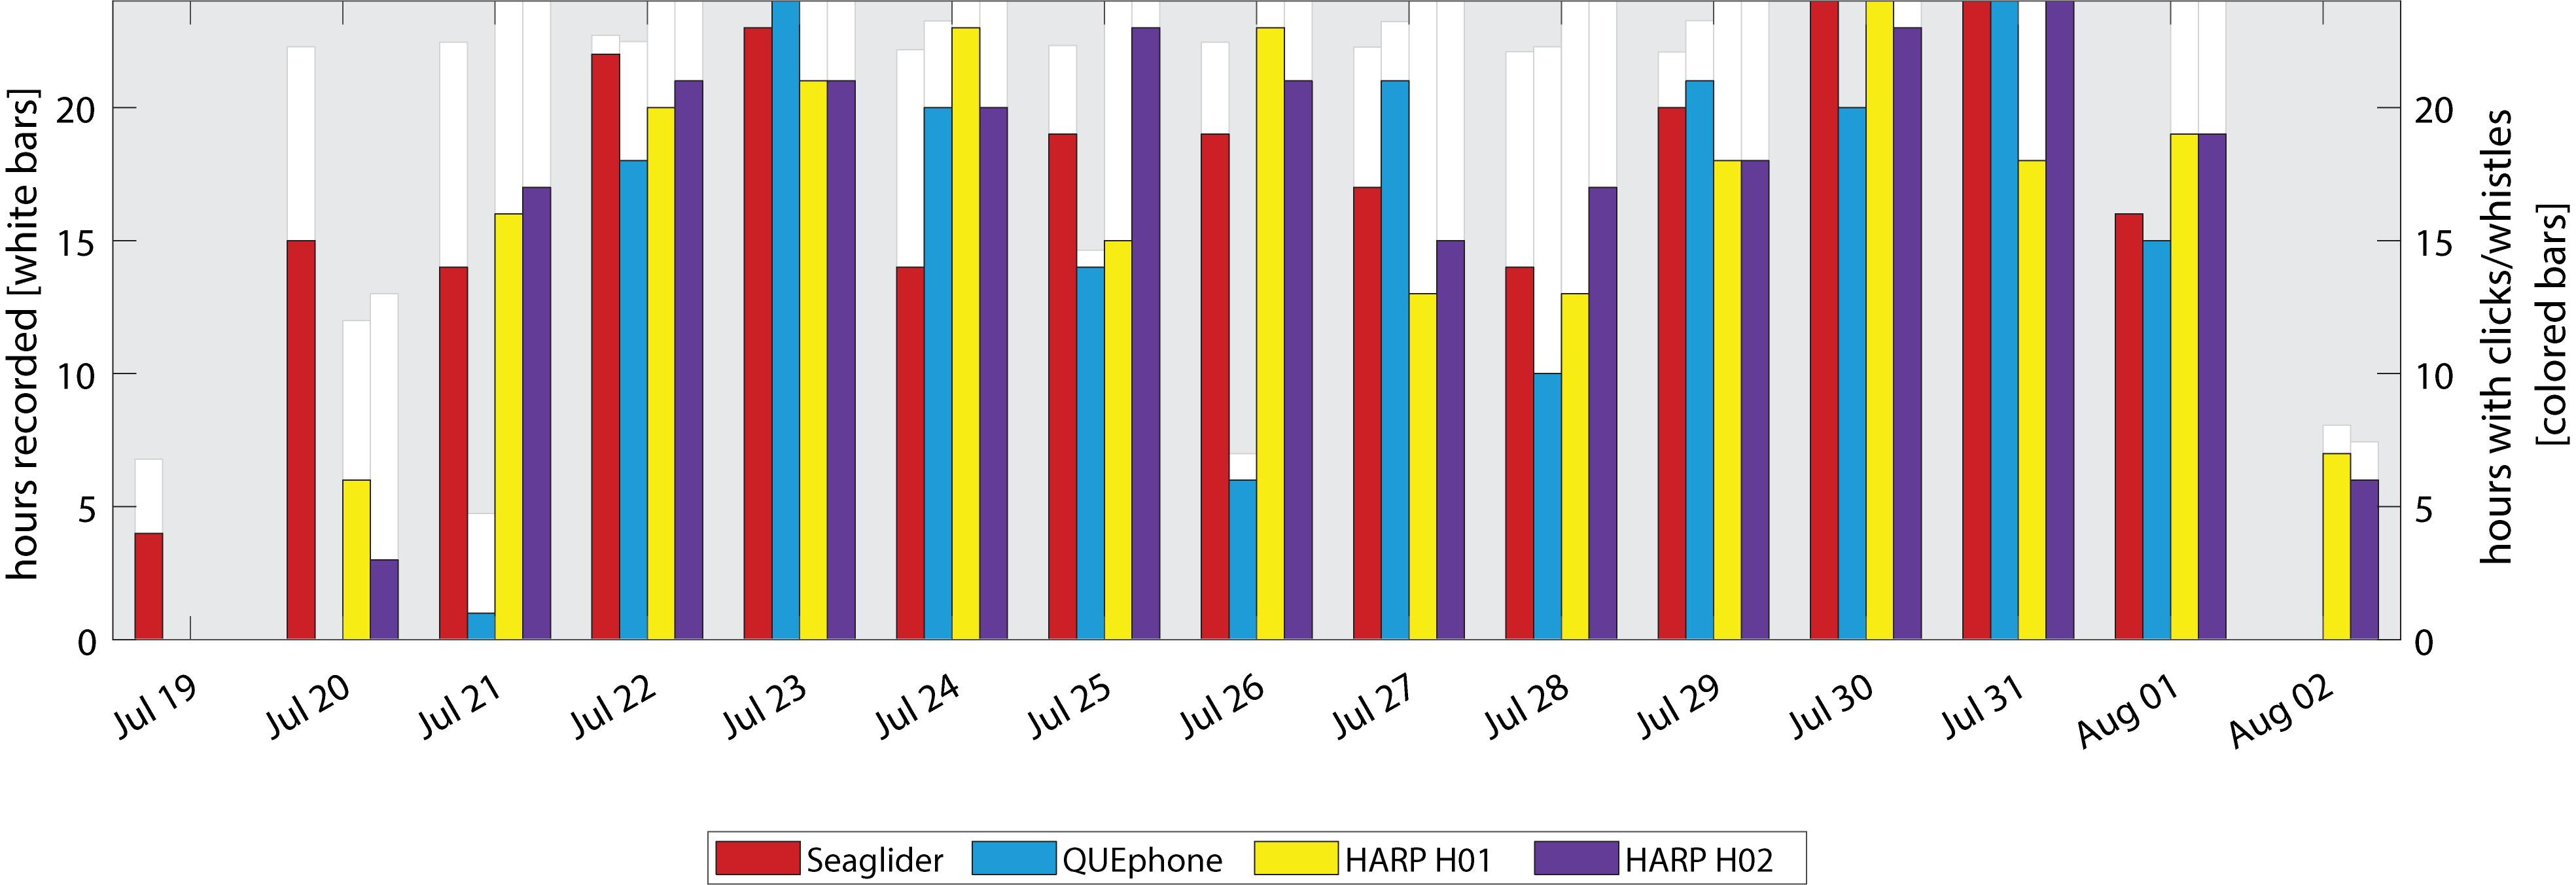
Figure 6. Daily presence of delphinid vocalizations (whistles and clicks) by recording platform. White bars and left y-axis indicate the total hours recorded per day by each platform. No white bar indicates a day where that recorder was either not deployed or not yet recording. Colored bars and right y-axis indicate hours per day with delphinid clicks or whistles present.
Minke Whale Boings
Minke whale boings were detected on all four systems with similar patterns of hourly and daily presence and absence (Figure 7). Minke whale boings were relatively scarce, with only 7–9 1-h bins containing boings per recorder over six total encounters that occurred on five separate days (3–5 encounters per recorder; Table 2). Two of the six total boing encounters were present on all recorders and one additional encounter was recorded by all but H02. Q003 was not deployed during one of the six encounters when boings were detected on all other platforms (Figure 7). Additionally, two short encounters were detected by Q003 only, one on 28 July and one on 31 July 2016 (Figures 3D, 7). The QUEphone was within 10 km of the HARPs and glider at the time of these encounters (Figure 3D and Supplementary Figure S3). After normalizing for total recording hours, Q003 had the greatest percent of recording hours with boings (3.6%) compared to 3.1% on SG607 and 2.3% and 2.6% on H01 and H02, respectively (Table 2).
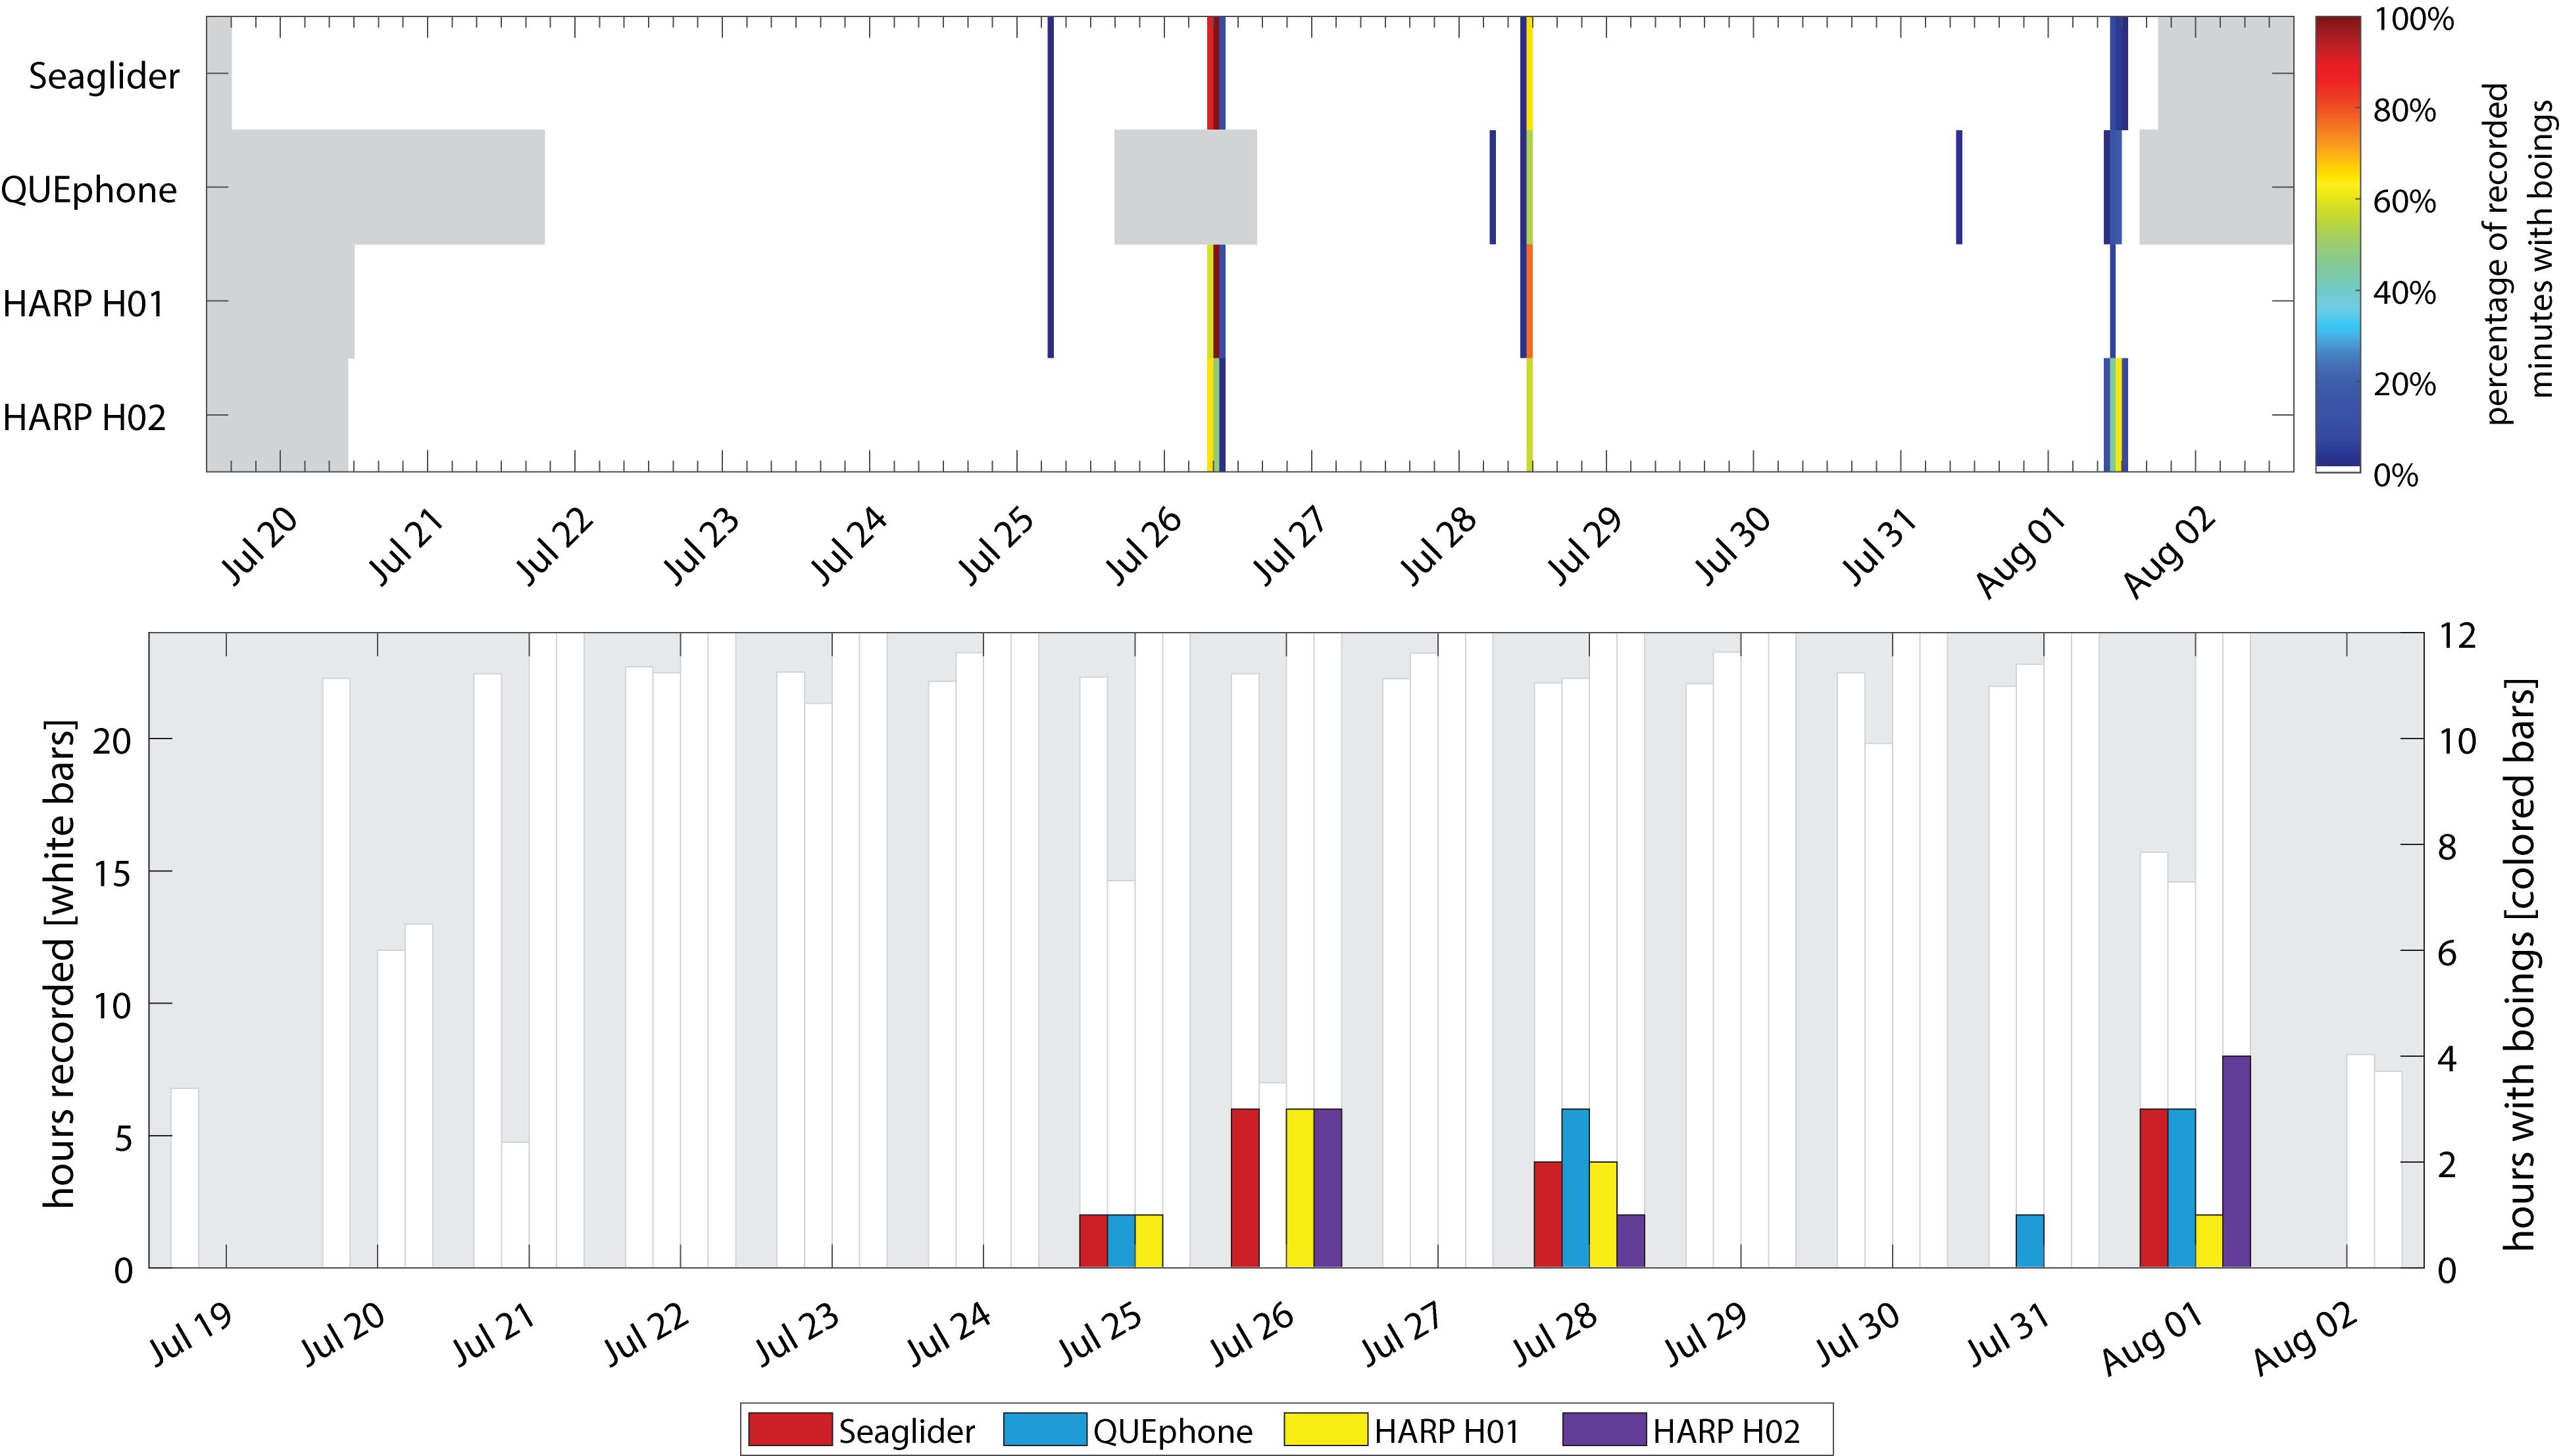
Figure 7. Occurrence of minke whale boings by recorder platform. Top panel: Percentage of recorded minutes with boings. Gray areas indicate times when recorders were not deployed. Color of each 1-h bar corresponds to number of boing detections in that hour, as a percentage of the total minutes recorded in that hour (if 0%, no colored bar is displayed). Bottom panel: Hours with minke whale boings per day. The white bars and left y-axis indicate the total hours recorded per day. No white bar indicates a day where that recorder was either not deployed or not yet recording. The right y-axis and colored bars indicate total hours per day containing minke whale boings. Note scale of right y-axis is only to 12 h.
Discussion
Through acoustic analyses of data collected by three types of passive acoustic recording systems deployed simultaneously in the Catalina Basin, we have provided a direct comparison of acoustic monitoring of marine mammals by mobile (Seaglider and QUEphone) and stationary (HARPs) recorders. Mobile platforms may provide an advantage when surveying large areas for cetaceans that produce vocalizations with limited propagation distances, and the distribution of animals is not known. All recorders detected Cuvier’s beaked whales, small delphinid whistles and clicks, and minke whale boings. While the daily and hourly presence of delphinids and minke whales did not differ by recorder type, the day-, hour-, and minute-scale presence of beaked whale clicks did differ across all recording platforms. These differences are likely related to the areas each recorder monitored and the depth of the platforms rather than the recorder type. Further, these differences highlight how the acoustic properties of the sound source largely determine the area over which a single hydrophone recorder can monitor the acoustic presence of a target species.
Beaked Whales
Differences in spatial coverage provided by each platform, relative to the spatial distribution of the animals, are likely the greatest driver of differences in beaked whale click presence across and between the different recorder types. Beaked whale group sizes are relatively small, and clicks are emitted in a highly directional beam pattern, so detection distances are estimated at less than 1 km for off-axis clicks and up to 4 km for on-axis clicks (Zimmer et al., 2008; Hildebrand et al., 2015). Beaked whale encounters were typically observed as “scanning sequences” of clicks where a short (<10 s) sequence of clicks showed a rise and fall in amplitude over the sequence. Most likely, this pattern was observed when a relatively distant beaked whale swept its sonar beam across the recorder. This supports the idea that beam width is a critical factor in detectability and that such a sweep would be unlikely to be picked up by another platform 2–3 km away.
Hildebrand et al. (2015) estimated a maximum detection distance by HARPs of 3.5 km for Cuvier’s beaked whales, with 100% click detection at 400 m or less. Even though the HARPs in this study likely had near-identical detection probabilities, they were deployed 4 km apart. Thus, it was not surprising that differences were observed between the HARPs, and they did not always detect the same clicking whales. With an estimated maximum listening radius of 3.5 km, the HARPs’ listening space overlapped by only 33%. For the single encounter that was detected by both H01 and H02 (and the glider and QUEphone; Figure 3B), we might assume the clicking whale or whales were located somewhere between the two recorders. The difference in the number of click-positive minutes on each HARP was relatively small, but they occurred at different times and sometimes had different species compositions. Differences in beaked whale presence patterns have been observed in previous studies employing HARPs deployed near each other. Baumann-Pickering et al. (2014) highlight the likelihood that local oceanographic conditions and small-scale habitat preferences by beaked whales could lead to different presence and absence observations in space and time and that interpretation of results may be limited with a low density of recorders.
The glider, with its ability to steer and thus travel toward a set waypoint, was able to stay within the vicinity of the HARPs much better than the QUEphone, and thus the comparison of clicks detected on glider and HARPs is possibly more straightforward. The glider had the greatest number of encounters (three) that matched a simultaneous encounter on at least one other recorder, likely because it spent the most time overlapping in estimated listening space with the HARPs – 84% of its recording time occurred when the glider and HARP listening areas were assumed to overlap in space by at least 50%. Conversely, while the QUEphone had the most overall click-positive minutes and the greatest number of beaked whale encounters, it had the most dissimilar spatial coverage, compared to the glider and HARPs. Not too surprisingly, then, it had only a single matched encounter with the other recorders. It is important to note that the estimated listening space used here to measure percentages of recorder overlap was taken from the literature and is specific for HARPs. For a more accurate comparison, the listening space would need to be empirically estimated for this particular survey area and for each platform individually. One approach to do this would be to use density estimation methods which allow for estimation of an effective detection area, which could then be directly compared across platform types (Marques et al., 2013).
Local oceanographic conditions are likely to result in patchy distribution of prey targeted by Cuvier’s beaked whales (Benoit-Bird et al., 2016) and hence provide small scale preferred habitat with the Catalina Basin. It is possible that proximity to more ideal beaked whale foraging habitat within the Catalina Basin drove differences observed across recorder types. The QUEphone, which had the greatest number of encounters and percent of recording minutes with clicks, spent considerably more time north of the HARPs and glider (Figure 3A). A study that tracked Cuvier’s beaked whales using surface recorders, that occurred in the same area and time as this survey, also had most of the beaked whale tracking events and encounters north of the HARPs (see Figure 1 in Barlow et al., 2018). The glider more or less remained in the center of the basin and surveyed an area that extended just slightly beyond the HARPs (by about 4 km in each direction). The single-hydrophone systems used in this study do not provide information on animal location, and recording effort in space and time was variable. Therefore, we cannot make any reliable inferences about beaked whale distribution within the Catalina Basin. However, we can conclude that the glider and/or QUEphone spent time in areas where beaked whales may be more actively foraging and that spatial differences, even of just a few kilometers, are likely drivers of the differences in detection rates observed.
Recorder depth in relation to beaked whale foraging depth may also have driven the differences in detections by the mobile platforms compared to the HARPs. Diving and foraging behavior in Cuvier’s beaked whales is perhaps the best-studied among all the beaked whale species. They are known to echolocate only below 200 m, and more typically below 450 m (Johnson et al., 2004; Tyack et al., 2006). Tagging and tracking studies indicate typical foraging depths of 700–2000 m with variability by region (Tyack et al., 2006; DeRuiter et al., 2013; Schorr et al., 2014; Gassmann et al., 2015). Echolocation depths and the strong directionality of the signals support the idea that beaked whales may best be recorded with deep-water instruments (Zimmer et al., 2008). While the HARPs were deployed at 1250 m depth, the QUEphone drifted at 500 m, and the glider constantly moved between the surface and 1000 m, spending considerably less time than the QUEphone at depths below 500 m. We hypothesized that glider detection of beaked whale clicks might vary with glider depth, and that total beaked whale detections may be less than the HARPs or QUEphone simply because the glider spends less time at the ideal depths for beaked whale click detection. However, this was not what we observed. Beaked whale clicks were detected on the glider at many different depths, and there was no apparent pattern to the distribution of depths at which clicks were recorded.
A recent tracking study by Barlow et al. (2018) showed that near-surface (100 m) hydrophones can successfully detect and track Cuvier’s beaked whales. They found the mean foraging depth was 967 m (SD 112 m) in the Catalina Basin, where maximum seafloor depths are ∼1250 m (Barlow et al., 2018). Additional tracking studies in the Southern California Bight found Cuvier’s beaked whales commonly foraged 300–400 m above the seafloor when seafloor depths were between 1000 and 14000 m (Gassmann et al., 2015; Barlow et al., 2020). Increased detection of beaked whale clicks on a deep (300 m) versus shallow (20 m) recorder has been documented previously (Gkikopoulou, 2018). It is possible that due to the highly directional nature of beaked whale clicks, hydrophones located at the foraging depth, rather than directly on the seafloor, may have a higher probability of recording the clicks. The total number of beaked whale encounters during the 2-week deployment was relatively low, so it was difficult to assess any relationship between the number of detections and platform depth from this small experiment. Additional effort in a basin with higher known beaked whale densities (ideally to increase the overall number of clicks detected) and where the glider is piloted to dive primarily straight up and down at a single waypoint (to remove the potential effect of horizontal movement and isolate the effect of vertical movement) may allow further investigation of the effect of depth.
The limitations of each recording system likely also contributed to the differences in beaked whale detections, at least when ambient noise levels were low. The noise floor above 20 kHz was about 10 dB lower for the WISPR system compared to the HARPs. This makes comparing detection rates noticeably more complicated than it would be comparing identical recording systems, regardless of platform movement. When ocean ambient noise is low (at or near sea state zero), the WISPR system’s lower noise floor (∼28 dB vs. ∼38 dB on the HARPs) may have allowed detection of faint clicks, which the HARP may have missed. When sea state conditions were 2 or greater, the ambient noise levels would have exceeded the WISPR system noise floor, and the detection range would have been noise limited rather than recorder limited. At sea states of about 4, sound levels above 30 kHz would be the same on both the HARPs and WISPR systems. A rough estimate for sea states during the deployment period based on wind speeds recorded by the nearest weather buoy (National Data Buoy Center Station 46025 approximately 70 km north of the study site; average wind speed 5.7 knots SD 2.6) shows sea states were typically between 1 and 3.
Anecdotally, we have a selection of known beaked whale locations that were localized by Barlow et al. (2018) at the same time and in the same area as this experiment (Supplementary Table S1). Of 23 known whale locations, two matched in time with an encounter on the QUEphone, and two matched with an encounter on H01. In all four of these matches, the QUEphone and H01 were over 5.5 km from the localized whale. This detection range is 2 km beyond what has been modeled as the maximum detection range of Cuvier’s beaked whales from a HARP (Hildebrand et al., 2015). We suspect these may be examples of detections of two groups of vocalizing animals at the same time rather than the detection of one group on two platforms, but we cannot definitively say so because the single-hydrophone systems used in this study do not allow range estimation or localization. Most (81–96%) of the known whale locations from Barlow et al. (2018) were 4 km or further from the mobile platforms or HARPs. Three whale locations from a single encounter were estimated when the QUEphone was less than 2.5 km away, but no clicks were detected on the QUEphone. The closest whale location to the glider was a single location where the whales were 3.5 km from the glider; the glider was very near the surface at that time, and no clicks were detected on the glider. And finally, three whale locations in a single encounter were 3.5 km or less from H01, a single whale location was less than 2.8 km from H02, and no clicks were detected on either HARP. Matches of localized whales to encounters on the mobile platforms or HARPs were rare (and possibly multiple groups of animals). However, none of the locations occurred within a range where we would have expected a detection to be certain (400 m or less; Hildebrand et al., 2015), and so the lack of matches to localized whales is not surprising.
Delphinids
Hours and days with detections of delphinids did not differ across the recording platforms. For such abundant, vocally active, large groups of animals, we did not expect differences in recording capabilities of the three platforms, particularly at hourly and daily scales. However, we did observe a difference in the type of delphinid vocalization recorded by the mobile platforms compared to the HARPs. Most encounters of delphinids by the glider or QUEphone were dominated by echolocation clicks. Often, LTSAs were completely saturated between 10 and 50 kHz with long-duration clicking bouts. Whistles were typically present as well but were not as visually apparent as the clicks.
Conversely, on the HARPs, whistles were the primary vocalization type observed in the LTSAs and used to mark encounters. Clicks, when present, were much fainter, and clicking bouts were generally much shorter in duration than what was seen on the glider and QUEphone. This difference could be related to the depth of the mobile platforms and the directional nature of echolocation clicks. The mobile platforms recorded at shallower depths than the HARPs, so likely spent more time closer to where small delphinids would be foraging and where echolocation clicks would be received. Whistles, which are more omnidirectional than clicks, particularly at lower frequencies (Janik, 2000; Lammers and Au, 2003; Branstetter et al., 2012), would be more easily detected at depth. When simply monitoring for presence or absence at a broad temporal scale, this difference in proportions of clicks versus whistles may not be important. However, when looking at finer-scale behavior or potentially when trying to estimate density or abundance, these differences would need more study.
Additionally, the large number of hours where delphinid clicks dominated the glider or QUEphone recordings could influence beaked whale detection results, depending on the analysis method used. A similar effect has been seen in previous beaked whale analyses (Baumann-Pickering et al., 2014). Through simple visual inspection for beaked whales in LTSAs, eight encounters were identified on the QUEphone. After running the two-step detection system, an additional five encounters were identified and verified (and the eight manual encounters verified). Four of the five new encounters overlapped with known delphinid encounters on the QUEphone and were visually masked by the dolphin clicks. On the glider, the detection system found one additional encounter, which was not during a delphinid encounter, and another encounter’s duration was extended, a time which did overlap with a delphinid encounter. This highlights the importance of using the same analysis methods across recorder types when doing a direct comparison. Had the identical detector and validation process not been used, the differences in number of encounters and minutes with beaked whale clicks would not have been as pronounced.
Minke Whales
Detections of minke boings were generally the same across all platforms, which was expected based on the known detection range of boings and the proximity of all recorders in this experiment. Previous work by Martin et al. (2013) estimating minke whale boing density from a bottom-mounted hydrophone array estimated the probability of detecting a boing 10 km horizontal distance from the hydrophone between 0.8 and 0.9, and a detection probability of 0.5 or better out to approximately 25 km horizontal range. For our study, all recorders were within 20 km of one another, and more typically were within 8 km of each other. The result that most boings were detected by all recorders in this study aligns with the detection ranges found by Martin et al. (2013). Detector performance also did not vary by recorder type, with all recorders having a very high false-positive rate of 96–98%. Sources of mid-frequency, long-duration noise were common on all recorders. The main sources of false positives were low-frequency sonar, unidentified frequency-contour noise, or platform noise. While an improved detector could likely provide improved performance, for this small dataset, the basic tonal detector was sufficient.
Conclusion
Mobile autonomous platforms such as gliders and deep-water profiling floats are being used to acoustically survey for a variety of cetacean species, and their use is becoming more widespread. This comparison study confirms that these platforms can detect the same types of bioacoustic signals as stationary recorders at similar detection rates, but cross-platform comparisons are complex. Our results emphasize the importance of spatial coverage in marine mammal acoustic surveys for high-frequency, directional signal types like beaked whale echolocation clicks when animal distribution is unknown. Simultaneous detection of beaked whale echolocation clicks was not common, even within the relatively small area surveyed here. To fully understand differences in detection rates between the HARPs and mobile platforms, additional work is needed. Additional analysis of sound propagation and deployment of a larger number of stationary sensors over a broader scale would help resolve issues with likely patchy pretty distribution and additionally analysis of sound propagation could provide platform estimates of the listening space. Deployment of a larger number of stationary sensors over a broader scale or by keeping all recorders within an even more confined area, perhaps within 1 km of one another, would help resolve issues with likely patchy prey distribution. Further, efforts to integrate information on sound propagation in the survey area may provide additional insight into drivers of the observed differences in detection rates by providing better estimates of the listening space for each platform. While more research is needed to fully understand how platform movement may influence acoustic detections, this work provides a detailed comparison of stationary and mobile recorders that can be used to inform future survey planning.
When selecting the ideal platform for a passive acoustic marine mammal survey, it is critical to know the species of interest, understand the acoustic behavior and acoustic properties of the sounds produced by that species, and identify the primary research or management question. The fundamental differences between the Seaglider, QUEphone, and HARP – the ability to move and maximum deployment duration – make each best suited to answer different questions. Because a Seaglider can follow programmable tracklines, it can cover a large area, and so may be an ideal platform to identify new hotspots or examine habitat preference, particularly for species that are only detectable over short distances such as beaked whales. The QUEphone can also cover large areas, as it drifts passively. But the glider and QUEphone can only be deployed for several weeks, so a single deployment may not identify temporal changes in presence or behavior. Conversely, a stationary recorder can be deployed for months to years, so can answer questions about seasonal and long-term changes. For low-to mid-frequency (20–2000 Hz) baleen whales that produce loud omni-directional signals that can be heard over many tens of kilometers, a stationary recorder can cover a large area, and is likely the most efficient platform. Ideally, these different tools can be used in concert with one another to answer a range of biological and conservation-relevant questions.
Data Availability Statement
The raw data supporting the conclusions of this article will be made available by the authors, without undue reservation.
Author Contributions
HM, HK, DM, DH, SB-P, JB, and SF: funding acquisition, writing – review, editing, and approval of final manuscript. HM, SB-P, and SF: instrumentation. SF, SB-P, HK, and DM: methodology. SF: data analysis and writing – first draft and revisions. All authors contributed to the article and approved the submitted version.
Funding
Funding for this work was provided by the Living Marine Resources Program (N39430-14-C-1435 and N39430-14-C-1434), the Office of Naval Research (N00014-15-1-2142, N00014-10-1-0534, and N00014-13-1-0682), and NOAA’s Southwest Fisheries Science Center. SF was supported by the National Science and Engineering Graduate Fellowship.
Conflict of Interest
The authors declare that the research was conducted in the absence of any commercial or financial relationships that could be construed as a potential conflict of interest.
Acknowledgments
Special thanks to Anatoli Erofeev and Stephen Pierce (Oregon State University, OSU) for their glider piloting guidance and support and to Alex Turpin (OSU) for his work preparing the glider and QUEphone. We thank Bruce Thayre and Ryan Griswold (Scripps Institution of Oceanography, SIO), who deployed and recovered the HARPs. Vessel support was provided by Trevor Oudin and Juan Carlos Aguilar of Wrigley Marine Science Center and Spencer Salmon and the crew of the M/V Horizon. We also thank Jennifer Trickey and Ally Rice of SIO for their assistance with acoustic analyses of HARP data and guidance for analysis of the mobile recorder data. This manuscript was improved with feedback from Selina Heppell (OSU) and two reviewers. This is PMEL Contribution No. 4931.
Supplementary Material
The Supplementary Material for this article can be found online at: https://www.frontiersin.org/articles/10.3389/fmars.2020.00721/full#supplementary-material
References
Amante, C., and Eakins, B. W. (2009). ETOPO1 1 Arc-Minute Global Relief Model: Procedures, Data Sources and Analysis. NOAA Technical Memorandum NESDIS NGDC-24. Silver Spring, MD: NOAA. doi: 10.7289/V5C8276M
Barlow, J. (2016). Cetacean abundance in the California Current estimated from ship-based line transect surveys in 1991-2014. NOAA Southwest Fisheries Science Center Administrative Report LJ-16–11. La Jolla, CA: NOAA.
Barlow, J., and Gisiner, R. (2006). Mitigating, monitoring and assessing the effects of anthropogenic sound on beaked whales. J. Cetacean Res. Manag. 7, 239–249.
Barlow, J., Griffiths, E. T., Klinck, H., and Harris, D. V. (2018). Diving behavior of Cuvier’s beaked whales inferred from three-dimensional acoustic localization and tracking using a nested array of drifting hydrophone recorders. J. Acoust. Soc. Am. 144, 2030–2041.
Barlow, J., Schorr, G. S., Falcone, E. A., and Moretti, D. (2020). Variation in dive behavior of Cuvier’s beaked whales with seafloor depth, time-of-day, and lunar illumination. Mar. Ecol. Prog. Ser. 644, 199–214. doi: 10.3354/meps13350
Barlow, J., and Taylor, B. (2005). Estimates of sperm whale abundance in the northeastern temperate Pacific from a combined acoustic and visual survey. Mar. Mam. Sci. 21, 429–445. doi: 10.1111/j.1748-7692.2005.tb01242.x
Baumann-Pickering, S., McDonald, M. A., Simonis, A. E., Solsona Berga, A., Merkens, K. P. B., Oleson, E. M., et al. (2013). Species-specific beaked whale echolocation signals. J. Acoust. Soc. Am. 134, 2293–2301. doi: 10.1121/1.4817832
Baumann-Pickering, S., Rice, A. C., Trickey, J. S., Hildebrand, J. A., Wiggins, S. M., and Širović, A. (2018). Five Years of Whale Presence in the SOCAL Range Complex 2013-2017. Marine Physical Laboratory Technical Memorandum #626. La Jolla, CA: Scripps Institution of Oceanography..
Baumann-Pickering, S., Roch, M. A., Brownell, R. L. Jr., Simonis, A. E., McDonald, M. A., Solsona Berga, A., et al. (2014). Spatio-temporal patterns of beaked whale echolocation signals in the North Pacific. PLoS One 9:e86072. doi: 10.1371/journal.pone.0086072
Baumgartner, M. F., Fratantoni, D. M., Hurst, T. P., Brown, M. W., Cole, T. V. N., Van Parijs, S. M., et al. (2013). Real-time reporting of baleen whale passive acoustic detections from ocean gliders. J. Acoust. Soc. Am. 134, 1814–1823. doi: 10.1121/1.4816406
Benoit-Bird, K. J., Southall, B. L., and Moline, M. A. (2016). Predator-guided sampling reveals biotic structure in the bathypelagic. Proc. R. Soc. B Biol. Sci. 283:20152457. doi: 10.1098/rsbl.2015.2457
Branstetter, B. K., Moore, P. W., Finneran, J. J., Tormey, M. N., and Aihara, H. (2012). Directional properties of bottlenose dolphin (Tursiops truncatus) clicks, burst-pulse, and whistle sounds. J. Acoust. Soc. Am. 131, 1613–1621. doi: 10.1121/1.3676694
Buckland, S. T., Anderson, D. R., Burnham, K. P., Laake, J. L., Borchers, D. L., and Thomas, L. (2001). Introduction to Distance Sampling. Oxford: Oxford University Press.
Dawson, S., Barlow, J., and Ljungblad, D. K. (1998). Sounds recorded from Baird’s beaked whale, Berardius bairdii. Mar. Mammal Sci. 14, 335–344. doi: 10.1111/j.1748-7692.1998.tb00724.x
DeRuiter, S. L., Southall, B. L., Calambokidis, J., Zimmer, W. M. X., Sadykova, D., Falcone, E. A., et al. (2013). First direct measurements of behavioural responses by Cuvier’s beaked whales to mid-frequency active sonar. Biol. Lett. 9:20130223. doi: 10.1098/rsbl.2013.0223
Eriksen, C. C., Osse, T. J., Light, R. D., Wen, T., Lehman, T. W., Sabin, P. L., et al. (2001). Seaglider: a long-range autonomous underwater vehicle for oceanographic research. IEEE J. Ocean. Eng. 26, 424–436. doi: 10.1109/48.972073
Fregosi, S. (2020). Applications of Slow-Moving Autonomous Platforms for Passive Acoustic Monitoring and Density Estimation of Marine Mammals. Dissertation, Oregon State University, Corvallis, OR.
Fregosi, S., Harris, D. V., Matsumoto, H., Mellinger, D. K., Negretti, C., Moretti, D. J., et al. (2020). Comparison of fin whale 20 Hz call detections by deep-water mobile autonomous and stationary recorders. J. Acoust. Soc. Am. 147, 961–977. doi: 10.1121/10.0000617
Gassmann, M., Wiggins, S. M., and Hildebrand, J. A. (2015). Three-dimensional tracking of Cuvier’s beaked whales’ echolocation sounds using nested hydrophone arrays. J. Acoust. Soc. Am. 138, 2483–2494. doi: 10.1121/1.4927417
Gkikopoulou, K. C. (2018). Getting Below the Surface: Density Estimation Methods for Deep Diving Animals Using Slow Autonomous Underwater Vehicles. Dissertation, St. Andrews University, St. Andrews.
Griffiths, E. T., and Barlow, J. (2015). Equipment Performance Report for the Drifting Acoustic Spar Buoy Recorder (DASBR). NOAA Technical Memorandum NOAA-TM-NMFS-SWFSC-543. La Jolla, CA: NOAA.
Griffiths, E. T., Keating, J. L., Barlow, J., and Moore, J. E. (2018). Description of a new beaked whale echolocation pulse type in the California current. Mar. Mammal Sci. 35, 1058–1069. doi: 10.1111/mms.12560
Guerra, M., Dawson, S. M., Brough, T. E., and Rayment, W. J. (2014). Effects of boats on the surface and acoustic behaviour of an endangered population of bottlenose dolphins. Endanger. Species Res. 24, 221–236. doi: 10.3354/esr00598
Helble, T. A., D’Spain, G. L., Hildebrand, J. A., Campbell, G. S., Campbell, R. L., and Heaney, K. D. (2013). Site specific probability of passive acoustic detection of humpback whale calls from single fixed hydrophones. J. Acoust. Soc. Am. 134, 2556–2570. doi: 10.1121/1.4816581
Heinemann, D., Gedamke, J., Oleson, E., Barlow, J., Crance, J., Holt, M., et al. (2016). Report of the Joint Marine Mammal Commission – National Marine Fisheries Service Passive Acoustic Surveying Workshop. NOAA Technical Memorandum NMFS-F/SPO-164. Silver Spring, MD.
Henderson, E. E., Martin, S. W., Manzano-Roth, R., and Matsuyama, B. M. (2016). Occurrence and habitat use of foraging Blainville’s beaked whales (Mesoplodon densirostris) on a U.S. Navy Range in Hawaii. Aquat. Mamm. 42, 549–562. doi: 10.1578/AM.42.4.2016.549
Hildebrand, J. A., Baumann-Pickering, S., Frasier, K. E., Trickey, J. S., Merkens, K. P., Wiggins, S. M., et al. (2015). Passive acoustic monitoring of beaked whale densities in the Gulf of Mexico. Sci. Rep. 5:16343. doi: 10.1038/srep16343
Janik, V. M. (2000). Source levels and the estimated active space of bottlenose dolphin (Tursiops truncatus) whistles in the Moray Firth, Scotland. J. Comp. Physiol. A Sens. Neural Behav. Physiol. 186, 673–680. doi: 10.1007/s003590000120
Jarvis, S. M., Morrissey, R. P., Moretti, D. J., DiMarzio, N. A., and Shaffer, J. A. (2014). Marine mammal monitoring on navy ranges (M3R): a toolset forautomated detection, localization, and monitoring of marine mammals in open ocean environments. Mar. Technol. Soc. J. 48, 5–20. doi: 10.4031/MTSJ.48.1.1
Johnson, M., Madsen, P. T., Zimmer, W. M. X., Aguilar de Soto, N., and Tyack, P. L. (2004). Beaked whales echolocate on prey. Proc. R. Soc. B Biol. Sci. 271, S383–S386. doi: 10.1098/rsbl.2004.0208
Johnson, M., Madsen, P. T., Zimmer, W. M. X., de Soto, N. A., Tyack, P. L., Aguilar de Soto, N., et al. (2006). Foraging Blainville’s beaked whales (Mesoplodon densirostris) produce distinct click types matched to different phases of echolocation. J. Exp. Biol. 209, 5038–5050. doi: 10.1242/jeb.02596
Keating, J. L., Barlow, J., and Rankin, S. (2016). Shifts in frequency-modulated pulses recorded during an encounter with Blainville’s beaked whales (Mesoplodon densirostris). J. Acoust. Soc. Am. 140, EL166–EL171. doi: 10.1121/1.4959598
Klinck, H., Kindermann, L., and Boebel, O. (2016). “PALAOA: the perennial acoustic observatory in the Antarctic Ocean— real- time eavesdropping on the antarctic underwater soundscape,” in Listening in the Ocean, eds W. W. L. Au and M. O. Lammers (New York: Springer), 207–219. doi: 10.1007/978-1-4939-3176-7_8
Klinck, H., Matsumoto, H., Fregosi, S., and Mellinger, D. K. (2014). High-frequency observations from mobile autonomous platforms. J. Acoust. Soc. Am. 136:2119. doi: 10.1121/1.4899631
Klinck, H., Mellinger, D. K., Klinck, K., Bogue, N. M., Luby, J. C., Jump, W. A., et al. (2012). Near-real-rime acoustic monitoring of beaked whales and other cetaceans using a SeagliderTM. PLoS One 7:e36128. doi: 10.1371/journal.pone.0036128
Klinck, H., Nieukirk, S. L., Fregosi, S., Klinck, K., Mellinger, D. K., Lastuka, S., et al. (2015). Cetacean Studies in the Hawaii Range Complex in December 2014–January 2015: Passive Acoustic Monitoring of Marine Mammals Using Gliders. Final Report Contract No. N62470-10-D-3011, Task Order KB25. Pearl Harbor, HI: Naval Facilities Engineering Command Pacific.
Kuperman, W. A., and Roux, P. (2007). “Underwater acoustics,” in Springer Handbook of Acoustics, ed. T. D. Rossing (New York, NY: Springer), 149–204.
Küsel, E. T., Munoz, T., Siderius, M., Mellinger, D. K., and Heimlich, S. (2017). Marine mammal tracks from two-hydrophone acoustic recordings made with a glider. Ocean Sci. 13, 273–288. doi: 10.5194/os-13-273-2017
Kyhn, L. A., Tougaard, J., Thomas, L., Duve, L. R., Stenback, J., Amundin, M., et al. (2012). From echolocation clicks to animal density—Acoustic sampling of harbor porpoises with static dataloggers. J. Acoust. Soc. Am. 131:550. doi: 10.1121/1.3662070
Lammers, M. O., and Au, W. W. L. (2003). Directionality in the whistles of Hawaiian spinner dolphins (Stenella longirostris): a signal feature to cue direction of movement? Mar. Mammal Sci. 19, 249–264. doi: 10.1111/j.1748-7692.2003.tb01107.x
Lesage, V., Barrette, C., Kingsley, M. C. S., and Sjare, B. (1999). The effect of vessel noise on the vocal behavior of belugas in the St. Lawrence River Estuary, Canada. Mar. Mammal Sci. 15, 65–84. doi: 10.1111/j.1748-7692.1999.tb00782.x
Madsen, P. T., Johnson, M., Aguilar de Soto, N., Zimmer, W. M. X., and Tyack, P. L. (2005). Biosonar performance of foraging beaked whales (Mesoplodon densirostris). J. Exp. Biol. 208, 181–194. doi: 10.1242/jeb.01327
Marques, T. A., Thomas, L., Martin, S. W., Mellinger, D. K., Ward, J. A., Moretti, D. J., et al. (2013). Estimating animal population density using passive acoustics. Biol. Rev. 88, 287–309. doi: 10.1111/brv.12001
Martin, S. W., Marques, T. A., Thomas, L., Morrissey, R. P., Jarvis, S., DiMarzio, N., et al. (2013). Estimating minke whale (Balaenoptera acutorostrata) boing sound density using passive acoustic sensors. Mar. Mammal Sci. 29, 142–158. doi: 10.1111/j.1748-7692.2011.00561.x
Matsumoto, H., Dziak, R. P., Mellinger, D. K., Fowler, M., Haxel, J., Lau, A., et al. (2006). “Autonomous hydrophones at NOAA/OSU and a new seafloor sentry system for real-time detection of acoustic events,” in OCEANS 2006, Boston, MA. doi: 10.1109/OCEANS.2006.307041
Matsumoto, H., Haxel, J., Turpin, A., Fregosi, S., Klinck, H., Klinck, K., et al. (2015). “Simultaneous operation of mobile acoustic recording systems off the Washington Coast for cetacean studies: system noise level evaluations,” in OCEANS 2015, Washington, DC. doi: 10.23919/OCEANS.2015.7401830
Matsumoto, H., Jones, C., Klinck, H., Mellinger, D. K., Dziak, R. P., and Meinig, C. (2013). Tracking beaked whales with a passive acoustic profiler float. J. Acoust. Soc. Am. 133, 731–740. doi: 10.1121/1.4773260
Mellinger, D., and Barlow, J. (2003). Future Directions for Acoustic Marine Mammal Surveys: Stock Assessment and Habitat Use. OAR Special Report, NOAA/PMEL Contribution No. 2557. La Jolla, CA: NOAA.
Mellinger, D. K., Martin, S. W., Morrissey, R. P., Thomas, L., and Yosco, J. J. (2011). A method for detecting whistles, moans, and other frequency contour sounds. J. Acoust. Soc. Am. 129, 4055–4061. doi: 10.1121/1.3531926
Mellinger, D. K., Nieukirk, S. L., and Heimlich, S. L. (2018). Ishmael 3.0 User Guide. Available online at: http://www.bioacoustics.us/ishmael.html
Mellinger, D. K., Stafford, K., Moore, S., Dziak, R. P., and Matsumoto, H. (2007). An overview of fixed passive acoustic observation methods for cetaceans. Oceanography 20, 36–45. doi: 10.5670/oceanog.2007.03
Miller, P. J., and Tyack, P. L. (1998). A small towed beamforming array to identify vocalizing resident killer whales (Orcinus orca) concurrent with focal behavioral observations. Deep Sea Res. II Top. Stud. Oceanogr. 45, 1389–1405. doi: 10.1016/S0967-0645(98)00028-9
Nieukirk, S. L., Fregosi, S., Mellinger, D. K., and Klinck, H. (2016). A complex baleen whale call recorded in the mariana trench marine national monument. J. Acoust. Soc. Am. 140, EL274–EL279. doi: 10.1121/1.4962377
Norris, T., Martin, S. W., Thomas, L., Yack, T., Oswald, J. N., Nosal, E.-M., et al. (2012). “Acoustic ecology and behavior of minke whales in the Hawaiian and Marianas Islands: localization, abundance estimation, and characterization of minke whale ‘boings,’,” in The Effects of Noise on Aquatic Life, eds A. N. Popper and A. Hawkins (New York, NY: Springer), 149–153. doi: 10.1007/978-1-4419-7311-5_33
Norris, T. F., Dunleavy, K. J., Yack, T. M., and Ferguson, E. L. (2017). Estimation of minke whale abundance from an acoustic line transect survey of the Mariana Islands. Mar. Mammal Sci. 33, 574–592. doi: 10.1111/mms.12397
Quick, N. J., and Janik, V. M. (2012). Bottlenose dolphins exchange signature whistles when meeting at sea. Proc. R. Soc. B Biol. Sci. 279, 2539–2545. doi: 10.1098/rspb.2011.2537
Rankin, S., and Barlow, J. (2005). Source of the North Pacific “boing” sound attributed to minke whales. J. Acoust. Soc. Am. 118, 3346–3351. doi: 10.1121/1.2046747
Rankin, S., Oswald, J. N., Barlow, J., and Lammers, M. O. (2007). Patterned burst-pulse vocalizations of the northern right whale dolphin, Lissodelphis borealis. J. Acoust. Soc. Am. 121, 1213–1218. doi: 10.1121/1.2404919
Risch, D., Clark, C. W., Dugan, P. J., Popescu, M., Siebert, U., and Van Parijs, S. M. (2013). Minke whale acoustic behavior and multi-year seasonal and diel vocalization patterns in Massachusetts Bay, USA. Mar. Ecol. Prog. Ser. 489, 279–295. doi: 10.3354/meps10426
Roch, M. A., Batchelor, H., Baumann-Pickering, S., Berchok, C. L., Cholewiak, D., Fujioka, E., et al. (2016). Management of acoustic metadata for bioacoustics. Ecol. Inform. 31, 122–136. doi: 10.1016/j.ecoinf.2015.12.002
Roemmich, D., Johnson, G., Riser, S., Davis, R., Gilson, J., Owens, W. B., et al. (2009). The argo program: observing the global oceans with profiling floats. Oceanography 22, 34–43. doi: 10.5670/oceanog.2009.36
Rudnick, D. L., Davis, R. E., Eriksen, C. C., Fratantoni, D. M., and Perry, M. J. (2004). Underwater gliders for ocean research. Mar. Technol. Soc. J. 38, 73–84. doi: 10.4031/002533204787522703
Schorr, G. S., Falcone, E. A., Moretti, D. J., and Andrews, R. D. (2014). First long-term behavioral records from Cuvier’s beaked whales (Ziphius cavirostris) reveal record-breaking dives. PLoS One 9:e92633. doi: 10.1371/journal.pone.0092633
Silva, T., Mooney, T., Sayigh, L., and Baumgartner, M. (2019). Temporal and spatial distributions of delphinid species in Massachusetts Bay (USA) using passive acoustics from ocean gliders. Mar. Ecol. Prog. Ser. 631, 1–17. doi: 10.3354/meps13180
Širović, A., Hildebrand, J. A., and Wiggins, S. M. (2007). Blue and fin whale call source levels and propagation range in the Southern Ocean. J. Acoust. Soc. Am. 122, 1208–1215. doi: 10.1121/1.2749452
Širović, A., Rice, A., Chou, E., Hildebrand, J. A., Wiggins, S. M., Roch, M. A., et al. (2015). Seven years of blue and fin whale call abundance in the Southern California Bight. Endanger. Species Res. 28, 61–76. doi: 10.3354/esr00676
Soldevilla, M. S., Henderson, E. E., Campbell, G. S., Wiggins, S. M., Hildebrand, J. A., and Roch, M. A. (2008). Classification of Risso’s and Pacific white-sided dolphins using spectral properties of echolocation clicks. J. Acoust. Soc. Am. 124, 609–624. doi: 10.1121/1.2932059
Stafford, K. M., Mellinger, D. K., Moore, S. E., and Fox, C. G. (2007). Seasonal variability and detection range modeling of baleen whale calls in the Gulf of Alaska, 1999–2002. J. Acoust. Soc. Am. 122, 3378–3390. doi: 10.1121/1.2799905
Stimpert, A. K., Deruiter, S. L., Southall, B. L., Moretti, D. J., Falcone, E. A., Goldbogen, J. A., et al. (2014). Acoustic and foraging behavior of a tagged Baird’s beaked whale (Berardius bairdii) exposed to simulated sonar. Sci. Rep. 4:7031. doi: 10.1038/srep07031
Thode, A. (2004). Tracking sperm whale (Physeter macrocephalus) dive profiles using a towed passive acoustic array. J. Acoust. Soc. Am. 116, 245–253. doi: 10.1121/1.1758972
Thomas, L., Harris, D. V., Klinck, H., Mellinger, D. K., and Barlow, J. (2019). A Framework for Cetacean Density Estimation Using Slow-Moving Autonomous Ocean Vehicles. Final Report, ONR Grant N00014-15-1–2142. https://apps.dtic.mil/sti/pdfs/AD1081620.pdf.
Thompson, P. O., and Friedl, W. A. (1982). A long term study of low frequency sounds from several species of whales off Oahu, Hawaii. Cetology 45, 1–19.
Tyack, P. L., Johnson, M., Aguilar de Soto, N., Sturlese, A., and Madsen, P. T. (2006). Extreme diving of beaked whales. J. Exp. Biol. 209, 4238–4253. doi: 10.1242/jeb.02505
Van Parijs, S., Clark, C., Sousa-Lima, R., Parks, S., Rankin, S., Risch, D., et al. (2009). Management and research applications of real-time and archival passive acoustic sensors over varying temporal and spatial scales. Mar. Ecol. Prog. Ser. 395, 21–36. doi: 10.3354/meps08123
Verfuss, U. K., Aniceto, A. S., Harris, D. V., Gillespie, D., Fielding, S., Jiménez, G., et al. (2019). A review of unmanned vehicles for the detection and monitoring of marine fauna. Mar. Pollut. Bull. 140, 17–29. doi: 10.1016/J.MARPOLBUL.2019.01.009
von Benda-Beckmann, A. M., Lam, F. P. A., Moretti, D. J., Fulkerson, K., Ainslie, M. A., van IJsselmuide, S. P., et al. (2010). Detection of Blainville’s beaked whales with towed arrays. Appl. Acoust. 71, 1027–1035. doi: 10.1016/j.apacoust.2010.05.015
Ward, J. A., Jarvis, S., Moretti, D. J., Morrissey, R. P., DiMarzio, N., Johnson, M. P., et al. (2011). Beaked whale (Mesoplodon densirostris) passive acoustic detection in increasing ambient noise. J. Acoust. Soc. Am. 129, 662–669. doi: 10.1121/1.3531844
Wiggins, S., Manley, J., Brager, E., and Woolhiser, B. (2010). “Monitoring marine mammal acoustics using Wave Glider,” OCEANS 2010 MTS/IEEE. Seattle, WA. doi: 10.1109/OCEANS.2010.5664537
Wiggins, S. M., and Hildebrand, J. A. (2007). “High-frequency acoustic recording package (HARP) for broad-band, long-term marine mammal monitoring,” in International Symposium on Underwater Technology 2007 and International Workshop on Scientific Use of Submarine Cables and Related Technologies 2007, (Tokyo: Institute of Electrical and Electronics Engineers), 551–557.
Wiggins, S. M., and Hildebrand, J. A. (2016). “Long-term monitoring of cetaceans using autonomous acoustic recording packages,” in Listening in the Ocean, eds W. W. L. Au and M. O. Lammers (New York, NY: Springer), 35–59. doi: 10.1007/978-1-4939-3176-7_3
Wiggins, S. M., Thayre, B. J., Trickey, J. S., Rice, A. C., Baumann-Pickering, S., Širović, A., et al. (2018). Summary of Five Years of Ambient and Anthropogenic Sound in the SOCAL Range Complex 2012 – 2017. Marine Physical Laboratory Technical Memorandum #625. La Jolla, CA: Scripps Institution of Oceanography.
Yack, T. M., Barlow, J., Calambokidis, J., Southall, B., and Coates, S. (2013). Passive acoustic monitoring using a towed hydrophone array results in identification of a previously unknown beaked whale habitat. J. Acoust. Soc. Am. 134, 2589–2595. doi: 10.1121/1.4816585
Zimmer, W. M. X., Harwood, J., Tyack, P. L., Johnson, M. P., and Madsen, P. T. (2008). Passive acoustic detection of deep-diving beaked whales. J. Acoust. Soc. Am. 124, 2823–2832. doi: 10.1121/1.2988277
Keywords: glider, deep-water float, mobile autonomous platform, passive acoustic monitoring, beaked whales, minke whales, delphinids
Citation: Fregosi S, Harris DV, Matsumoto H, Mellinger DK, Barlow J, Baumann-Pickering S and Klinck H (2020) Detections of Whale Vocalizations by Simultaneously Deployed Bottom-Moored and Deep-Water Mobile Autonomous Hydrophones. Front. Mar. Sci. 7:721. doi: 10.3389/fmars.2020.00721
Received: 12 May 2020; Accepted: 10 August 2020;
Published: 31 August 2020.
Edited by:
Eric Delory, Oceanic Platform of the Canary Islands, SpainReviewed by:
Kimberley Teresa Ann Davies, University of New Brunswick, CanadaChristoph Waldmann, University of Bremen, Germany
Copyright © 2020 Fregosi, Harris, Matsumoto, Mellinger, Barlow, Baumann-Pickering and Klinck. This is an open-access article distributed under the terms of the Creative Commons Attribution License (CC BY). The use, distribution or reproduction in other forums is permitted, provided the original author(s) and the copyright owner(s) are credited and that the original publication in this journal is cited, in accordance with accepted academic practice. No use, distribution or reproduction is permitted which does not comply with these terms.
*Correspondence: Selene Fregosi, selene.fregosi@gmail.com