
Abstract
Control of non-metallic inclusions is essential for the production of high-quality steel. This review summarizes processes that change inclusion compositions and concentrations during secondary steelmaking—slower changes are limited by reaction between bulk steel and slag or refractory, and faster changes involve direct additions to the steel bath. An example of the former is conversion of alumina inclusions to spinels during ladle treatment, while reoxidation and calcium treatment are typical exemplars of the fast changes. For the slower changes, inclusions approach equilibrium with the liquid steel and conceptually simple kinetic models correctly describe inclusion evolution during ladle treatment. Disequilibrium from faster changes persists for several minutes under typical ladle conditions, with small-scale inhomogeneity in the steel. Fast scanning electron microscopy with microanalysis has facilitated detailed study of these inclusion evolution processes by providing information on inclusion composition, size, and shape. Machine learning methods are likely to be increasingly important in analysis of the results. Such methods have already shown promise to improve classification of inclusions and recognizing inclusion clusters, from analyses of polished sections. Several unresolved issues that require future study are noted.
Introduction
The detrimental effects of inclusions on the processing and properties of steel have been well-documented. During processing, solid inclusions can cause clogs that impair flow of liquid steel.[1,2,3] In products, inclusions affect surface quality[4] and mechanical performance.[5,6] Specific effects on mechanical performance include lower toughness and ductility,[7,8] poorer machinability,[9] nucleation of fatigue cracks,[10] and stress corrosion cracking.[11] The severity of the effects depends on the inclusion concentration (number per unit volume), size, shape, and chemical composition.
There have been several reviews of the origin and characterization of inclusions in steel, including relatively recent ones by Cramb,[12] Zhang and Thomas,[13,14] Kaushik et al.,[15] Pretorius et al.,[3] O’Malley,[16] and da Costa e Silva.[17] In this paper, we focus on the time scales at which the chemical composition of micro-inclusions changes during ladle processing of liquid steel. Understanding of the relevant time scales aids in identifying the causes of observed changes and formulating effective plant practices for inclusion control. The three processes that affect inclusion compositions at different time scales are illustrated in Figure 1. The processes are (1) steel–slag reactions, (2) steel homogenization, and (3) steel-inclusion reactions. (This figure schematically shows an argon-stirred ladle, with a plume of spherical-cap bubbles opening an eye in the slag layer.)
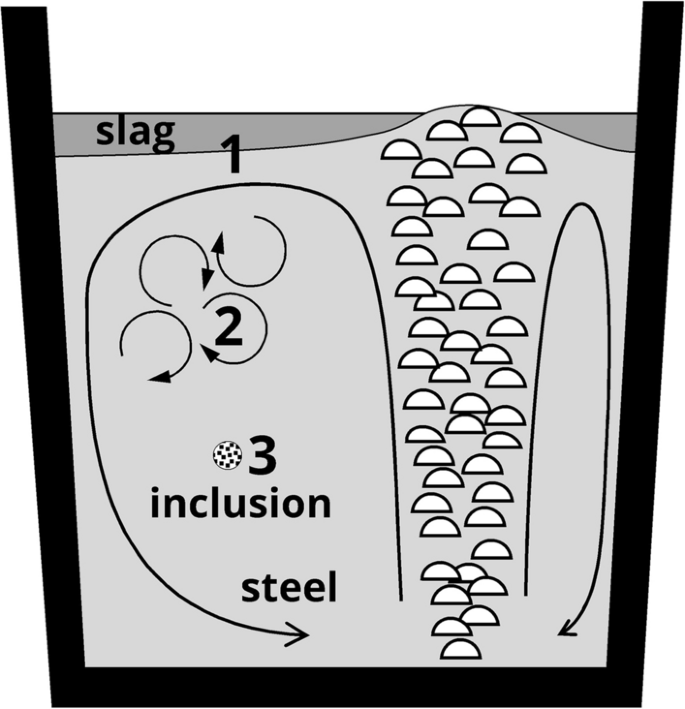
Schematic of the three main processes that affect inclusion composition in liquid steel, at different time scales: 1—steel–slag reaction (hundreds of seconds); 2—steel homogenization (tens of seconds); 3—steel-inclusion reactions (seconds)
The time constant for steel–slag reactions is given by \( H/m \), where \( m \) is the effective mass transfer coefficient for steel–slag reaction and \( H \) is the depth of steel in the ladle; the typical time constant is tens of minutes (hundreds of seconds). The homogenization time depends on the stirring rate (by argon bubbling for the example shown in Figure 1) and is typically a few minutes (tens of seconds).[18] Steel-inclusion reactions are rapid, because of the large mass transfer coefficient and large steel-inclusion contact area.[19]
These very different timescales for steel–slag and steel-inclusion reactions are illustrated in Figure 2, which shows the predicted change in inclusion composition during ladle processing (at 1873 K) of Al-killed steel that initially contained 0.05 wt pct Al and 0.002 wt pct O (total). For this case, the inclusion content would be 33 ppm by mass Al2O3. These Al2O3 inclusions would be converted to spinel (a (MgO)·(Al2O3) solid solution) by the transfer of Mg into the steel (Mg would form by reduction of MgO from the slag by Al in the steel).[20, 21] The reaction extent is expressed as the cationic molar fraction of Mg in the oxide inclusions (a ratio of 1/3 corresponds to the stoichiometric spinel MgAl2O4).
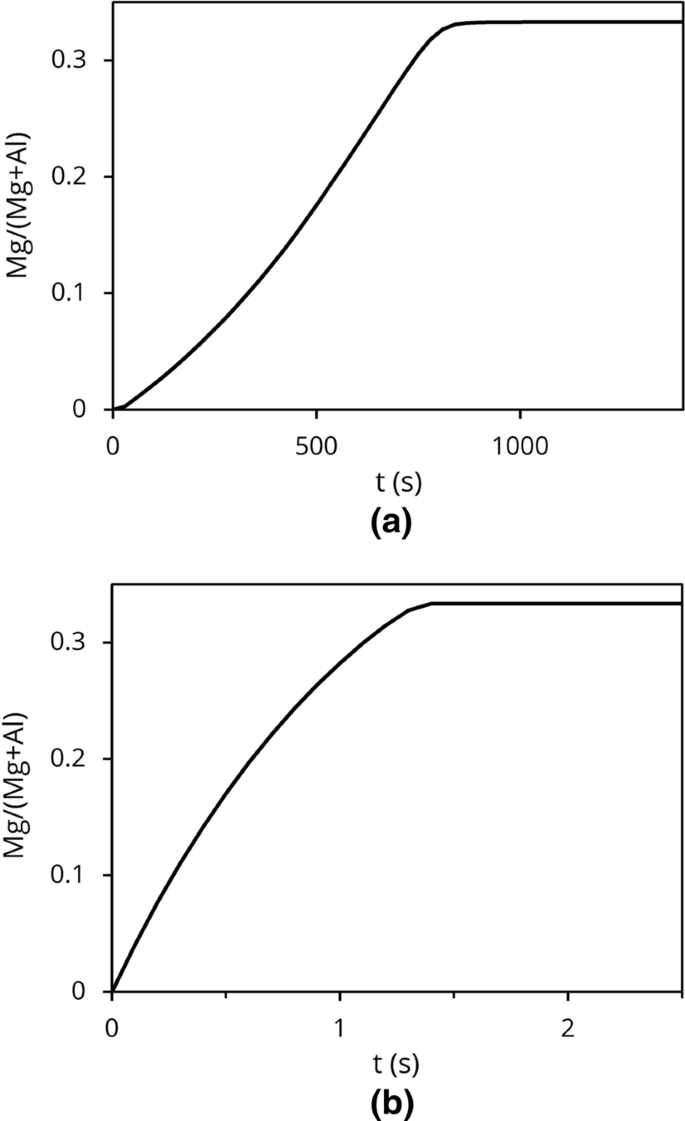
Calculated change over time of alumina inclusions to spinel inclusions, for rate control by (a) steel–slag reaction, and (b) steel-inclusion reaction (procedure described in Reference 19; details of conditions in text). Note the difference in x-axis scale
The reaction progress is shown for two different limiting reactions:
-
(a)
reaction with CaO-Al2O3-MgO slag (10 kg/ton steel; doubly-saturated with CaO and MgO; m = 0.0048 m/s and H = 2.7 m; corresponding to strong stirring for ladle desulfurization) with steel that initially contained no Mg
-
(b)
reaction of Al2O3 inclusions (assumed 2 µm in diameter) with steel that initially contained 13 ppm dissolved Mg (the equilibrium concentration for 0.05 pct Al steel in contact with the doubly-saturated slag).
Calculations were performed using FactSage 7.3,[22] using macros to link local equilibrium at the reaction interface with mass transfer in the steel (using the procedure as described before[19] and in Section II–B). Figure 2 demonstrates how much longer it would take for the steel–slag reaction to modify the inclusion composition (limited by the rate at which Mg—reduced from MgO in the slag by Al in the steel—would be transferred into the bulk of the steel). In contrast, if the steel already contained dissolved magnesium (Figure 2(b)), Al2O3 inclusions would be transformed to spinels within seconds.
In general, of the three potentially rate-limiting steps in Figure 1 only two practically affect inclusion reaction kinetics: steel–slag reactions (taking hundreds of seconds), and steel homogenization (taking tens of seconds). The latter step would be limiting if the steel composition were rapidly adjusted by additions made directly to the liquid steel (intentionally or unintentionally); typical examples are reoxidation of steel, and calcium treatment. In our work, no cases have been found for which mass transfer at or solid-state diffusion within the inclusion is limiting for micro-inclusions at steelmaking temperatures. The absence of control by solid-state diffusion does not imply that the inclusions would be single-phased; the stable phases change as the inclusions exchange elements with the liquid steel, for example changing from single-phased alumina to spinel + alumina, or—during incomplete calcium treatment—changing from single-phase spinel to a combination of spinel and liquid calcium aluminate. Limited measurements are available of diffusion of relevant species, but the measurements of Lind and Holappa[23] did indeed show that solid-state diffusion in calcium aluminates is not limiting during calcium modification.
These phenomena at different time scales are illustrated with several examples in this paper.
Slower Inclusion Changes
This section focuses on the thermodynamic and kinetic considerations associated with slower changes (taking 100s of seconds) to inclusion composition caused by steel–slag and steel–refractory reactions.
Thermodynamics of Steel–Slag–Refractory Reactions
The composition of inclusions in slag-covered steel tends to change over time because the inclusions are not in equilibrium with the slag. This results in a driving force for mass transfer between the slag and the steel that can result in, e.g., Al modification of Si-Mn inclusions[19,24,25] or the Mg modification of Al2O3 inclusions to spinels, as discussed below.
The activities in pure Al2O3 inclusions \( \left( {a_{{{\text{Al}}_{2} {\text{O}}_{3} }} = 1;\quad a_{\text{MgO}} = 0} \right) \) differ from those in ladle slag \( \left( {a_{{{\text{Al}}_{2} {\text{O}}_{3} }} = 0.0063;\quad a_{\text{MgO}} = 0.99} \right) \) for the doubly-saturated CaO-MgO-Al2O3 slag considered earlier). This activity difference is a driving force to transfer MgO from the slag to the inclusions, and Al2O3 from the inclusions to the slag. The overall reaction consists of two spatially separated reactions, written below as Eqs. [1] and [2]. At the steel–slag interface, [Al] (Al dissolved in steel) reduces MgO from the slag, with the resulting [Mg] dissolving in the steel:
The dissolved Mg is transported into the liquid steel (by fluid flow) and reacts with inclusions:
The overall reaction, Eq. [3], is the sum of Eqs. [1] and [2]:
Since the same species are present as products and reactants Eq. [3] (albeit in different phases), the standard Gibbs energy change of Eq. [3] is zero and the equilibrium constant is \( K = 1 \). That is, Eqs. [1] and [2] can continue until the ratios of the activities (raised to the stoichiometric coefficients) are equal in the slag and inclusions. This equilibrium state is given by Eq. [4]:
The dependence of activity on composition for binary Al2O3-MgO mixtures is shown in Figure 3(a) (pure solid MgO and Al2O3 reference states). Figure 3(b) compares the ratio of activities—in the form shown in Eq. [4]—with the activity ratio for the ladle slag. The figure shows that the reaction of Eq. [3] can continue until all Al2O3 has been removed from the oxide inclusions, leaving MgO as product. The expected stages in transformation of the inclusion composition are conversion of Al2O3 to spinel solid solution (as also illustrated by Figure 2), followed by conversion of spinel to MgO. Transformation of oxide inclusions beyond spinel to MgO has been confirmed in Al-killed steels with higher Al concentrations (> 0.25 wt pct).[26,27]

Effect of the cationic fraction of Mg on activities in solid MgO-Al2O3 mixtures at 1600 °C, calculated using FactSage: (a) Activities of MgO and Al2O3. (b) Ratio of activities, expressed as \( {{\left( {a_{\text{MgO}} } \right)^{3} } \mathord{\left/ {\vphantom {{\left( {a_{\text{MgO}} } \right)^{3} } {a_{{{\text{Al}}_{2} {\text{O}}_{3} }} }}} \right. \kern-0pt} {a_{{{\text{Al}}_{2} {\text{O}}_{3} }} }} \), compared with this activity ratio in the ladle slag. Stable phases are indicated with the labels “A” (Al2O3), “Spss” (spinel solid solution) and “M” (MgO)
Note in Eq. [3] that the liquid steel does not affect the slag-inclusion equilibrium. That is, in a steel–slag–inclusion system, equilibrium would be achieved if the activity of every slag species is equal to the activity of that species in the inclusion, whatever the steel composition. Of course, the concentrations of alloying elements in the steel would directly affect the concentrations of dissolved oxygen (and other minor elements) when equilibrium is reached, and the composition of the steel strongly affects the kinetics of slag–steel–inclusion reactions. The steel serves as the mass transfer medium, ferrying Mg and Al between the slag and inclusions (as expressed by Eqs. [1] and [2]). While the composition of the liquid steel does not affect the equilibrium state, it strongly affects the rate at which the equilibrium is approached: for higher-Al steel, the Mg concentration at the steel–slag reaction (set by Eq. [1]) would be higher. The higher Mg concentration at the steel–slag interface would transfer Mg more rapidly into the steel, causing faster transformation of the inclusions from Al2O3 to spinel to MgO.
The formation of spinel inclusions has been frequently observed in stainless steels and analyzed in the context of slag/steel reactions, see the review by Park and Todoroki.[28] Spinel formation has also been observed in non-stainless grades that are in contact with a well-deoxidized slag of high basicity, like those needed to promote desulfurization.[29] The thermodynamic considerations would be similar for reactions with refractory[30] and ladle glaze.[31] However, the kinetics will differ, and kinetic models are discussed in Section II–B.
Note also that reactions similar to Reactions [1] to [3] can be written for transfer of CaO from the slag into the inclusions, yet such CaO transfer is either not observed at all, or occurs to a much smaller extent than MgO transfer.[26,27] The reason for this difference is the much lower concentration of Ca in the liquid steel than that of Mg[32]—imposing a kinetic limitation on CaO transfer. Possible sources of Ca besides slag/metal reactions are discussed in Section V.
Kinetics of Steel–Slag–Refractory Reactions
There are numerous methods for simulation of the liquid phase mass transfer kinetics that lead to inclusion composition changes. The more recent models use two approaches: (1) solve systems of rate equations and equilibrium constant expressions,[33,34,35,36,37,38] or (2) use computational thermodynamics software such as FactSage to perform repeated equilibrium calculations.[19,21,39,40] All models rely on thermodynamic data that comes in the form of equilibrium constants and interaction coefficients from handbooks or as Gibbs energy models from FactSage databases. Modeling behavior of reactive species such as Ca and Mg are key features of these models since these species can modify inclusion composition.
As discussed in Section I, the rate-limiting step for modification of oxide inclusion composition by steel–slag-inclusion reactions is the steel–slag reaction; the inclusion composition is expected to equilibrate with (and so track) the resulting changes in steel composition. Similar considerations apply to reaction between liquid steel and refractory (with or without a coating of ladle glaze). The rate of the reactions is readily modeled using the effective equilibrium reaction zone (EERZ) model.[41,42] This approach requires a measured or estimated mass transfer coefficient in the liquid steel and in the slag, if mass transfer in the slag is potentially rate-limiting, along with a suitable multicomponent equilibrium calculator (such as FactSage) to find the compositions at the steel–slag (or steel–refractory) interface. In this approach, the mass transfer coefficient: the mass transfer coefficient is calibrated using the rate of reaction of one species (such as reduction of FeO from ladle slag[21]; desulphurization[43]; or Al pick-up by Si-killed steel from Al2O3-containing slag[19]).
The rate at which the inclusion composition changes depends directly on the mass transfer coefficient and the concentration of reaction products (dissolved in the liquid steel) at the steel–slag interface: these two factors control the rate at which elements enter the liquid steel, to react with inclusions. The rate of transfer of a dissolved element i into the steel is given by Eq. [5].
where \( m_{\text{steel}} \) is the steel mass transfer coefficient, \( A \) is the projected area of the steel–slag interface, \( \rho_{\text{steel}} \) is the density of liquid steel, \( \left[ {{\text{pct}}\,i} \right]_{\text{interface}} \) is the concentration (as a mass percentage) of the element at the steel–slag interface (set by the local steel–slag equilibrium), and \( \left[ {{\text{pct}}\,i} \right]_{\text{bulk}} \) its average concentration in the steel. The implementation of this model is schematically illustrated in Figure 4.

Schematic illustration of the model used to simulate steel/slag and steel/refractory reaction kinetics
In each time step, \( \Delta t \), there are three calculation steps:
-
(1)
Masses of steel and slag (proportional to the mass transfer coefficient, m) are sampled;
-
(2)
these masses are equilibrated;
-
(3)
the metallic products are equilibrated with the bulk steel composition and the non-metallic products are equilibrated with the bulk slag composition.
In this way the steel and slag compositions evolve with time. Oxide and sulfide phases (inclusions) in the steel change based on the steel composition, as a result of equilibration of the bulk steel (step 3). The rate of change of the inclusion composition is also affected by the total concentration (as a mass percentage) of inclusions in the steel. For a given rate of transfer of elements into the liquid steel, the rate of change of the inclusion composition is inversely proportional to the inclusion concentration: in cleaner steels (with a lower concentration of oxide inclusions), the inclusion composition would change more rapidly.
The implication is that the change in inclusion concentration needs to be considered when steel–slag-inclusion reactions are modeled. The same underlying process—flow of steel to the slag—is responsible for removal of micro-inclusions and for transfer of dissolved elements to and from the slag. For this reason, the rate constant for inclusion removal is approximately the same as for mass transfer of dissolved elements such as S.[44] Any large departure from this equality (of the mass transfer coefficients for micro-inclusion removal and steel–slag reactions) indicates a source (such as reoxidation) of new inclusions, or retardation of steel–slag reactions (for example, by solids in the slag). Reactions (such a reoxidation) that cause rapid changes in inclusion composition are discussed in Section III. Here, surmised effects of solids at the reaction interface are briefly considered.
It is well known that solids in slag can strongly retard steel–slag reactions. As an example, the extent of ladle desulfurization with calcium aluminate slags drastically decreases if the slags are supersaturated with calcium oxide.[45] One possible origin of the effect is that solids in the slag increase the slag viscosity, and so retard mass transfer in the slag. However, this explanation is incomplete, for the following reasons: First, desulfurization is normally controlled by mass transfer in the steel, so the slag mass transfer coefficient would need to decrease greatly to affect the observed rate. Second, the effect of solids is strong—decreasing the desulfurization extent by a factor of approximately two with only some 10 pct of solids in the slag. Assuming that the effect of solids on the apparent viscosity follows the Einstein–Roscoe relationship,[46] the increase in apparent viscosity would be around 40 pct (at 10 pct solids). Assuming further that diffusivity in the slag is inversely proportional to viscosity, and the mass transfer coefficient is proportional to the square root of the diffusivity,[47] the resulting decrease in the slag mass transfer coefficient would be approximately 20 pct. Although this is an approximate analysis, the result suggests the effect of solids on slag viscosity is not sufficient to explain the observed decrease in desulfurization rate, even if slag mass transfer were limiting in the case of fully liquid slag (which it is not).
Instead, a likely contributing factor is that solid oxides would collect in the slag at the slag–steel interface, so decreasing the effective reaction interface (A in Eq. [5]). Suppression of break-up of the steel–slag interface would further decrease the reaction rate. Solids would tend to collect at the steel–slag interface because the solid oxides are significantly denser than the liquid slag (Figure 5). This proposed effect is similar to what is observed in some sulfide smelters, where denser oxides that collect at the matte-slag interface stifle interaction between matte and slag.[48]

Such an effect of retarded steel–slag reactions, slowing down inclusion modification, was observed in plant trials on aluminum-killed steel: the retarded kinetics due to the presence of solids (evident in slow reduction of FeO from the ladle slag) largely avoided transformation of alumina inclusions to spinel. The effective mass transfer coefficient for chemical reactions between steel and slag was much smaller than expected from the rate of argon stirring, even though the rate of inclusion removal was as expected—evidence that solids in the slag can effectively retard transformation of inclusions.[21]
A related effect of slower reaction due to solids at the reaction interface was observed for reaction between aluminum-killed steel and MgO crucibles.[21] For this steel-crucible reaction, the overall reaction is the same as Eq. [3], with the difference that MgO (reactant) and Al2O3 (product) are present at the crucible-steel interface, instead of in slag. It was found that the rate of MgO transfer to inclusions was greatly increased by the presence of CaO and Al2O3 impurities in the crucible, forming a layer of liquid calcium aluminate slag at the steel-crucible interface. In the absence of the interlayer of slag, transformation of alumina inclusions to spinel was approximately an order of magnitude slower.
Inclusion Agglomeration and Removal to the Slag
One control strategy for non-metallic inclusions is to remove them to the slag phase. The density difference between inclusions and steel promotes flotation of inclusions up to the slag. The rate at which this occurs is characterized by Stokes’ velocity, the terminal velocity for a sphere subjected to gravitational and viscous forces. These velocities are too small for effective removal of small inclusions by flotation alone. Gas stirring can increase inclusion removal rates, with rates similar to those for the mass transfer of dissolved species,[44] as previously noted. The effective mass transfer coefficient increases with specific stirring power.
More detailed consideration of inclusion removal processes identify three stages for inclusion removal[49]:
-
(1)
transport to the slag/steel interface
-
(2)
separation across the slag/steel interface
-
(3)
dissolution in the slag
The inclusion transport behavior is influenced by clustering and agglomeration. The formation of inclusion clusters, particularly of Al2O3, has been frequently observed in samples taken from liquid steel soon after deoxidation.[50,51] Clustering on the surface of liquid steel or at slag/steel interfaces has been studied with in situ confocal laser scanning microscopy.[52,53,54,55] Possible physical mechanisms of cluster formation have been identified,[56,57,58] but more study is needed to clarify these mechanisms and examine effects of inclusion type on clustering.
The effect of fluid dynamics and collisions on clustering and inclusion size distributions has been analyzed.[59,60,61] Detailed models of inclusion flotation processes demonstrate the importance of collisions, turbulent fluid flow, and possibly attachment to argon bubbles.[62,63,64,65] Several studies have addressed the forces on an inclusion particle as it approaches the slag/metal interface and the hydrodynamic phenomena occurring there.[49,66,67,68,69]
The dissolution of inclusions in the slag is a critical final step, as rapid dissolution prevents re-entrainment, changes to slag viscosity, and prevents inclusions from serving as nucleation sites in mold slags where crystallization kinetics must be controlled.[70] As such, there have been numerous studies on the dissolution of inclusions in slags, most of which conclude dissolution is controlled by mass transfer in the slag.[70,71,72,73,74,75,76,77,78,79,80,81,82] A few mentions were made of possible surface reaction control for MgO dissolution,[72,73] but the recent re-analysis supported mass transfer control for dissolution of both Al2O3 and MgO.[83]
Although in most cases the slag is considered to absorb inclusions, there are times when it can be a source. During Ar stirring, especially intense stirring, the slag becomes emulsified in the steel.[84,85,86,87] The emulsification occurs when the velocity at the slag/metal interface exceeds a critical value. This can be beneficial for the rate of slag–steel reactions like desulfurization, but it also leads to entrained slag in the steel. According to these previously mentioned studies, sizes of entrained slag droplets are of sizes on the order of tens of μm to mm. However, recent work has identified smaller micron-sized slag inclusions in aluminum-killed steel during ladle treatment.[21]
The slower changes considered here have the common characteristic that modification of inclusion composition and concentration depends on bulk movement of steel and slag—transporting dissolved elements to and from the steel when it contacts slag and refractory, and moving inclusions to the slag or refractory for removal from the steel. The time scale of the resulting inclusion changes is determined by the steel circulation rate. In practical steel treatment, stirring (by Ar bubbling or electromagnetic stirring) directly affects the rate of change of inclusions. Control of solids in the slag is another important process variable. In contrast with these relatively slow changes, inclusions can form and change much faster if reactants are introduced directly into the steel. Examples of such rapid changes are considered in the next section.
Faster Inclusion Changes
This section focuses on faster (on the order of seconds) changes to inclusions due to nucleation and growth (deoxidation, reoxidation) and Ca treatment. The common theme is that the reactants are introduced directly into the steel, rather than being transferred from the slag.
Deoxidation and Reoxidation
The nucleation and growth of deoxidation inclusions occurs in less than a second once the steel is exposed to a deoxidizer.[59,60,61] This implies that the time needed to achieve deoxidation of an entire melt is determined by the time needed to homogenize the deoxidation addition throughout the steel volume.
Along with analyses of the nucleation and growth kinetics, there have been several studies on inclusion morphologies produced after deoxidation, particularly in Al-killed steel. A number of shapes have been observed, e.g., spheres, plates, polyhedral, dendrites, and clusters, depending in large part on the supersaturation of O and Al.[88,89,90] Large dendritic Al2O3 inclusions and large inclusion clusters will more rapidly float to the slag and be removed. In aluminum-killed steel, rapid removal of oxygen to a total oxygen content of around 100 ppm is typically observed shortly after deoxidation.[44] The remaining smaller inclusions can still continue to agglomerate as described in Section II–C. These inclusions can be modified by the slower slag/steel reactions described in Section 2. They can also be modified by intentional Ca addition, see Section III–B.
Any inclusion control efforts, such as calcium treatment, stirring and flotation, must be coupled with strategies to avoid reoxidation, which occurs when steel is exposed to sources of oxygen after refining but prior to casting. Automated inclusion analysis methods have enabled more detailed investigations of these changes. The remainder of this section reviews some of the more recent developments in quantifying the effect of reoxidation on inclusion composition and size distribution. Many previous studies have focused on the occurrence of reoxidation events, less so the impacts on inclusion populations. After a brief survey of reoxidation sources, some recent results will be reviewed on the formation of spinel inclusions on reoxidation, a chemical strategy for controlling reoxidation, and the effect of reoxidation in remelted grades due to slag/steel reactions.
Reoxidation is a concern during any ladle-to-tundish transfer and is especially prevalent when a ladle is tapped into an empty tundish during startup heats and after ladle exchanges.[91,92] Frequently mentioned sources of oxygen include: air exposure during gas stirring, slag components such as FeO, SiO2, and MnO, and refractories (both lining material and slag that has penetrated into the lining).[13,44] Additions such as ferroalloys[3] and chill scrap[93] can also reoxidize steel. It has also long been understood that inert gas injection in ladles can lead to open eyes, or areas where the gas bubbles break through the slag layer, exposing steel to air.[44,87,94,95] Formation of open eyes in the tundish has also been studied.[96] Samples taken from tundish open eyes have higher total oxygen levels and more inclusions.[97]
Detailed studies have been conducted on reoxidation of steel during transfer to and in the tundish. The behavior in the tundish is critical as it represents one of the last opportunities for inclusion control. The importance of tundish design and flow control has been discussed in a recent review.[98] The effect of gas stirring on reoxidation was investigated by Sasai and Mizukami[99] where on the laboratory scale they found gas stirring disrupted oxide films on the surface of liquid steel and caused more extensive reoxidation. The extent of air reoxidation (quantified by increase in total oxygen) through tundish cover powder and during teeming was also studied.[100] The authors used these results to predict the extent of air reoxidation in plant samples.[101]
Reoxidation also results in consumption of deoxidizer elements such as Al, Mn, and Si.[44,102] Most of the attempts to model reoxidation phenomena have focused on O uptake, e.g.[101] as previously mentioned. A similar strategy was applied to reoxidation in static casting,[103] but in this this study, Thermo-Calc was used to predict the formation of stoichiometric, solid oxide phases. More recently, the EERZ-type model approach was used to predict inclusion compositions in the tundish after reoxidation.[104]
The expansion of automated SEM methods for inclusion analysis has provided useful experimental data on the effects of reoxidation. An early use of the method showed that higher levels of FeO + MnO in the slag resulted in fewer spinel inclusions in Al-deoxidized steels. This can be explained by slag/metal reactions[105] (so this is an example of a reoxidation phenomenon that follows slower slag–steel kinetics discussed in the previous section). As discussed above it is now clear that dissolved Al reacts with slag components. Dissolved Al will preferentially reduce FeO and MnO compared to more stable components like MgO. The lower rate of MgO reduction lowers the rate of spinel formation due to slag/metal reaction.
In facilities where steel is desulfurized in the ladle, basic slags containing low FeO + MnO are required. In these cases, spinel inclusions are common after deoxidation. Spinel inclusions can be modified to liquid after Ca treatment and MgO in the inclusions increases the range of compositions that are considered acceptably modified by promoting liquid inclusions after calcium modification. During Ca treatment, it has been suggested that Ca displaces Mg from the spinels and the dissolved Mg level of the steel increases.[106,107] The higher Mg levels lead to reformation of spinels on reoxidation. Figure 6 shows results from industrial samples, where reoxidation occurred during initial filling of the tundish.[29]

(a) Modified inclusions at the end of ladle treatment and (b) formation of spinel inclusions due to reoxidation in the tundish, adapted from Reference 29
The reformation of spinel inclusions has also been predicted from thermodynamic calculations[107] and confirmed by laboratory experiments illustrating the formation of spinels under controlled reoxidation additions (enough Fe2O3 to add 100 ppm O to the melt) as shown in Figure 7.[108,109]

Laboratory-scale results showing inclusion formation after reoxidation for Ca-treated and non-Ca-treated heats. The new population just after reoxidation was Al2O3 without Ca treatment and spinel with Ca treatment, adapted from Reference 109. The melt was reoxidized by addition of Fe2O3
Recent studies on reoxidation have also identified a possible chemical strategy to control reoxidation. The presence of CaS has been shown to reduce the extent to which solid oxides reform after reoxidation in industrial samples.[3] This possibility can be illustrated with equilibrium calculations as shown in Figure 8. Ca addition beyond what is needed to modify the oxide inclusions leads to CaS formation which keeps that added Ca in the liquid steel (rather than it simply boiling off). The CaS serves as a reservoir of Ca that can absorb additional O upon reoxidation (by the Ca treatment reactions that are discussed in Section III–B, see Eq. 7).

FactSage calculation illustrating that excess Ca addition—leading to CaS formation—enabled liquid oxides to remain at higher total O contents (i.e., greater extent of reoxidation). The solid oxide region includes calcium aluminates, calcium magnesium aluminates, and spinels
The trends in these equilibrium calculations were supported by the industrial results noted above and also laboratory experiments with controlled reoxidation additions. Representative results are shown in Figure 9.[108,109]

Results of laboratory-scale experiments illustrating that spinel formation on reoxidation was suppressed by excess CaS (formed by Ca-treating a heat with 50 ppm S), adapted from Reference 109. The melt was reoxidized by addition of Fe2O3
These results suggest ladle inclusion populations could be designed to include excess CaS as a buffer against reoxidation downstream. Doing this requires precise control of several process variables, including steel S content, total O at Ca treatment, Ca addition, Ca yield, and extent of reoxidation after Ca treatment.
The discussion above has focused primarily on chemical changes occurring to inclusions. There are also changes to the size distribution that can be used to diagnose the occurrence of reoxidation events. This can be seen in changes to the population density function.[110,111] The PDF represents the size distribution histogram in a way that is independent of bin size. Since inclusion sizes are measured on a polished cross-section, only 2D data is available. The PDF can be generated with this data, or corrections can be applied to account for the 3D nature of the actual distribution.[112] These corrections must be carefully considered given the wide range of inclusion shapes that may exist in a sample.
The inclusion size distribution is determined by the following processes: nucleation, growth, coarsening, and collisions.[60,61] Immediately after deoxidation or reoxidation, nucleation, growth, and coarsening occur, producing a lognormal size distribution. Such a distribution has a parabolic curve on a plot of \( \ln \left( {\text{PDF}} \right) vs.\ln \left( d \right) \). When the size distribution is determined by collisions, a power law size distribution is expected which is represented by a line on a plot of \( \ln \left( {\text{PDF}} \right) vs.\ln \left( d \right) \).
Reoxidation events lead to nucleation and growth of new inclusions, with characteristic changes to the inclusion populations. In an industrial study,[110,111] the PDF was used to confirm the formation of Al2O3 inclusions on reoxidation due to an open eye at the stirring station. The PDF has been used by References 109 and 113 to confirm nucleation and growth of new inclusions due to reoxidation at the laboratory scale. An example of changes to the PDF caused by reoxidation is shown in Figure 10. There is a clear difference in PDF just after reoxidation due to the nucleation and growth of a new population of smaller inclusions. Changes in size distributions are therefore a tool that can be used to diagnose reoxidation events or the population of inclusions resulting from reoxidation.

Example of the change to PDF on reoxidation. The PDFs 5 min after deoxidation and 20 min after reoxidation are consistent with size distributions determined by collision and agglomeration, adapted from Reference 109 The PDF just after reoxidation is consistent with nucleation and growth of inclusions after reoxidation
The discussion above has described some of the changes reoxidation causes to inclusion composition and size distribution. Reoxidation can also occur during remelting processes that are employed during specialty steel production to control solidification structure and inclusions. The technologies were initially used to produce steels with lower sulfur content and better inclusion control than could be attained from conventional steelmaking (air melt) processes. However, advances in ladle metallurgy and focused efforts on inclusion control have greatly improved air melt steel cleanliness. Figure 11 shows results from a recent comparison of air melt, electroslag remelt (ESR), and vacuum arc remelt (VAR) steel.[114] The air melt material was the parent heat—ingots from this heat were processed by both ESR and VAR. VAR was very effective at removing oxides. ESR effectively reduced sulfide amounts, but the amount of oxide inclusions increased after ESR compared to the air melt parent.

Comparison of cleanliness (quantified by sulfide and oxide inclusion area fraction) for steel grades produced via air melt and remelt processes. These results were compiled from automated SEM/EDS analysis. The “Air Melt” material was the parent heat. Ingots from this parent heat were processed by both ESR and VAR. ESR effectively removed sulfides, but reoxidation was observed. Plot based on data from Reference 114
Issues with control of oxide inclusions during ESR processing have been recognized since initial development of the technology, leading to the adoption of protective gases and slag deoxidants.[115] However, some ESR processes are conducted with air above the slag layer, which can lead to oxidation of the electrode and dissolution of easily reducible iron oxides into the slag. Reoxidation occurs due to slag/metal reactions and new inclusions form in the liquid pool. High temperatures in the slag layer and liquid pool (approx. 2100 K)[116] promote this reoxidation. Higher currents have also been associated with lower cleanliness due to electrode oxidation and shorter slag/metal reaction time.[117]
Calcium Treatment
Ca treatment of Al-killed steels is performed to convert solid Al2O3 and spinel inclusions to liquid calcium aluminates (for better castability), and for control of sulfide shape. The reviews noted in Section I discuss many different aspects of Ca treatment. This section focuses on a proposed mechanism that can explain the time scale for calcium treatment. Ca is a highly reactive element, with very low solubility in liquid steel (as recently re-assessed[32]), and a boiling point that is lower than liquid steel temperature. These characteristics directly affect how the calcium reacts upon addition to the steel, and subsequently approaches equilibrium. Ca is added to liquid steel as elemental Ca, Ca-Si compound, CaC2, or Ca-bearing ferrosilicon.
The yield depends on the addition method, but typically about 20 pct of the Ca remains in the steel (but close to 100 pct for Ca-containing ferrosilicon[118]); the balance boils off as Ca vapor. The added Ca first reacts with dissolved elements to form calcium sulfide or calcium oxide.[119] These initial products subsequently react with alumina (or spinels) to form calcium aluminates. If the initial product is CaS, the subsequent reaction to form calcium aluminate can be written as follows:
In this reaction, the pointed parentheses indicate solid phases, while the round brackets around CaO indicate that it is dissolved in the liquid calcium aluminate, and the square brackets denote elements dissolved in liquid steel.
Although this formulation captures the overall changes, it is an incomplete description of the reaction steps. Recent examination of the oxide inclusion size changes following calcium treatment[120] has shown that existing Al2O3 and spinel inclusions are not just modified by calcium treatment, but are dissolved while a new population of calcium aluminates grow, as indicated by the large reduction in the average size of inclusions after Ca treatment (Figure 12).

Large difference in size between the spinel inclusions that are present before calcium treatment (upper image) and the calcium aluminates that formed after calcium addition (lower image, sample taken 3 min after calcium addition), adapted from Reference 120 (Secondary electron micrograph; inclusions revealed by deep-etching the steel matrix.)
The proposed reaction mechanism is that Al2O3 and spinel inclusions dissolve into the steel, and that dissolved Al, O, and Mg react with the Ca-bearing inclusions to form calcium aluminate (containing some MgO). The overall driving force for this mechanism is the lower activity of Al2O3 in the calcium aluminate than in pure Al2O3 or in spinel. For the case where the initial oxides are Al2O3 and the initial Ca-bearing inclusions are CaS, the reaction steps can be written (in part) as follows:
Reactions at the calcium sulfide inclusion:
In Eq. [7c], the Al2O3 product is shown in round brackets to emphasize that it is in the calcium aluminate oxide solution.
If the rates of these reactions were limited by diffusion in liquid steel, the reactions would go to completion in seconds or less (similar to the reaction between Al2O3 and dissolved Mg shown in Figure 2). However, reaction intermediates persist for several minutes after calcium addition,[119] indicating that mixing of the liquid steel (step 2 in Figure 1) is the limiting step. When a liquid steel sample is taken before the reaction is complete, the sample would contain inclusions with different non-equilibrium conditions, because the volume of the steel sample is much larger than smallest eddies in the liquid steel. (The Kolmogorov length scale—smallest eddy size—is given by \( \left[ {\nu^{3} /\varepsilon } \right]^{0.25} \), where \( \nu \) is the kinematic viscosity of liquid steel and \( \varepsilon \) is the turbulent dissipation rate; for a typical range of \( 0.002 \,{\text{m}}^{2} /{\text{s}}^{3} \, < \, \varepsilon \, < \, 0.06 \, {\text{m}}^{2} /{\text{s}}^{3} \) in a gas-stirred ladle,[121] this gives length scales of around 60 to 140 µm.)
The faster changes considered here have the common characteristic that changes to the inclusions occur when additions are made to the steel. Formation of inclusions upon deoxidation and reoxidation is rapid and the size, shape, and agglomeration behavior of the inclusions is critical to their removal to the slag. Engineering ladle inclusion populations to retain excess CaS may be a strategy to minimize harmful effects of reoxidation downstream. Upon Ca treatment, an entirely new population of inclusions is expected, rather than direct chemical reaction between added Ca and the deoxidation products. The observations in both this section and Section II were made possible by automated SEM/EDS analysis of inclusions, which is discussed in the next section.
Characterization Methods
Analytical Methods
Inclusion populations can be quantified by several methods.[122,123] An indirect measure of the amount the amount of inclusions is a total oxygen measurement, with clean steels having approximately 10 to 20 ppm total oxygen and lower values for fracture and fatigue-critical applications.[12] Other techniques are commonly used for acceptance testing of material and are standardized in ASTM E45 and E2142. These methods involve measurements of inclusion size, shape, and chemistry via optical microscopy or scanning electron microscopy with energy-dispersive X-ray spectroscopy (SEM/EDS), and the results are reduced to ratings. In components subject to fatigue loading, extreme value statistics has been used to estimate largest inclusion sizes[124,125] and ASTM E2283. The above methods are widely used and useful for ensuring steel quality. They also produce the averaged measurements that can be correlated to mechanical behavior. However, they do not provide information about the distribution of chemistry, shape, and size of inclusions.
The technology for measuring distributions of inclusion quantities is automated SEM/EDS. This method employs software that detects the location of inclusions on backscattered electron (BSE) images and measures their chemistry by EDS. The typical process is:
-
1.
Contrast and brightness are standardized by adjusting SEM image settings so that the brightness values of the steel matrix and a lower-density reference (typically metallic Al tape) are at standard values
-
2.
A low-magnification BSE image is taken of a chosen field of view
-
3.
Features on the image darker than a set brightness threshold value are identified. The threshold value is a user-defined input.
-
4.
For each detected feature, a higher-magnification BSE image is acquired for determining feature size and shape attributes (e.g., aspect ratio)
-
5.
Feature composition is measured via EDS
-
6.
Features are then classified based on measured composition. Quantification can be online or off-line by a set of composition rules
Another SEM-based method is manual analysis of much smaller numbers of inclusions that were exposed by dissolving the steel matrix around inclusions (deep-etching).[126] This method provides better imaging of the three-dimensional morphology of inclusions (rather than 2D sections), at a higher resolution (using secondary electron imaging), but with much more time needed to image one inclusion.
The main advantage of the automated SEM-based method is that hundreds of measurements of micro-inclusion section size (and shape) and chemical composition can be obtained in tens of minutes, when using a fast EDS detector. The method relies on detection of possible inclusions (“features”) based on their brightness in BSE images, followed by analysis of the detected features by EDS. The oxides and sulfides generally have lower BSE brightness than the steel matrix because of their lower average atomic number.[127] Figure 12 is an example of the brightness difference that can be obtained, clearly showing the presence of separate oxide and sulfide phases, both appearing darker than the steel matrix in the BSE image. (Note that the inclusion in Figure 13 appears to be an entrained slag droplet: it is much larger than the typical micron-sized oxide inclusions that are remnant deoxidation products or that form during calcium treatment.)

Example of the contrast obtained between oxide and sulfide phases and the steel matrix, for an inclusion observed by backscattered electron (BSE) imaging: (a) BSE image. (b) Line scan along the broken line in (a) Reference 150
Two main limitations of the automated SEM/EDS method are spatial resolution—the smallest quantifiable inclusion size is around 0.5 µm—and analysis accuracy. The analysis accuracy is affected by overlap of EDS peaks, and by differences in the extent to which characteristic X-rays with different energies are absorbed by the steel and inclusion phases. The latter effect is strongest when the electron interaction volume is similar in size to the depth of the inclusion and it can cause large errors when the inclusions contain elements with significantly different atomic numbers (such as Ca and Al, or Mn and Si). This error can be minimized by using a lower acceleration voltage.[127]
Use of 10 kV (rather than 20 kV) improves the BSE spatial resolution (since the depth of the interaction volume approximately scales with the accelerating voltage raise to the power 1.7) and gives more accurate EDX analyses. Compared with 20 kV, the EDX count rate is lower at 10 kV, requiring longer EDX acquisition. However, in many cases when analyzing clean steels, the rate-limiting step is finding the features (by BSE imaging), and EDX acquisition times of the order of one second per feature are often adequate. Reference [127] showed examples of estimating the required analysis time.
Some steel plants use automated inclusion analysis to analyze several steel samples from every heat, as part of the process to control and improve steel cleanliness.[3] However, the total time to obtain a set of inclusion analyses is too long to allow feedback control during production of the heat. The main limits to faster analysis are the time required for metallographic preparation of the steel sample, and—for relatively clean steels—finding the features by BSE imaging during automated analysis.
Data Analysis and Applications of Machine Learning
Visualization of inclusion compositions is frequently accomplished with Gibbs triangle ternary diagrams. The diagram axes are cation or anion mole fraction or mass fraction. An example plot is shown in Figure 14(a), where the composition of each inclusion is represented by a single data point. A proportional symbol plot, Figure 14(b), shows the same data but with the symbol size proportional to the number fraction of inclusions with the indicated composition.[128] Symbol size can also be proportional to area fraction. These plots give some information about the density of inclusions of a particular composition. The assumption is frequently made that there is little chemistry change during solidification, so the phases that comprise an inclusion in the liquid steel can be inferred from its composition by overlaying the ternary phase boundaries for the system at steelmaking temperatures, as shown in Figure 14(c).

Two representations of the same inclusion chemistry distribution—(a) each measured chemistry (cation fraction) plotted as one data point, (b) the same data with symbol size proportional to the number of inclusions with that chemistry, (c) the ternary phase diagram of the MgO-CaO-Al2O3 system at 1873 K (1600 °C), adapted from Reference 130
Representing inclusion chemistry by a ternary diagram provides an easily interpretable view of inclusion composition distribution. However, such diagrams are limited to only three composition variables. If a plot with Al-Mg-Ca axes is produced, Ca-containing oxides and sulfides cannot always be distinguished. Interpretation can sometimes be aided by joining multiple ternary diagrams with a common axis.[129] Since one or more diagrams are necessary to fully characterize a population, ternary diagrams are also not amenable to comparisons of many samples (e.g., looking at trends in behavior over many heats of steel or sequential samples). Trends are more often analyzed by simplifying inclusion populations into a few composition classes using user-defined classification rules.[93] This requires assumptions about the expected inclusion compositions and they must be consistently applied.
In addition to the challenges of visualizing and summarizing inclusion compositions, automated SEM/EDS produces much more data than composition, including multiple variables describing inclusion size and shape. The BSE images taken of each inclusion contain information about spatial variations in compositions, as well as size and shape information. The most commonly used outputs from automated SEM/EDS analyses are chemical composition data and size, with size typically quantified by equivalent circle diameter (the diameter of a circle with equal area to the actual inclusion).
Extracting a greater amount of useful information from automated SEM/EDS data can be accomplished with machine learning methods. These methods have become mainstream in recent years and there are many relatively user-friendly ways to implement them. In general, machine learning algorithms automate data analysis tasks such as classification, regression, anomaly detection, and clustering. They are efficient and can be used with data sets that are large in both number of variables and number of observations.
Studies that have applied machine learning methods to inclusion data have focused on clustering and classification tasks. Clustering is an unsupervised machine learning method, where groups of points are automatically identified (to be distinguished from physical clusters of inclusion particles). This has been applied to automate composition grouping.[130] Rather than user-defined rules based on EDS composition measurements, a clustering algorithm could automatically identify groups of oxide and sulfide inclusions. One advantage of this method is its flexibility—no input information is needed about the expected types of inclusions in a sample.
Another potential use of clustering algorithms is in the identification of physical clusters of inclusions. Inclusion clusters are generally the most harmful to the process and product, so a method to identify them is desirable. This has been attempted in one of the current authors’ groups.[131] Automated SEM/EDS scans were taken from steel sampled in a ladle and tundish. The x–y coordinates of the individual inclusions were clustered using the DBSCAN algorithm.[132] This algorithm attempts to automatically assign individual observations as part of a cluster or noise. No information about the number of possible clusters is needed.
This method was applied to inclusion analysis data from two steel samples, one from a ladle and one from a tundish (same heat). Seven large clusters of inclusions were identified in the ladle sample and zero clusters were identified in the tundish sample. These results are shown in Figure 15. DBSCAN identified 146 features as the cluster in Figure 15(c). The BSE SEM images clearly show the clusters are large and irregularly shaped groups of inclusions. Although there is still much more work needed to assess this approach, such methods could potentially be used for rapid, automatic identification of undesirable inclusion clusters in samples.

Automated identification of inclusion clusters in (a) a ladle sample and (b) a tundish sample. Seven clusters (in color) were identified in (a) and zero clusters were identified in (b). Gray points are inclusions not part of a cluster. A BSE-SEM image of a cluster is shown in (c), along with the number of individual features (identified by the automated analysis) that comprise the cluster (Color figure online)
Another machine learning method with potential application to inclusion analysis is classification. This is an example of a supervised machine learning task, where an algorithm identifies features that group inputs based on training data. Once trained, the algorithm can classify new observations. A recent study found inclusions could be classified as liquid or solid (at steelmaking temperatures) based on their aspect ratio, equivalent circle diameter, and average grayscale value with reasonable accuracy.[133] Further development of these methods will enable more detailed and more rapid evaluation of inclusion populations.
The widespread adoption of automated SEM/EDS analysis has enabled many advances in inclusion analysis. Although the method is well-established, consideration of the electron beam-sample interactions can help reveal sources of error and can help improve scan speeds. Machine learning methods are powerful data analysis tools that are just beginning to be applied to extract more information from inclusion data sets. Improved automated SEM/EDS measurements and data analysis methods will be necessary to address some of the unresolved issues presented in the next section.
Future Research Directions
This paper has reviewed mostly recent developments in efforts to characterize and model changes to non-metallic inclusions in steels. These changes can be distinguished by time scale. Many of the advances discussed here were enabled by automated SEM/EDS methods. Despite these recent advances, there are still a number of unresolved issues that will require more research in the future. Several of these are briefly mentioned in this section.
Detailed Flow Effects
Inclusion changes that result from the slower processes (such as steel–slag reactions) can be modeled without taking the detail of steel flow into account—a single mass transfer coefficient is a sufficiently accurate description. The faster processes require detailed flow modeling for full understanding, but it is not currently possible to model multiphase flow for a full-size ladle while also explicitly considering effects at the scale of microns. Such small-scale effects are clearly important, as indicated by the presence of micron-size entrapped slag droplets as a source of inclusions. Improved flow modeling is also needed to clarify the detail of reoxidation that occur even at low gas flow rates, possibly because of fluctuations in the size of the slag eye. A practically important target of such modeling is quantification of the limits of gentle gas stirring: As an example of an unexplained observation, very low gas flow rates (around 0.5 Ndm3/ton min) are needed for optimal inclusion removal, with slower removal of inclusions at higher gas flow rates[134]—not an effect that would be predicted if inclusion removal (rather than reoxidation) were the only limiting factor.
Uncertainties in Thermodynamic Models
In Section II–B the importance of thermodynamic calculations to kinetic models was noted. Accurate solution models are needed for these calculations and these are difficult to develop because of the challenging nature of high temperature equilibrium experiments. Even the thermodynamics of the Al-O system was subject to relatively recent reassessments,[135,136,137] with rather different behavior predicted at higher Al levels compared to prior modeling attempts. Accurate predictions at increasing Al levels are becoming more important as Al contents in steel increase. The scarcity of quality data for Ca and Mg has been noted[138] and the current FactSage models overpredict Ca solubility in steel.[32] Additional experimental data is particularly needed to ensure the accuracy of the solution models.
Other Sources of Reactants
An experimental challenge, particularly for industrial samples, is the possibility of other reactant sources beyond those considered in models. This may be particularly important for Ca. The partial modification of inclusions by Ca impurities in ferrosilicon has been documented.[3,139] The possibility of Ca as an impurity should be considered whenever comparing kinetic model calculations to experimental results. As noted earlier, another possible Ca source is small droplets of entrained slag.
Faster Inclusion Analysis
Automated SEM/EDS methods have provided a wealth of useful information to metallurgists. However, they are still too slow for online process control. Faster sample preparation and evaluation methods are needed. It seems likely that machine learning and computer vision methods could be useful in accelerating automated inclusion analysis methods.
Solidification and Heat Treatment
Inclusions in the final product have been subjected to liquid state processing, solidification, and heat treatment. Solidification can lead to a new population of inclusions. Most analyses have focused on sulfide inclusions,[140,141] with some changes to oxides also noted.[142] Recent work has also indicated that solid-state diffusion can lead to inclusion changes on heat treatment.[143,144] The extent of the changes and their potential impacts need to be further explored.
Inclusions in Other Processes
Metal additive manufacturing (AM) technologies are maturing to the point of large-scale, industrial production. Laser power bed fusion AM uses a laser to create a small molten pool that traces the part shape. The molten pool is small (approximately 100 μm wide) and cooling rates are on the order of 106 K/s, so solidification is rapid. There are numerous processing and property issues with AM processing and the presence and impact of non-metallic inclusions is just beginning to be examined.[145,146] One important question is the source of inclusions in AM-processed materials. It is well known that metal powders contain much higher O levels, but it is not yet clear if these lead to formation of endogenous inclusions, as in steels. A second important factor is spatter—ejection of molten material that oxidizes in the build chamber environment (e.g., Ar with some impurities, including O2, for laser powder bed fusion).[147] These oxides can fall back to the part surface and will be incorporated into the part when future layers are deposited. There is much more work needed to better understand inclusions during AM processes, especially given the variety of AM processes and process phenomena.
Conclusions
The combination of fast SEM-based inclusion characterization and rapid multiphase thermodynamic calculations has elucidated the underlying mechanisms by which the composition and concentration of inclusions change during secondary steelmaking. Part of the resulting understanding is that changes in inclusions result from processes that occur at quite different time scales: For slower reactions between steel and slag (and refractory), the inclusions approach equilibrium with the bulk steel. Faster reactions occur when intentional or unintentional additions are made directly to the steel, resulting in inhomogeneity in the steel and non-equilibrium inclusions. The slower reactions have been readily modeled by characterizing mass transfer with a single mass transfer coefficient, with local equilibrium at the reaction interfaces. Quantification of the faster reactions would require detailed small-scale flow modeling. These and other inclusion-related phenomena will continue to be explored with automated SEM/EDS analysis and increasingly sophisticated data analysis methods.
References
1 L.A. Frank: Iron Steelmak., 1999, vol. 26, pp. 33–9.
K. Ahlborg: in 84th Steelmaking Conference Proceedings, 2001, pp. 861–69.
E.B. Pretorius, H.G. Oltmann, and B.T. Schart: in AISTech 2013 Proceedings, 2013, pp. 993–1026.
S. Chakraborty and W. Hill: in 1994 Steelmaking Conference Proceedings, 1994, pp. 389–95.
S.V. Subramanian and D.A.. Kay: in Proceedings of the International Symposium on the Physical Chemistry of Iron and Steelmaking, 1982, pp. VII-30–VII-40.
A.L.V. Da Costa E Silva: J. Mater. Res. Technol., 2019, vol. 8(2), pp. 2408–22.
7 W.M. Garrison and A.L. Wojcieszynski: Mater. Sci. Eng. A, 2007, vol. 464, pp. 321–9.
8 W.M. Garrison and A.L. Wojcieszynski: Mater. Sci. Eng. A, 2009, vol. 505, pp. 52–61.
9 N. Ånmark, A. Karasev, and P. Jönsson: Materials (Basel)., 2015, vol. 8, pp. 751–83.
P.C. Glaws and M.E. Burnett: in Bearing Steel Technologies: 11th Volume, Advances in Steel Technologies for Rolling Bearings, ASTM International, 2017, pp. 502–18.
11 T. Hara, H. Asahi, and H. Ogawa: Corrosion, 2004, vol. 60, pp. 1113–21.
A.W. Cramb: in High Purity, Low Residual, and Clean Steels, C.L. Briant, ed., Marcel Dekker, New York, 1999, pp. 49–91.
13 L. Zhang and B.G. Thomas: ISIJ Int., 2003, vol. 43, pp. 271–91.
14 L. Zhang and B.G. Thomas: Metall. Mater. Trans. B, 2006, vol. 37, pp. 733–61.
15 P. Kaushik, M. Lowry, H. Yin, and H. Pielet: Ironmak. Steelmak., 2012, vol. 39, pp. 284–300.
R. O’Malley: in AISTech 2017 Proceedings, 2017, pp. 1567–85.
A.L.V. Da Costa E Silva: J. Mater. Res. Technol., 2018, vol. 7(3), pp. 283–99.
18 S.P. Patil, D. Satish, M. Peranandhanathan, and D. Mazumdar: ISIJ Int., 2010, vol. 50, pp. 1117–24.
19 S.P.T. Piva, D. Kumar, and P.C. Pistorius: Metall. Mater. Trans. B, 2017, vol. 48, pp. 37–45.
20 D. Kumar and P.C. Pistorius: Metall. Mater. Trans. B, 2019, vol. 50B, pp. 181–91.
20 D. Kumar and P.C. Pistorius: Metall. Mater. Trans. B, 2019, vol. 50, pp. 2163–74.
21 C.W. Bale, E. Bélisle, P. Chartrand, S.A. Decterov, G. Eriksson, A.E. Gheribi, K. Hack, I.-H. Jung, Y.-B. Kang, J. Melançon, A.D. Pelton, S. Petersen, C. Robelin, J. Sangster, P. Spencer, and M.-A. Van Ende: Calphad, 2016, vol. 54, pp. 35–53.
22 M. Lind and L. Holappa: Metall. Mater. Trans. B, 2010, vol. 41, pp. 359–66.
23 H. Suito and R. Inoue: ISIJ Int., 1996, vol. 36, pp. 528–36.
24 Y.-B. Kang and H.-G. Lee: ISIJ Int., 2004, vol. 44, pp. 1006–15.
25 H. Mu, T. Zhang, R.J. Fruehan, and B.A. Webler: Metall. Mater. Trans. B, 2018, vol. 49, pp. 1665–74.
C. Liu, X. Gao, S. Ueda, and S. Kitamura: ISIJ Int., 2018, vol. 59(2), pp. 268–76.
27 J.H. Park and H. Todoroki: ISIJ Int., 2010, vol. 50, pp. 1333–46.
E.B. Pretorius, H.G. Oltmann, and T. Cash: Iron Steel Technol., 2010, vol. 7(7), pp. 31–44.
29 V. Brabie: ISIJ Int., 1996, vol. 36, pp. S109–12.
30 K. Beskow and D. Sichen: Ironmak. Steelmak., 2004, vol. 31, pp. 393–400.
C. Liu, D. Kumar, B.A. Webler, and P.C. Pistorius: Metall. Mater. Trans. B 2020, 51, 529–42.
32 A. Harada, N. Maruoka, H. Shibata, and S. Kitamura: ISIJ Int., 2013, vol. 53, pp. 2110–7.
33 A. Harada, N. Maruoka, H. Shibata, and S. Kitamura: ISIJ Int., 2013, vol. 53, pp. 2118–25.
34 A. Harada, N. Maruoka, H. Shibata, M. Zeze, N. Asahara, F. Huang, and S. Kitamura: ISIJ Int., 2014, vol. 54, pp. 2569–77.
35 Y. Tabatabaei, K.S. Coley, G.A. Irons, and S. Sun: Metall. Mater. Trans. B, 2018, vol. 49, pp. 2022–37.
36 Y. Tabatabaei, K.S. Coley, G.A. Irons, and S. Sun: Metall. Mater. Trans. B, 2018, vol. 49, pp. 375–87.
37 Y. Tabatabaei, K.S. Coley, G.A. Irons, and S. Sun: Metall. Mater. Trans. B, 2018, vol. 49, pp. 2744–56.
39 J.H. Shin, Y. Chung, and J.H. Park: Metall. Mater. Trans. B, 2017, vol. 48, pp. 46–59.
40 Y. Ren, Y. Zhang, and L. Zhang: Ironmak. Steelmak., 2017, vol. 44, pp. 497–504.
41 R. Ding, B. Blanpain, P.T. Jones, and P. Wollants: Metall. Mater. Trans. B, 2000, vol. 31, pp. 197–206.
42 M.-A. van Ende, Y.-M. Kim, M.-K. Cho, J. Choi, and I.-H. Jung: Metall. Mater. Trans. B, 2011, vol. 42, pp. 477–89.
43 D. Roy, P.C. Pistorius, and R.J. Fruehan: Metall. Mater. Trans. B, 2013, vol. 44, pp. 1086–94.
44 K. Schwerdtfeger: Arch. für das Eisenhüttenwes., 1983, vol. 54, pp. 87–98.
45 N. Bannenberg, B. Bergmann, and H. Gaye: Steel Res., 1992, vol. 63, pp. 431–7.
46 Z. Liu, L. Pandelaers, B. Blanpain, and M. Guo: Metall. Mater. Trans. B, 2018, vol. 49, pp. 2469–86.
47 R. Higbie: Trans. Am. Inst. Chem. Eng., 1935, vol. 31, pp. 365–89.
48 S. Ritchie and J.J. Eksteen: Miner. Eng., 2011, vol. 24, pp. 661–75.
51 M. Valdez, G.S. Shannon, and S. Sridhar: ISIJ Int., 2006, vol. 46, pp. 450–7.
52 T.B. Braun, J.F. Elliott, and M.C. Flemings: Metall. Trans. B, 1979, vol. 10, pp. 171–84.
53 R. Dekkers, B. Blanpain, P. Wollants, F. Haers, C. Vercruyssen, and B. Gommers: Ironmak. Steelmak., 2002, vol. 29, pp. 437–44.
54 H. Yin, H. Shibata, T. Emi, and M. Suzuki: ISIJ Int., 1997, vol. 37, pp. 946–55.
55 H. Yin, H. Shibata, T. Emi, and M. Suzuki: ISIJ Int., 1997, vol. 37, pp. 936–45.
56 S. Kimura, K. Nakajima, and S. Mizoguchi: Metall. Mater. Trans. B, 2001, vol. 32, pp. 79–85.
57 J. Wikström, K. Nakajima, H. Shibata, A. Tilliander, and P. Jönsson: Mater. Sci. Eng. A, 2008, vol. 495, pp. 316–9.
H. Shibata, H. Yin, and T. Emi: Philos. Trans. R. Soc. London. Ser. A 1998, vol. 356, pp. 957–66.
59 T. Mizoguchi, Y. Ueshima, M. Sugiyama, and K. Mizukami: ISIJ Int., 2013, vol. 53, pp. 639–47.
60 K. Sasai: ISIJ Int., 2014, vol. 54, pp. 2780–9.
61 U. Lindborg and K. Torssell: Trans. AIME, 1968, vol. 242, pp. 94–102.
62 L. Zhang and W. Pluschkell: Ironmak. Steelmak., 2003, vol. 30, pp. 106–10.
63 J. Zhang and H.-G. Lee: ISIJ Int., 2004, vol. 44, pp. 1629–38.
Y. Miki, Y. Shimada, B.G. Thomas, and A. Denissov: Iron Steelmak., 1997, pp. 31–38.
65 Y. Miki and B.G. Thomas: Metall. Mater. Trans. B, 1999, vol. 30, pp. 639–54.
66 L. Zhang and S. Taniguchi: Int. Mater. Rev., 2000, vol. 45, pp. 59–82.
67 M. Söder, P. Jönsson, and L. Jonsson: steel Res. Int., 2004, vol. 75, pp. 128–38.
D. Bouris and G. Bergeles: Metall. Mater. Trans. B 1998, vol. 29, pp. 641–9.
69 J. Strandh, K. Nakajima, R. Eriksson, and P. Jönsson: ISIJ Int., 2005, vol. 45, pp. 1597–606.
70 G.N. Shannon and S. Sridhar: Scand. J. Metall., 2005, vol. 34, pp. 353–62.
71 G. Shannon, L. White, and S. Sridhar: Mater. Sci. Eng. A, 2008, vol. 495, pp. 310–5.
72 S.H. Lee, C. Tse, K.W. Yi, P. Misra, V. Chevrier, C. Orrling, S. Sridhar, and A.W. Cramb: J. Non. Cryst. Solids, 2001, vol. 282, pp. 41–8.
73 S. Sridhar and A.W. Cramb: Metall. Mater. Trans. B, 2000, vol. 31, pp. 406–10.
74 K.W. Yi, C. Tse, J.-H. Park, M. Valdez, A.W. Cramb, and S. Sridhar: Scand. J. Metall., 2003, vol. 32, pp. 177–84.
75 A.B. Fox, M.E. Valdez, J. Gisby, R.C. Atwood, P.D. Lee, and S. Sridhar: ISIJ Int., 2004, vol. 44, pp. 836–45.
76 B.J. Monaghan and L. Chen: J. Non. Cryst. Solids, 2004, vol. 347, pp. 254–61.
77 B.J. Monaghan, L. Chen, and J. Sorbe: Ironmak. Steelmak., 2005, vol. 32, pp. 258–64.
78 J. Liu, F. Verhaeghe, M. Guo, B. Blanpain, and P. Wollants: J. Am. Ceram. Soc., 2007, vol. 90, pp. 3818–24.
79 D. Wang, X. Li, H. Wang, Y. Mi, M. Jiang, and Y. Zhang: J. Non. Cryst. Solids, 2012, vol. 358, pp. 1196–201.
80 S. Michelic, J. Goriupp, S. Feichtinger, Y.-B. Kang, C. Bernhard, and J. Schenk: steel Res. Int., 2016, vol. 87, pp. 57–67.
81 J.S. Park and J.H. Park: Metall. Mater. Trans. B, 2016, vol. 47, pp. 3225–30.
82 K. Miao, A. Haas, M. Sharma, W. Mu, and N. Dogan: Metall. Mater. Trans. B, 2018, vol. 49, pp. 1612–23.
83 M. Sharma and N. Dogan: Metall. Mater. Trans. B, 2020, vol. 51, pp. 570–80.
84 Y. Park, Y. Cho, W. Cha, and Y. Kang: J. Am. Ceram. Soc., 2020, vol. 103, pp. 2210–24.
85 P. Yan, B.A. Webler, P.C. Pistorius, and R.J. Fruehan: Metall. Mater. Trans. B, 2015, vol. 46, pp. 2414–8.
86 T. Wei and F. Oeters: Steel Res., 1992, vol. 63, pp. 60–8.
87 H. Lachmund, Y. Xie, T. Buhles, and W. Pluschkell: steel Res. Int., 2003, vol. 74, pp. 77–85.
88 F. Fuhr, G. Torga, F. Medina, and C. Cicutti: Ironmak. Steelmak., 2007, vol. 34, pp. 463–70.
89 P. Valentin, C. Bruch, Y. Kyrylenko, H. Köchner, and C. Dannert: steel Res. Int., 2009, vol. 80, pp. 552–8.
90 R. Dekkers, B. Blanpain, and P. Wollants: Metall. Mater. Trans. B, 2003, vol. 34, pp. 161–71.
91 W. Tiekink, R. Boom, A. Overbosch, R. Kooter, and S. Sridhar: Ironmak. Steelmak., 2010, vol. 37, pp. 488–95.
92 M.A. van Ende, M. Guo, B. Blanpain, and P. Wollants: Front. Mater. Sci., 2011, vol. 5, pp. 69–76.
P. Lorenzino, C. Capurro, C. Cicutti, P. Lardizabal, G. Torga, and F. Fuhr: in Proceedings of the 17th IAS Steelmaking Conference, 2009, pp. 223–32.
94 P. Thomas: Mater. Sci. Technol., 2005, vol. 21, pp. 334–8.
S.R. Story, S.M. Smith, R.J. Fruehan, G.S. Casuccio, M.S. Potter, and T.L. Lersch: Iron Steel Technol., 2005, vol. 2(9), pp. 41–9.
97 P.E. Anagbo and J.K. Brimacombe: Metall. Trans. B, 1990, vol. 21, pp. 637–48.
98 M. Thunman, S. Eckert, O. Hennig, J. Björkvall, and D. Sichen: steel Res. Int., 2007, vol. 78, pp. 849–56.
S. Chatterjee, D. Li, and K. Chattopadhyay: Steel Res. Int., 2017, vol. 88, p. 1600436.
S. Chatterjee, D. Li, J. Leung, J. Sengupta, J. Young, and K. Chattopadhyay: in Proc. 9th Eur. Continuous Casting Conf., The Austrian Society for Metallurgy and Materials, Leoben, Austria, 2017, pp. 506–17.
101 Y. Sahai: Metall. Mater. Trans. B, 2016, vol. 47, pp. 2095–106.
102 K. Sasai and Y. Mizukami: ISIJ Int., 1996, vol. 36, pp. 388–94.
103 K. Sasai and Y. Mizukami: ISIJ Int., 1998, vol. 38, pp. 332–8.
104 K. Sasai and Y. Mizukami: ISIJ Int., 2000, vol. 40, pp. 40–7.
105 B. Coletti, B. Gommers, C. Vercruyssen, B. Blanpain, P. Wollants, and F. Haers: Ironmak. Steelmak., 2003, vol. 30, pp. 101–5.
L. Wang and C. Beckermann: Metall. Mater. Trans. B, 2006, vol. 37B, pp. 571–88.
107 Y. Ren, L. Zhang, H. Ling, Y. Wang, D. Pan, Q. Ren, and X. Wang: Metall. Mater. Trans. B, 2017, vol. 48, pp. 1433–8.
K.C. Ahlborg: in Proc. the Fifth Int. Conf. Clean Steel, 1997, pp. 151–56.
109 Z. Deng and M. Zhu: ISIJ Int., 2013, vol. 53, pp. 450–8.
110 N. Verma, P.C. Pistorius, R.J. Fruehan, M.S. Potter, H.G. Oltmann, and E.B. Pretorius: Metall. Mater. Trans. B, 2012, vol. 43, pp. 830–40.
111 J. Tan and B.A. Webler: AIST Trans., 2017, vol. 14, pp. 172–80.
J. Tan: Inclusion Changes During Reoxidation. PhD thesis, Carnegie Mellon University, 2017.
113 E. Zinngrebe, C. Van Hoek, H. Visser, A. Westendorp, and I.-H. Jung: ISIJ Int., 2012, vol. 52, pp. 52–61.
114 M.-A. Van Ende, M. Guo, E. Zinngrebe, B. Blanpain, and I.-H. Jung: ISIJ Int., 2013, vol. 53, pp. 1974–82.
115 M.D. Higgins: Am. Mineral., 2000, vol. 85, pp. 1105–16.
O. Adaba, P. Kaushik, R. O’Malley, S.N. Lekakh, V.L. Richards, E. Mantel, R. Hall, and E.J. Ellis: in AISTech 2016 Proceedings, 2016, pp. 2259–572.
P. Glaws and R.S. Hyde: in Bearing Steel Technologies: 10th Volume, Advances in Steel Technologies for Rolling Bearings, ASTM International, 2014, pp. 1–13.
118 W. Holzgruber: BHM Berg- und Hüttenmännische Monatshefte, 2016, vol. 161, pp. 2–11.
119 L.Z. Chang, X.F. Shi, and J.Q. Cong: Ironmak. Steelmak., 2014, vol. 41, pp. 182–6.
120 Y. Liu, Z. Zhang, G. Li, Q. Wang, and B. Li: High Temp. Mater. Process., 2019, vol. 38, pp. 207–18.
E.B. Pretorius, United States Patent 7,785,393 B2: 2010.
122 N. Verma, P.C. Pistorius, R.J. Fruehan, M. Potter, M. Lind, and S.R. Story: Metall. Mater. Trans. B, 2011, vol. 42, pp. 720–9.
M.E. Ferreira: Inclusions Size Distributions After Calcium Treatment In Low Carbon Aluminum Killed Steels. PhD thesis, Carnegie Mellon University, 2018.
124 D. Mazumdar and R.I.L. Guthrie: Metall. Trans. B, 1985, vol. 16, pp. 83–90.
125 H.V. Atkinson and G. Shi: Prog. Mater. Sci., 2003, vol. 48, pp. 457–520.
P. Kaushik, J. Lehmann, and M. Nadif: Metall. Mater. Trans. B, 2012, vol. 43, pp. 710–25.
Y. Murakami: J. Res. Natl. Inst. Stand. Technol., 1994, vol. 99, pp. 345–51.
128 G. Shi, H.V. Atkinson, C.M. Sellars, and C.W. Anderson: Acta Mater., 1999, vol. 47, pp. 1455–68.
Y. Wang, A. Karasev, and P.G. Jönsson: Steel Res. Int. 2020, p. 1900669.
130 D. Tang, M.E. Ferreira, and P.C. Pistorius: Microsc. Microanal., 2017, vol. 23, pp. 1082–90.
132 N. Verma, P.C. Pistorius, R.J. Fruehan, M. Potter, M. Lind, and S.R. Story: Metall. Mater. Trans. B, 2011, vol. 42, pp. 711–9.
M. Harris, O. Adaba, S. Lekakh, R. O’Malley, and V.L. Richards: in AISTech 2015 Proceedings, 2015, pp. 3315–25.
135 M. Abdulsalam, T. Zhang, J. Tan, and B.A. Webler: Metall. Mater. Trans. B, 2018, vol. 49, pp. 1568–79.
M. Abdulsalam: Unpublished research, Carnegie Mellon University, 2020.
137 E. Schubert, J. Sander, M. Ester, H.P. Kriegel, and X. Xu: ACM Trans. Database Syst., 2017, vol. 42(3), pp. 1–21.
138 T. Alatarvas, T. Vuolio, E.-P. Heikkinen, Q. Shu, and T. Fabritius: steel Res. Int., 2020, vol. 91, p. 1900424.
139 M. Neifer, S. Rodl, N. Bannenberg, and H. Lachmund: Stahl und Eisen, 1997, vol. 115, pp. 55–63.
140 Y. Kang, M. Thunman, D. Sichen, T. Morohoshi, K. Mizukami, and K. Morita: ISIJ Int., 2009, vol. 49, pp. 1483–9.
141 M.-K. Paek, J.-M. Jang, Y.-B. Kang, and J.-J. Pak: Metall. Mater. Trans. B, 2015, vol. 46, pp. 1826–36.
142 M.K. Paek, J.J. Pak, and Y.B. Kang: Metall. Mater. Trans. B, 2015, vol. 46, pp. 2224–33.
A. Costa: Rev. Métallurgie, 2008, vol. 105, pp. 181–93.
S.R. Story, G.E. Goldsmith, G. Works, R.J. Fruehan, G.S. Casuccio, M.S. Potter, and D.M. Williams: in AISTech 2006 Proceedings, vol. 1, 2006, pp. 879–89.
145 M. Wintz, M. Bobadilla, J. Lehmann, and H. Gaye: ISIJ Int., 1995, vol. 35, pp. 715–22.
146 D. You, S.K. Michelic, C. Bernhard, D. Loder, and G. Wieser: ISIJ Int., 2016, vol. 56, pp. 1770–8.
147 W. Yang, C. Guo, C. Li, and L. Zhang: Metall. Mater. Trans. B, 2017, vol. 48, pp. 2267–73.
148 Y. Ren, L. Zhang, and P.C. Pistorius: Metall. Mater. Trans. B, 2017, vol. 48, pp. 2281–92.
149 Y. Chu, W. Li, Y. Ren, and L. Zhang: Metall. Mater. Trans. B, 2019, vol. 50, pp. 2047–62.
150 D.-R. Eo, S.-H. Park, and J.-W. Cho: Mater. Des., 2018, vol. 155, pp. 212–9.
151 M. Tang and P.C. Pistorius: Int. J. Fatigue, 2017, vol. 94, pp. 192–201.
152 H. Amano, Y. Yamaguchi, T. Sasaki, T. Sato, T. Ishimoto, and T. Nakano: J. Smart Process., 2019, vol. 8, pp. 102–5.
49 J. Xin, L. Gan, L. Jiao, and C. Lai: ISIJ Int., 2017, vol. 57, pp. 1340–9.
50 G. Fiquet, P. Richet, and G. Montagnac: Phys. Chem. Miner., 1999, vol. 27, pp. 103–11.
D. Tang and F. Fatollahi-Fard: Unpublished research, Carnegie Mellon University, 2016.
Acknowledgments
The authors gratefully acknowledge the students and researchers of the Center for Iron and Steelmaking Research, as well as technical and financial support from its industrial members. The authors also acknowledge use of the Materials Characterization Facility at Carnegie Mellon University supported by Grant MCF-677785.
Author information
Authors and Affiliations
Corresponding author
Additional information
Publisher's Note
Springer Nature remains neutral with regard to jurisdictional claims in published maps and institutional affiliations.
Manuscript submitted May 01, 2020.
Rights and permissions
About this article

Cite this article
Webler, B.A., Pistorius, P.C. A Review of Steel Processing Considerations for Oxide Cleanliness. Metall Mater Trans B 51, 2437–2452 (2020). https://doi.org/10.1007/s11663-020-01949-y
Received:
Accepted:
Published:
Issue Date:
DOI: https://doi.org/10.1007/s11663-020-01949-y