Calibrating Environmental DNA Metabarcoding to Conventional Surveys for Measuring Fish Species Richness
 Mary E. McElroy1
  Terra L. Dressler2
  Georgia C. Titcomb2 Emily A. Wilson3
  Kristy Deiner4 Tom L. Dudley5
  Erika J. Eliason2
  Nathan T. Evans6 Steven D. Gaines7
  Kevin D. Lafferty5,8
  Gary A. Lamberti9
  Yiyuan Li10 David M. Lodge11 Milton S. Love5
  Andrew R. Mahon12 Michael E. Pfrender9
  Mark A. Renshaw13 Kimberly A. Selkoe14
  Christopher L. Jerde5*
- 1Interdepartmental Graduate Program in Marine Science, University of California, Santa Barbara, Santa Barbara, CA, United States
- 2Department of Ecology, Evolution, and Marine Biology, University of California, Santa Barbara, Santa Barbara, CA, United States
- 3Biology Department, Bakersfield College, Bakersfield, CA, United States
- 4Institute of Biogeochemistry and Pollutant Dynamics, ETH Zürich, Zurich, Switzerland
- 5Marine Science Institute, University of California, Santa Barbara, Santa Barbara, CA, United States
- 6U.S. Fish and Wildlife Service, Carterville Fish and Wildlife Conservation Office, Wilmington, IL, United States
- 7Bren School of Environmental Science and Management, University of California, Santa Barbara, Santa Barbara, CA, United States
- 8Western Ecological Research Center, United States Geological Survey at Marine Science Institute, University of California, Santa Barbara, Santa Barbara, CA, United States
- 9Department of Biological Sciences, University of Notre Dame, Notre Dame, IN, United States
- 10Department of Integrative Biology, The University of Texas at Austin, Austin, TX, United States
- 11Department of Ecology and Evolutionary Biology, Cornell Atkinson Center for a Sustainable Future, Cornell University, Ithaca, NY, United States
- 12Department of Biology, Central Michigan University, Mount Pleasant, MI, United States
- 13Oceanic Institute, Hawai’i Pacific University, Waimanalo, HI, United States
- 14National Center for Ecological Analysis and Synthesis, University of California, Santa Barbara, Santa Barbara, CA, United States
The ability to properly identify species present in a landscape is foundational to ecology and essential for natural resource management and conservation. However, many species are often unaccounted for due to ineffective direct capture and visual surveys, especially in aquatic environments. Environmental DNA metabarcoding is an approach that overcomes low detection probabilities and should consequently enhance estimates of biodiversity and its proxy, species richness. Here, we synthesize 37 studies in natural aquatic systems to compare species richness estimates for bony fish between eDNA metabarcoding and conventional methods, such as nets, visual census, and electrofishing. In freshwater systems with fewer than 100 species, we found eDNA metabarcoding detected more species than conventional methods. Using multiple genetic markers further increased species richness estimates with eDNA metabarcoding. For more diverse freshwater systems and across marine systems, eDNA metabarcoding reported similar values of species richness to conventional methods; however, more studies are needed in these environments to better evaluate relative performance. In systems with greater biodiversity, eDNA metabarcoding will require more populated reference databases, increased sampling effort, and multi-marker assays to ensure robust species richness estimates to further validate the approach. eDNA metabarcoding is reliable and provides a path for broader biodiversity assessments that can outperform conventional methods for estimating species richness.
Introduction
High-throughput sequencing (HTS) of macro-organismal DNA from environmental samples is an innovative conservation approach to detect and measure ecological communities (Thomsen and Willerslev, 2015; Deiner et al., 2017). This technique, hereafter referred to as environmental DNA (eDNA) metabarcoding, enhances conventional biodiversity monitoring because it targets a presumably more widespread particle (DNA) than the species itself (Lacoursière-Roussel and Deiner, 2019), which aids in the detection of rare and elusive species (Jerde, 2019). eDNA metabarcoding for macro-organism detection works in various substrates, including freshwater (Olds et al., 2016), seawater (Thomsen et al., 2012), soil (Epp et al., 2012), sediment (Guardiola et al., 2015), and even air and snow (Kraaijeveld et al., 2015; Kinoshita et al., 2019). Similarly, these methods have been used to characterize taxa from across the eukaryotic tree of life – including mammals (Foote et al., 2012; Ushio et al., 2017), amphibians (Lopes et al., 2017; Bálint et al., 2018), bony fishes (Yamamoto et al., 2017), elasmobranchs (Bakker et al., 2017; Boussarie et al., 2018), plants (Yoccoz et al., 2012), and macro-invertebrates (McGee and Eaton, 2015; Lacoursière-Roussel et al., 2018). This broad applicability across taxa and environments makes eDNA metabarcoding a potentially revolutionary biodiversity monitoring tool, but only if it provides reliable, accurate, and efficient assessments of communities on par with, or better than, conventional methods of species detection.
Numerous studies have now compared conventional species detection to that inferred from eDNA metabarcoding. This has provided valuable insight into the relative performance of eDNA metabarcoding covering limited spatial extents or taxonomic diversity (Deiner et al., 2017; Jerde et al., 2019). Agreement between how many and which species are detected has ranged from nearly identical (Olds et al., 2016) to very disparate (Cilleros et al., 2019). However, we currently lack a broad understanding of how eDNA metabarcoding calibrates to conventional surveys across diverse systems and taxa, particularly given differences in organisms’ DNA shedding rates, degradation of DNA in variable environments, and fluctuation in eDNA transport (Barnes and Turner, 2016). Beyond appreciating the logistical and financial advantages over conventional methods (Evans et al., 2017b), we must also quantitatively evaluate how eDNA performs as a measure of species richness (Jerde et al., 2019). The need for enhanced biodiversity surveillance for conservation and management has never been more acute. On land and in the oceans, ecological communities are undergoing rapid compositional and geographic shifts (Pecl et al., 2017; Blowes et al., 2019) and are confronted with numerous threats (Tilman et al., 2017; Halpern et al., 2019; Reid et al., 2019), so it is critical that we better understand if eDNA metabarcoding could facilitate broad biodiversity assessment.
Because of the vast methodological differences and limited taxonomic coverage of published studies comparing eDNA metabarcoding to conventional surveys, a global meta-analysis remains difficult. However, bony fishes have been an early and popular focus of eDNA-based approaches (Jerde et al., 2011), and eDNA metabarcoding has been used to measure fish diversity across a broad range of environmental conditions and species richness values (Jerde et al., 2019). One requirement of eDNA metabarcoding is establishing comprehensive genetic reference libraries, consisting of genetic sequences sourced from reliably identified species, to compare with metabarcoding outputs (sequence reads). Several eDNA metabarcoding studies of bony fishes have used multiple gene markers (e.g., CO1, 12S, 16S) from different mitochondrial loci to increase taxonomic coverage (Olds et al., 2016; Evans et al., 2017a). This provides an opportunity to evaluate the impact of multi-marker methods, which should improve measures of species richness with eDNA metabarcoding.
Here, we synthesize peer-reviewed studies that used eDNA metabarcoding and conventional surveys to measure fish species richness and characterize fish community composition in natural aquatic systems. We test the agreement between the methods to evaluate how eDNA metabarcoding performs relative to conventional surveys as a measure of species richness. We also examine method complementarity by linking fish species identities to the method of detection (eDNA or conventional). Finally, we assess how complementarity in species detection differ across diverse aquatic systems and between single and multi-marker eDNA metabarcoding studies.
Materials and Methods
We conducted a literature search following systematic review practices (Moher et al., 2015). Using Google Scholar1 and Web of Science2, we queried peer-reviewed articles published between 1 January 2008 and 1 April 2020 with the key terms “environmental DNA,” “metabarcoding,” and “fish.” Records from the search results were screened and selected for analysis if the study (1) sampled eDNA from water in natural aquatic systems, (2) used an eDNA metabarcoding approach, (3) measured fish species richness with eDNA and (4) compared eDNA-based species richness to species richness measured by conventional fish surveys in the same study area.
For each article retained, we extracted data on study context and methodology as reported or referenced in the main article and Supplementary Material. When necessary, authors were contacted to provide additional details. We identified comparative observations of fish species richness from eDNA metabarcoding and conventional surveys for independent study sites. Some articles contained multiple independent sites for species richness evaluation whereas others focused on a single study site. We used the same hydrological units defined in the primary studies to compare fish species richness observations between eDNA and conventional methods. However, to maintain consistency among lentic and lotic systems, we aggregated comparative observations from three studies to single observations of species richness at the river, canal, and lake level (Pont et al., 2018; McDevitt et al., 2019; Doble et al., 2020).
We used Lin’s concordance correlation coefficient (CCC) (Lawrence and Lin, 1989) and Bland-Altman analyses to evaluate how well species richness measured by eDNA metabarcoding agreed with conventional surveys (Bland and Altman, 1986). Both approaches are widely used in medicine and engineering to validate new assays and instrumentation against an accepted method. We implemented them here to evaluate performance of eDNA metabarcoding for measuring species richness relative to conventional surveys. In general, CCC values provide a measure of agreement in the species richness estimates whereas Bland-Altman analyses show directionality in performance (i.e., is eDNA metabarcoding detecting more or fewer species than conventional methods?). We assessed overall agreement, as well as context-specific agreement to identify differences in relative performance based on system (freshwater and marine) and metabarcoding approach (single and multi-marker). CCC values were considered significant if 95% confidence intervals (CI) did not capture zero. Bland-Altman analyses allowed us to evaluate differences in species richness estimates as function of increasing site-level diversity. Differences were considered significant if the 95% CI around group means did not overlap with zero. Observations were considered outliers if they fell beyond the 95% CI around two standard deviations from the mean. We evaluated subsets of the data by comparing freshwater versus marine systems and single- versus multi-marker observations. Because freshwater systems were well represented, we also analyzed subsets of lentic and lotic systems (Supplementary File S1). All analyses were performed in R (R Core Team, 2020) using agRee (Feng, 2020) and blandr (Datta, 2018) packages.
To examine the extent of species-identity overlap between detection methods, we collated species lists for each study site and recorded the survey method (eDNA, conventional, or both) by which each species was detected. We note in the Supplementary Material when authors reported detections to the genus or family level, but we did not include these taxa in the analyses (Supplementary File S2). Although false-positive detections (misidentified DNA sequences to species presumably not present in the system or detections emerging from likely contamination) would incorrectly indicate eDNA performed better as a richness indicator, we assumed authors minimized such errors relative to total species richness at each site. We calculated total observed species richness at each site as the sum of fish species detected by (1) eDNA only, (2) conventional survey only, and (3) both methods, then determined the proportions of each mechanism of detection. Finally, we assessed the proportions of shared and method-specific detections between marine and freshwater systems and between single- and multi-marker eDNA metabarcoding.
For all analyses, we included species richness data from conventional surveys conducted alongside eDNA sampling, as well as data from many years of routine or historical conventional fish monitoring. When authors provided data from both historical monitoring and contemporary surveys for the same study site, we used species richness calculated from aggregated contemporary and historical data. Our intent was to capture the most complete picture of fish diversity possible through conventional methods to compare with eDNA metabarcoding. However, this could also provide an unfair measure of comparison due to substantially disproportionate effort between approaches and changes in community richness or species presence through time. As such, we provide additional analyses of observations when eDNA sampling and conventional surveys were conducted concurrently (Supplementary File S3). Although we collected data on the types of conventional methods and gene markers used in each study (Supplementary File S4), our analyses did not distinguish between multiple conventional survey types or between locus-specific detections when multiple genetic markers were used for eDNA metabarcoding because further partitioning of the data into subsets resulted in reduced power to detect differences.
Results
Overview of Studies
Systematic review of the literature yielded 37 peer-reviewed studies meeting our synthesis criteria (Supplementary Files S5, S6). The earliest study was published in 2012, but all others were published between 2016 and 2020. Most were conducted in Europe (35%), Asia (24%), and North America (22%), and a few were conducted in Australia (11%), South America (5%), and Africa (3%) (Figure 1). Most studies (65%) occurred in freshwater systems, including lentic and lotic environments ranging from ditches, ponds, and small streams to large rivers and lakes in temperate and tropical locations. Studies of marine systems included temperate and tropical estuaries, bays, and coastal oceans. Within these studies, we identified 121 independent sites where authors compared fish species richness between eDNA metabarcoding and conventional surveys. The number of sites across studies was highly uneven – 56% of comparative observations originated from just three publications, all of which sampled freshwater systems (Valentini et al., 2016; Fujii et al., 2019; Li et al., 2019).
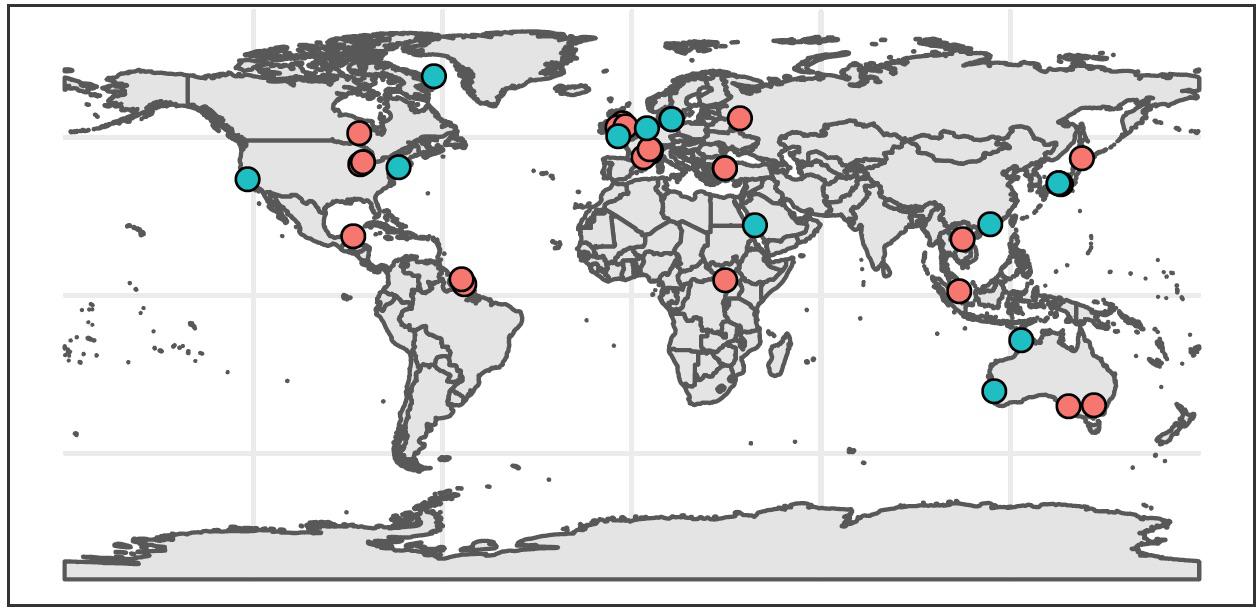
Figure 1. Global distribution of studies included in synthesis (n = 37). Red circles indicate freshwater studies (n = 24), and blue circles indicate marine studies (n = 13).
Authors compared eDNA-based fish species richness to a variety of conventional survey methods both within and across studies. Nets were the most common conventional method (used in 22 studies), followed by traps, electrofishing, visual surveys, and angling. Impingement, acoustic, and toxicant-based surveys were also used. Most studies (57%) deployed multiple gears or derived observed species richness from a combination of methods to compare with eDNA metabarcoding (Figures 2C,D). Although using multiple gears for conventional surveys was common, using multiple gene markers for eDNA metabarcoding of fish diversity was not. Only 11 studies used a multi-marker approach targeting different mitochondrial gene regions for sequencing (Figures 2A,B). Overall, the most commonly used gene locus was 12S rRNA (used in 29 studies), followed by 16S rRNA (n = 9), cytochrome b (CytB, n = 9), and cytochrome-c-oxidase subunit I (COI, n = 4). Of the multi-marker studies, the most common combination was 12S and CytB (n = 4). For single-marker studies, the most frequently used locus was 12S (n = 18). Other components of eDNA metabarcoding workflows were inconsistently reported across studies (Supplementary File S7). When reported, water volumes filtered per site ranged widely (0.6 to 3540 L, n = 118), as did filter pore sizes (0.22 to 1.2 μm, n = 106), filter membrane materials, extraction methods, amplicon primers, and numbers of PCR replicates (2 to 12, n = 102).
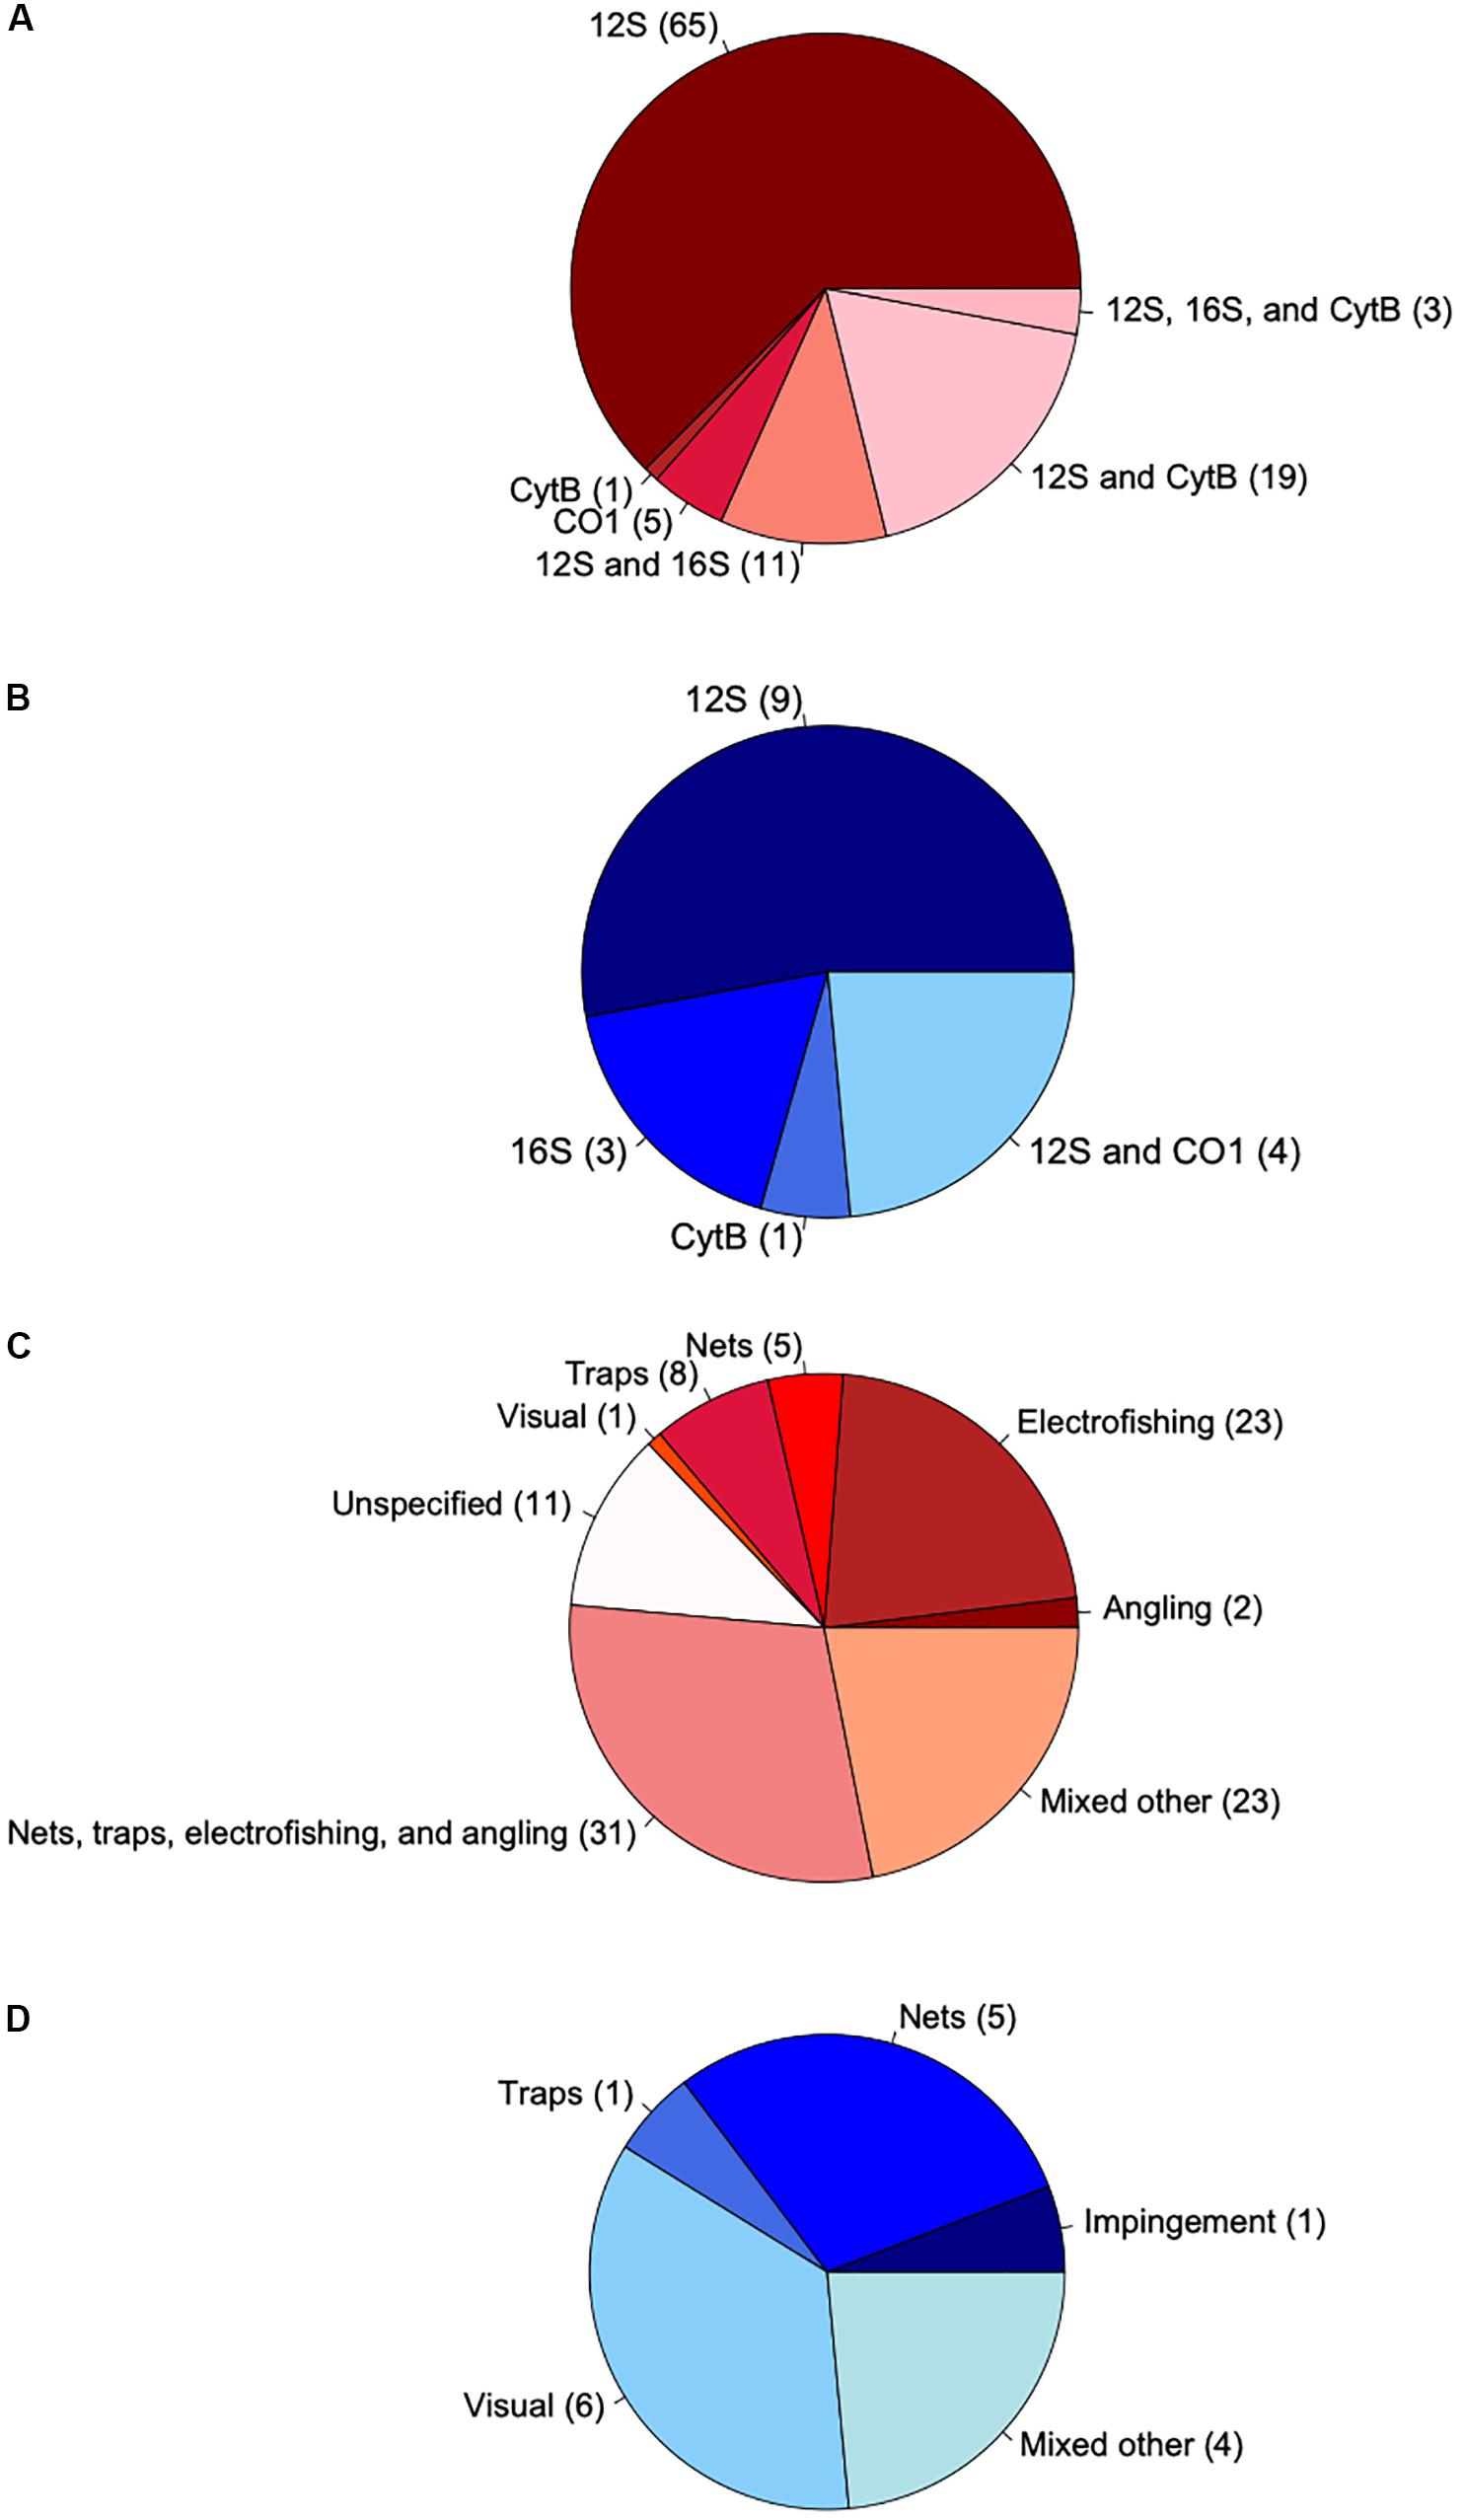
Figure 2. Pie charts characterizing the genetic loci sequenced in eDNA metabarcoding studies and conventional survey types for freshwater (red) and marine systems (blue). Numbers in parentheses show the number of observations (n = 121). (A) Loci used in freshwater systems. Dark and light shading indicate single- and multi-marker observations, respectively. (B) Loci used in marine systems. Dark and light shading indicate single- and multi-marker observations, respectively. (C) Conventional surveys used in freshwater systems. Dark and light shading indicate where single and multiple survey methods were used, respectively. White indicates observations for which primary study authors did not report the type of conventional methods used to create species lists. (D) Conventional surveys used in marine systems. Dark and light shading indicate where single and multiple survey methods were used, respectively.
Across study sites (n = 118), total observed fish species richness regardless of detection method ranged from 0 to 253 and averaged 30.44 ± 3.92 (mean ± SEM). On average, marine sites (89.00 ± 15.45, n = 17) were over four times more species-rich than freshwater sites (20.58 ± 2.80, n = 101). Conventional surveys detected more fish species than (i.e., outperformed) eDNA metabarcoding at 50 sites (41%), and eDNA outperformed conventional surveys at 54 sites (45%). Both methods detected the same number of fish species at 17 sites (14%).
Relative Performance of Methods as Species Richness Measures
Lin’s CCC showed moderate agreement across all study sites (n = 121, CCC = 0.74, CI95%: 0.66, 0.80), suggesting similar performance of eDNA metabarcoding and conventional surveys as measures of fish species richness. However, notable disparities emerged when we assessed agreement by target system – freshwater systems showed good agreement (CCC = 0.86, CI95%: 0.81, 0.90; n = 104), but marine systems showed no agreement as Lin’s CCC was not significantly different from zero (CCC = 0.35, CI95%: −0.04, 0.65; n = 17). Bland-Altman analyses reflected similar patterns (Figure 3). Here, performance of eDNA metabarcoding as a richness measure was not significantly different from conventional surveys in both freshwater and marine systems as means for both groups bounded zero (Figures 3A,B). Although the differences between methods in marine systems were not considered significant in the latter analysis, we note that wide confidence intervals around the mean and few observations for marine systems limit the insight of this particular result.
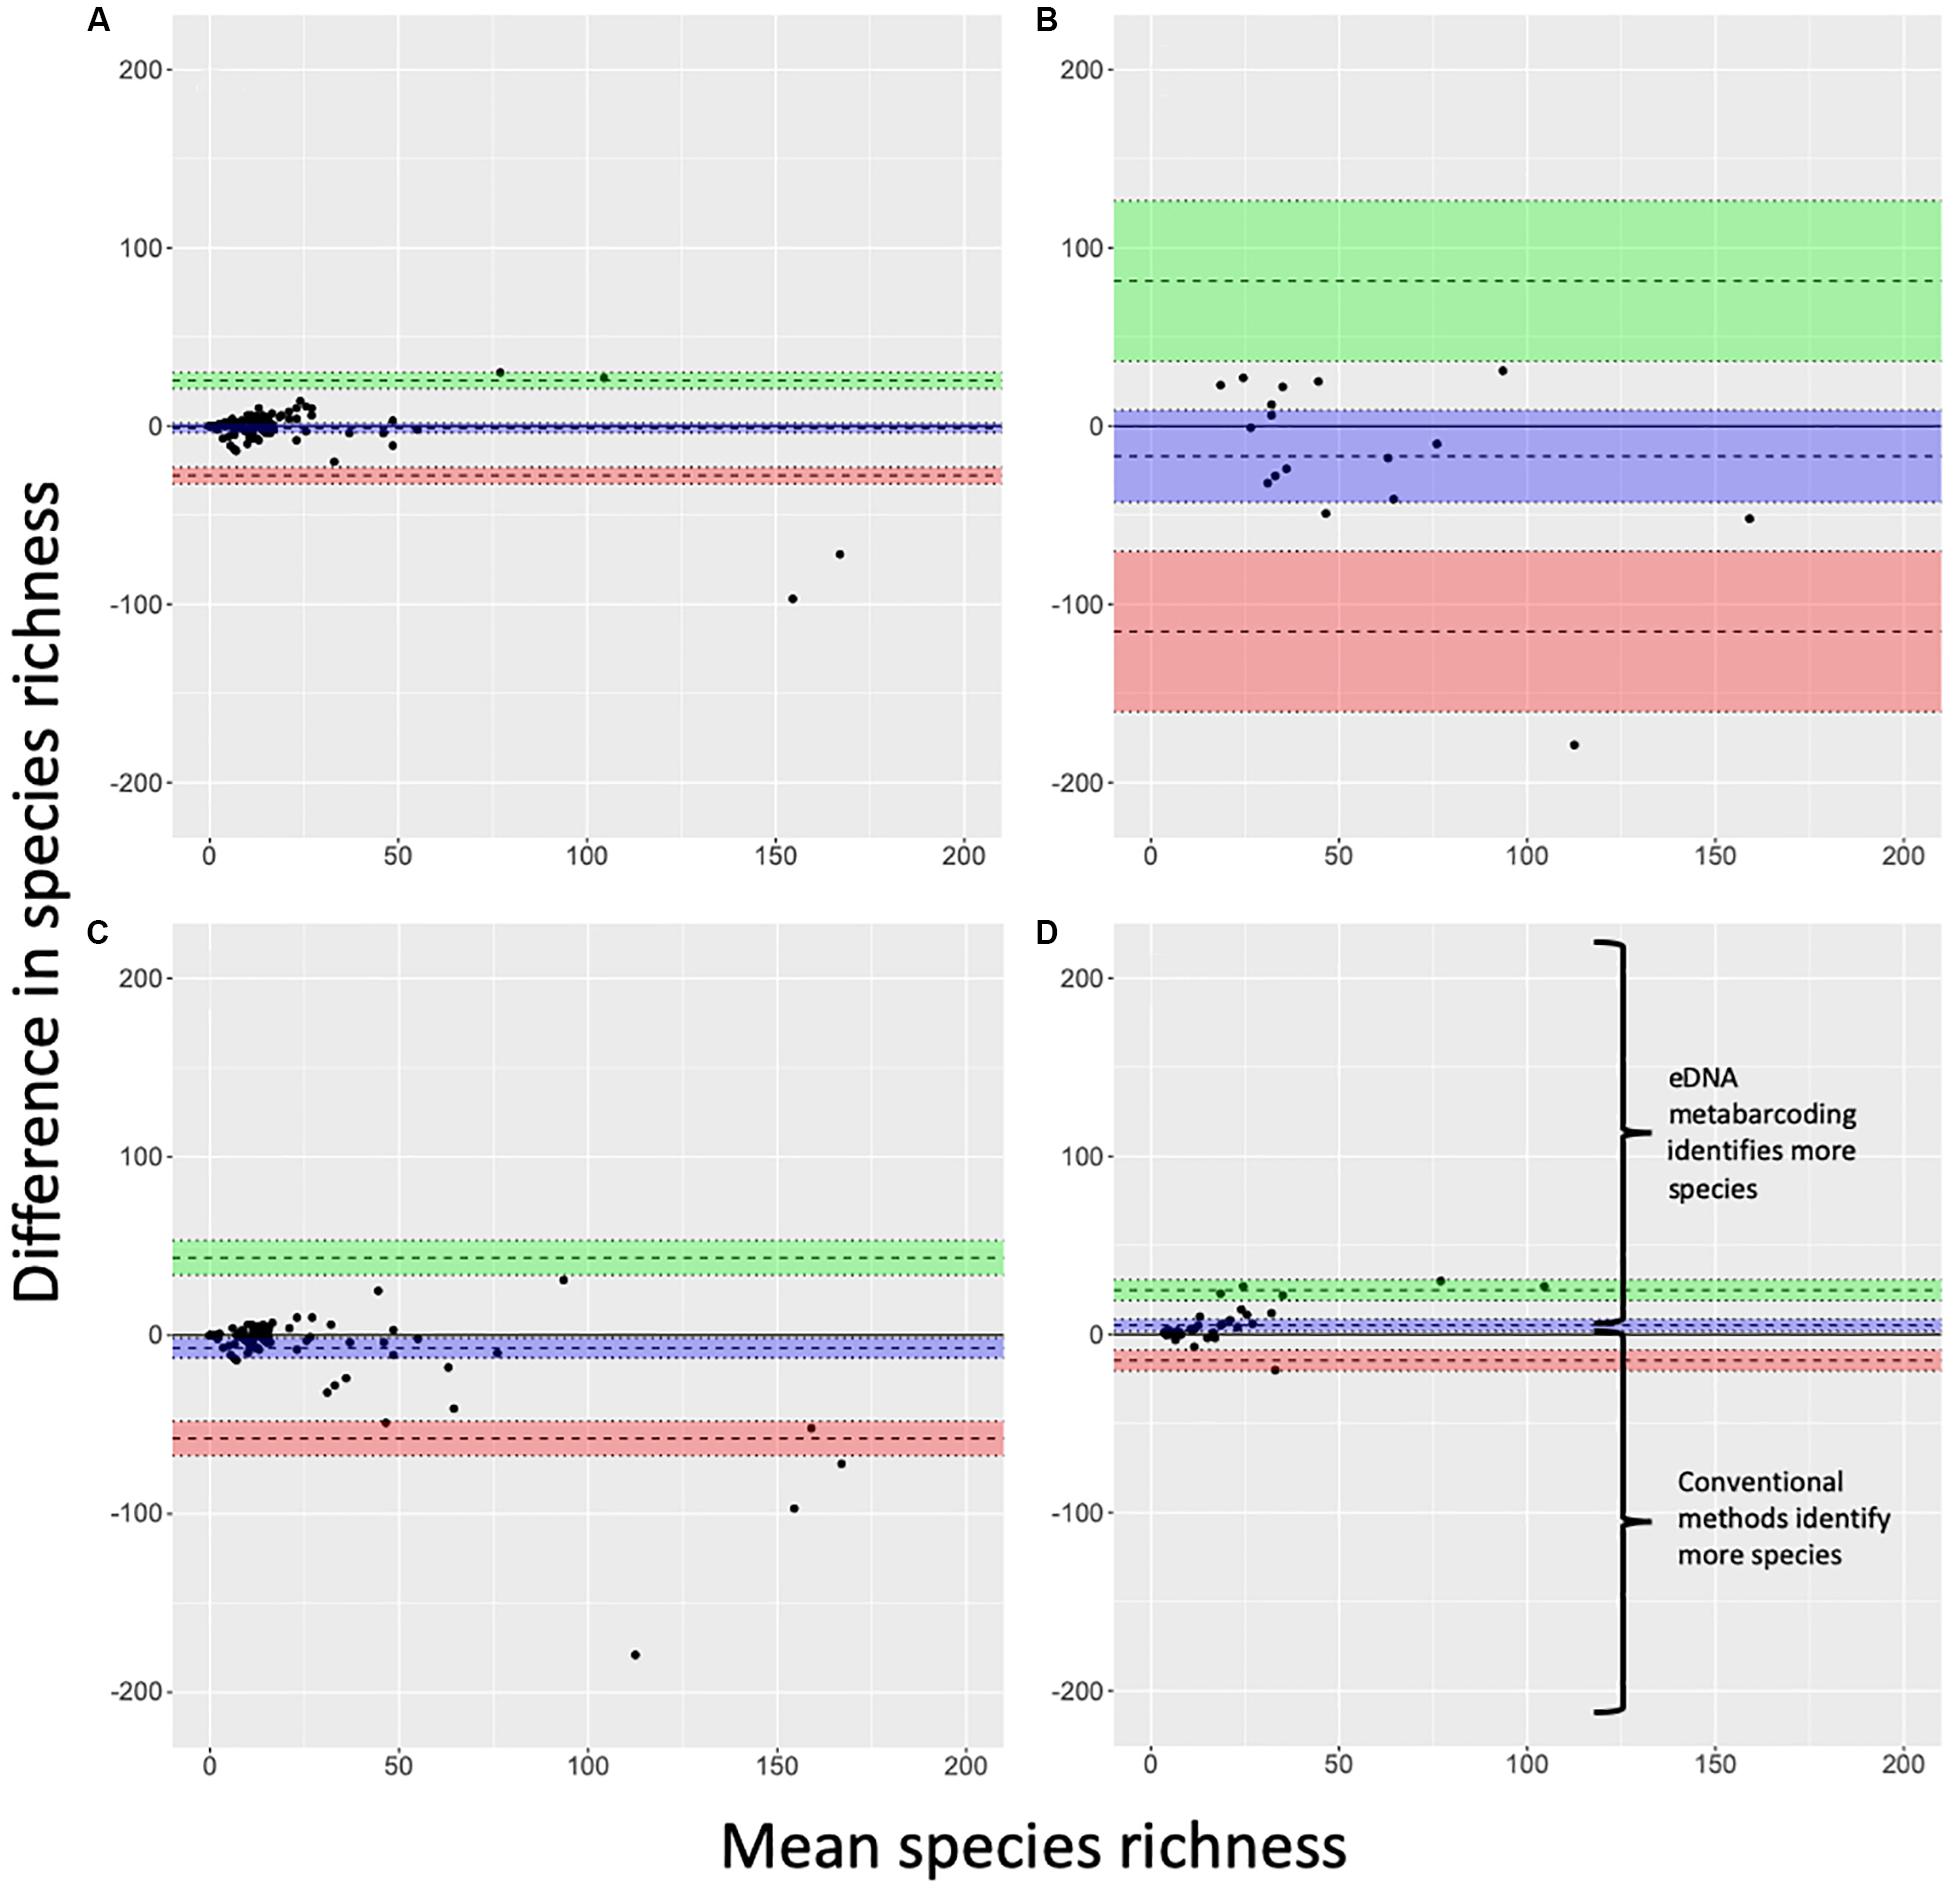
Figure 3. Bland-Altman plots for (A) freshwater and (B) marine systems, (C) single-marker and (D) multi-marker observations for freshwater and marine systems combined. Blue band indicates a mean (wide dashed line) with 95% confidence intervals. Green and red bands indicate two standard deviations (wide dashed lines) from the mean with 95% confidence intervals. Outliers are observations that lie above and below the green and red bands, respectively. Regions of the figure where one method differentially detects more or fewer species than the other method are detailed in panel (D) and are consistent across all panels.
Lin’s CCC showed agreement for multi-marker observations (CCC = 0.85, CI95%: 0.76, 0.91; n = 37) and for single-marker observations (CCC = 0.72, CI95%: 0.64, 0.79; n = 84). However, Bland-Altman analyses indicated multi-marker eDNA metabarcoding outperformed conventional surveys while single-marker eDNA metabarcoding did not (Figures 3C,D). These results highlight the importance of considering not only the agreement between methods with CCC values, but also the direction of performance as demonstrated by Bland-Altman analysis. For freshwater sites, we conducted a post hoc evaluation of the Bland-Altman formatted data (Figure 3A) using a bent cable model (grid size 30) to identify thresholds implemented by applying the SiZer package in R (Sonderegger et al., 2009). The peak difference in relative performance for eDNA metabarcoding compared to conventional surveys, occurred at a species richness of 30, and the species richness threshold where the bent cable model intersected relative performance parity (eDNA species richness estimate – conventional species richness estimate = 0) was at approximately 100 species. There was insufficient sample size and species richness coverage to implement a similar analysis for marine systems.
Across all subsets of data except for marine systems, CCC values showed agreement between eDNA metabarcoding and conventional surveys (Supplementary File S8). Additionally, Bland-Altman analyses indicated eDNA metabarcoding performs as well as conventional surveys in both lentic and lotic environments (Supplementary File S1). When conventional surveys are conducted concurrently with eDNA sampling, eDNA metabarcoding performed as well as conventional methods. In contrast, non-concurrent sampling resulted in eDNA metabarcoding slightly underperforming conventional surveys (Supplementary File S3).
Method Complementarity Using Species Identities
Conventional surveys and eDNA metabarcoding exhibited a high degree of overlap when accounting for shared species detections within study sites (Figure 4). For most sites (65%), the proportion of shared detections was 0.50 or greater (specifically, average overlap was 0.56 ± 0.02, n = 115). At 25 different sites, the degree of overlap was 0.75 or greater, including 7 sites with complete overlap (1.00). These seven sites originated from two studies (Valentini et al., 2016; Li et al., 2019) and were all low-diversity freshwater lentic systems (<7 species). Additionally, there were four sites with no shared detections where eDNA metabarcoding failed to detect 7 to 14 fish species identified in conventional surveys. These sites occurred in a single study of 31 oxbow and backwater lakes in Japan (Fujii et al., 2019).
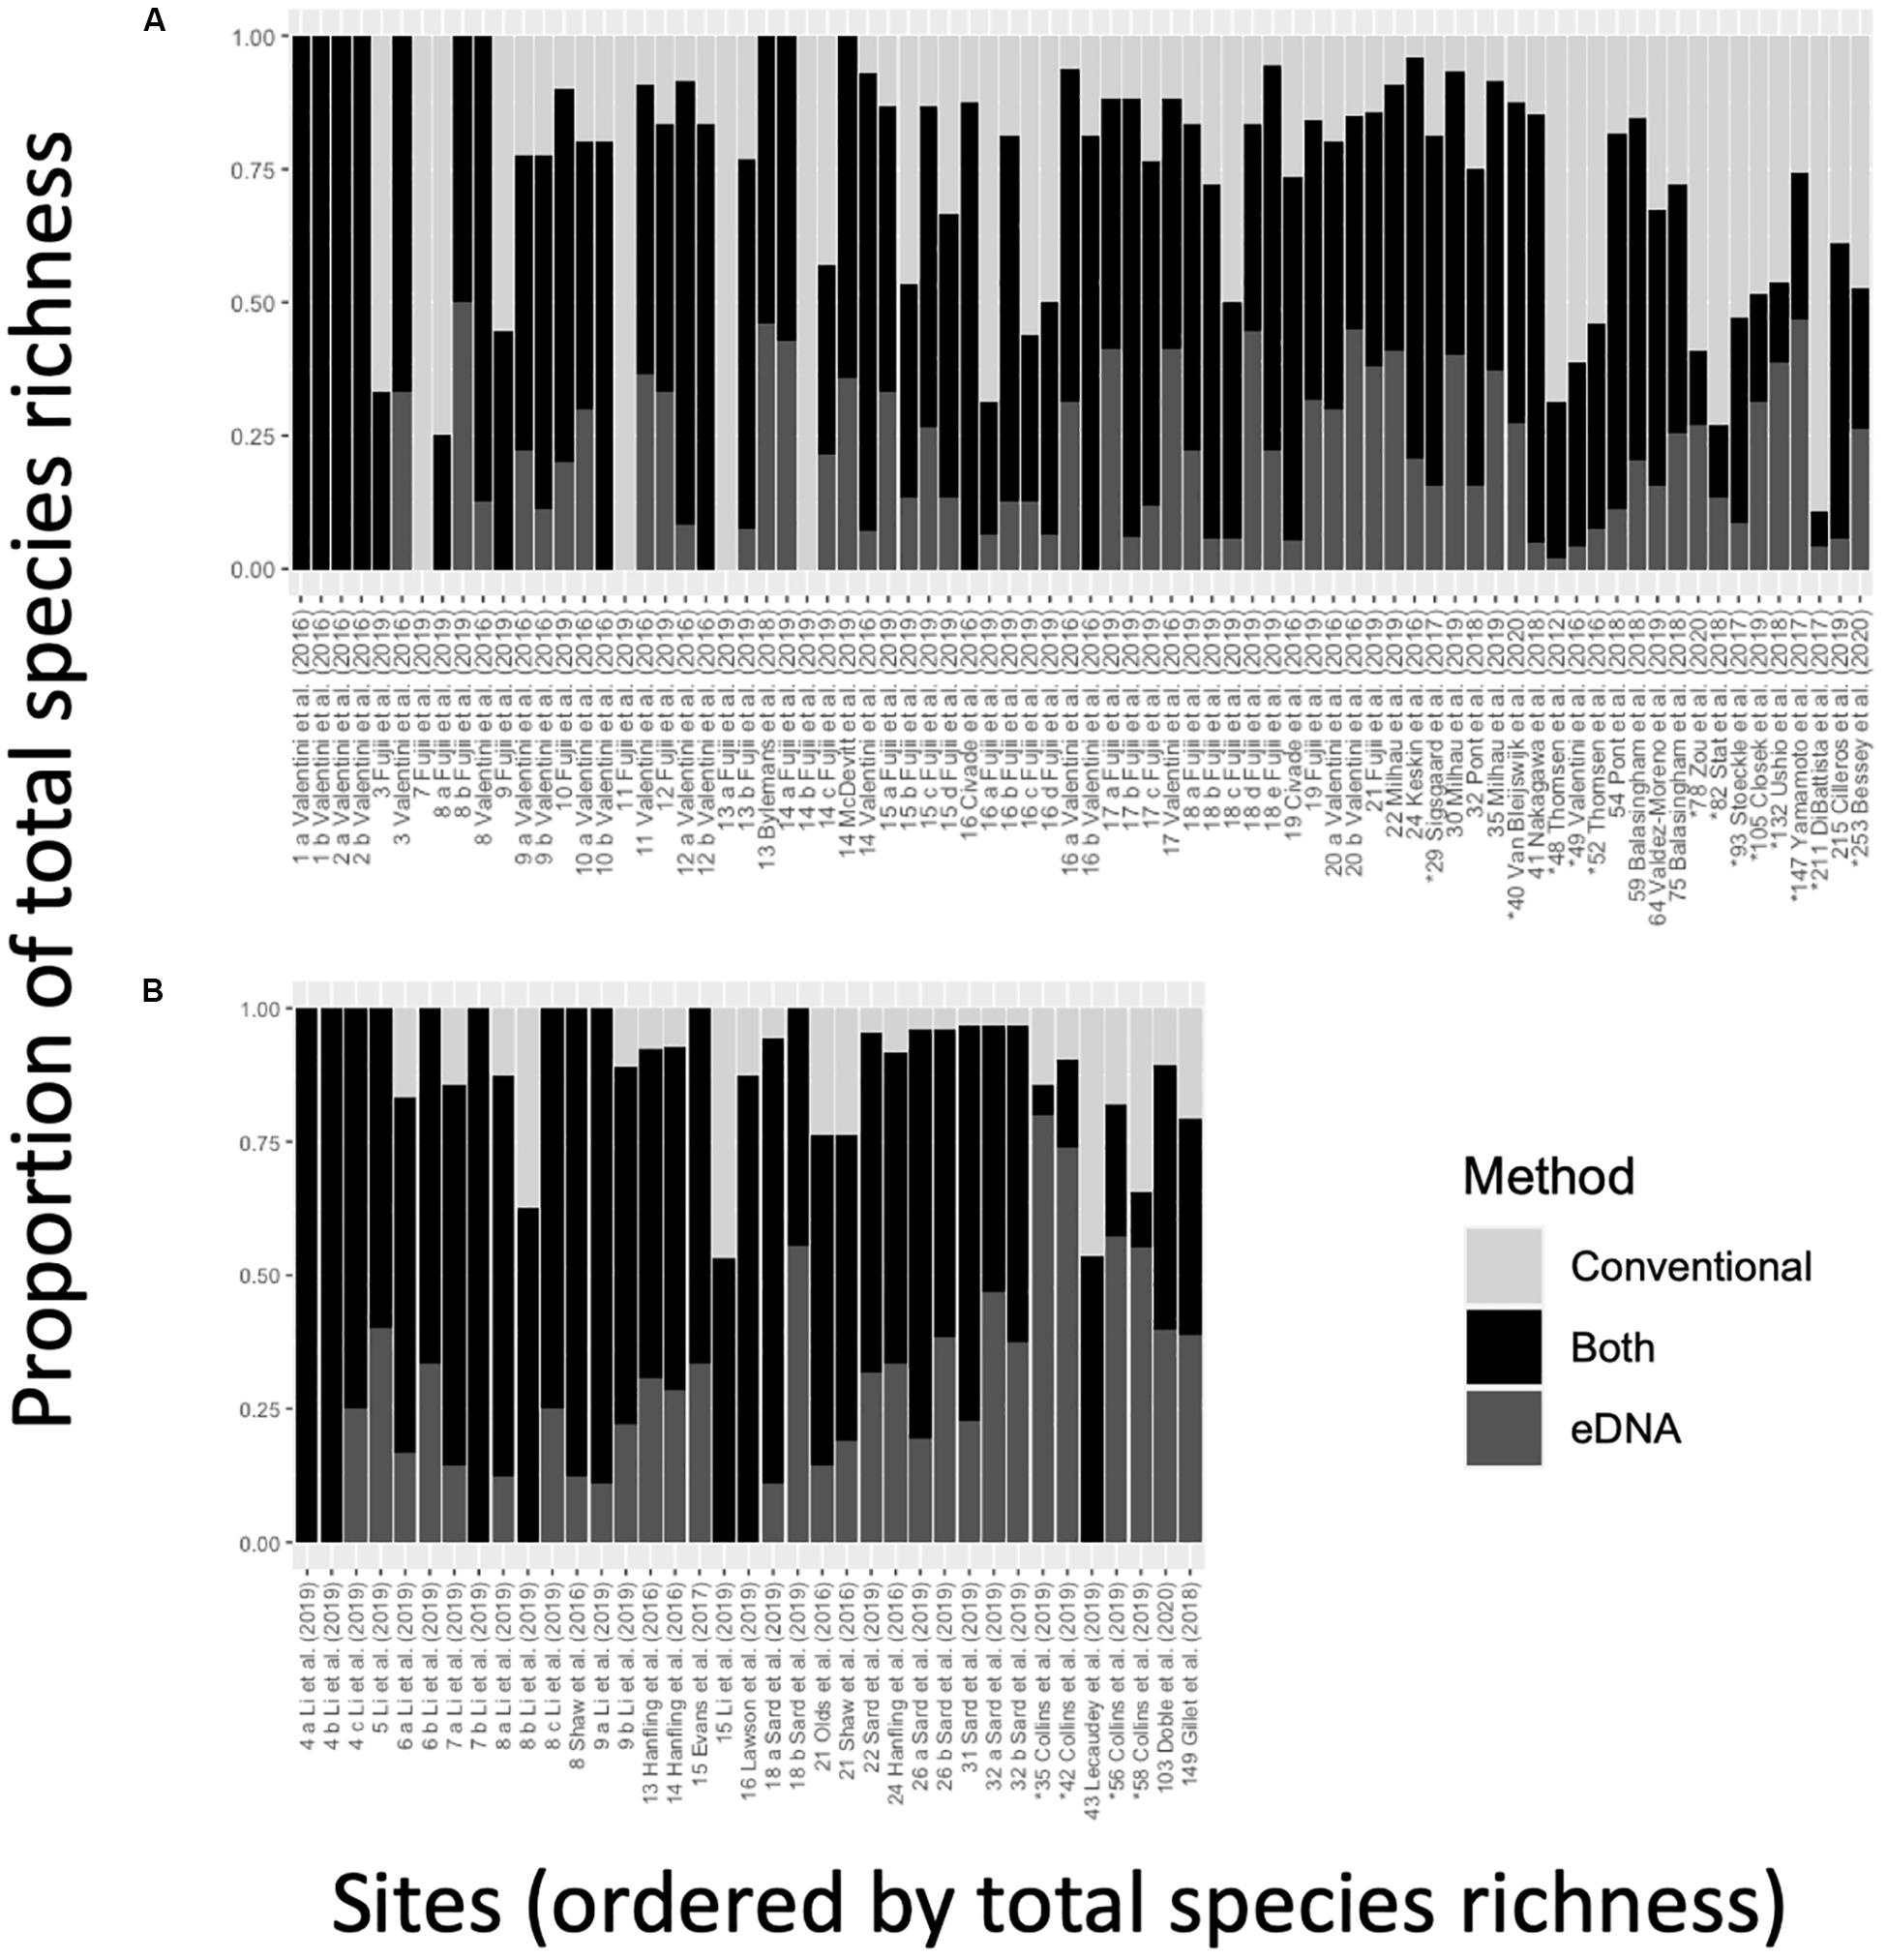
Figure 4. The proportion of species detected by only eDNA (bottom, dark gray), eDNA and conventional surveys (middle, black), and only conventional surveys (top, light gray), ordered by total observed species richness for (A) single-marker and (B) multi-marker observations. Labels on the x-axis indicate the study from which the data were sourced – the alphabetical label is a unique observation within a study, and the preceding number indicates total species richness associated with an observation. Asterisks (*) indicate marine and estuarine observations. A cross-referenced table of values can be found in Supplementary File S7.
In freshwater systems, the proportion of shared detections (0.61 ± 0.02, n = 98) was more than twice as in marine systems (0.26 ± 0.04, n = 17). The proportion of shared detections in multi-marker studies (0.63 ± 0.04, n = 37) was also higher than in single-marker studies (0.53 ± 0.03, n = 78). Interestingly, the proportion of eDNA-only detections was higher in marine systems (0.31 ± 0.06) than in freshwater systems (0.19 ± 0.02), and it was higher in multi-marker studies (Figure 4A; 0.27 ± 0.03) than in single-marker studies (Figure 4B; 0.18 ± 0.02).
The high degree of shared species detections was matched by a similarly high degree of method-specific detections. At 77% of sites, eDNA metabarcoding revealed at least one additional fish species beyond those also detected by conventional surveys – at times adding up to 69 species (Yamamoto et al., 2017). At 78% of sites, conventional surveys also identified at least one additional fish species beyond those also detected by eDNA metabarcoding – in one case, adding up to 188 species (DiBattista et al., 2017).
Discussion
As a measure of fish species richness, eDNA metabarcoding calibrates well to conventional surveys in low to moderately diverse freshwater systems (<100 species). In marine and more diverse systems, the relative performance of eDNA is unclear given few observations from these sites. It is possible there are proportionally many undetected taxa by eDNA metabarcoding in high-diversity systems due in part to false negatives stemming from single-marker assays, incomplete reference libraries, PCR inhibition, and insufficient sampling effort or sequencing depth. Nevertheless, eDNA metabarcoding performs as well as conventional methods in many freshwater systems. This result should impart confidence in eDNA metabarcoding applications for ecological study and natural resource management (Kelly et al., 2014; Jerde, 2019; Sepulveda et al., 2020), particularly if further refinement of the approach improves performance in more diverse and marine systems.
Critically, we also show that both eDNA metabarcoding and conventional surveys detect unique fish species in all aquatic systems despite a high degree of overlapping detections. Thus, when species identities matter, such as for assessments of community composition, they are currently complementary methods. Although this is the case now, eDNA capacity may improve as we optimize metabarcoding approaches to better detect rare species and distinguish closely related species. Furthermore, eDNA offers the possibility of reanalyzing archived samples as we develop more powerful assays and instruments (Singer et al., 2019), which may reveal species that initially went undetected. Reanalysis of archival samples represents a significant advantage over conventional surveys, which are unlikely to experience a similar degree of technological advancement moving forward and for which retroactive species detection is impossible without some form of specimen capture and preservation.
One way of optimizing eDNA metabarcoding for biodiversity assessment involves using multiple genetic markers. Our results highlight that multi-marker assays improve species detection, albeit with added sequencing cost. For example, Doble et al. (2020) sampled eDNA concurrently with visual surveys at 21 sites in Lake Tanganyika to characterize the lake’s highly diverse, endemic fish communities. The authors used four primer sets – two previously published and two newly developed for their study, including a cichlid-specific marker. With multiple markers targeting different loci, good genetic reference database coverage (83% of 431 known species), and deeper sequencing, eDNA metabarcoding identified 30 more fish species than aggregated detections from 27 concurrent snorkel surveys. Although deeper sequencing and multi-marker methods involve increased costs, these costs are unlikely to be greater than those associated with more intensive conventional field surveys, especially for remote and sensitive habitats.
However, multi-marker approaches do not guarantee better performance if reference databases are insufficiently populated or if primers impart amplification bias. The impact of these two factors on biodiversity inferences from eDNA metabarcoding has been explored (Hajibabaei et al., 2019; Kelly et al., 2019) but is inconsistently reported in field studies. Lecaudey et al. (2019) detected only 23 of 43 fish species (53%) known to occur in their study area despite using three gene markers (cytb, 12S, 16S) in their analysis of Volga River eDNA samples. In a follow-up study reanalyzing the metabarcoding data, Schenekar et al. (2020) revealed that an incomplete reference database led to several false negatives and mis-assigned species. They also highlighted significant differences in primer efficiencies between markers and among species and the associated potential for false negatives. Addressing these pitfalls could involve a priori analyses of primer amplification bias using tissue from target species or in silico tests of primer specificity to inform appropriate genetic marker selection (Collins et al., 2019). In another multi-marker study assessing marine fish diversity in a public aquarium, Morey et al. (2020) only detected ∼50% of 107 known tank species with eDNA metabarcoding. While using three markers (12S, 16S, COI) improved taxonomic recovery over using just one or two, the approach was limited in part by poor quality of available reference sequences. Until we develop regional databases and molecular markers can ensure consistent species detection, eDNA metabarcoding will remain a complementary tool for aquatic biodiversity surveys in many systems rather than a stand-alone monitoring approach (McGee et al., 2019). Along with genetic reference development and primer optimization, two additional areas are ripe for improvement. We identified four instances of eDNA failing to detect any present fish species at sites where PCR amplification failed due to chemical inhibition (Fujii et al., 2019), which can occur when soil debris and humic substances are extracted along with DNA from environmental samples. Overcoming false negatives from PCR inhibition will enable robust species richness estimation with eDNA metabarcoding data. This is a well-acknowledged pitfall in the general eDNA approach (Goldberg et al., 2016) that can be mitigated with simple protocol adjustments to remove inhibitors from samples (McKee et al., 2015). Less acknowledged is the pitfall of insufficient sampling or spatial coverage to make eDNA metabarcoding inferences comparable to intensive conventional sampling. Justification of sampling effort and configuration for eDNA metabarcoding is a knowledge gap requiring more attention moving forward (Dickie et al., 2018), but see Evans et al. (2017a).
In the context of our synthesis, it is difficult to discern the impact of variable effort on the relative performance of eDNA metabarcoding and conventional surveys in part because effort can be characterized and quantified in myriad ways for both approaches. We made a limited attempt to explore the effect of differential effort in time using observations from concurrent and non-concurrent surveys. When water samples were collected concurrently with conventional surveys, eDNA metabarcoding performed as well as conventional methods, but with non-concurrent surveys, conventional methods slightly outperformed eDNA (Supplementary File S3). Although this may suggest some bias due to mismatched effort favoring conventional methods, it was not possible to disentangle this effect from other sources of variable effort like using multiple conventional gear types. Furthermore, the studies we analyzed varied considerably in their metabarcoding workflows – from the volume and number of samples collected, spatial coverage, filtration and extraction methods, to the selected markers and primers, sequencing platforms, and bioinformatics pipelines – all of which have documented impact on biodiversity inferences from eDNA (Djurhuus et al., 2017; Evans et al., 2017a; Alberdi et al., 2018; Grey et al., 2018; Zhang et al., 2018).
Despite substantial methodological variation across the synthesized studies (Figure 2 and Supplementary File S7), we found eDNA metabarcoding performed well compared to, in some cases, many years of conventional surveys (Olds et al., 2016; Yamamoto et al., 2017). A few explanations are possible. First, species richness inferences from eDNA metabarcoding may be robust against methodological variation. Second, conventional methods may significantly and systematically underestimate species richness. Third, eDNA metabarcoding may overestimate species richness in detecting DNA transported from locally absent species (Shogren et al., 2017; Andruszkiewicz et al., 2019), or false positives emerging from sources such as contamination or reference database errors in species identification (Jerde, 2019). Untangling biases in species richness (under- or overestimation) from eDNA metabarcoding will require some reference to species present in the target system, which could come from calibration experiments using complex mesocosms with known species composition. Although there have been recent calls for standardized approaches in eDNA metabarcoding (Shu et al., 2020), it is unclear if standardized protocols are needed for purposes of measuring community composition or if protocols should be optimized for each system. Still, best practices for eDNA metabarcoding are useful for minimizing contamination during sample and sequence processing and for maximizing yield with DNA capture, extraction, and amplification protocols (Goldberg et al., 2016).
There has also been a call for increased applications of eDNA metabarcoding in marine systems (Ausubel et al., 2018), which were poorly represented in our synthesis due primarily to a lack of species-level comparative studies. Indeed, ambiguous eDNA metabarcoding performance compared to conventional methods reflects an insufficient number of observations across a wide range of richness values (n = 17, range: 32 to 253 species). Nonetheless, a higher proportion of eDNA-only detections at marine sites demonstrate added value in eDNA-based marine monitoring even if overall relative performance is still unclear. In many cases, eDNA detected cryptic, nocturnal, rare, or elusive species missed by conventional surveys (Thomsen et al., 2016; Closek et al., 2019; Bessey et al., 2020). Further, more recent studies highlight improved species detection in marine systems with better populated reference libraries (Stoeckle et al., 2020) and multiple markers (Lafferty et al., 2020). Marine systems are especially difficult to sample comprehensively with conventional methods, and eDNA metabarcoding could expand the scale and resolution of monitoring at lower relative cost and effort. However, data from both approaches are needed to robustly assess the degree of agreement between them. To this end, we encourage collaboration between eDNA-samplers and the divers, seiners, snorkelers, trappers, and trawlers who together can provide such critical data.
One of the most game-changing promises of eDNA metabarcoding is the ability to detect biodiversity across the tree of life from simple environmental samples (Stat et al., 2017; Sawaya et al., 2019). We focused exclusively on water samples and the target group of bony fish here because there was a relatively large number of comparative observations across aquatic systems. Our findings should motivate similar data-gathering efforts and analyses for a wider range of organisms and habitats. Importantly, further investigations of the robustness of eDNA metabarcoding may reveal critical insights for taxa that are notoriously challenging to observe using conventional methods. Environmental DNA metabarcoding offers the promise of a unified approach to whole-ecosystem assessments, which would reduce monitoring costs, facilitate conservation and management, and enhance studies of ecological responses to growing global impacts (Trisos et al., 2020). The present analysis supports continued development and expansion of eDNA metabarcoding as an integral component of biodiversity monitoring in a world where innovative approaches are needed to track the effects of fast-paced and far-reaching ecological change.
Data Availability Statement
All data are contained in the Supplementary Material or can be found within the article and Supplementary Material of the original sources of this synthesis.
Author Contributions
All authors contributed to content and editing of the manuscript. CJ and MM wrote the manuscript, conceived the ideas, and conducted the analyses. MM, TeD, and EW compiled the database.
Funding
This research was partially supported by NASA (NNX14AR62A), BOEM[cpsenter](MC15AC00006), NOAA’s support of the Santa Barbara Channel Marine Biodiversity Observation Network, USAID (AID-OAA-A-00057), DOD-SERDP [W912HG-12-C-0073 (RC-2240) and W912HQ19C0064 (RC19-1004)], California Regional Water Quality Control Board (16-023-140), NFWF (57446 and 55495), NSF GRF (1650114) and NGS Early Career (EC-333R-18), the European Research Council (ERC) under the European Union’s Horizon 2020 Research and Innovation Program (852621), and the U.S. Geological Survey Ecosystem Mission Area.
Conflict of Interest
The authors declare that the research was conducted in the absence of any commercial or financial relationships that could be construed as a potential conflict of interest.
Acknowledgments
We thank Adam Sepulveda, the Wonders of the Mekong workgroup, and participants of the How to Achieve a True Consensus for Best Environmental DNA Practices symposium held at UC Davis (January 29, 2020) for providing feedback and guidance on previous iterations of this manuscript. Any use of trade, firm, or product names is for descriptive purposes only and does not imply endorsement by the U.S. Government.
Supplementary Material
The Supplementary Material for this article can be found online at: https://www.frontiersin.org/articles/10.3389/fevo.2020.00276/full#supplementary-material
FILE S1 | Bland-Altman analyses for lentic and lotic freshwater systems.
FILE S2 | Species detection data for each study used in the synthesis ordered by first author. Each tab consists of one or more species lists and detection category (eDNA or conventional) to identify the method of detection for each species atindependent sites. For each site, we calculate the sum of species detected by each method and include the data sourcing information referencing the primary research article.
FILE S3 | Bland-Altman analyses comparing species richness estimates between eDNA sampling with concurrent and non-concurrent conventional surveys.
FILE S4 | Summary of sites for which fish species richness was measured by both eDNA metabarcoding and conventional surveys. Asterisks (*) indicate richness observations generated from multiyear conventional survey data or when studies referenced ‘all previous records’ without specifying a survey method. Bold font indicates richness observations generated from surveys using multiple conventional gear types.
FILE S5 | Database search records and stepwise selection process. Includes list of records found, rejected, rationale for rejection, records retained, manual additions, and publication information.
FILE S6 | Flow diagram of study selection process used in this synthesis following PRISMA-P systematic review practices outlined in Moher et al. (2015).
FILE S7 | Data used to perform summary statistics, agreement and overlap analyses. Includes additional details of eDNA metabarcoding workflows.
FILE S8 | Lin’s concordance correlation analyses for all sites and subsets of data.
Footnotes
References
Alberdi, A., Aizpurua, O., Gilbert, M. T. P., and Bohmann, K. (2018). Scrutinizing key steps for reliable metabarcoding of environmental samples. Methods Ecol. Evol. 9, 134–147. doi: 10.1111/2041-210x.12849
Andruszkiewicz, E. A., Koseff, J. R., Fringer, O. B., Ouellette, N. T., Lowe, A. B., Edwards, C. A., et al. (2019). Modeling environmental DNA transport in the coastal ocean using Lagrangian particle tracking. Front. Mar. Sci. 6:477. doi: 10.3389/fmars.2019.00477
Ausubel, J. E., Stoeckle, M. Y., and Gaffney, P. (2018). Final Report: 1st US National Conference on Marine Environmental DNA (eDNA). New York, NY: The Marine Science & Policy Series.
Bakker, J., Wangensteen, O. S., Chapman, D. D., Boussarie, G., Buddo, D., Guttridge, T. L., et al. (2017). Environmental DNA reveals tropical shark diversity in contrasting levels of anthropogenic impact. Sci. Rep. 7:16886.
Balasingham, K. D., Walter, R. P., Mandrak, N. E., and Heath, D. D. (2018). Environmental DNA detection of rare and invasive fish species in two Great Lakes tributaries. Mol. Ecol. 27, 112–127. doi: 10.1111/mec.14395
Bálint, M., Nowak, C., Márton, O., Pauls, S. U., Wittwer, C., Aramayo, J. L., et al. (2018). Accuracy, limitations and cost efficiency of eDNA-based community survey in tropical frogs. Mol. Ecol. Resour. 18, 1415–1426. doi: 10.1111/1755-0998.12934
Barnes, M. A., and Turner, C. R. (2016). The ecology of environmental DNA and implications for conservation genetics. Conserv. Genet. 17:17.
Bessey, C., Jarman, S. N., Berry, O., Olsen, Y. S., Bunce, M., Simpson, T., et al. (2020). Maximizing fish detection with eDNA metabarcoding. Environ. DNA doi: 10.1002/edn3.74 [Epub ahead of print].
Bland, J. M., and Altman, D. (1986). Statistical methods for assessing agreement between two methods of clinical measurement. Lancet 327, 307–310. doi: 10.1016/s0140-6736(86)90837-8
Blowes, S. A., Supp, S. R., Antão, L. H., Bates, A., Bruelheide, H., Chase, J. M., et al. (2019). The geography of biodiversity change in marine and terrestrial assemblages. Science 366, 339–345.
Boussarie, G., Bakker, J., Wangensteen, O. S., Mariani, S., Bonnin, L., Juhel, J. B., et al. (2018). Environmental DNA illuminates the dark diversity of sharks. Sci. Adv. 4:eaa9661.
Cantera, I., Cilleros, K., Valentini, A., Cerdan, A., Dejean, T., Iribar, A., et al. (2019). Optimizing environmental DNA sampling effort for fish inventories in tropical streams and rivers. Sci. Rep. 9, 1–11.
Cilleros, K., Valentini, A., Allard, L., Dejean, T., Etienne, R., Grenouillet, G., et al. (2019). Unlocking biodiversity and conservation studies in high-diversity environments using environmental DNA (eDNA): a test with Guianese freshwater fishes. Mol. Ecol. Resour. 19, 27–46. doi: 10.1111/1755-0998.12900
Civade, R., Dejean, T., Valentini, A., Roset, N., Raymond, J. C., Bonin, A., et al. (2016). Spatial representativeness of environmental DNA metabarcoding signal for fish biodiversity assessment in a natural freshwater system. PLoS One 11:e0157366. doi: 10.1371/journal.pone.0157366
Closek, C. J., Santora, J. A., Starks, H. A., Schroeder, I. D., Andruszkiewicz, E. A., Sakuma, K. M., et al. (2019). Marine vertebrate biodiversity and distribution within the central California current using environmental DNA (eDNA) metabarcoding and ecosystem surveys. Front. Mar. Sci. 6:732. doi: 10.3389/fmars.2019.00732
Collins, R. A., Bakker, J., Wangensteen, O. S., Soto, A. Z., Corrigan, L., Sims, D. W., et al. (2019). Non-specific amplification compromises environmental DNA metabarcoding with COI. Methods Ecol. Evol. 10, 1985–2001. doi: 10.1111/2041-210X.13276
Deiner, K., Bik, H. M., Mächler, E., Seymour, M., Lacoursière-Roussel, A., Altermatt, F., et al. (2017). Environmental DNA metabarcoding: transforming how we survey animal and plant communities. Mol. Ecol. 26, 5872–5895. doi: 10.1111/mec.14350
DiBattista, J. D., Coker, D. J., Sinclair-Taylor, T. H., Stat, M., Berumen, M. L., and Bunce, M. (2017). Assessing the utility of eDNA as a tool to survey reef-fish communities in the Red Sea. Coral Reefs 36, 1245–1252. doi: 10.1007/s00338-017-1618-1
Dickie, I. A., Boyer, S., Buckley, H. L., Duncan, R. P., Gardner, P. P., Hogg, I. D., et al. (2018). Towards robust and repeatable sampling methods in eDNA-based studies. Mol. Ecol. Resour. 18, 940–952. doi: 10.1111/1755-0998.12907
Djurhuus, A., Port, J., Closek, C. J., Yamahara, K. M., Romero-Maraccini, O., Walz, K. R., et al. (2017). Evaluation of filtration and DNA extraction methods for environmental DNA biodiversity assessments across multiple trophic levels. Front. Mar. Sci. 4:314. doi: 10.3389/fmars.2017.00314
Doble, C. J., Hipperson, H., Salzburger, W., Horsburgh, G. J., Mwita, C., Murrell, D. J., et al. (2020). Testing the performance of environmental DNA metabarcoding for surveying highly diverse tropical fish communities: a case study from Lake Tanganyika. Environ. DNA 2, 24–41. doi: 10.1002/edn3.43
Epp, L. S., Boessenkool, S., Bellemain, E. P., Haile, J., Esposito, A., Riaz, T., et al. (2012). New environmental metabarcodes for analysing soil DNA: potential for studying past and present ecosystems. Mol. Ecol. 21, 1821–1833. doi: 10.1111/j.1365-294x.2012.05537.x
Evans, N. T., Li, Y., Renshaw, M. A., Olds, B. P., Deiner, K., Turner, C. R., et al. (2017a). Fish community assessment with eDNA metabarcoding: effects of sampling design and bioinformatic filtering. Can. J. Fish. Aqu. Sci. 74, 1362–1374. doi: 10.1139/cjfas-2016-0306
Evans, N. T., Shirey, P. D., Wieringa, J. G., Mahon, A. R., and Lamberti, G. A. (2017b). Comparative cost and effort of fish distribution detection via environmental DNA analysis and electrofishing. Fisheries 42, 90–99. doi: 10.1080/03632415.2017.1276329
Foote, A. D., Thomsen, P. F., Sveegaard, S., Wahlberg, M., Kielgast, J., Kyhn, L. A., et al. (2012). Investigating the potential use of environmental DNA (eDNA) for genetic monitoring of marine mammals. PLoS One 7:e41781. doi: 10.1371/journal.pone.0041781
Fujii, K., Doi, H., Matsuoka, S., Nagano, M., Sato, H., and Yamanaka, H. (2019). Environmental DNA metabarcoding for fish community analysis in backwater lakes: a comparison of capture methods. PLoS One 14:e0210357. doi: 10.1371/journal.pone.0210357
Gillet, B., Cottet, M., Destanque, T., Kue, K., Descloux, S., Chanudet, V., et al. (2018). Direct fishing and eDNA metabarcoding for biomonitoring during a 3-year survey significantly improves number of fish detected around a South East Asian reservoir. PLoS One 13:e0208592. doi: 10.1371/journal.pone.0208592
Goldberg, C. S., Turner, C. R., Deiner, K., Klymus, K. E., Thomsen, P. F., Murphy, M. A., et al. (2016). Critical considerations for the application of environmental DNA methods to detect aquatic species. Methods Ecol. Evol. 7, 1299–1307. doi: 10.1111/2041-210x.12595
Grey, E. K., Bernatchez, L., Cassey, P., Deiner, K., Deveney, M., Howland, K. L., et al. (2018). Effects of sampling effort on biodiversity patterns estimated from environmental DNA metabarcoding surveys. Sci. Rep. 8:8843.
Guardiola, M., Uriz, M. J., Taberlet, P., Coissac, E., Wangensteen, O. S., and Turon, X. (2015). Deep-sea, deep-sequencing: metabarcoding extracellular DNA from sediments of marine canyons. PLoS One 10:e0139633. doi: 10.1371/journal.pone.0139633
Hajibabaei, M., Porter, T. M., Wright, M., and Rudar, J. (2019). COI metabarcoding primer choice affects richness and recovery of indicator taxa in freshwater systems. PLoS One 14:e0220953. doi: 10.1371/journal.pone.0220953
Halpern, B. S., Frazier, M., Afflerbach, J., Lowndes, J. S., Micheli, F., O’Hara, C., et al. (2019). Recent pace of change in human impact on the world’s ocean. Sci. Rep. 9:11609.
Hänfling, B., Lawson Handley, L., Read, D. S., Hahn, C., Li, J., Nichols, P., et al. (2016). Environmental DNA metabarcoding of lake fish communities reflects long-term data from established survey methods. Mol. Ecol. 25, 3101–3119. doi: 10.1111/mec.13660
Jerde, C. L. (2019). Can we manage fisheries with the inherent uncertainty from eDNA? J. Fish Biol. doi: 10.1111/jfb.14218 [Epub ahead of print].
Jerde, C. L., Mahon, A. R., Chadderton, W. L., and Lodge, D. M. (2011). “Sight-unseen” detection of rare aquatic species using environmental DNA. Conserv. Lett. 4, 150–157. doi: 10.1111/j.1755-263x.2010.00158.x
Jerde, C. L., Wilson, E. A., and Dressler, T. L. (2019). Measuring global fish species richness with eDNA metabarcoding. Mol. Ecol. Resour. 19, 19–22. doi: 10.1111/1755-0998.12929
Kelly, R. P., Port, J. A., Yamahara, K. M., Martone, R. G., Lowell, N., Thomsen, P. F., et al. (2014). Harnessing DNA to improve environmental management. Science 344, 1455–1456. doi: 10.1126/science.1251156
Kelly, R. P., Shelton, A. O., and Gallego, R. (2019). Understanding PCR processes to draw meaningful conclusions from environmental DNA studies. Sci. Rep. 9, 1–14.
Keskin, E., Unal, E. M., and Atar, H. H. (2016). Detection of rare and invasive freshwater fish species using eDNA pyrosequencing: Lake Iznik ichthyofauna revised. Biochem. Syst. Ecol. 67, 29–36. doi: 10.1016/j.bse.2016.05.020
Kinoshita, G., Yonezawa, S., Murakami, S., and Isagi, Y. (2019). Environmental DNA collected from snow tracks is useful for identification of mammalian species. Zool. Sci. 36, 198–207.
Kraaijeveld, K., De Weger, L. A., Ventayol García, M., Buermans, H., Frank, J., Hiemstra, P. S., et al. (2015). Efficient and sensitive identification and quantification of airborne pollen using next-generation DNA sequencing. Mol. Ecol. Resour. 15, 8–16. doi: 10.1111/1755-0998.12288
Lacoursière-Roussel, A., and Deiner, K. (2019). Environmental DNA is not the tool by itself. J. Fish Biol. doi: 10.1111/jfb.14177 [Epub ahead of print].
Lacoursière-Roussel, A., Howland, K., Normandeau, E., Grey, E. K., Archambault, P., Deiner, K., et al. (2018). eDNA metabarcoding as a new surveillance approach for coastal Arctic biodiversity. Ecol. Evol. 8, 7763–7777. doi: 10.1002/ece3.4213
Lafferty, K. D., Garcia-Vedrenne, A. E., McLaughlin, J. P., Childress, J. N., Morse, M. F., and Jerde, C. L. (2020). At Palmyra Atoll, the fish-community environmental DNA signal changes across habitats but not with tides. J. Fish Biol. doi: 10.1111/jfb.14403 [Epub ahead of print].
Lawrence, I., and Lin, K. (1989). A concordance correlation coefficient to evaluate reproducibility. Biometrics 45, 255–268.
Lawson Handley, L., Read, D. S., Winfield, I. J., Kimbell, H., Johnson, H., Li, J., et al. (2019). Temporal and spatial variation in distribution of fish environmental DNA in England’s largest lake. Environ. DNA 1, 26–39. doi: 10.1002/edn3.5
Lecaudey, L. A., Schletterer, M., Kuzovlev, V. V., Hahn, C., and Weiss, S. J. (2019). Fish diversity assessment in the headwaters of the Volga River using environmental DNA metabarcoding. Aqu. Conserv. Mar. Freshw. Ecosyst. 29, 1785–1800. doi: 10.1002/aqc.3163
Li, J., Hatton-Ellis, T. W., Lawson Handley, L. J., Kimbell, H. S., Benucci, M., Peirson, G., et al. (2019). Ground-truthing of a fish-based environmental DNA metabarcoding method for assessing the quality of lakes. J. Appl. Ecol. 56, 1232–1244. doi: 10.1111/1365-2664.13352
Lim, N. K., Tay, Y. C., Srivathsan, A., Tan, J. W., Kwik, J. T., Baloðlu, B., et al. (2016). Next-generation freshwater bioassessment: eDNA metabarcoding with a conserved metazoan primer reveals species-rich and reservoir-specific communities. R. Soc. Open Sci. 3:160635. doi: 10.1098/rsos.160635
Lopes, C. M., Sasso, T., Valentini, A., Dejean, T., Martins, M., Zamudio, K. R., et al. (2017). eDNA metabarcoding: a promising method for anuran surveys in highly diverse tropical forests. Mol. Ecol. Resour. 17, 904–914. doi: 10.1111/1755-0998.12643
McDevitt, A. D., Sales, N. G., Browett, S. S., Sparnenn, A. O., Mariani, S., Wangensteen, O. S., et al. (2019). Environmental DNA metabarcoding as an effective and rapid tool for fish monitoring in canals. J. Fish Biol. 95, 679–682. doi: 10.1111/jfb.14053
McGee, K. M., and Eaton, W. D. (2015). A comparison of the wet and dry season DNA-based soil invertebrate community characteristics in large patches of the bromeliad Bromelia pinguin in a primary forest in Costa Rica. Appl. Soil Ecol. 87, 99–107. doi: 10.1016/j.apsoil.2014.11.009
McGee, K. M., Robinson, C., and Hajibabaei, M. (2019). Gaps in DNA-based biomonitoring across the globe. Front. Ecol. Evol. 7:337. doi: 10.3389/fevo.2019.00337
McKee, A. M., Spear, S. F., and Pierson, T. W. (2015). The effect of dilution and the use of a post-extraction nucleic acid purification column on the accuracy, precision, and inhibition of environmental DNA samples. Biol. Conserv. 183, 70–76. doi: 10.1016/j.biocon.2014.11.031
Moher, D., Shamseer, L., Clarke, M., Ghersi, D., Liberati, A., Petticrew, M., et al. (2015). Preferred reporting items for systematic review and meta-analysis protocols (PRISMA-P) 2015 statement. Syst. Rev. 4:1.
Morey, K. C., Bartley, T. J., and Hanner, R. H. (2020). Validating environmental DNA metabarcoding for marine fishes in diverse ecosystems using a public aquarium. Environ. DNA 2, 330–342. doi: 10.1002/edn3.76
Nakagawa, H., Yamamoto, S., Sato, Y., Sado, T., Minamoto, T., and Miya, M. (2018). Comparing local-and regional-scale estimations of the diversity of stream fish using eDNA metabarcoding and conventional observation methods. Freshw. Biol. 63, 569–580. doi: 10.1111/fwb.13094
Olds, B. P., Jerde, C. L., Renshaw, M. A., Li, Y., Evans, N. T., Turner, C. R., et al. (2016). Estimating species richness using environmental DNA. Ecol. Evol. 6, 4214–4226.
Pecl, G. T., Araújo, M. B., Bell, J. D., Blanchard, J., Bonebrake, T. C., Chen, I. C., et al. (2017). Biodiversity redistribution under climate change: impacts on ecosystems and human well-being. Science 355:eaai9214.
Pont, D., Rocle, M., Valentini, A., Civade, R., Jean, P., Maire, A., et al. (2018). Environmental DNA reveals quantitative patterns of fish biodiversity in large rivers despite its downstream transportation. Sci. Rep. 8:10361.
R Core Team (2020). R: A Language and Environment for Statistical Computing. Vienna: R Foundation for Statistical Computing.
Reid, A. J., Carlson, A. K., Creed, I. F., Eliason, E. J., Gell, P. A., Johnson, P. T., et al. (2019). Emerging threats and persistent conservation challenges for freshwater biodiversity. Biol. Rev. 94, 849–873.
Sard, N. M., Herbst, S. J., Nathan, L., Uhrig, G., Kanefsky, J., Robinson, J. D., et al. (2019). Comparison of fish detections, community diversity, and relative abundance using environmental DNA metabarcoding and traditional gears. Environ. DNA 1, 368–384. doi: 10.1002/edn3.38
Sawaya, N. A., Djurhuus, A., Closek, C. J., Hepner, M., Olesin, E., Visser, L., et al. (2019). Assessing eukaryotic biodiversity in the Florida Keys National Marine Sanctuary through environmental DNA metabarcoding. Ecol. Evol. 9, 1029–1040. doi: 10.1002/ece3.4742
Schenekar, T., Schletterer, M., Lecaudey, L. A., and Weiss, S. J. (2020). Reference databases, primer choice, and assay sensitivity for environmental metabarcoding: lessons learnt from a re-evaluation of an eDNA fish assessment in the Volga headwaters. River Res. Appl. doi: 10.1002/rra.3610 [Epub ahead of print].
Sepulveda, A. J., Nelson, N. M., Jerde, C. L., and Luikart, G. (2020). Are environmental DNA methods ready for aquatic invasive species management? Trends Ecol. Evol. 35, 668–678. doi: 10.1016/j.tree.2020.03.011
Shaw, J. L., Clarke, L. J., Wedderburn, S. D., Barnes, T. C., Weyrich, L. S., and Cooper, A. (2016). Comparison of environmental DNA metabarcoding and conventional fish survey methods in a river system. Biol Conserv. 197, 131–138. doi: 10.1016/j.biocon.2016.03.010
Shogren, A. J., Tank, J. L., Andruszkiewicz, E., Olds, B., Mahon, A. R., Jerde, C. L., et al. (2017). Controls on eDNA movement in streams: transport, retention, and resuspension. Sci. Rep. 7:5065.
Shu, L., Ludwig, A., and Peng, Z. (2020). Standards for methods utilizing environmental DNA for detection of fish species. Genes 11:296. doi: 10.3390/genes11030296
Sigsgaard, E. E., Nielsen, I. B., Carl, H., Krag, M. A., Knudsen, S. W., Xing, Y., et al. (2017). Seawater environmental DNA reflects seasonality of a coastal fish community. Mar. Biol. 164:128.
Singer, G. A. C., Fahner, N. A., Barnes, J. G., McCarthy, A., and Hajibabaei, M. (2019). Comprehensive biodiversity analysis via ultra-deep patterned flow cell technology: a case study of eDNA metabarcoding seawater. Sci. Rep. 9:5991.
Sonderegger, D. L., Wang, H., Clements, W. H., and Noon, B. R. (2009). Using SiZer to detect thresholds in ecological data. Front. Ecol. Environ. 7:190–195. doi: 10.1890/070179
Stat, M., Huggett, M. J., Bernasconi, R., DiBattista, J. D., Berry, T. E., Newman, S. J., et al. (2017). Ecosystem biomonitoring with eDNA: metabarcoding across the tree of life in a tropical marine environment. Sci. Rep. 7:12240.
Stat, M., John, J., DiBattista, J. D., Newman, S. J., Bunce, M., and Harvey, E. S. (2018). Combined use of eDNA metabarcoding and video surveillance for the assessment of fish biodiversity. Conserv. Biol. 33, 196–205. doi: 10.1111/cobi.13183
Stoeckle, M. Y., Das Mishu, M., and Charlop-Powers, Z. (2020). Improved environmental dna reference library detects overlooked marine fishes in New Jersey, United States. Front. Mar. Sci. 7:226. doi: 10.3389/fmars.2020.00226
Stoeckle, M. Y., Soboleva, L., and Charlop-Powers, Z. (2017). Aquatic environmental DNA detects seasonal fish abundance and habitat preference in an urban estuary. PLoS One 12:e0175186. doi: 10.1371/journal.pone.0175186
Thomsen, P. F., Kielgast, J., Iversen, L. L., Møller, P. R., Rasmussen, M., and Willerslev, E. (2012). Detection of a diverse marine fish fauna using environmental DNA from seawater samples. PLoS One 7:e41732. doi: 10.1371/journal.pone.0041732
Thomsen, P. F., Møller, P. R., Sigsgaard, E. E., Knudsen, S. W., Jørgensen, O. A., and Willerslev, E. (2016). Environmental DNA from seawater samples correlate with trawl catches of subarctic, deepwater fishes. PLoS One 11:e0165252. doi: 10.1371/journal.pone.0165252
Thomsen, P. F., and Willerslev, E. (2015). Environmental DNA–An emerging tool in conservation for monitoring past and present biodiversity. Biol. Conserv. 183, 4–18. doi: 10.1016/j.biocon.2014.11.019
Tilman, D., Clark, M., Williams, D. R., Kimmel, K., Polasky, S., and Packer, C. (2017). Future threats to biodiversity and pathways to their prevention. Nature 546, 73–81. doi: 10.1038/nature22900
Trisos, C. H., Merow, C., and Pigot, A. L. (2020). The projected timing of abrupt ecological disruption from climate change. Nature 580, 496–501. doi: 10.1038/s41586-020-2189-9
Ushio, M., Fukuda, H., Inoue, T., Makoto, K., Kishida, O., Sato, K., et al. (2017). Environmental DNA enables detection of terrestrial mammals from forest pond water. Mol. Ecol. Resour. 17, e63–e75. doi: 10.1111/1755-0998.12690
Ushio, M., Murakami, H., Masuda, R., Sado, T., Miya, M., Sakurai, S., et al. (2018). Quantitative monitoring of multispecies fish environmental DNA using high-throughput sequencing. Metabarcod. Metagenomics 2:e23297. doi: 10.1101/113472
Valdez-Moreno, M., Ivanova, N. V., Elias-Gutierrez, M., Pedersen, S. L., Bessonov, K., and Hebert, P. D. (2019). Using eDNA to biomonitor the fish community in a tropical oligotrophic lake. PLoS One 14:e0215505. doi: 10.1371/journal.pone.0215505
Valentini, A., Taberlet, P., Miaud, C., Civade, R., Herder, J., Thomsen, P. F., et al. (2016). Next-generation monitoring of aquatic biodiversity using environmental DNA metabarcoding. Mol. Ecol. 25, 929–942. doi: 10.1111/mec.13428
Yamamoto, S., Masuda, R., Sato, Y., Sado, T., Araki, H., Kondoh, M., et al. (2017). Environmental DNA metabarcoding reveals local fish communities in a species-rich coastal sea. Sci. Rep. 7:40368. doi: 10.1038/srep40368
Yoccoz, N. G., Bråthen, K. A., Gielly, L., Haile, J., Edwards, M. E., Goslar, T., et al. (2012). DNA from soil mirrors plant taxonomic and growth form diversity. Mol. Ecol. 21, 3647–3655. doi: 10.1111/j.1365-294X.2012.05545.x
Zhang, G. K., Chain, F. J., Abbott, C. L., and Cristescu, M. E. (2018). Metabarcoding using multiplexed markers increases species detection in complex zooplankton communities. Evol. Appl. 11, 1901–1914. doi: 10.1111/eva.12694
Keywords: bland-altman analysis, Lin’s concordance correlation coefficient, high-throughput sequencing, marine, freshwater, eDNA
Citation: McElroy ME, Dressler TL, Titcomb GC, Wilson EA, Deiner K, Dudley TL, Eliason EJ, Evans NT, Gaines SD, Lafferty KD, Lamberti GA, Li Y, Lodge DM, Love MS, Mahon AR, Pfrender ME, Renshaw MA, Selkoe KA and Jerde CL (2020) Calibrating Environmental DNA Metabarcoding to Conventional Surveys for Measuring Fish Species Richness. Front. Ecol. Evol. 8:276. doi: 10.3389/fevo.2020.00276
Received: 06 May 2020; Accepted: 03 August 2020;
Published: 28 August 2020.
Edited by:
Hiroki Yamanaka, Ryukoku University, JapanReviewed by:
Elizabeth Andruszkiewicz Allan, Woods Hole Oceanographic Institution, United StatesSatoshi Yamamoto, Kyoto University, Japan
Copyright © 2020 McElroy, Dressler, Titcomb, Wilson, Deiner, Dudley, Eliason, Evans, Gaines, Lafferty, Lamberti, Li, Lodge, Love, Mahon, Pfrender, Renshaw, Selkoe and Jerde. This is an open-access article distributed under the terms of the Creative Commons Attribution License (CC BY). The use, distribution or reproduction in other forums is permitted, provided the original author(s) and the copyright owner(s) are credited and that the original publication in this journal is cited, in accordance with accepted academic practice. No use, distribution or reproduction is permitted which does not comply with these terms.
*Correspondence: Christopher L. Jerde, cjerde@ucsb.edu