the Creative Commons Attribution 4.0 License.
the Creative Commons Attribution 4.0 License.
 | 28 Aug 2020
Technical note: Estimating light-use efficiency of benthic habitats using underwater O2 eddy covariance
Karl M. Attard
Ronnie N. Glud
Light-use efficiency defines the ability of primary producers to convert sunlight energy to primary production and is computed as the ratio between the gross primary production and the intercepted photosynthetic active radiation. While this measure has been applied broadly within terrestrial ecology to investigate habitat resource-use efficiency, it remains underused within the aquatic realm. This report provides a conceptual framework to compute hourly and daily light-use efficiency using underwater O2 eddy covariance, a recent technological development that produces habitat-scale rates of primary production under unaltered in situ conditions. The analysis, tested on two benthic flux datasets, documents that hourly light-use efficiency may approach the theoretical limit of 0.125 O2 per photon under low-light conditions, but it decreases rapidly towards the middle of the day and is typically 10-fold lower on a 24 h basis. Overall, light-use efficiency provides a useful measure of habitat functioning and facilitates site comparison in time and space.


1.1 Light-use efficiency
Gross primary production can be formulated as the product of incident photosynthetic active radiation (PAR), the fraction of absorbed PAR (fAPAR), and the light-use efficiency (LUE), that is GPP = PAR × fAPAR × LUE (Monteith et al., 1977). The LUE indicates the efficiency with which absorbed PAR is converted to GPP and provides a measure of the physiological and environmental limitation of photosynthetic production. This approach has been applied broadly within the atmospheric sciences to investigate crop yield, productivity, and resource-use efficiency among terrestrial biomes using eddy covariance flux tower data (Stocker et al., 2018; Hemes et al., 2020). In aquatic environments, the LUE concept may be applied to both phytoplankton and benthic photosynthetic production, providing a means to compare benthic and pelagic compartments and to obtain an overall ecosystem assessment. Phytoplankton studies typically investigate the quantum yield of photosynthetic production (Falkowski, 1992), whereas benthic studies have examined LUE on the microscale to quantify energy budgets of photosynthetic microbial mats and symbiont-bearing corals (Al-Najjar et al., 2010, 2012; Brodersen et al., 2014). These microscale measurements reveal that most (>80 %) of the incident solar energy is dissipated as heat, and conservation by photosynthesis typically is <5 %. Despite low energy utilization, some benthic ecosystems such as coral reef symbionts seem particularly efficient at converting PAR to GPP, with LUE approaching the theoretical limit of 8 mol photons of PAR required to produce 1 mol of O2 through GPP (or 0.125 O2 per photon) (Brodersen et al., 2014). Studies applying the LUE approach to larger spatial scales of the sea floor are rare. To our knowledge there is one study using chamber incubations that employs the LUE approach to investigate benthic community primary production in lakes (Godwin et al., 2014), so there is much scope to port LUE concepts to other emerging methods.
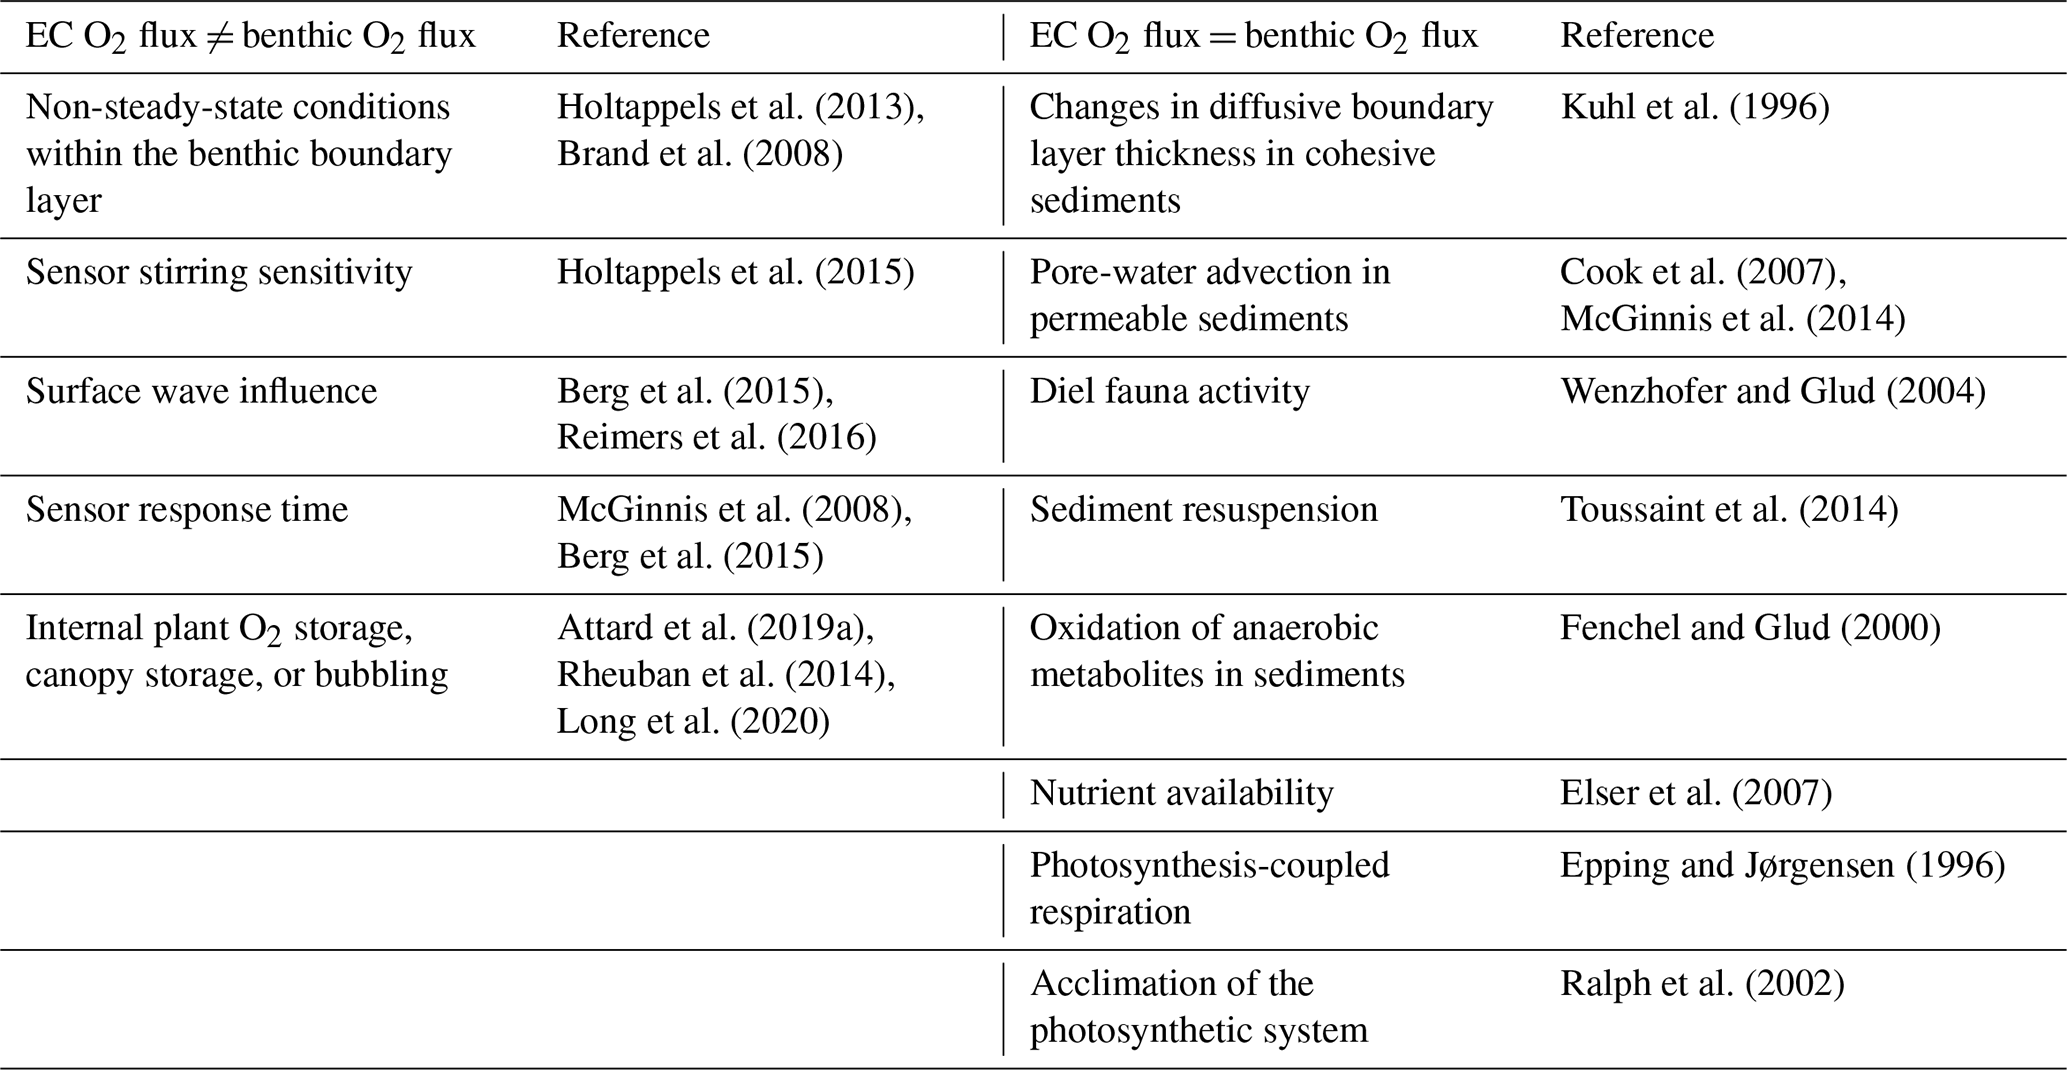
Table 1Sources of EC flux variability can be broadly grouped into two categories: (1) sources that bias the measured EC flux away from the “true” benthic flux (i.e. when EC O2 flux ≠ benthic O2 flux) and (2) “true” temporal variability in the benthic O2 exchange rate (i.e. when EC O2 flux = benthic O2 flux)
1.2 Eddy covariance estimates of benthic primary production
Underwater eddy covariance (EC) is a recent technological development that has emerged as an important tool in benthic primary production studies. One of its key attributes is that it generates benthic O2 fluxes at a high temporal resolution (typically ∼15 min) over several days, and it does so for large sea floor areas (tens of square metres, i.e. on a habitat scale) and under unaltered in situ conditions (Berg et al., 2007, 2017). Eddy covariance thus overcomes many of the limitations of traditional methods (e.g. chamber incubations) and enables primary production rates to be measured within a wide range of benthic habitats (Chipman et al., 2016; Hume et al., 2011; Long et al., 2013; Volaric et al., 2018; Attard et al., 2019b). Additionally, the EC method can resolve very small benthic fluxes down to ∼1 mmol O2 m−2 d−1 or less (Berg et al., 2009; Donis et al., 2016), which allows reliable measurements of primary production to be made in low-activity benthic settings, such as in high-latitude environments in winter and in deep phototrophic communities (Attard et al., 2014, 2016). Applying the LUE approach to EC data will therefore provide a useful measure of the efficiency with which solar energy is converted to GPP on the spatial scale of whole habitats.
1.3 Constraining hourly and daily GPP
Sources of variability within EC O2 fluxes can be broadly grouped into two categories, namely (1) sources that bias the measured EC flux away from the “true” benthic flux (i.e. when EC O2 flux ≠ benthic O2 flux) and (2) “true” temporal variability in the benthic O2 exchange rate (i.e. when EC O2 flux = benthic O2 flux) (Table 1). Despite there being numerous sources of variability, high-quality EC fluxes often show a tight coupling to sunlight (photosynthetic active radiation, PAR) availability on the hourly timescale, indicating a dominant primary production signal in many aquatic systems (Berg et al., 2013; Chipman et al., 2016; Attard et al., 2014, 2015; Rheuban et al., 2014; Long et al., 2013, 2015; Koopmans et al., 2020; Rovelli et al., 2017).
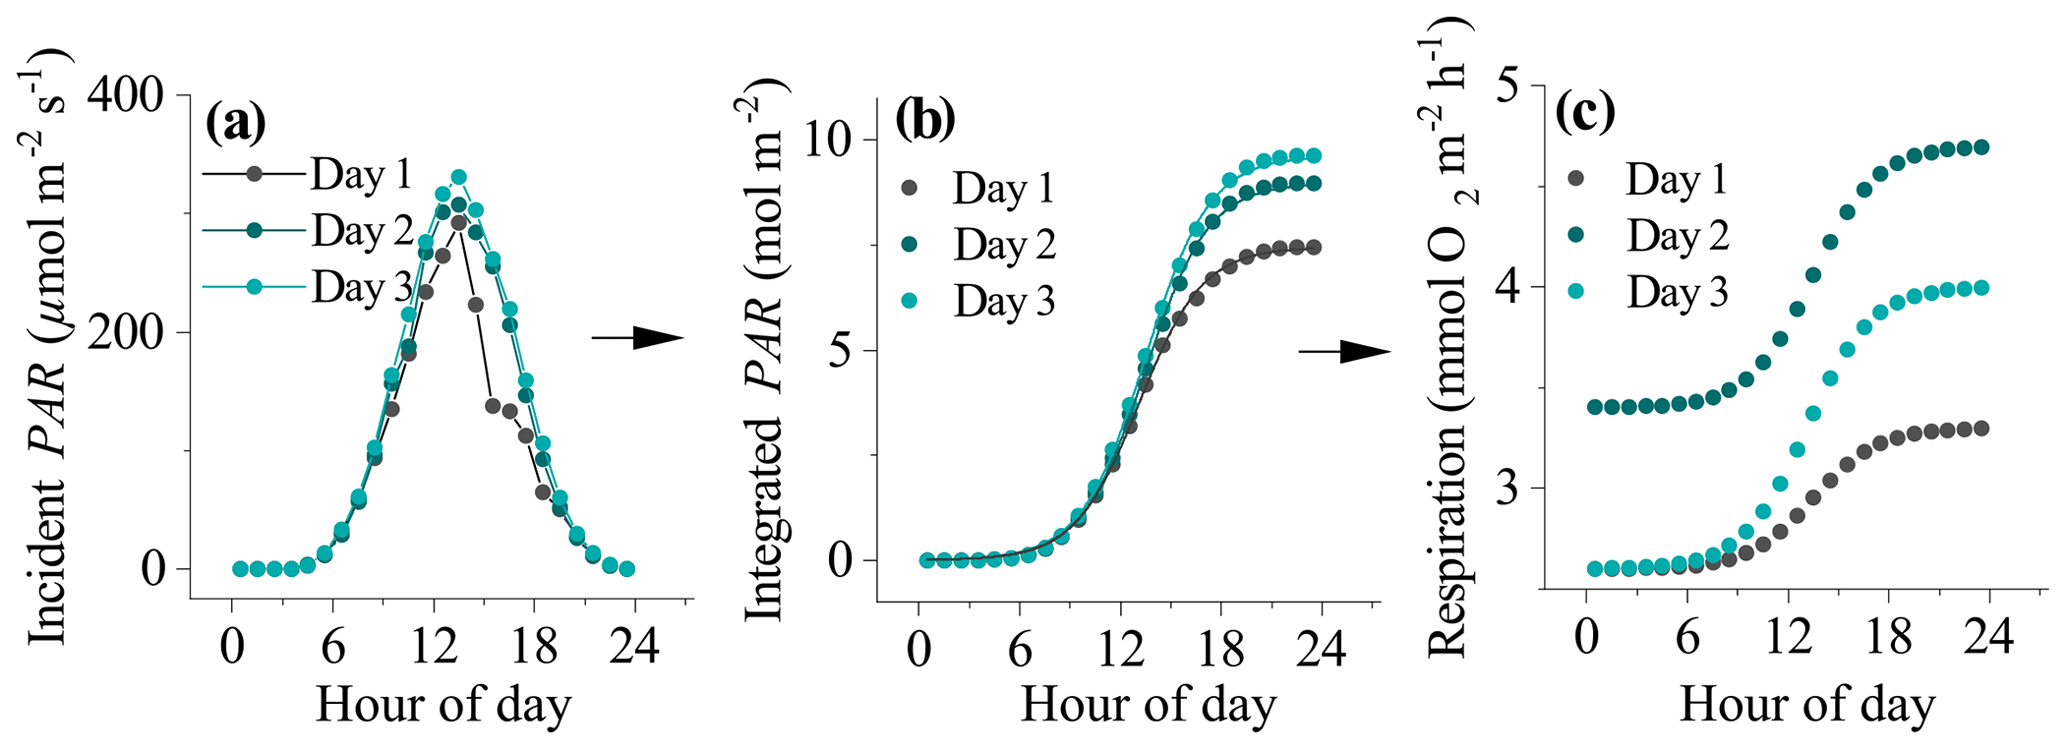
Figure 1The process used to derive daytime respiration rates for datasets impacted by hysteresis. (a) Incident seabed PAR, (b) integrated PAR, and (c) estimated hourly respiration rates. The line of best fit to the data in (b) is a Boltzmann function (R2>0.99). The fitting parameters were used to determine the shape of the respiration curve in (c) from night-time flux periods to (see text).
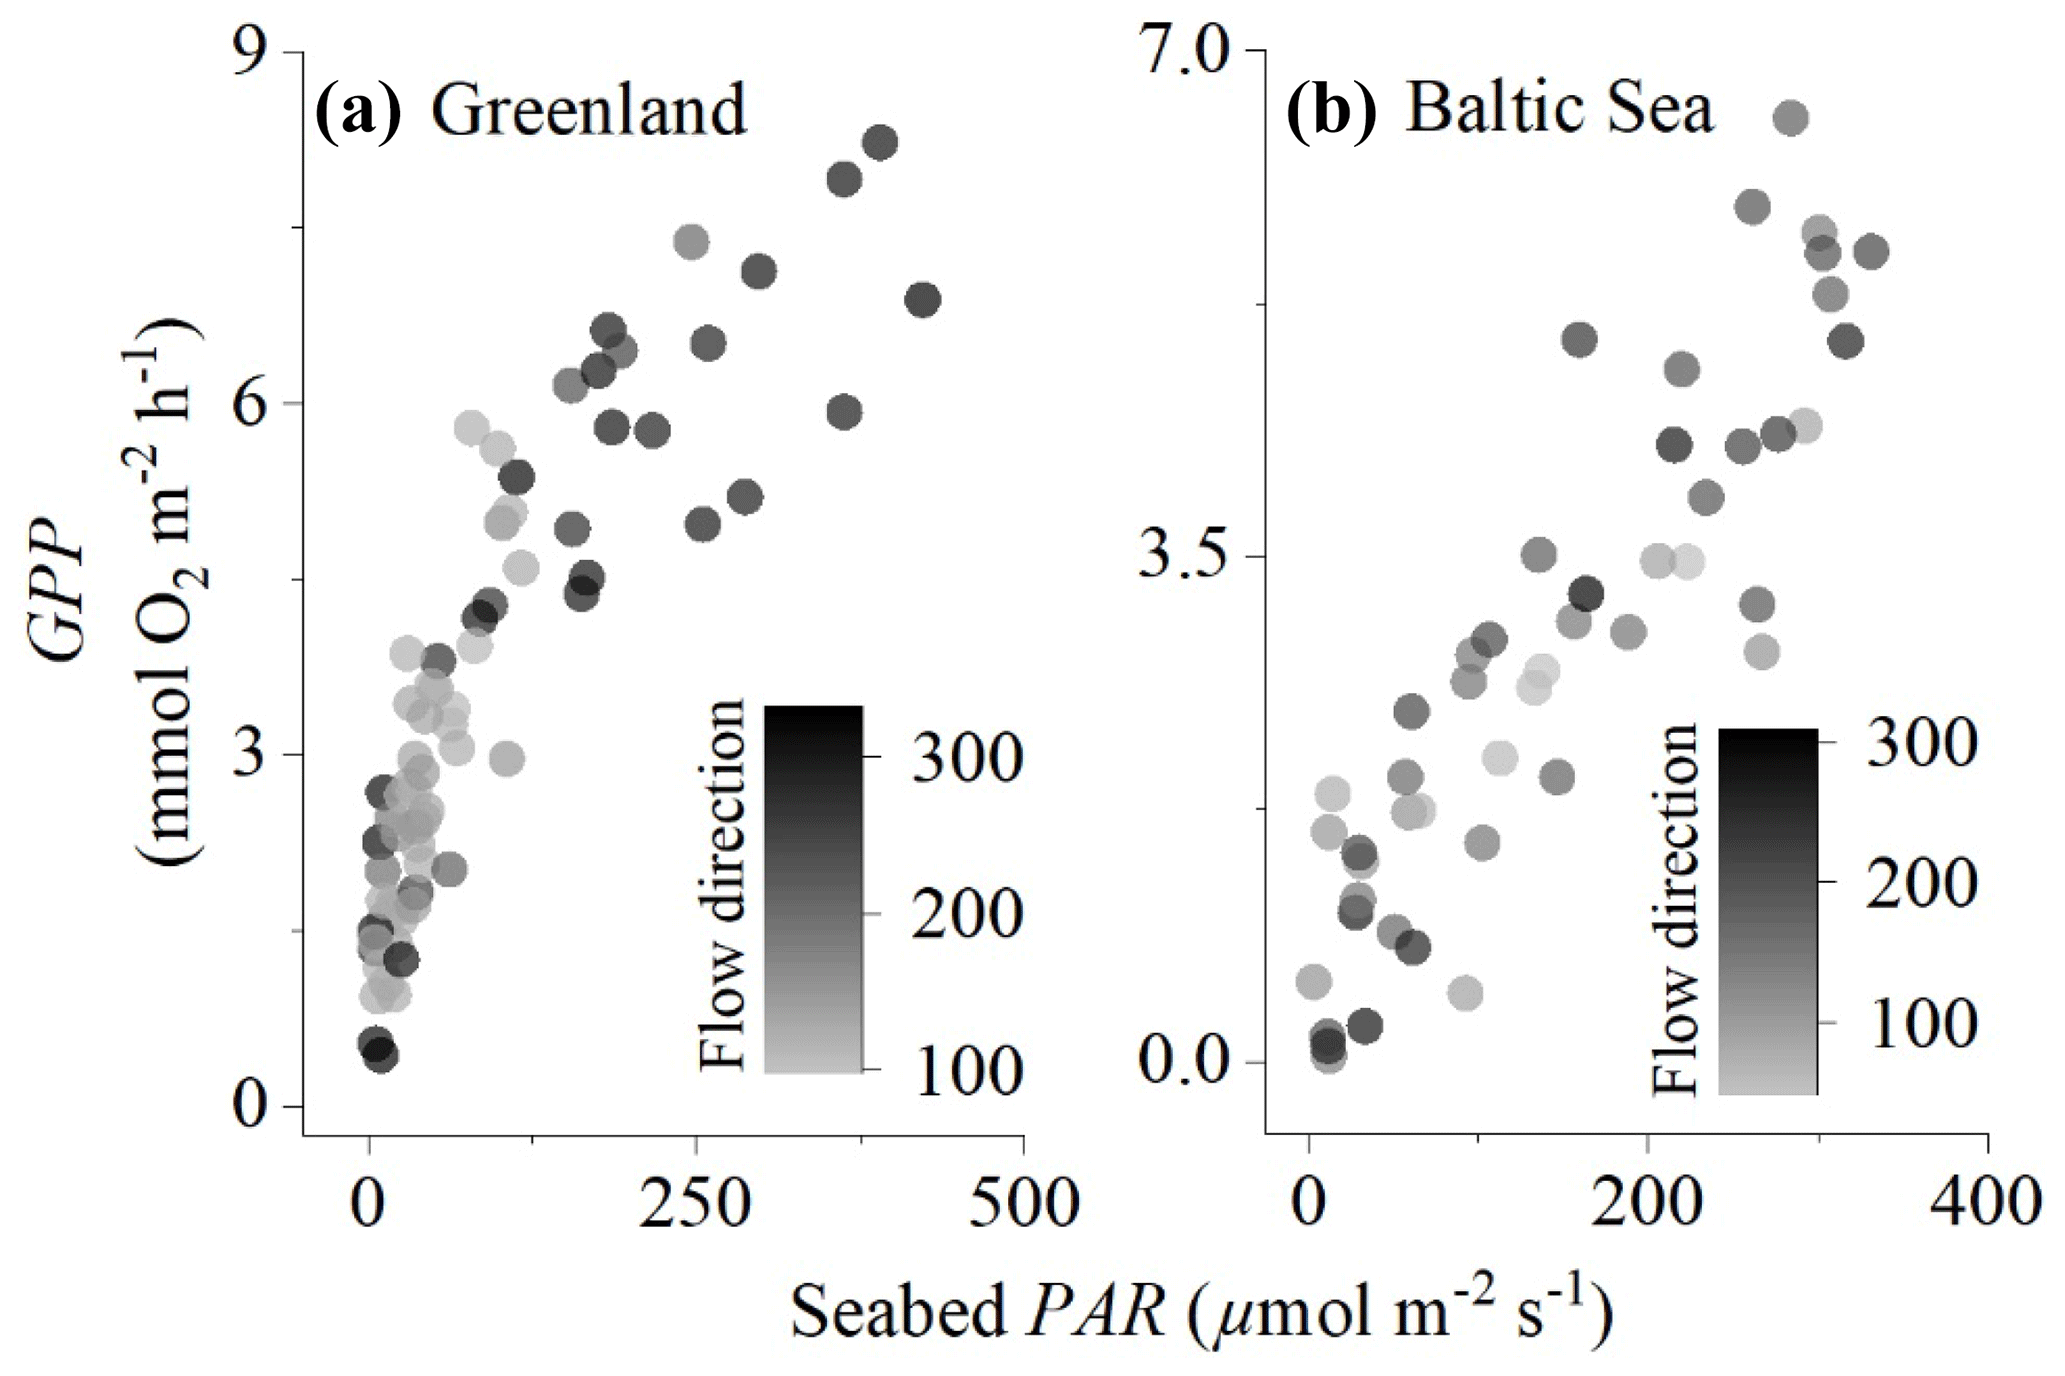
Figure 2Comparison of eddy covariance fluxes for (a) the sedimentary embayment in Greenland and (b) the rocky mussel reef in the Baltic Sea. Flow direction (instrument degrees) illustrates that different parts of the sea floor were included in the measurements, but this did not substantially impact the magnitude of the fluxes.
Under ideal conditions, the measured EC fluxes represent the balance between habitat GPP and R. Hourly and daily GPP may therefore be computed from the EC fluxes as the sum of dark and light fluxes, that is GPP. It is well known that this approach provides conservative estimates of GPP, since R typically is higher during daytime in the presence of photosynthesis (Fenchel and Glud, 2000; Hotchkiss and Hall, 2014). Indeed, several EC studies have documented lower O2 effluxes in the evening than in the morning under similar light intensities (a so-called “hysteresis”) and high R rates at the onset of darkness (Rovelli et al., 2017; Rheuban et al., 2014; Koopmans et al., 2020). It is generally understood that R is stimulated by GPP; it increases progressively throughout the day as labile photosynthates accumulate (Epping and Jørgensen, 1996; de Winder et al., 1999), and the magnitude of the hysteresis is related to the lag in the ecosystem's response (in terms of O2 production through GPP) to changing light levels (Adams et al., 2016). While it is highly relevant to quantify daytime R, direct measurements are usually not available. A key requirement for computing the LUE is to have reliable estimates of GPP. In this report we will therefore aim to provide a conceptual framework for computing hourly GPP from EC fluxes and from this compute the LUE. We then test this approach on measured EC flux data.
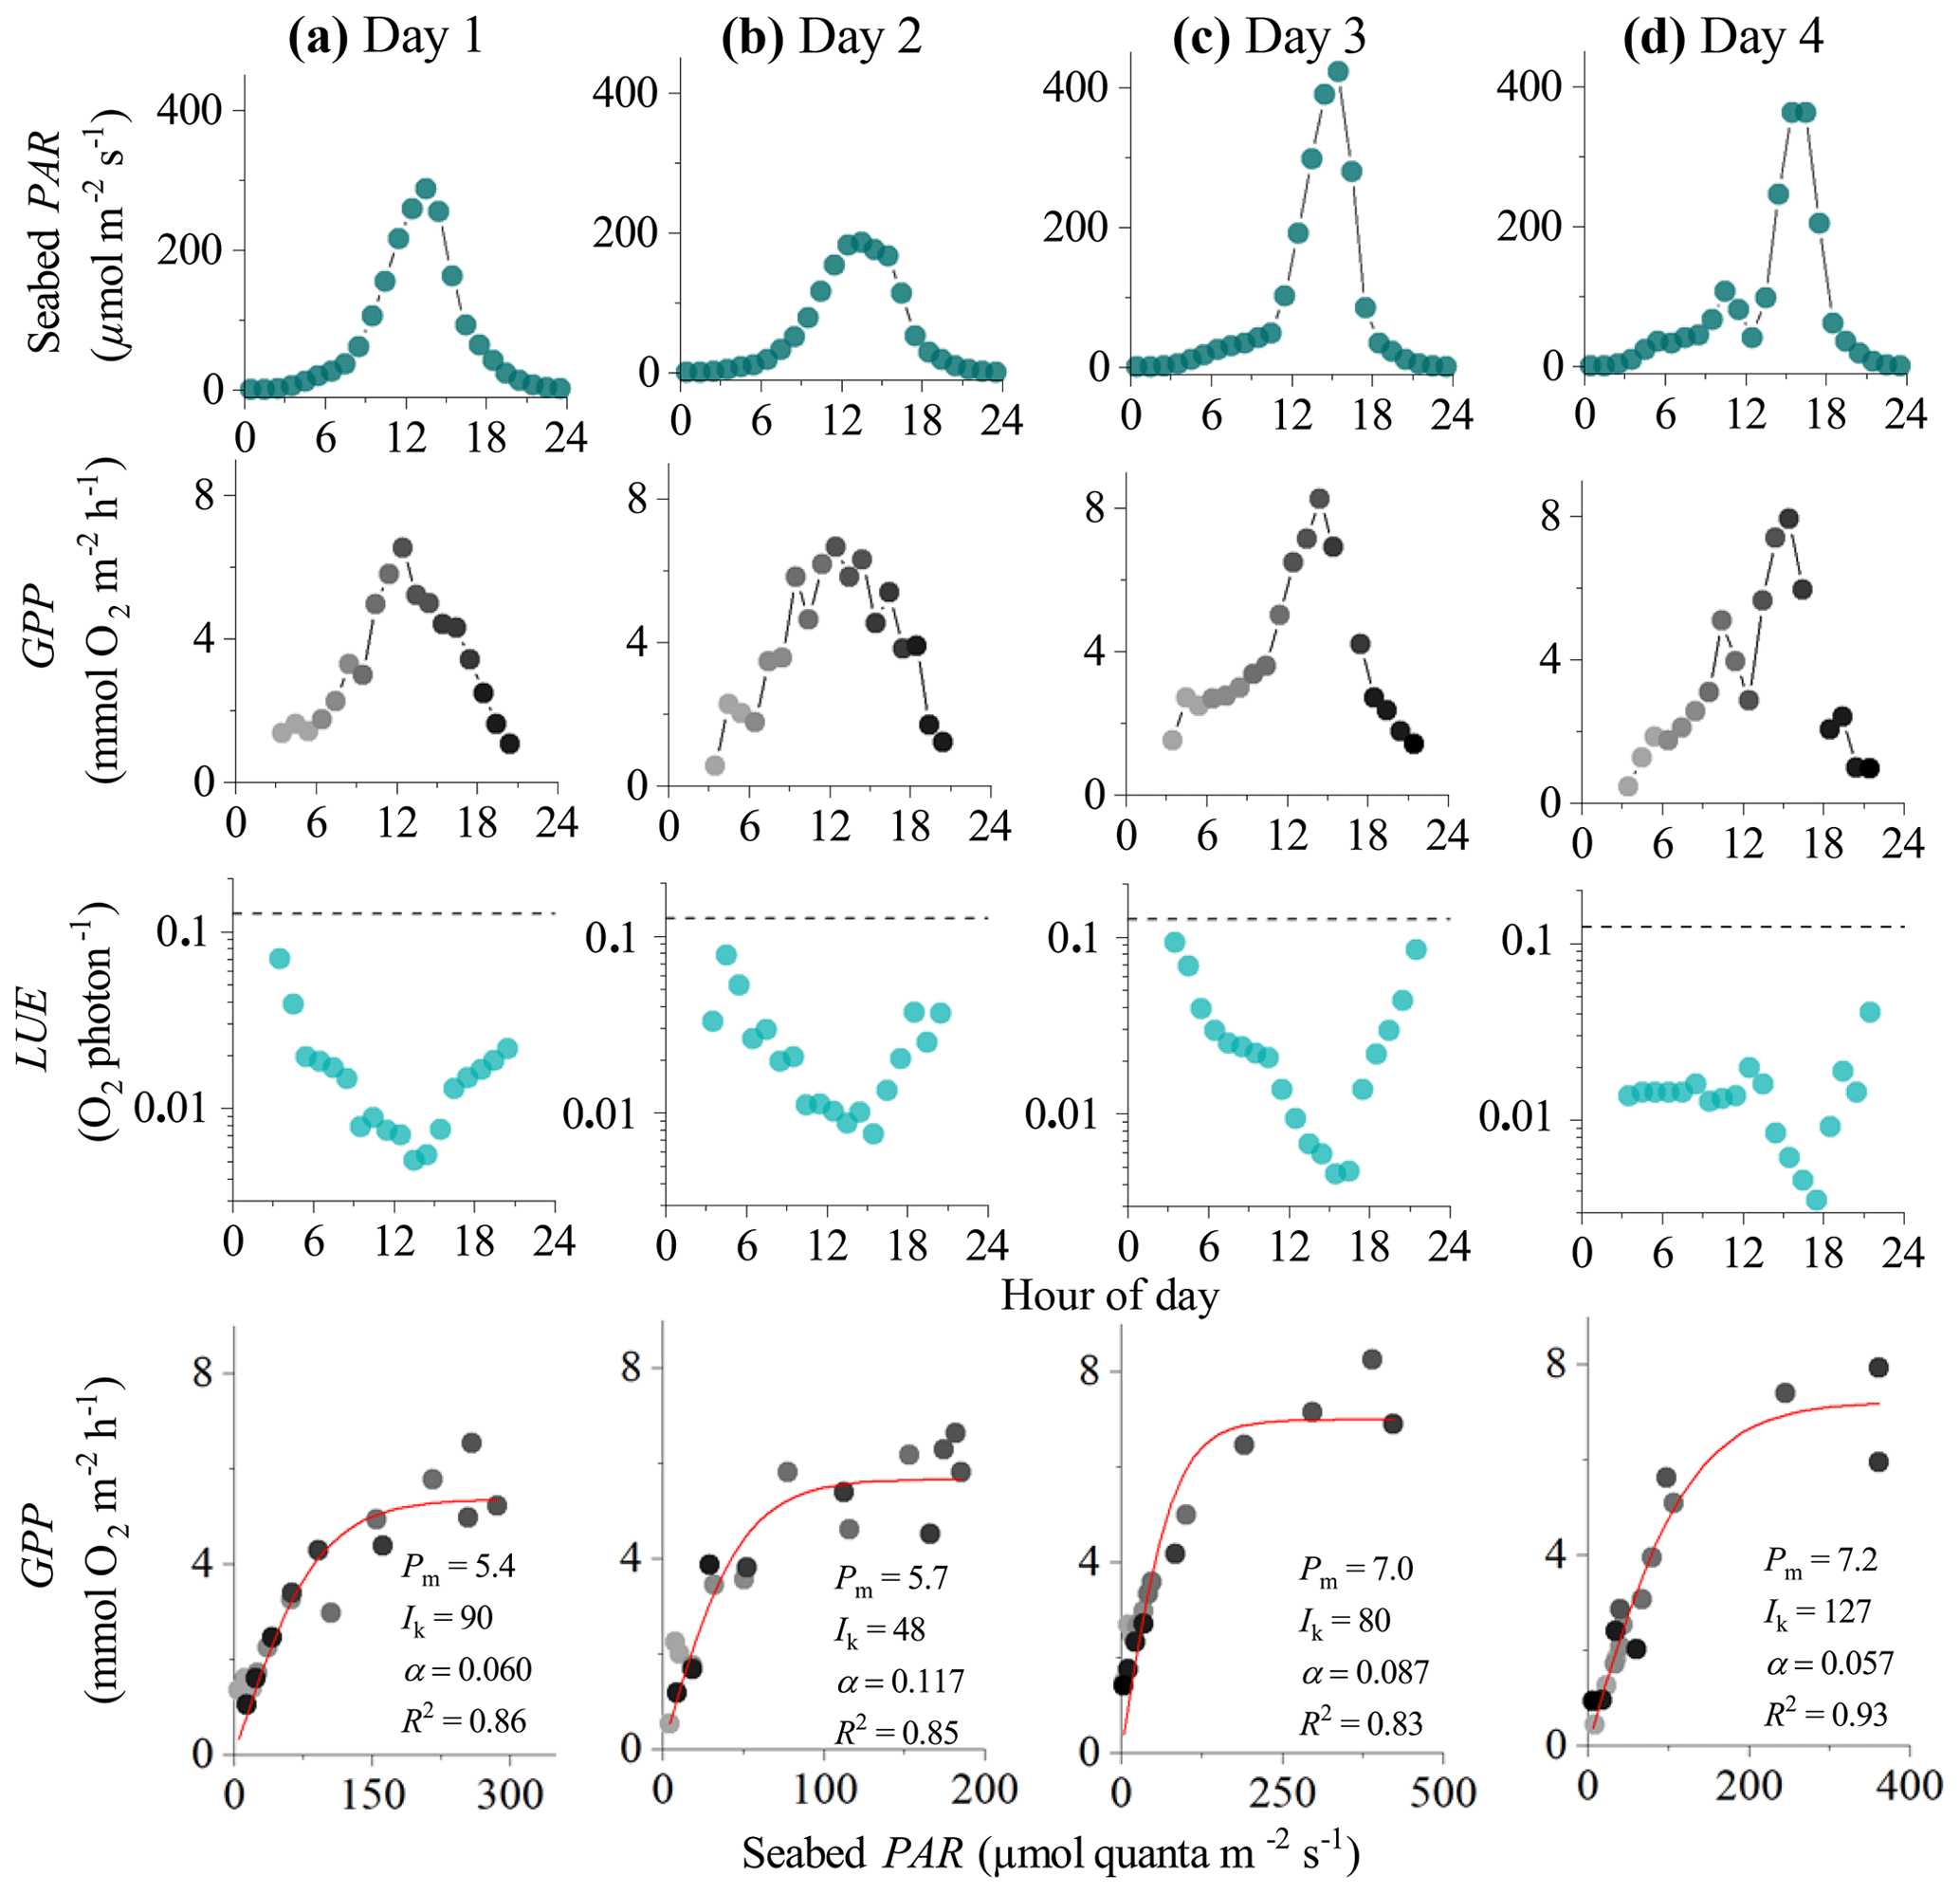
Figure 3Eddy covariance data measured over 4 consecutive days in the sedimentary embayment in Greenland showing seabed PAR (top panels), hourly GPP (b), estimated hourly LUE (c; dashed lines indicate theoretical limit), and corresponding light saturation curves (bottom panels). Symbols in the second and fourth rows are colour-mapped by hour of day. Light saturation curves are fitted to the data showing the maximum rate of GPP (Pm, mmol O2 m−2 h−1), the photoadaptation parameter Ik (µmol PAR m−2 s−1), the initial slope of the curve α, and the coefficient of determination (R2). Data modified from Attard et al. (2014).
2.1 Eddy covariance data
This study uses 4 d of EC data from Attard et al. (2014) and a 3 d dataset from Attard et al. (2020). Attard et al. (2014) performed seasonal measurements at subtidal (3–22 m depth) light-exposed benthic habitats in a sub-Arctic fjord in Greenland. This study uses a dataset from a protected inlet of ∼3 km2 located at 3 m water depth at mean low water. The seabed had silt–sand sediments and was exposed to semi-diurnal tidal currents with flow velocities typically ranging from 2 to 10 cm s−1. Attard et al. (2020) conducted their seasonal study on a 5 m deep rocky mussel reef in the Baltic Sea. Two flux datasets were selected from these two studies to represent datasets with and without flux hysteresis. Instrument setup and data processing are described in detail in these papers. In short, the EC instrumentation consisted of a single-point acoustic velocimeter (Vector, Nortek), a fast-response O2 microsensor setup (McGinnis et al., 2011), and a downwelling cosine PAR sensor (QCP-2000, Biospherical Instruments or LI-192, Li-Cor) mounted onto the frame. The instrument was deployed from a small research vessel and was left to collect data over several days. Benthic O2 fluxes were extracted for consecutive 10 or 15 min periods using the software package SOHFEA (McGinnis et al., 2014), and the fluxes were bin-averaged to 1 h for interpretation.
The location of the interrogated area of the sea floor changes with a change in flow direction. Eddy covariance measurements typically assume no horizontal flux divergence since the measurements integrate over small-scale patchiness (Rheuban and Berg, 2013). We evaluated whether this was the case by plotting hourly GPP against seabed PAR for different flow components. The effects of flow velocity on the O2 fluxes for these datasets were evaluated by Attard et al. (2014) and Attard et al. (2020), who found significant positive relationships between flow velocity and flux magnitude during day and night in Greenland and during the night but not during the day in the Baltic Sea.
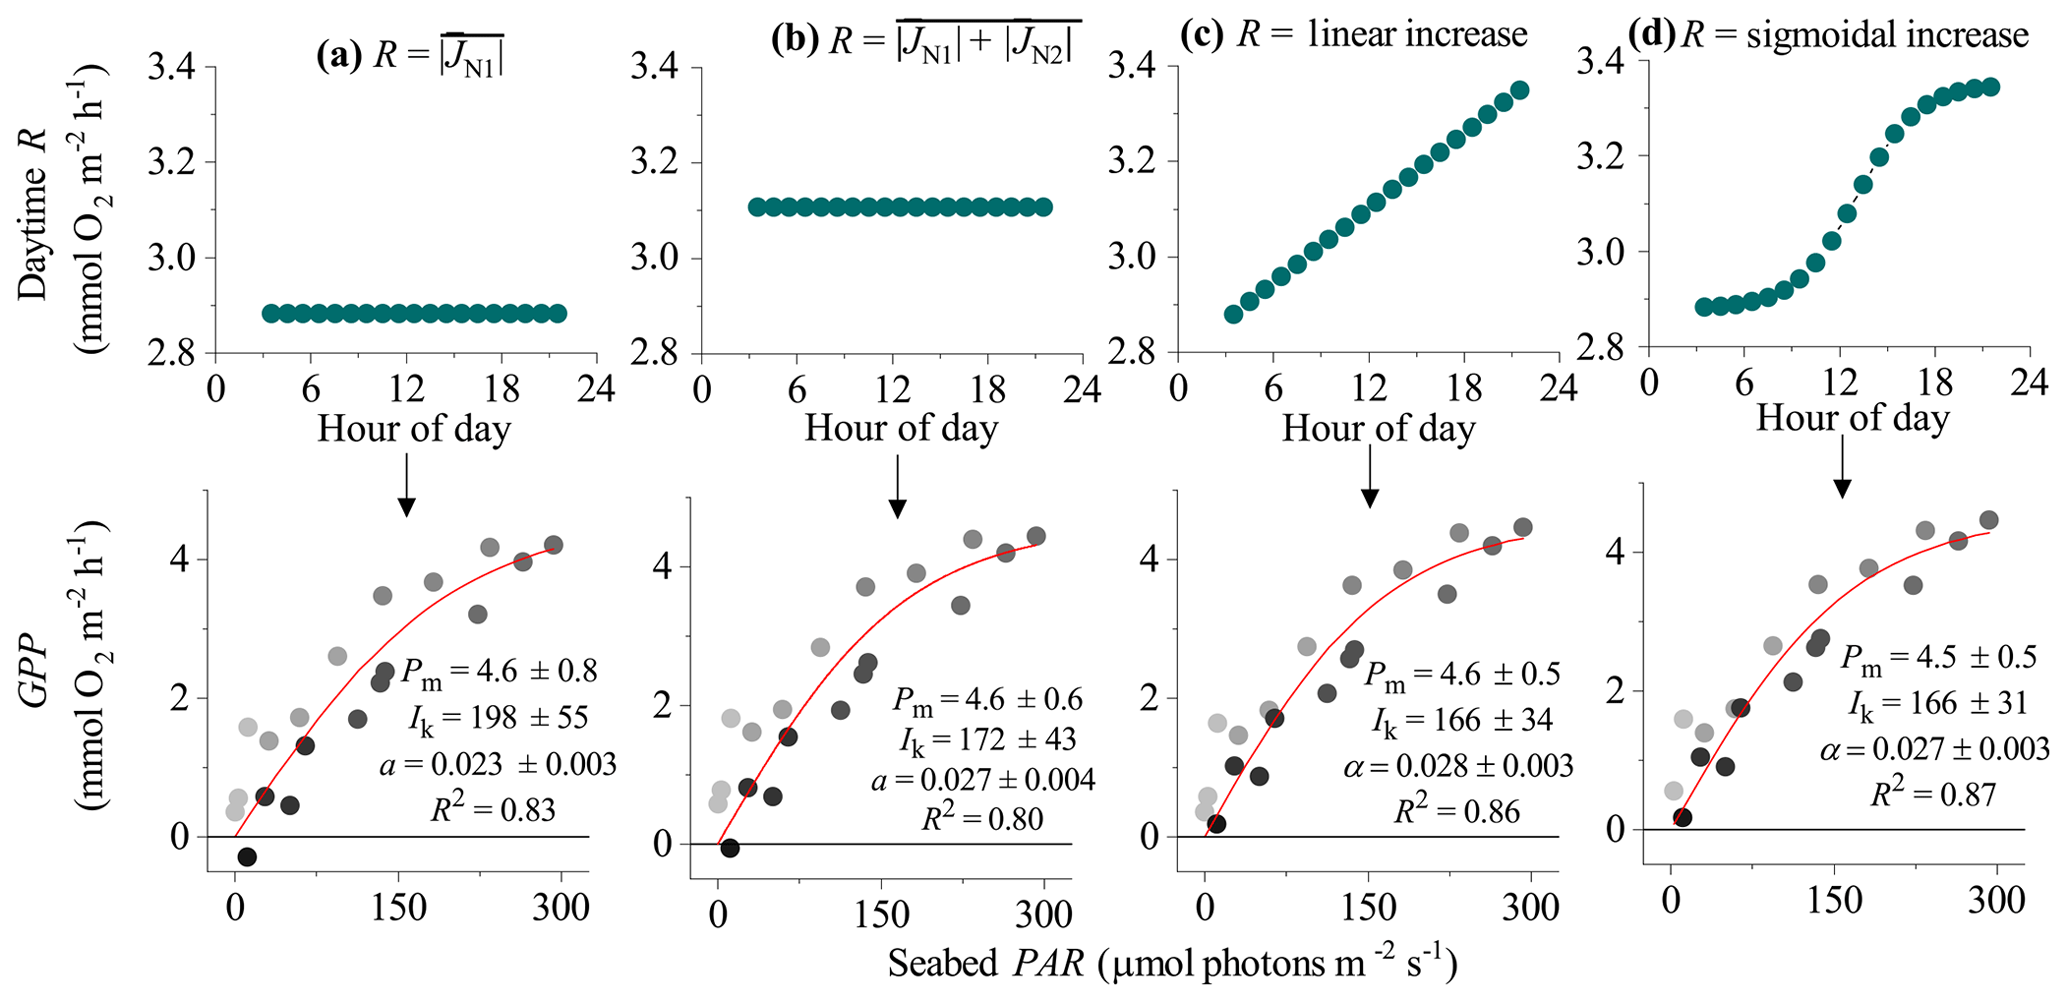
Figure 4Different approaches for defining the R rate during the day (and therefore the hourly GPP) from eddy covariance fluxes showing hysteresis: (a) R is the average flux for the first night-time flux period (), (b) R is the average flux for both night-time periods (), (c) R increases linearly from to , and (d) R increases from to following a sigmoidal curve. Bottom panels show corresponding light saturation curves and fitting parameters for the maximum rate of GPP (Pm, mmol O2 m−2 h−1), the photoadaptation parameter Ik (µmol PAR m−2 s−1), the initial slope of the curve α, and the coefficient of determination (R2). Symbols in the bottom panels are colour-mapped by hour of day. Data modified from Attard et al. (2020).
2.2 Computing hourly GPP
2.2.1 Defining a daytime R rate
Time series of EC fluxes were split into individual 24 h sections representing periods from midnight to midnight. Each 24 h time series was aligned with corresponding seabed PAR data. Daytime periods were defined as periods when PAR>2.0 µmol m−2 s−1. Each 24 h section therefore had two night-time flux periods: the first from midnight to sunrise (JN1) and the second from sunset to midnight (JN2). Four options for computing the daytime R rate were explored. The first two approaches assumed a static R rate during the day whereas the third and fourth approaches assumed dynamic (time-variable) daytime R. In the first approach, daytime fluxes were offset by , and in the second approach daytime R was defined as an average of JN1 and JN2 fluxes (). These two approaches are expected to work best when O2 fluxes do not show a hysteresis. However, for other datasets that do show substantial hysteresis, this approach might underestimate R (and therefore GPP) in the second half of the day. The third and fourth approaches attempt to correct for this by assuming a dynamic hourly daytime R rate that increases progressively throughout the day. The third approach assumes a linear increase in hourly daytime R with time from to , whereas the fourth approach assumes that R increased with cumulative PAR. This was represented as a sigmoidal increase with time from to in concert with changes in seabed PAR. To calculate the shape of the sigmoidal curve for this fourth approach, the time series of PAR observations (PARo) were integrated over time, and the resultant data were fitted with a sigmoidal (Boltzmann) function as
where A1 and A2 were the initial and final PAR values, PARm is modelled PAR, x0 is the centre of the curve, and dt is a time constant. This function gave very tight fits to the integrated PAR measurements (R2>0.99). The fitting parameters x0 and dt were then used to define the sigmoidal increase in daytime respiration from A1 to A2 ( to ) (Fig. 1). Hourly daytime R rates were computed using this approach and then summed with their corresponding measured daytime flux to compute the GPP.
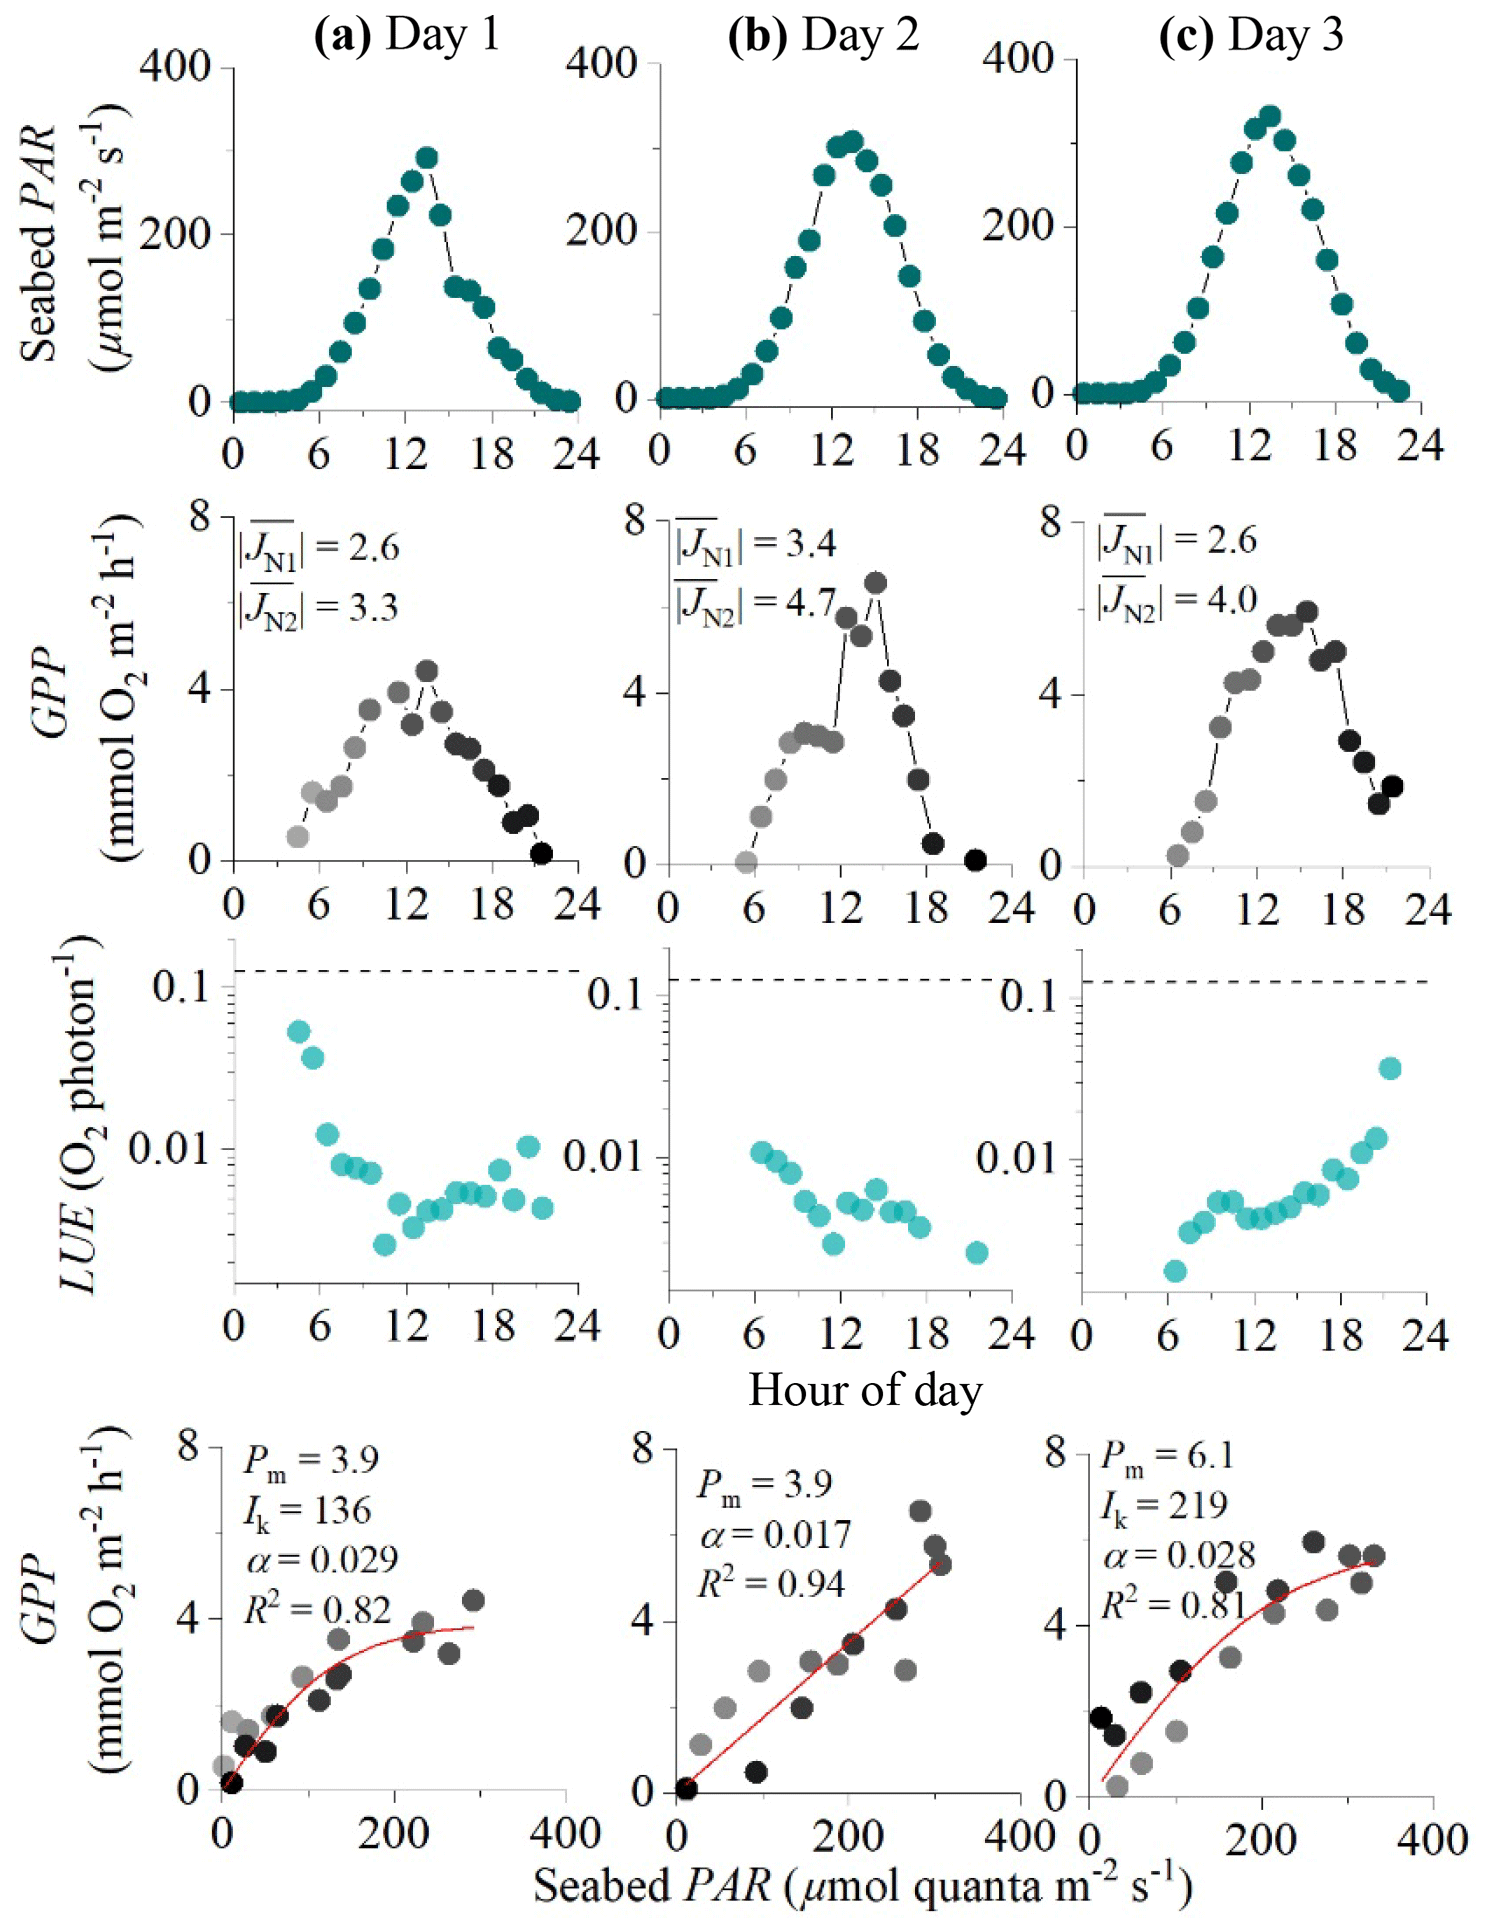
Figure 5Eddy covariance data measured over 3 consecutive days in the rocky mussel reef in the Baltic Sea showing seabed PAR (top panels), hourly GPP (second row), estimated hourly LUE (third row; dashed lines indicate theoretical limit), and corresponding light saturation curves (bottom panels). Symbols in the middle and bottom panels are colour-mapped by hour of day. Light saturation curves are fitted to the data showing the maximum rate of GPP (Pm, mmol O2 m−2 h−1), the photoadaptation parameter Ik (µmol PAR m−2 s−1), the initial slope of the curve α, and the coefficient of determination (R2). For each 24 h period, average fluxes for the first and second night-time periods are shown in the middle panels ( and , mmol O2 m−2 h−1). Data modified from Attard et al. (2020).
2.2.2 Light saturation curves
The ability of the four approaches to produce reliable estimates of hourly GPP was evaluated using light saturation curves. Several mathematical formulations are available to investigate photosynthetic performance (Jassby and Platt, 1976), but benthic studies typically use linear regression or the tangential hyperbolic function by Platt et al. (1980):
where Pm is the maximum rate of benthic gross primary production (mmol O2 m−2 h−1), I is the near-bed irradiance (PAR; µmol photons m−2 s−1), and α is the quasi-linear initial slope of the curve (mmol O2 m−2 h−1, µmol PAR m−2 s−1). From these curves it is possible to derive the photoadaptation parameter Ik (µmol PAR m−2 s−1) as . If we assume that hourly benthic GPP is predominantly driven by PAR, then high-quality light saturation curves for GPP should (a) show a high correlation with PAR (high R2 value) and (b) have a low standard error for the fitting parameters Pm, α, and Ik. High-quality hourly GPP values should also be non-negative. Non-linear curve fitting was performed in OriginPro 2020 using a Levenberg–Marquardt iteration algorithm, and the standard error of the fitting parameters was scaled with the square root of the reduced chi-squared statistic.
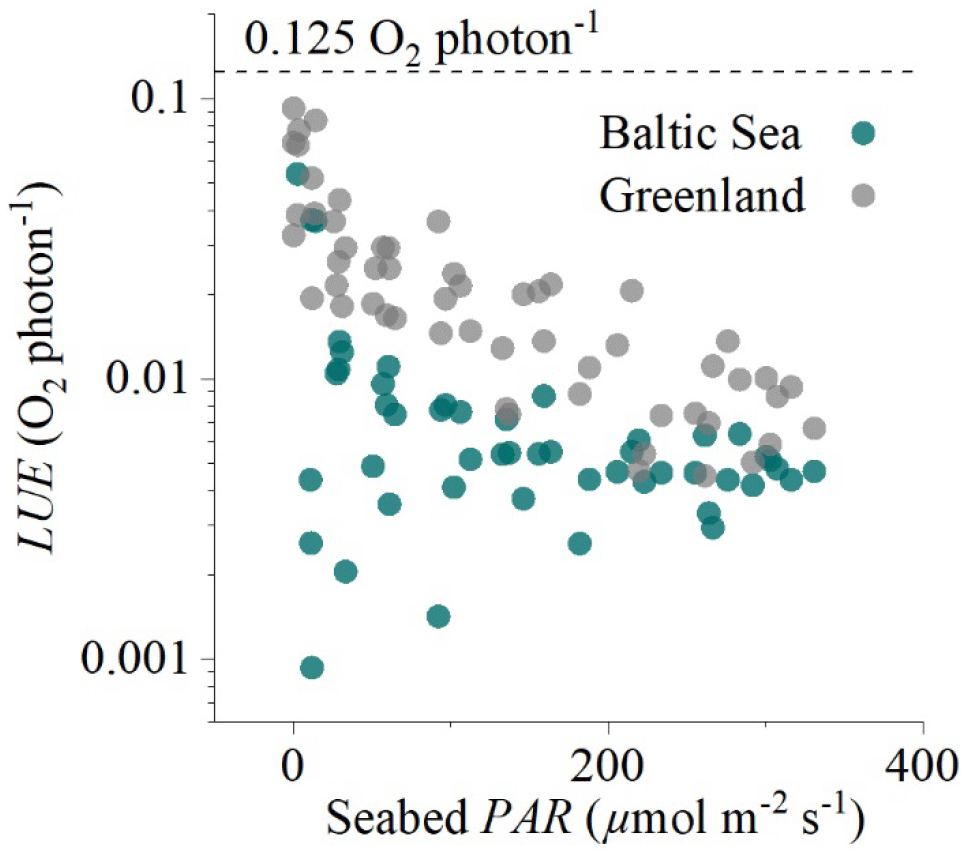
Figure 6Hourly light-use efficiency (LUE, log axis) plotted against incoming irradiance (seabed PAR) for the two eddy flux datasets collected in the sedimentary embayment in Greenland and the rocky mussel reef in the Baltic Sea. The broken line indicates the theoretical limit of 0.125 O2 per photon.
2.3 Estimating light-use efficiency
2.3.1 Constraining the fraction of absorbed PAR (fAPAR)
Direct measurements of fAPAR can be made using two PAR sensors to resolve both incident and reflected PAR. In benthic environments, PAR absorbance is typically above 80 % of incident near-bed irradiance in sedimentary habitats and approaches 100 % in habitats with greater structural complexity (higher light scattering) such as in seagrass beds (Al-Najjar et al., 2012; Zimmerman, 2003). Therefore, while it is advisable (and feasible) to quantify both incident and reflected PAR throughout the EC deployment for LUE estimates, the assumption that fAPAR =1.0 is expected to only induce a slight bias (underestimate) to the LUE. Since fAPAR was not measured in the studies by Attard et al. (2014) and Attard et al. (2020), this study assumes fAPAR =1.0. To test the validity of this assumption, direct measurements of fAPAR were made on a separate occasion at a site with bare sediments in Oslofjord in Norway in July 2019. Here, two cross-calibrated high-quality cosine PAR sensors (a Biospherical QCP-2000 and a Li-Cor LI-192) were affixed to a frame and placed on the sea floor at a water depth of 8 m, with the sensors located 0.5 m above the seabed. The sensors logged incident and reflected PAR (µmol photons m−2 s−1) every minute over 3 d.
2.3.2 Computing hourly and daily light-use efficiency (LUE)
Once the best method for computing GPP was identified, hourly GPP was converted from units of mmol O2 m−2 h−1 to µmol O2 m−2 s−1 and the hourly LUE was computed as with units of O2 per photon. Similarly, daily GPP (mmol O2 m−2 d−1), computed as GPP , and daily integrated PAR (mmol photon m−2 d−1) were used to compute daily LUE (O2 per photon) as .
3.1 Effects of flow direction
The embayment in Greenland had a semi-diurnal tidal signal, i.e. two high and two low tides every day, with the two predominant flow directions (100–150 and 190–230∘) accounting for 90 % of the fluxes. In the Baltic Sea, the flow direction was more variable with five flow directions each accounting for 15 %–30 % of the fluxes. Despite the fluxes originating from different parts of the sea floor, the flow direction did not have a substantial impact on hourly GPP, indicating that the eddy covariance measurements adequately integrated over habitat patchiness (Fig. 2).
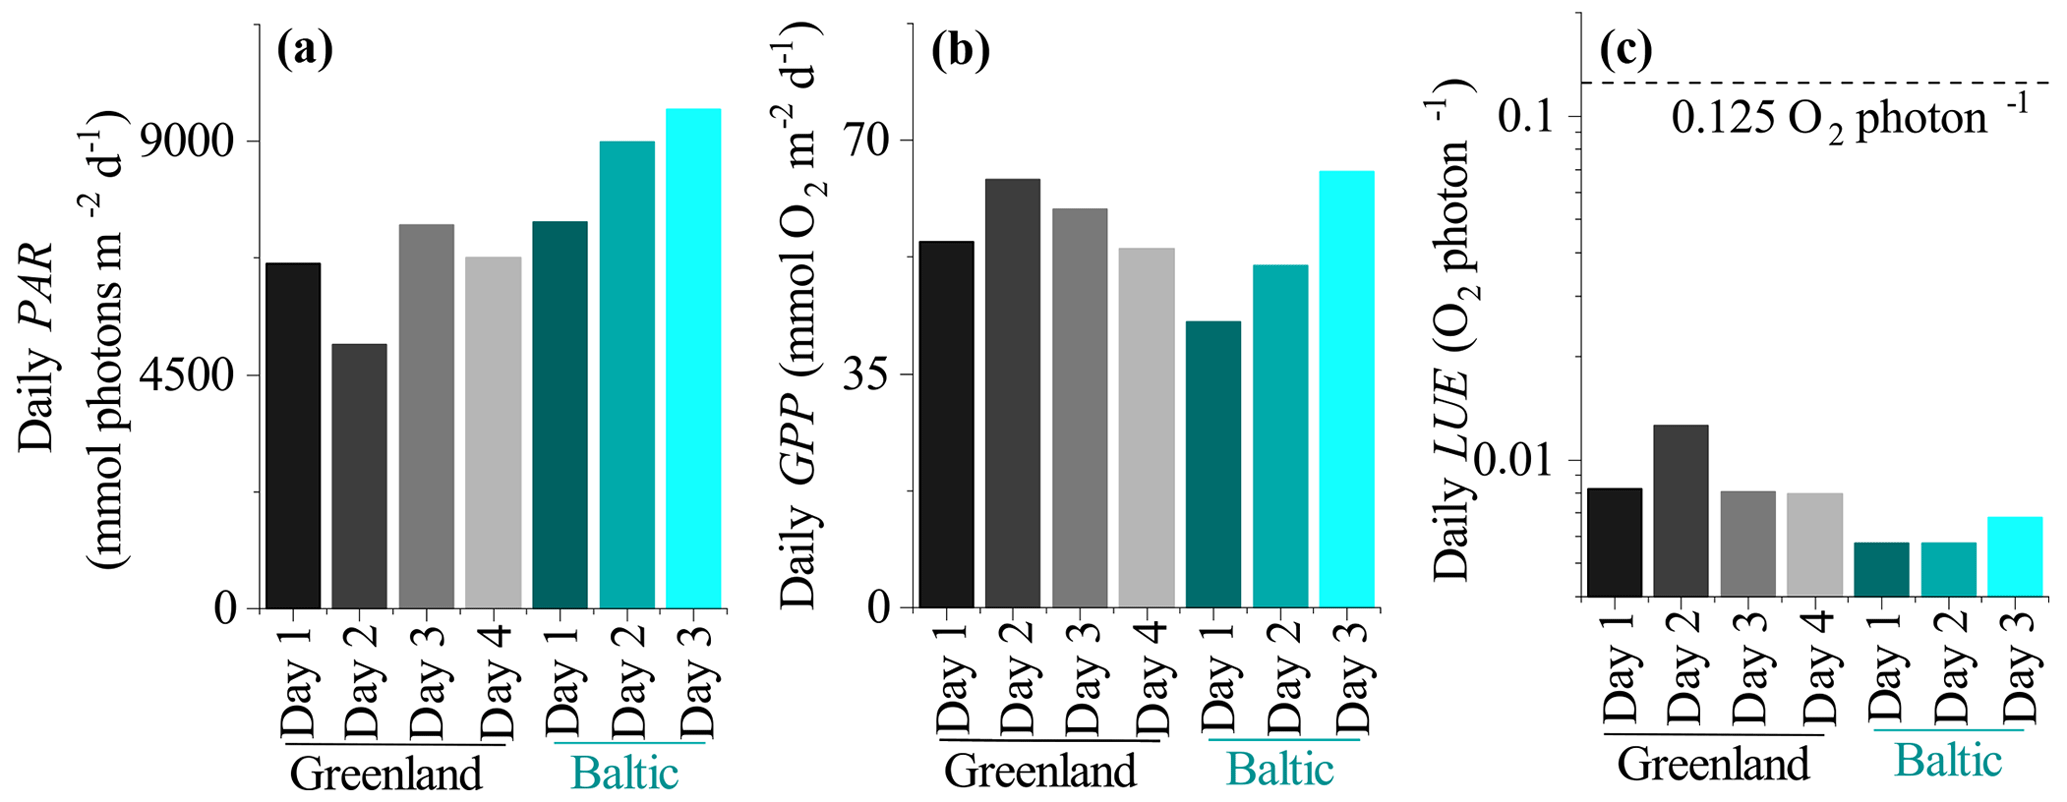
Figure 7(a) Daily seabed PAR, (b) daily benthic GPP, and (c) daily LUE. The broken line in (c) indicates the theoretical limit of 0.125 O2 per photon.
3.2 Hourly GPP and light saturation curves
In the 4 d dataset from Greenland (Attard et al., 2014), hourly GPP ranged from 0 to 8 mmol O2 m−2 h−1 under maximum daytime irradiance of up to 500 µmol photons m−2 s−1. Hourly GPP measured in the first half of the day was very similar to rates resolved in the second half of the day under similar PAR intensities, indicating no substantial flux hysteresis (Fig. 3). Hourly GPP showed a tight correlation with seabed PAR, with R2 values for the light saturation curves ranging from 0.83 to 0.93 (Fig. 3). Overall, the highest R2 values for the light saturation curves for this dataset were achieved using a static daytime R rate which was defined as an average of all night-time fluxes (). This approach achieved R2 values in the light saturation curves that were up to 10 % higher than when R was defined using the first night-time period alone (). Light saturation began to occur at 20 %–30 % of peak daily irradiance, and no photoinhibition at high irradiance was observed. The lowest light saturation (Ik) and the highest alpha (α) were measured during the day with the lowest light intensities (day 2), suggesting potential low-light acclimation (Fig. 3).
In the EC dataset from the Baltic Sea, a clear hysteresis was observed in the O2 fluxes. Hourly O2 fluxes in the second half of the day were up to 4-fold lower than within the first half of the day under similar irradiance levels. Light saturation curve R2 values varied depending on the method used to define the daytime R rate (Fig. 4). In all 3 d from this dataset, the highest R2 values were obtained using dynamic daytime R rates defined as either a linear or sigmoidal increase with time. These two approaches produced GPP estimates with the best quality: all hourly GPP values were positive, and the fitting parameters Pm, Ik, and α had the lowest standard errors (Fig. 4). While Pm and α showed good agreement between the four methods, static R approaches tended to overestimate the Ik and underestimate α since hysteretic fluxes tend to bias light saturation curves towards linearity. Following the correction, the light saturation parameter Ik decreased and the α increased by ∼20 %. This indicates that the curve becomes less linear-like, which is what we would expect when we correctly account for the minor hysteresis that we encountered. We note that other studies have documented a much larger hysteresis than what we observe at the mussel bed (Rheuban et al., 2014; Rovelli et al., 2017).
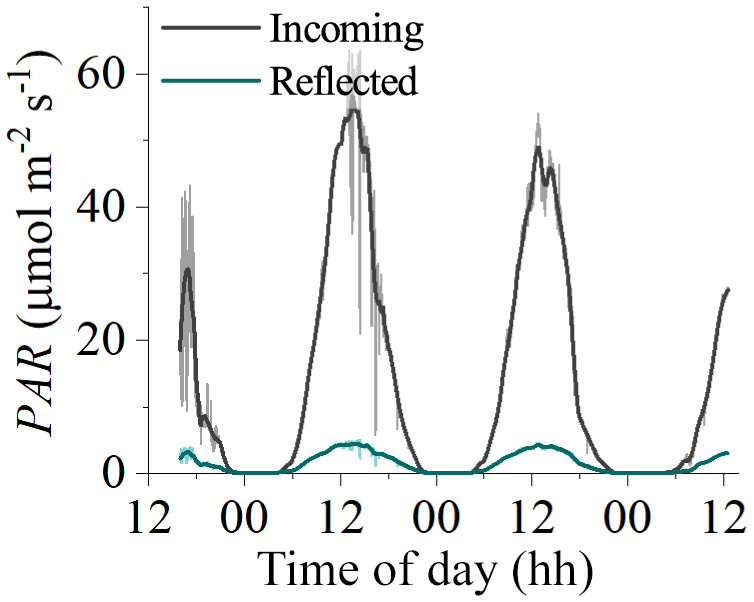
Figure 8Measurements of incident and reflected seabed PAR made using two cosine PAR sensors over a habitat with bare sediments at 8 m depth in Oslofjord in July 2019. Reflected PAR was typically 8 %–10 % of incident PAR, indicating that ∼90 % of incident PAR was absorbed by the benthos.
Hourly GPP computed using sigmoidal increases in daytime R for the Baltic Sea dataset ranged from 0 to 7 mmol O2 m−2 h−1 under PAR levels of up to 350 µmol photons m−2 s−1 (Fig. 3). Light saturation curves provided high R2 values for day 1 and day 3 of 0.83 and 0.81. The light saturation curve for day 2 converged to a linear fit with an R2 of 0.94 (Fig. 5).
3.3 Light-use efficiency
Hourly LUE estimates for the two datasets indicated high LUE of up to 0.09 O2 per photon under light-limiting conditions of <20 µmol PAR m−2 s−1 (Fig. 6). Light-use efficiency declined quasi-exponentially with time (and PAR) to around 1∕10 of the value by the middle of the day, and then it increased again towards sunset to LUE values comparable to the morning. This observation is consistent with the microsensor and benthic chamber studies by Al-Najjar et al. (2012), Brodersen et al. (2014), and Godwin et al. (2014), who document maximum LUE under light-limiting conditions and a decline in LUE under high irradiance levels typical of the middle of the day. Phytoplankton studies have similarly documented high LUE (∼85 % of theoretical limit) under light-limiting conditions (Sosik, 1996).
High hourly LUE under low light intensities was a general feature of both datasets, but it was not universal across all times of the day. The expected patterns were largely consistent in the dataset from Greenland (Fig. 3) but less so in the dataset from the Baltic Sea (Figs. 5, 6), where we often observed lower LUE than we would expect under light-limiting conditions. Directional differences were rather small for both datasets (Fig. 2), so these discrepancies could instead reflect other environmental differences, such as the availability of nutrients for GPP at these two contrasting sites (sedimentary versus rocky).
Daily LUE estimated as the ratio between GPPdaily and PARdaily (both in mmol m−2 d−1) ranged from 0.008 to 0.013 O2 per photon in Greenland and was 0.006 to 0.007 O2 per photon in the mussel bed dataset from the Baltic Sea (Fig. 7). This indicates that the soft sediment habitat in Greenland had higher photosynthetic efficiency than the rocky mussel bed in the Baltic Sea on a daily timescale for the investigated data. However, in all cases daily LUE is at least 10-fold lower than the theoretical limit of 0.125 O2 per photon.
The LUE values presented in this study are expected to be underestimated due to the assumption of fAPAR =1.0 (i.e. by assuming that all incident PAR is absorbed by the seabed). A fraction of the incoming irradiance is reflected and thus is not available for photosynthesis. Reflected PAR ranged from 17.5 % to 1.9 % in the study on microbial mats by Al-Najjar et al. (2012) and was up to 12 % in the coral symbiont study by Brodersen et al. (2014). Direct measurements of fAPAR were not available for the datasets used in this study, but measurements from a bare sediment site in Oslofjord indicated reflected PAR on the order of 8 %–10 % (Fig. 8). It is therefore likely that the LUE estimates presented in this study are underestimated by ∼10 %.
A key requirement of the LUE approach is high-quality GPP data. Despite there being numerous potential obstacles to obtaining these data (Table 1), a growing number of eddy covariance studies document tight relationships between hourly fluxes and sunlight availability in a wide array of aquatic habitats such as in sediment deposits, seagrass canopies, coralline algal beds, and coral reefs (Berg et al., 2013; Chipman et al., 2016; Attard et al., 2014, 2015; Rheuban et al., 2014; Long et al., 2013, 2015; Koopmans et al., 2020; Rovelli et al., 2017). In this study, R2 values for light saturation curves ranged from 0.83 to 0.94, indicating a predominant primary production signal, and this gives credence to applying the LUE approach.
Constraining the daytime R rate on an hourly timescale is clearly a challenge, especially on the spatial scales included within eddy covariance measurements. Assuming a linear or sigmoidal increase in R with time is consistent with observations of accumulating leached photosynthates such as carbohydrates that stimulate daytime R (de Winder et al., 1999; Epping and Jørgensen, 1996); however, more experimental data are required to investigate these assumptions in detail. The theoretical limit LUE ratio of 0.125 O2 per photon provides an upper constraint on the GPP that is possible for a given PAR level. Hourly LUE at the start and at the end of the day often approached the theoretical limit (Fig. 3), so it is unlikely that the GPP rates in these datasets were substantially underestimated.
Light saturation curves are a useful tool to evaluate flux hysteresis and ways to correct for this. There are several considerations when computing hourly GPP that will influence both the R2 value and the fitting parameters Pm, α, and Ik. Since these parameters hold real-world significance (i.e. they are not just operators within the mathematical expression; Jassby and Platt, 1976), it is important to consider factors that may introduce bias.
Overall, the LUE approach provides a useful means to compare photosynthetic performance of submerged habitats on hourly and daily timescales. This provides opportunities to generate hypotheses about the importance of habitat structure (e.g. organization of photosynthetic elements) and other factors that influence benthic GPP such as epiphytes, grazing, nutrient availability, temperature, and current strength (Elser et al., 2007; Mass et al., 2010; Brodersen et al., 2015; Tait and Schiel, 2011). In terrestrial environments, this approach has been used to investigate the effects of biodiversity and biodiversity loss on habitat productivity. Similar analyses ported to the aquatic realm would constitute timely studies.
All presented data are openly available from the Dryad Digital Repository at https://doi.org/10.5061/dryad.xwdbrv1bv (Attard and Glud, 2020).
KMA and RNG conceived the idea, and KMA collected and processed the data. KMA wrote the manuscript with input from RNG.
The authors declare that they have no conflict of interest.
We are grateful to our colleagues at the Greenland Climate Research Centre in Nuuk, Greenland, at the Tvärminne Zoological Station in Finland, and at the Norwegian Institute for Water Research in Norway (NIVA; Kasper Hancke) for their help with fieldwork.
This research has been supported by the Walter and Andrée de Nottbeck Foundation (grant no. WANS_ATTARD_2016), the Academy of Finland (grant nos. 283417 and 294853), the Independent Research Fund Denmark (grant no. FNU 7014-00078), and the Research Council of Norway (grant nos. HAVBRUK2, KELPPRO).
This paper was edited by Jack Middelburg and reviewed by two anonymous referees.
Adams, M. P., Ferguson, A. J. P., Maxwell, P. S., Lawson, B. A. J., Samper-Villarreal, J., and O'Brien, K. R.: Light history-dependent respiration explains the hysteresis in the daily ecosystem metabolism of seagrass, Hydrobiologia, 766, 75–88, https://doi.org/10.1007/s10750-015-2444-5, 2016.
Al-Najjar, M. A. A., de Beer, D., Jørgensen, B. B., Kühl, M., and Polerecky, L.: Conversion and conservation of light energy in a photosynthetic microbial mat ecosystem, ISME J., 4, 440–449, https://doi.org/10.1038/ismej.2009.121, 2010.
Al-Najjar, M. A. A., de Beer, D., Kühl, M., and Polerecky, L.: Light utilization efficiency in photosynthetic microbial mats, Environ. Microbiol., 14, 982–992, https://doi.org/10.1111/j.1462-2920.2011.02676.x, 2012.
Attard, K. M. and Glud, R. N.: Technical note: Estimating light-use efficiency of benthic habitats using underwater O2 eddy covariance, https://doi.org/10.5061/dryad.xwdbrv1bv, 2020.
Attard, K. M., Glud, R. N., McGinnis, D. F., and Rysgaard, S.: Seasonal rates of benthic primary production in a Greenland fjord measured by aquatic eddy correlation, Limnol. Oceanogr., 59, 1555–1569, https://doi.org/10.4319/lo.2014.59.5.1555, 2014.
Attard, K. M., Stahl, H., Kamenos, N. A., Turner, G., Burdett, H. L., and Glud, R. N.: Benthic oxygen exchange in a live coralline algal bed and an adjacent sandy habitat: an eddy covariance study, Mar. Ecol. Prog. Ser., 535, 99–115, https://doi.org/10.3354/meps11413, 2015.
Attard, K. M., Hancke, K., Sejr, M. K., and Glud, R. N.: Benthic primary production and mineralization in a High Arctic fjord: in situ assessments by aquatic eddy covariance, Mar. Ecol. Prog. Ser., 554, 35–50, https://doi.org/10.3354/meps11780, 2016.
Attard, K. M., Rodil, I. F., Berg, P., Norkko, J., Norkko, A., and Glud, R. N.: Seasonal metabolism and carbon export potential of a key coastal habitat: The perennial canopy-forming macroalga Fucus vesiculosus, Limnol. Oceanogr., 64, 149–164, https://doi.org/10.1002/lno.11026, 2019a.
Attard, K. M., Rodil, I. F., Glud, R. N., Berg, P., Norkko, J., and Norkko, A.: Seasonal ecosystem metabolism across shallow benthic habitats measured by aquatic eddy covariance, Limnol. Oceanogr. Lett., 4, 79–86, https://doi.org/10.1002/lol2.10107, 2019b.
Attard, K. M., Rodil, I. F., Berg, P., Mogg, A. O. M., Westerbom, M., Norkko, A., and Glud, R. N.: Metabolism of a subtidal rocky mussel reef in a high-temperate setting: pathways of organic carbon flow, Mar. Ecol. Prog. Ser., 645, 41–50, https://doi.org/10.3354/meps13372, 2020.
Berg, P., Røy, H., and Wiberg, P. L.: Eddy correlation flux measurements: the sediment surface area that contributes to the flux, Limnol. Oceanogr., 52, 1672–1684, https://doi.org/10.4319/lo.2007.52.4.1672, 2007.
Berg, P., Glud, R. N., Hume, A., Stahl, H., Oguri, K., Meyer, V., and Kitazato, H.: Eddy correlation measurements of oxygen uptake in deep ocean sediments, Limnol. Oceanogr.-Method., 7, 576–584, https://doi.org/10.4319/lom.2009.7.576, 2009.
Berg, P., Long, M. H., Huettel, M., Rheuban, J. E., McGlathery, K. J., Howarth, R. W., Foreman, K. H., Giblin, A. E., and Marino, R.: Eddy correlation measurements of oxygen fluxes in permeable sediments exposed to varying current flow and light, Limnol. Oceanogr., 58, 1329–1343, https://doi.org/10.4319/lo.2013.58.4.1329, 2013.
Berg, P., Reimers, C. E., Rosman, J. H., Huettel, M., Delgard, M. L., Reidenbach, M. A., and Özkan-Haller, H. T.: Technical note: Time lag correction of aquatic eddy covariance data measured in the presence of waves, Biogeosciences, 12, 6721–6735, https://doi.org/10.5194/bg-12-6721-2015, 2015.
Berg, P., Delgard, M. L., Glud, R. N., Huettel, M., Reimers, C. E., and Pace, M. L.: Non-invasive flux Measurements at the Benthic Interface: The Aquatic Eddy Covariance Technique, Limnol. Oceanogr. e-Lec., 7, 1–50, https://doi.org/10.1002/loe2.10005, 2017.
Brand, A., McGinnis, D. F., Wehrli, B., and Wuest, A.: Intermittent oxygen flux from the interior into the bottom boundary of lakes as observed by eddy correlation, Limnol. Oceanogr., 53, 1997–2006, https://doi.org/10.4319/lo.2008.53.5.1997, 2008.
Brodersen, K., Lichtenberg, M., Paz, L.-C., and Kühl, M.: Epiphyte-cover on seagrass (Zostera marina L.) leaves impedes plant performance and radial O2 loss from the below-ground tissue, Front. Mar. Sci., 2, 58, https://doi.org/10.3389/fmars.2015.00058, 2015.
Brodersen, K. E., Lichtenberg, M., Ralph, P. J., Kühl, M., and Wangpraseurt, D.: Radiative energy budget reveals high photosynthetic efficiency in symbiont-bearing corals, J. Roy. Soc. Int., 11, 20130997, https://doi.org/10.1098/rsif.2013.0997, 2014.
Chipman, L., Berg, P., and Huettel, M.: Benthic Oxygen Fluxes Measured by Eddy Covariance in Permeable Gulf of Mexico Shallow-Water Sands, Aquat. Geochem., 22, 529–554, https://doi.org/10.1007/s10498-016-9305-3, 2016.
Cook, P. L. M., Wenzhofer, F., Glud, R. N., Janssen, F., and Huettel, M.: Benthic solute exchange and carbon mineralization in two shallow subtidal sandy sediments: Effect of advective pore-water exchange, Limnol. Oceanogr., 52, 1943–1963, https://doi.org/10.4319/lo.2007.52.5.1943, 2007.
de Winder, B., Staats, N., Stal, L. J., and Paterson, D. M.: Carbohydrate secretion by phototrophic communities in tidal sediments, J. Sea Res., 42, 131–146, https://doi.org/10.1016/S1385-1101(99)00021-0, 1999.
Donis, D., McGinnis, D. F., Holtappels, M., Felden, J., and Wenzhoefer, F.: Assessing benthic oxygen fluxes in oligotrophic deep sea sediments (HAUSGARTEN observatory), Deep-Sea Res. Pt. I, 111, 1–10, https://doi.org/10.1016/j.dsr.2015.11.007, 2016.
Elser, J. J., Bracken, M. E. S., Cleland, E. E., Gruner, D. S., Harpole, W. S., Hillebrand, H., Ngai, J. T., Seabloom, E. W., Shurin, J. B., and Smith, J. E.: Global analysis of nitrogen and phosphorus limitation of primary producers in freshwater, marine and terrestrial ecosystems, Ecol. Lett., 10, 1135–1142, https://doi.org/10.1111/j.1461-0248.2007.01113.x, 2007.
Epping, E. H. G. and Jørgensen, B. B.: Light-enhanced oxygen respiration in benthic phototrophic communities, Mar. Ecol. Prog. Ser., 139, 193–203, 1996.
Falkowski, P. G.: Molecular Ecology of Phytoplankton Photosynthesis, in: Primary productivity and biogeochemical cycles in the sea, edited by: Falkowski, P. G. and Woodhead, A. D., Springer, New York, 1992.
Fenchel, T. and Glud, R. N.: Benthic primary production and O2-CO2 dynamics in a shallow-water sediment: Spatial and temporal heterogeneity, Ophelia, 53, 159–171, 2000.
Godwin, S. C., Jones, S. E., Weidel, B. C., and Solomon, C. T.: Dissolved organic carbon concentration controls benthic primary production: Results from in situ chambers in north-temperate lakes, Limnol. Oceanogr., 59, 2112–2120, https://doi.org/10.4319/lo.2014.59.6.2112, 2014.
Hemes, K. S., Verfaillie, J., and Baldocchi, D. D.: Wildfire-Smoke Aerosols Lead to Increased Light Use Efficiency Among Agricultural and Restored Wetland Land Uses in California's Central Valley, J. Geophys. Res.-Biogeo., 125, e2019JG005380, https://doi.org/10.1029/2019jg005380, 2020.
Holtappels, M., Glud, R. N., Donis, D., Liu, B., Hume, A., Wenzhöfer, F., and Kuypers, M. M. M.: Effects of transient bottom water currents and oxygen concentrations on benthic exchange rates as assessed by eddy correlation measurements, J. Geophys. Res.-Ocean., 118, 1157–1169, https://doi.org/10.1002/jgrc.20112, 2013.
Holtappels, M., Noss, C., Hancke, K., Cathalot, C., McGinnis, D. F., Lorke, A., and Glud, R. N.: Aquatic eddy correlation: quantifying the artificial flux caused by stirring-sensitive O2 sensors, Plos One, 10, e0116564, https://doi.org/10.1371/journal.pone.0116564, 2015.
Hotchkiss, E. R. and Hall Jr., R. O.: High rates of daytime respiration in three streams: Use of δ18OO2 and O2 to model diel ecosystem metabolism, Limnol. Oceanogr., 59, 798–810, https://doi.org/10.4319/lo.2014.59.3.0798, 2014.
Hume, A. C., Berg, P., and McGlathery, K. J.: Dissolved oxygen fluxes and ecosystem metabolism in an eelgrass (Zostera marina) meadow measured with the eddy correlation technique, Limnol. Oceanogr., 56, 86–96, https://doi.org/10.4319/lo.2011.56.1.0086, 2011.
Jassby, A. D. and Platt, T.: Mathematical formulation of the relationship between photosynthesis and light for phytoplankton, Limnol. Oceanogr., 21, 540–547, https://doi.org/10.4319/lo.1976.21.4.0540, 1976.
Koopmans, D., Holtappels, M., Chennu, A., Weber, M., and de Beer, D.: High Net Primary Production of Mediterranean Seagrass (Posidonia oceanica) Meadows Determined With Aquatic Eddy Covariance, Front. Mar. Sci., 7, 118, https://doi.org/10.3389/fmars.2020.00118, 2020.
Kuhl, M., Glud, R. N., Ploug, H., and Ramsing, N. B.: Microenvironmental control of photosynthesis and photosynthesis-coupled respiration in an epilithic cyanobacterial biofilm, J. Phycol., 32, 799–812, https://doi.org/10.1111/j.0022-3646.1996.00799.x, 1996.
Long, M. H., Berg, P., de Beer, D., and Zieman, J. C.: In situ coral reef oxygen metabolism: An eddy correlation study, Plos One, 8, e58581 https://doi.org/10.1371/journal.pone.0058581, 2013.
Long, M. H., Berg, P., McGlathery, K. J., and Zieman, J. C.: Sub-tropical seagrass ecosystem metabolism measured by eddy covariance, Mar. Ecol. Prog. Ser., 529, 75–90, https://doi.org/10.3354/meps11314, 2015.
Long, M. H., Sutherland, K., Wankel, S. D., Burdige, D. J., and Zimmerman, R. C.: Ebullition of oxygen from seagrasses under supersaturated conditions, Limnol. Oceanogr., 65, 314–324, https://doi.org/10.1002/lno.11299, 2020.
Mass, T., Genin, A., Shavit, U., Grinstein, M., and Tchernov, D.: Flow enhances photosynthesis in marine benthic autotrophs by increasing the efflux of oxygen from the organism to the water, P. Natl. Acad. Sci. USA, 107, 2527–2531, https://doi.org/10.1073/pnas.0912348107, 2010.
McGinnis, D. F., Berg, P., Brand, A., Lorrai, C., Edmonds, T. J., and Wüest, A.: Measurements of eddy correlation oxygen fluxes in shallow freshwaters: Towards routine applications and analysis, Geophys. Res. Lett., 35, L04403, https://doi.org/10.1029/2007gl032747, 2008.
McGinnis, D. F., Cherednichenko, S., Sommer, S., Berg, P., Rovelli, L., Schwarz, R., Glud, R. N., and Linke, P.: Simple, robust eddy correlation amplifier for aquatic dissolved oxygen and hydrogen sulfide flux measurements, Limnol. Oceanogr.-Method., 9, 340–347, https://doi.org/10.4319/lom.2011.9.340, 2011.
McGinnis, D. F., Sommer, S., Lorke, A., Glud, R. N., and Linke, P.: Quantifying tidally driven benthic oxygen exchange across permeable sediments: an aquatic eddy correlation study, J. Geophys. Res.-Ocean., 119, 6918–6932, https://doi.org/10.1002/2014jc010303, 2014.
Monteith, J. L., Moss, C. J., Cooke, G. W., Pirie, N. W., and Bell, G. D. H.: Climate and the efficiency of crop production in Britain, Philos. T. R. Soc. Lond. B, 281, 277–294, https://doi.org/10.1098/rstb.1977.0140, 1977.
Platt, T., Gallegos, C. L., and Harrison, W. G.: Photoinhibition of photosynthesis in natural assemblages of marine phytoplankton, J. Mar. Res., 38, 687–701, 1980.
Ralph, P. J., Polk, S. M., Moore, K. A., Orth, R. J., and Smith, W. O.: Operation of the xanthophyll cycle in the seagrass Zostera marina in response to variable irradiance, J. Exp. Mar. Biol. Ecol., 271, 189–207, https://doi.org/10.1016/S0022-0981(02)00047-3, 2002.
Reimers, C. E., Özkan-Haller, H. T., Albright, A. T., and Berg, P.: Microelectrode Velocity Effects and Aquatic Eddy Covariance Measurements under Waves, J. Atmos. Ocean. Tech., 33, 263–282, https://doi.org/10.1175/jtech-d-15-0041.1, 2016.
Rheuban, J. E. and Berg, P.: The effects of spatial and temporal variability at the sediment surface on aquatic eddy correlation flux measurements, Limnol. Oceanogr.-Method., 11, 351–359, https://doi.org/10.4319/lom.2013.11.351, 2013.
Rheuban, J. E., Berg, P., and McGlathery, K. J.: Multiple timescale processes drive ecosystem metabolism in eelgrass (Zostera marina) meadows, Mar. Ecol. Prog. Ser., 507, 1–13, https://doi.org/10.3354/meps10843, 2014.
Rovelli, L., Attard, K. M., Binley, A., Heppell, C. M., Stahl, H., Trimmer, M., and Glud, R. N.: Reach-scale river metabolism across contrasting sub-catchment geologies: Effect of light and hydrology, Limnol. Oceanogr., 62, S381–S399, https://doi.org/10.1002/lno.10619, 2017.
Sosik, H. M.: Bio-optical modeling of primary production: consequences of variability in quantum yield and specific absorption, Mar. Ecol. Prog. Ser., 143, 225–238, 1996.
Stocker, B. D., Zscheischler, J., Keenan, T. F., Prentice, I. C., Peñuelas, J., and Seneviratne, S. I.: Quantifying soil moisture impacts on light use efficiency across biomes, New Phytol., 218, 1430–1449, https://doi.org/10.1111/nph.15123, 2018.
Tait, L. W. and Schiel, D. R.: Dynamics of productivity in naturally structured macroalgal assemblages: importance of canopy structure on light-use efficiency, Mar. Ecol. Prog. Ser., 421, 97–107, https://doi.org/10.3354/meps08909, 2011.
Toussaint, F., Rabouille, C., Cathalot, C., Bombled, B., Abchiche, A., Aouji, O., Buchholtz, G., Clemençon, A., Geyskens, N., Répécaud, M., Pairaud, I., Verney, R., and Tisnérat-Laborde, N.: A new device to follow temporal variations of oxygen demand in deltaic sediments: the LSCE benthic station, Limnol. Oceanogr.-Method., 12, 729–741, https://doi.org/10.4319/lom.2014.12.729, 2014.
Volaric, M. P., Berg, P., and Reidenbach, M. A.: Oxygen metabolism of intertidal oyster reefs measured by aquatic eddy covariance, Mar. Ecol. Prog. Ser., 599, 75–91, https://doi.org/10.3354/meps12627, 2018.
Wenzhofer, F. and Glud, R. N.: Small-scale spatial and temporal variability in coastal benthic O-2 dynamics: Effects of fauna activity, Limnol. Oceanogr., 49, 1471–1481, 2004.
Zimmerman, R. C.: A biooptical model of irradiance distribution and photosynthesis in seagrass canopies, Limnol. Oceanogr., 48, 568–585, https://doi.org/10.4319/lo.2003.48.1_part_2.0568, 2003.