The Effect of Electric Vehicle Deployment on Renewable Electricity Generation in an Isolated Grid System: The Case Study of Cyprus
 Constantinos Taliotis1*
  Nestor Fylaktos1
  George Partasides1
  Francesco Gardumi2
  Vignesh Sridharan2
  Marios Karmellos1 Costas N. Papanicolas1
- 1The Cyprus Institute, Nicosia, Cyprus
- 2Division of Energy Systems, Royal Institute of Technology (KTH-dESA), Stockholm, Sweden
Decarbonisation of national economies to mitigate climate change requires transformation of the entire energy system. Investments in renewable energy technologies in the electricity supply system are increasing, but substantial effort is called for in other sectors, such as transport. While European Union member states have submitted their integrated National Energy and Climate Plans, this paper focuses on partial electrification of the transport sector as a measure to reduce carbon dioxide emissions in the isolated grid system of Cyprus in a cost-effective manner. The present work assesses the impact of electric vehicle deployment on the share of renewable electricity generation, electricity costs and carbon dioxide emissions. Quantification of these aspects is provided with an outlook until 2035. A cost-optimisation model (OSeMOSYS) is used that takes into account the electricity supply, road transport, and heating and cooling sectors. Smart charging option is also evaluated as a possibility.
Introduction
The Paris Agreement reached at COP21 highlights the commitment of 192 nations to keep global temperature rise in the 21st century well below 2oC above pre-industrial levels and to pursue efforts to limit it to 1.5oC (UNFCCC, 2015). To achieve the latter, a 45% CO2 emission decrease from 2010 levels is required by 2030 (IPCC, 2018). In line with the Paris Agreement climate targets, ambitious greenhouse gas emission targets have been set by the European Union (EU) on a regional level; the EU’s European Green Deal increases the 2030 reduction target for greenhouse gas emissions from 40% to at least 50% and toward 55% as compared to 1990 levels, while it aims to achieve net-zero emissions by 2050 (European Commission, 2019). According to Directive (EU) 2018/2001, a 2030 renewable energy target of 14% in the final energy consumption of the transport sector has also been set by the EU, which is applicable for each individual member state (European Union, 2018). Achievement of these targets calls for a complete transition of the energy system.
The Eastern Mediterranean is considered a ‘climate hot-spot,’ where temperature increases and precipitation patterns are poised to change more dramatically than the global average (Zittis et al., 2016). The region is home to 500 million people residing in usually politically volatile regions, while the projected regional impacts make it one of the most sensitive areas of the planet (Lelieveld et al., 2016). This is the motivation behind a recent initiative launched by the Republic of Cyprus called the Cyprus Climate Initiative (CCI), which aims to identify gaps in climate-related policies of the wider region, and offer specific mitigation and adaptation measures aiming at maximum impact at the lowest possible economic, social and environmental cost (The Republic of Cyprus, 2019). Future decarbonisation efforts will be crucial in mitigating the projected impacts of climate change across the region.
Some sectors of the energy system, such as centralized electricity supply, may be easier to decarbonise than others. This culminates from the rapid technology learning rates experienced by certain renewable energy technologies in recent years (IRENA, 2018). However, the transport sector is far more challenging, as projections show that fuel diversification in this sector is expected to rise from currently low to moderate levels by mid-century (Riahi et al., 2012). The climate neutrality target of the European Green Deal identifies “Sustainable and smart mobility” as a key action. This entails a 90% reduction in greenhouse gas emissions in the transport sector by 2050, which can be achieved through a modal shift away from road transport to rail and inland navigation, automation of multimodal mobility, a reform in the pricing and taxation of fossil fuels, more stringent air pollutant emission standards for internal combustion-engine vehicles, promotion of alternative fuels and electrification of transport (European Commission, 2019).
Electrification of the transport sector is seen as a key pathway toward decarbonisation (Siskos et al., 2018; Ruhnau et al., 2019). Other direct or indirect benefits of electrification include promotion of indigenous renewable energy sources, improved energy security if electrification leads to a reduction in imported fuels, improved energy efficiency, reduced air pollutant emissions, as well as potential development of new employment opportunities (Shakya and Shrestha, 2011). However, deployment of plug-in hybrid and battery electric vehicles is currently limited to a handful of early adopters, as the high upfront cost, lack of charging infrastructure, limited range and long charging times remain important obstacles. Research and development efforts have managed to decrease the cost of battery electric vehicles considerably (Nykvist and Nilsson, 2015; IEA, 2017; Bloomberg New Energy Finance, 2018); their cost is mainly driven by battery pack costs, while upcoming EVs are equipped with much bigger batteries (60–100 kWh) that provide similar range as conventional vehicles (i.e., up to 608 km on a single charge) (evrater, 2019). Additionally, progress in and increased availability of fast charging points aims to alleviate the issue of long charging times (Anjos et al., 2020).
An increased electricity demand in the transport sector leads to equivalent increased generation requirements on the supply side. Since investments in generation infrastructure typically have a lifetime of at least 20 years, decision makers need to consider this additional demand in their long-term planning. The impacts of electrified transport on the energy system have been examined in the available literature. Ruhnau et al. (2019) conducted a review of numerous decarbonisation scenarios for Germany up to 2050, where electrification of the transport sector is a key theme. Keller et al. (2019) assessed scenarios of full electrification of the road transport fleet and up to 93% renewable energy share in electricity supply by 2050 for the province of British Columbia in Canada. They found that full electrification of British Columbia’s road transport fleet would necessitate an increase in generation capacity of 60%, but since most of this would be based on low-cost wind and solar PV, the average cost of electricity would only rise by 9%. Siskos et al. (2018) discuss the implications of delayed action in the decarbonisation of the transport sector in the European Union and recognize the importance of electrified transport. Furthermore, the benefits offered to the grid by smart charging have been assessed and highlighted for the cases of California, where greenhouse gas and air pollutant emissions were reduced (Cheng et al., 2018), and Shanghai, where the integration of variable renewable technologies was facilitated (Jian et al., 2018). Further, smart charging has the potential to provide grid ancillary services, assisting in frequency control (Falahati et al., 2016). However, the literature mainly focuses on large interconnected systems and not on small isolated systems, for which integration of high shares of intermittent renewable energy is a concern.
The aim of the present study is to assess the impact of electrification of the transport sector on the electricity supply system of an isolated grid system and on the combined total emissions from the entire energy system. The case study of Cyprus, an EU member state, is selected as its fossil fuel-dependence, electrical grid isolation and renewable resource availability pose challenges and opportunities that can offer transferable insights to other areas, despite the system’s relatively small size. Specifically, this study assesses the effect of battery electric and plug-in hybrid vehicles on the cost-optimum energy and technology mix of the electricity supply system. A range of scenarios are evaluated to identify potential synergies and obstacles presented by an increasingly electrified transport sector.
Section 2 of the paper provides important background information of the case study location, while discussing the challenges faced on the path toward an energy transition in Cyprus. Section 3 presents the model used to conduct the analysis, along with key input data and assumptions; the set of scenarios developed are also described here. The scenario results are compared and discussed in section 4. The paper concludes with a discussion on the policy implications of the analysis in section 5.
Characteristics of the Cypriot Energy System
Energy supply in Cyprus relies mainly on refined oil products, such as diesel, gasoline, heavy fuel oil, heating oil and LPG; 91% of the total primary energy supply was covered by oil and petroleum products in 2017 (Eurostat, 2019). Due to the fact that these fuels are all imported, energy security is also a concern for energy planners. Electricity generation is fuelled primarily by heavy fuel oil and to a lesser degree diesel (EAC, 2018), the transport sector is entirely dependent on oil products, while heating is also largely reliant on fossil fuels. In terms of final energy demand, the overall renewable energy share in the total final energy demand reached 9.7% in 2017. This is enabled by a substantial share of renewable energy in heating and cooling, due to a near universal adoption of solar water heaters in the residential sector, as well as the continuous increase of Renewable Energy Systems that are installed in the electricity supply (Republic of Cyprus, 2020).
The electricity supply system of Cyprus is based on three large thermal facilities, which have satisfied the rising electricity demand over the past few decades, but are largely carbon-intensive, inefficient and inflexible. The more modern and energy-efficient Combined Cycle Gas Turbine (CCGT) units of total capacity 440 MW installed in the Vasilikos power plant are currently fired by expensive diesel, until natural gas becomes available for electricity generation. Substitution of oil-fired generation with less carbon-intensive gas-fired generation can assist in the achievement of carbon dioxide mitigation targets, as well as in the reduction of other atmospheric pollutants (e.g., SOx and PM). Despite considerable delays in the introduction of natural gas, most recent estimates by the relevant authorities foresee that the natural gas supply infrastructure will be operational by the end of 2021.
The share of renewable energy in the 2018 electricity generation mix reached 9%. This gradually increased from 4% in 2012 and 8.6% in 2016. At the end of 2018, installed wind capacity reached 157 MW and generated 221 GWh during that year, solar PV capacity reached 123 MW and generated 195 GWh, while biogas-fired installations reached a capacity of 10 MW and contributed to the generation mix by 36 GWh (TSO Cyprus, 2019a).
Seasonal and intra-day variability in both final electricity demand and renewable energy generation add complexity in the management of electricity supply. The climate in Cyprus is typically characterized by mild winters and hot dry summers, which leads to a great variability in demand throughout the year. As demand continues to grow annually, recent statistics from 2017 show that the peak level of generation has reached 1,027 MW, while the minimum for the same year was recorded at 293 MW (Tso Cyprus, 2019b). The peak demand period is typically experienced during mid-day and afternoon hours of summer and is attributed to demand for cooling. On the contrary, low demand periods are observed in the early morning hours of spring and autumn, when demand for heating and cooling is minimal.
An important obstacle in the introduction of higher shares of renewable energy is the isolation of the Cypriot electricity supply system, as there is no grid interconnection with a neighboring country. This isolation may end if the proposed EuroAsia Interconnector materializes, linking Cyprus with Israel and Greece. If the first phase of the project proceeds as scheduled, Cyprus will be connected by a 1,000 MW HVDC line with both of these neighboring countries by the end of 2023 (Republic of Cyprus, 2020). However, considering the delays faced both in the past and recently (Financial Mirror, 2019), as well as the high capital investment of 3.5 billion EUR needed, the development of the project cannot be considered as certain.
Additionally, no electrical storage technologies have been deployed yet in the system. Incorporation of such options can provide additional flexibility to the system, as the energy arbitrage allows for further integration of renewable energy. The National Energy and Climate Plan of Cyprus makes mention of pumped-hydro storage and lithium ion batteries as potential options, as well as thermal energy storage in the case of concentrated solar power (Republic of Cyprus, 2020).
In the first half of 2019, about 150 pure electric vehicles were registered in Cyprus, while the total number of registered passenger cars exceeded 500,000; these are further broken down to approximately 440,000 gasoline-fired, 80,000 diesel-fired and 5000 hybrid vehicles. The entire fleet size is approximately 700,000 vehicles, of which about 3,000 are diesel-powered busses, while the rest are primarily diesel-fired heavy trucks and light commercial vehicles. No other form of public transport is available. As a result, with an estimated modal share exceeding 90% of total trips, the use of privately owned vehicles is the dominant choice for passenger transport (Republic of Cyprus, 2020). It is hypothesized that despite the increased electricity demand arising from further electric vehicle deployment, electrification of the transport sector will have an enabling effect on renewable electricity generation. In fact, authorities are considering the formulation of a scheme that would support the simultaneous installation of a rooftop solar PV system and purchase of an electric vehicle. However, careful planning is needed to avoid the creation of an additional evening peak due to electric vehicle charging, which would exert additional pressure to the local grid system.
Numerous studies have been conducted to support energy planning in Cyprus. An optimisation model making use of the WASP software was originally used to guide national planning that would assist local authorities in achieving the EU’s 2020 renewable energy targets (Poullikkas et al., 2011). With the collaboration of the International Renewable Energy Agency, a study then used the cost-optimisation model MESSAGE to assess the renewable energy technology potential in the electricity supply system of Cyprus in a set of six scenarios (IRENA, 2015; Taliotis et al., 2017c). Building on this, a more detailed model was developed within the OSeMOSYS modeling framework, including code enhancements that considered short-term system constraints, in order to assess a range of scenarios for natural gas introduction in the energy mix of Cyprus (Taliotis et al., 2017b); this OSeMOSYS model has since been expanded to include the transport and heating and cooling sectors. To examine the functionality of the OSeMOSYS model and assess the impact of renewable energy integration on grid stability, a capacity expansion outlook was tested with a power systems model developed in PLEXOS (JRC, 2016). Despite the aforementioned studies focusing on the electricity supply and primary energy supply sectors, no analysis is available in the literature focusing on the transport sector of Cyprus. No study exists that assesses the impact of transport electrification on the island’s energy mix.
Materials and Methods
Modeling Approach
The existing model of the Cypriot energy system, developed in OSeMOSYS (Taliotis et al., 2017b), is used as basis for the analysis and is updated to support the formulation of the National Energy and Climate Plan of the Republic of Cyprus (2020). OSeMOSYS is a demand-driven cost-optimisation model, the objective function of which is to satisfy an exogenously defined final energy demand at the least possible cost (Howells et al., 2011). Taking into account a range of assumptions with regards to techno-economic characteristics of technologies, fuel prices, emission limits and other system constraints, the model identifies a cost-optimal technology and energy mix. OSeMOSYS has been used in several applications of national, regional and global focus (Löffler et al., 2017; Pinto, de Moura et al., 2017; Gardumi et al., 2018; Niet et al., 2018; Rady et al., 2018; Sridharan et al., 2019), while its maturity and technical capability for serious use to support energy planning have been recognized in a study comparing 31 open source energy system tools (Groissböck, 2019).
The OSeMOSYS model of Cyprus has three modules representing the three key energy sectors: electricity supply, road transport, heating and cooling. It makes use of OSeMOSYS code enhancements that consider grid flexibility constraints, such as operating reserves demand and ramping rates of thermal units. OSeMOSYS model results from this enhanced code have been validated against a linked framework of a separate cost-optimisation model (TIMES) and a power systems model (PLEXOS), illustrating comparable results for the case of Ireland (Welsch et al., 2014). This is especially important in the case of Cyprus, since due to its electrical grid isolation there are concerns regarding grid stability in case of a high penetration of variable renewable energy technologies in the system. A detailed power system analysis with the effects at each bus is not carried out and the aspect of grid stability is considered out of the scope of this work. Assessment of this aspect would require a detailed power flow analysis for each load and generation bus, which would require employment of power systems models with high temporal and technical detail and offer different insights than the present analysis.
It should be highlighted that the present modeling effort aims at understanding the plausible future energy and technology choices to be followed by end-users, within the framework of existing and planned policies and measures. In this sense, since fuel taxation is an integral part of national energy policy, fuel taxes are replicated within the model, so as to represent system conditions from the consumer’s perspective. Furthermore, the objective is not the identification of a cost-optimal solution for a suite of renewable energy and emission targets. As such, no hard constraints in regards to specific targets are included in the model, unless backed-up by specific policies. Therefore, the only target related constraint implemented in the model is associated with the necessity to cut down SOx emissions in 2020.
In order to allow an analysis of the impacts of electrification of the transport sector, a set of scenarios is developed, for which identified indicators for the comparison include the level of renewable energy technology investments and generation, estimates of curtailment of renewable electricity generation, the evolution of average electricity cost and projections of greenhouse gas emissions. The following three scenarios are examined:
Reference (REF)
This scenario assumes that the current trends in terms of vehicle fleet continue in the transport sector. Blending of conventional fuels with imported biofuels is allowed, but only minimal investments in alternative vehicle technologies occur. The penetration of electric vehicles is limited to existing levels in this scenario. Measures in the rest of the energy system are derived from the ‘With Existing Measures’ (WEM) scenario of the National Energy and Climate Plan of Cyprus (Republic of Cyprus, 2020). Hence, constraints have been implemented to have representation of the evolution of the energy system largely in line with the official plans of the government1.
Electrified TRANSPORT (ET)
Additional to the measures foreseen in the REF, in this scenario plug-in hybrid (PHEV) and battery electric (BEV) vehicles are allowed to be deployed, if deemed part of the cost-optimal solution. A predefined charging profile is assumed in this scenario. It should be clarified that no forced investments in PHEV and BEV are considered in this scenario, while no financial incentives are provided to consumers to promote the purchase of these vehicles.
Smart Charging (SC)
Building on the ET, this scenario examines the extent to which smart charging will enable further electrification of the transport sector and an equivalent increase in renewable electricity generation. In essence, the period under which charging of electric vehicles occurs is decided through the optimisation of the model. No financial incentives are provided in this scenario either.
None of the above scenarios consider development of the interconnector with Greece and Israel, due to the high cost and delays faced by the project, as well as the fact that the present paper aims to analyze the impacts of electrified transport in an isolated system.
Overarching Assumptions
The scenarios adopt low fuel price assumptions so as to be in line with the National Energy and Climate Plan of Cyprus (Table 1; Republic of Cyprus, 2020). As such, the low oil price scenario from an earlier IEA report is used as a basis (IEA, 2015). Since the electricity generation in the European Union falls under the Emission Trading Scheme (ETS), the latest ETS carbon price forecast is also used (European Commission, 2016). The techno-economic characteristics of renewable energy technology options for the generation sector (Table 2) are taken from an earlier study conducted for the Ministry of Energy of Cyprus (Taliotis et al., 2017a).
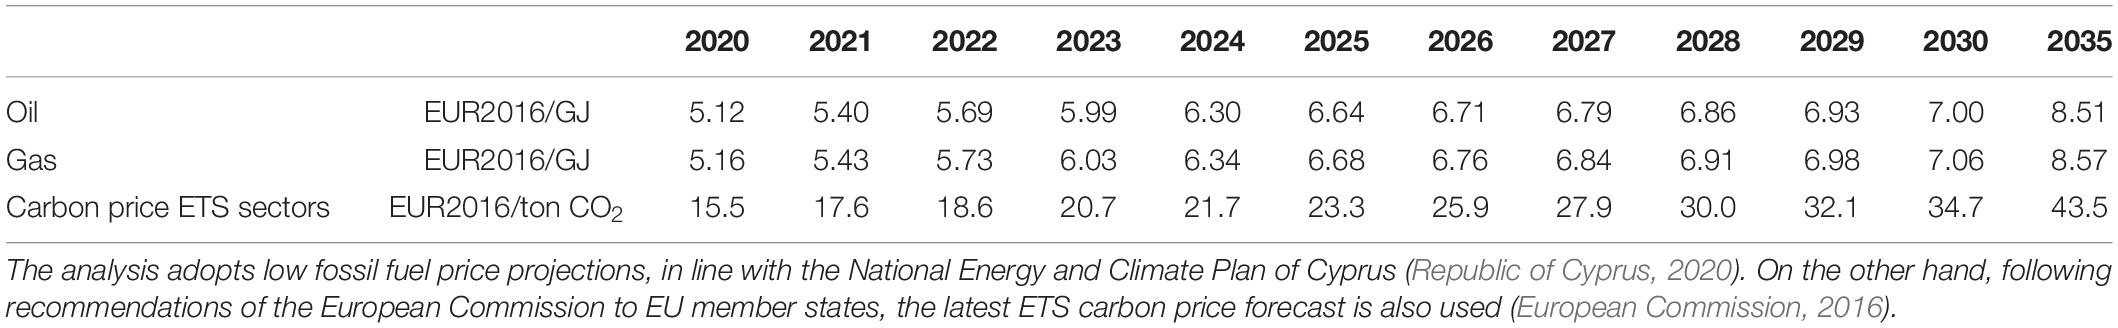
Table 1. International Fuel prices assumed in the model.
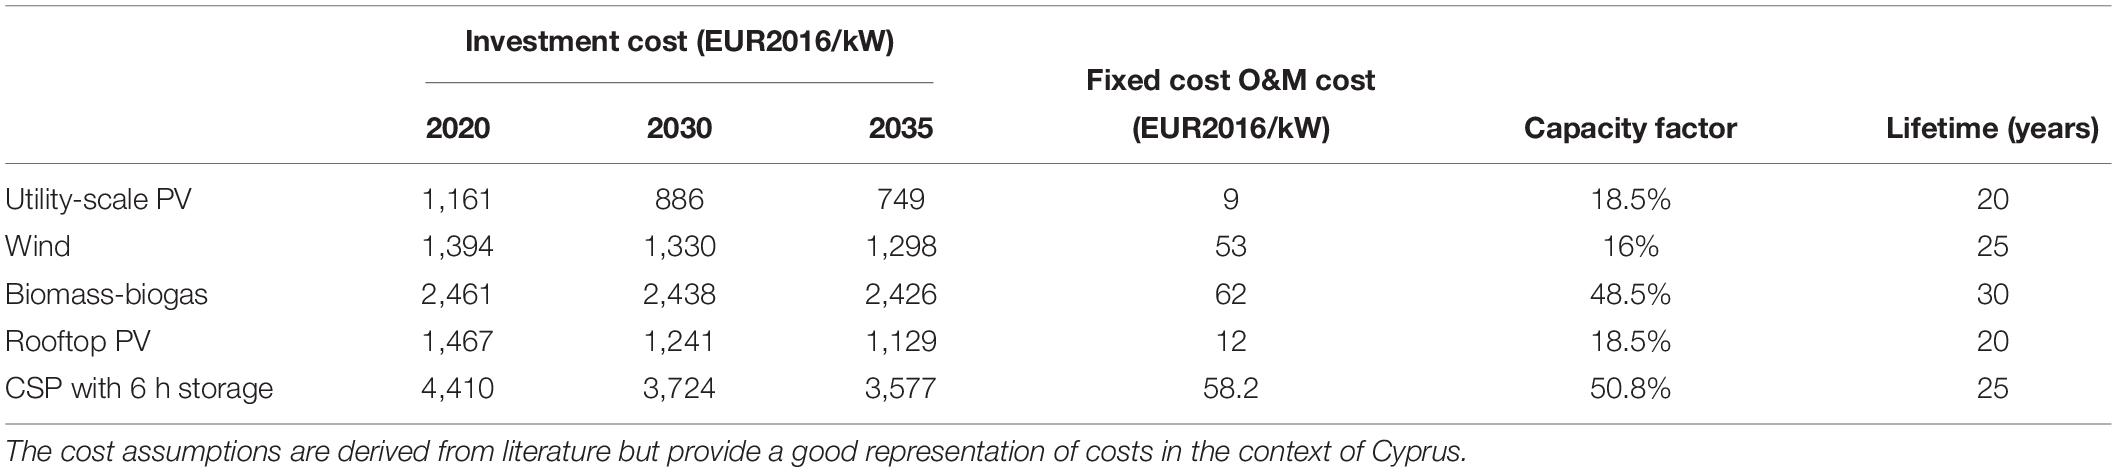
Table 2. Techno-economic assumptions of renewable energy technologies for generation.
Storage technology options are considered in the study as a way to allow higher deployment of intermittent renewable energy in the system. Namely, the possibility for the development of one 130 MW (1040 MWh) pumped hydro facility is included, while lithium ion batteries developed either for centralized storage or behind-the-meter storage are considered, as in the Cypriot NECP (Republic of Cyprus, 2020). Even though Bloomberg NEF projects battery pack costs for stationary applications at 62 EUR2016/kWh by 2030 (Bloomberg New Energy Finance, 2018), more moderate price forecasts from IRENA’s storage cost-of-service tool are used in this study (IRENA, 2017). Nonetheless, these assume a significant cost improvement from 286 EUR2016/kWh in 2020 to 148 EUR2016/kWh by 2030. For the period after 2030, it is assumed that cost improvements would slow down, reaching an installation cost of 134 EUR2016/MWh by 2035. IRENA’s publication also projects that by 2030, the round-trip efficiency of Li-ion batteries would improve to 95%, while the lifetime of the technology would be extended to 15 years.
In regards to the transport sector, different modes of transport, fuel and technology options are considered. It has to be clarified that the assumed purchase cost of the various vehicle technologies is kept identical across all scenario runs, as the present effort focuses on some of the external factors that affect the deployment of these technology options. Information regarding techno-economic assumptions and transport demand projections by mode, which are aligned to the assumptions of the official NECP (Republic of Cyprus, 2020), is provided in the Appendix.
Charging Profile
The degree at which electric vehicles exert pressure on the electricity supply system is largely affected by the assumed period of vehicle charging. This is a very important aspect, as an increased deployment of electric vehicles has the potential to drastically alter the overall demand profile of the respective electricity system. Numerous studies in the literature highlight the importance of identifying a representative charging profile for electric vehicles (Robinson et al., 2013; Speidel and Bräunl, 2014; Brady and O’Mahony, 2016; Xydas et al., 2016; Wang et al., 2017). Since very little information exists in Cyprus due to the currently limited BEV deployment, the adopted charging profile is retrieved from a British case study in available relevant literature (Robinson et al., 2013). As shown in Figure 1, the daily charging profile of private vehicles used in the ET scenario is characterized by two peaks; one in the period 10:00–12:00 and one during 20:00–21:00, with the latter being the highest. This profile is assumed to be representative of Cypriot reality, as the first peak is driven by charging after arriving at the owners’ workplace and before lunch-break, while the evening peak is driven by charging at home.
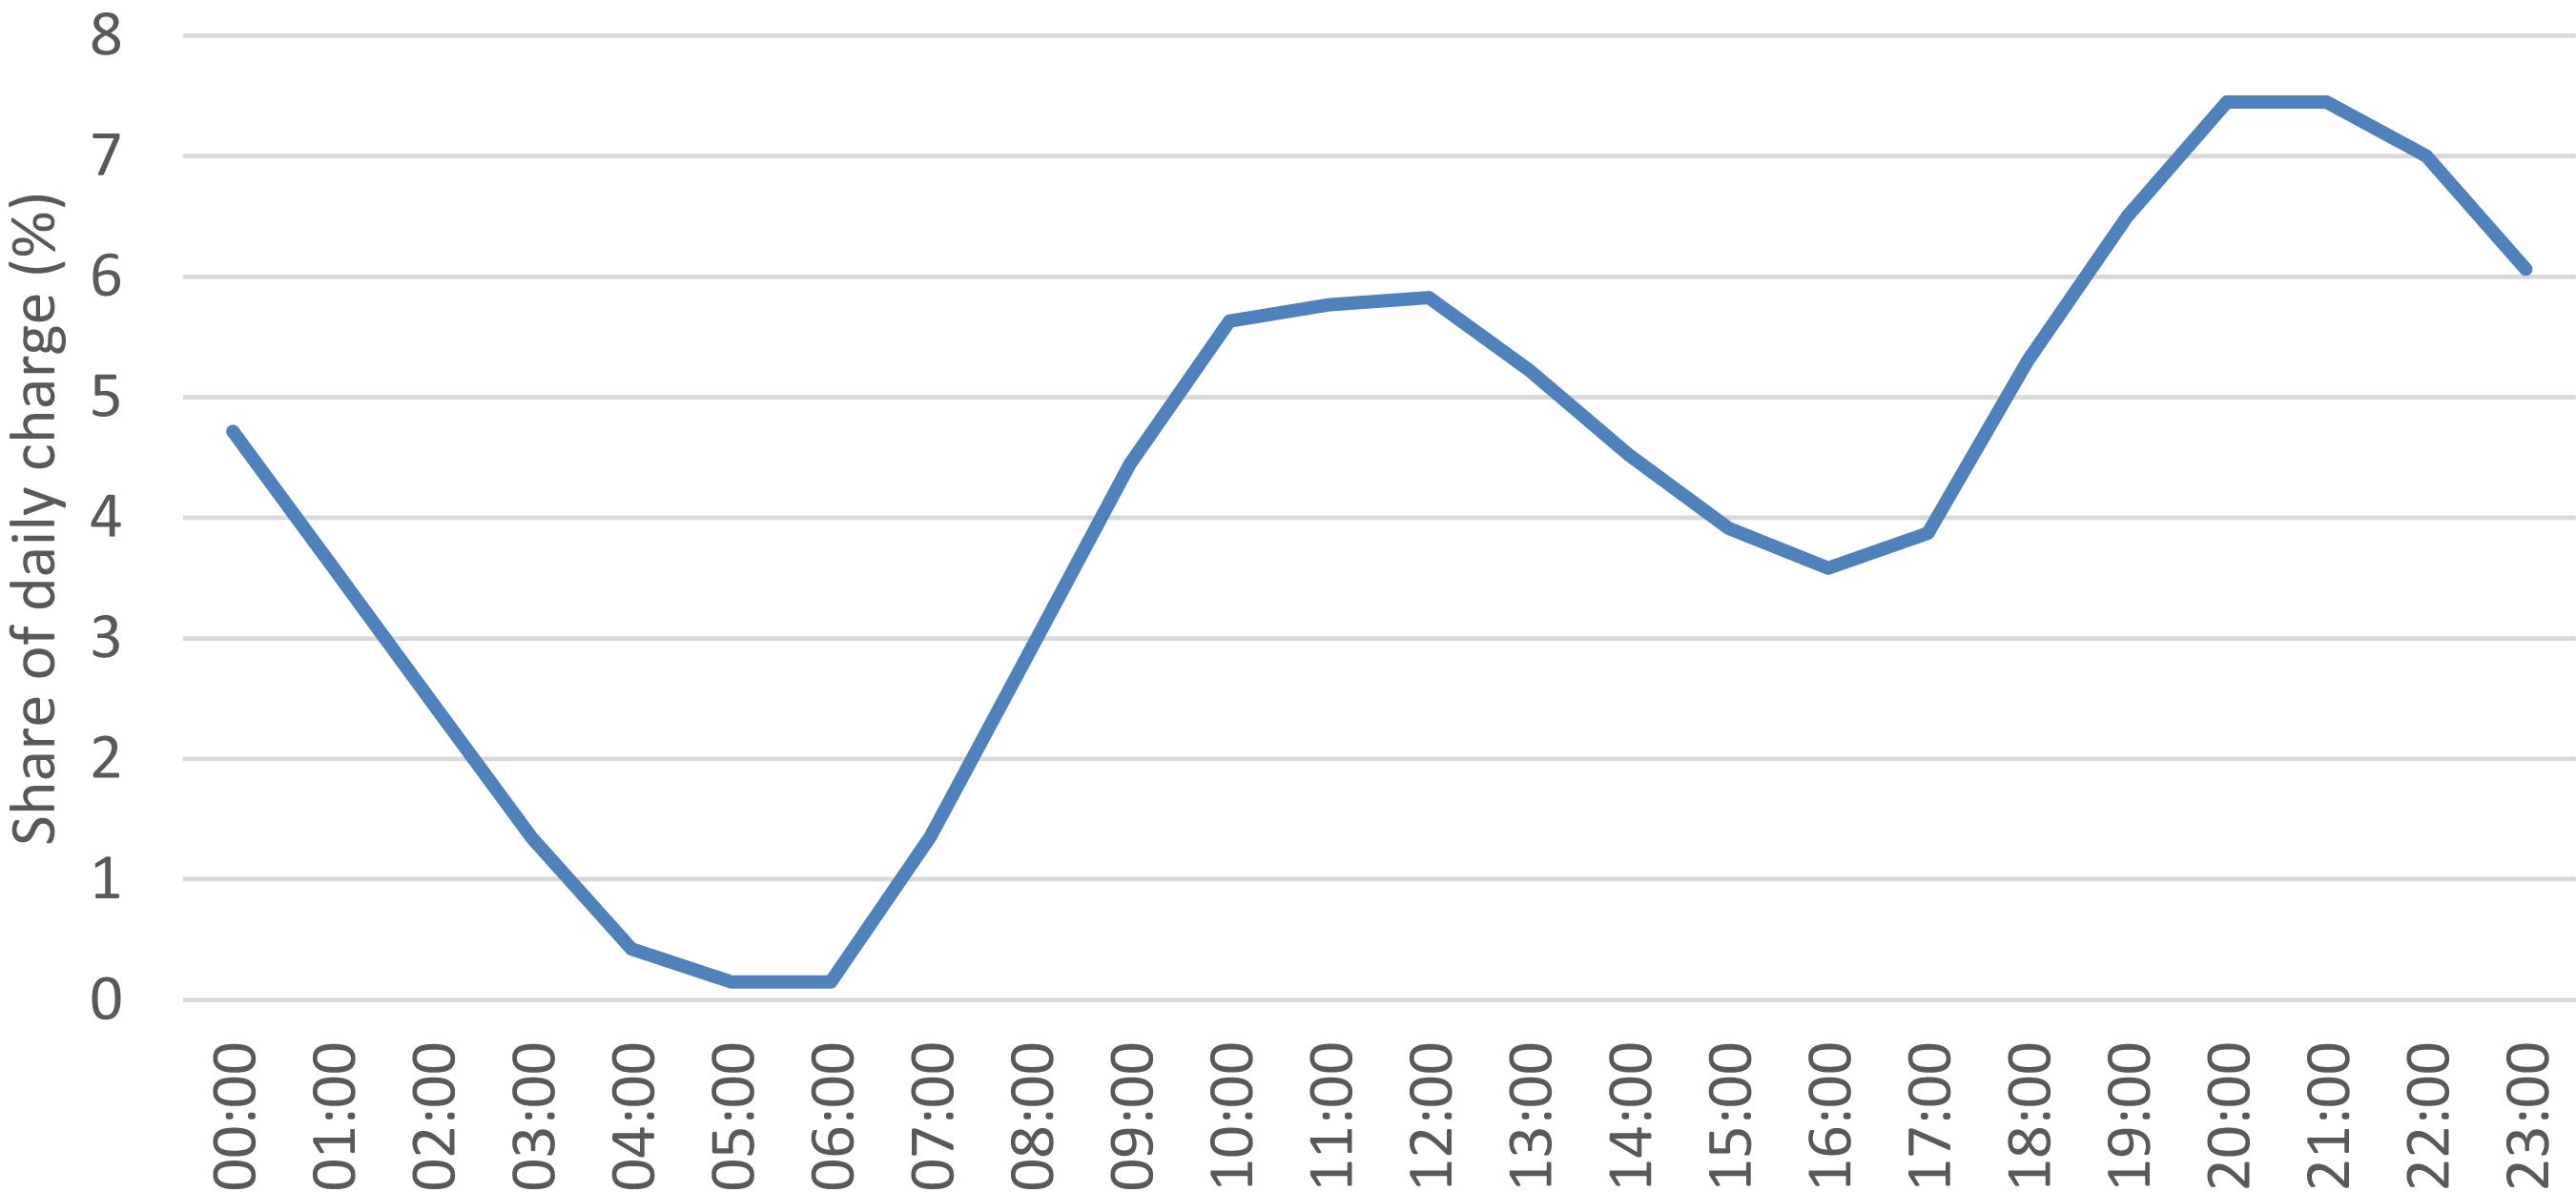
Figure 1. Daily charging profile of private BEVs and PHEVs (adapted from Robinson et al., 2013). Due to insufficient information on charging behavior of electric vehicle owners in Cyprus, information from relevant literature is used as input to the model. Two peaks are observed in the assumed profile, one in the middle of the day, which corresponds to the peak PV generation period, and a larger peak in the evening.
Results and Discussion
Technology Investments and Generation Mix
The scenario results indicate that penetration of renewable energy technologies rises with increased electrification in the transport sector. Specifically, the extent of photovoltaic deployment is higher by 141 MW and 255 MW in the ET scenario as opposed to the REF scenario in 2030 and 2035, respectively (Table 3). The difference is greater in the SC scenario; solar PV capacity is higher by 215 MW in 2030 and 380 MW in 2035 than in the REF case. Despite the higher renewable energy penetration in both instances, the investment outlook for the other generation technologies remains relatively unchanged with one exception: new installations in CCGT are higher by 216 MW in the ET scenario in 2035. This can be explained by the need for additional electricity generation when electric vehicles are deployed in the ET scenario; this demand is satisfied with additional solar PV capacity in the SC scenario, enabled by smart charging.
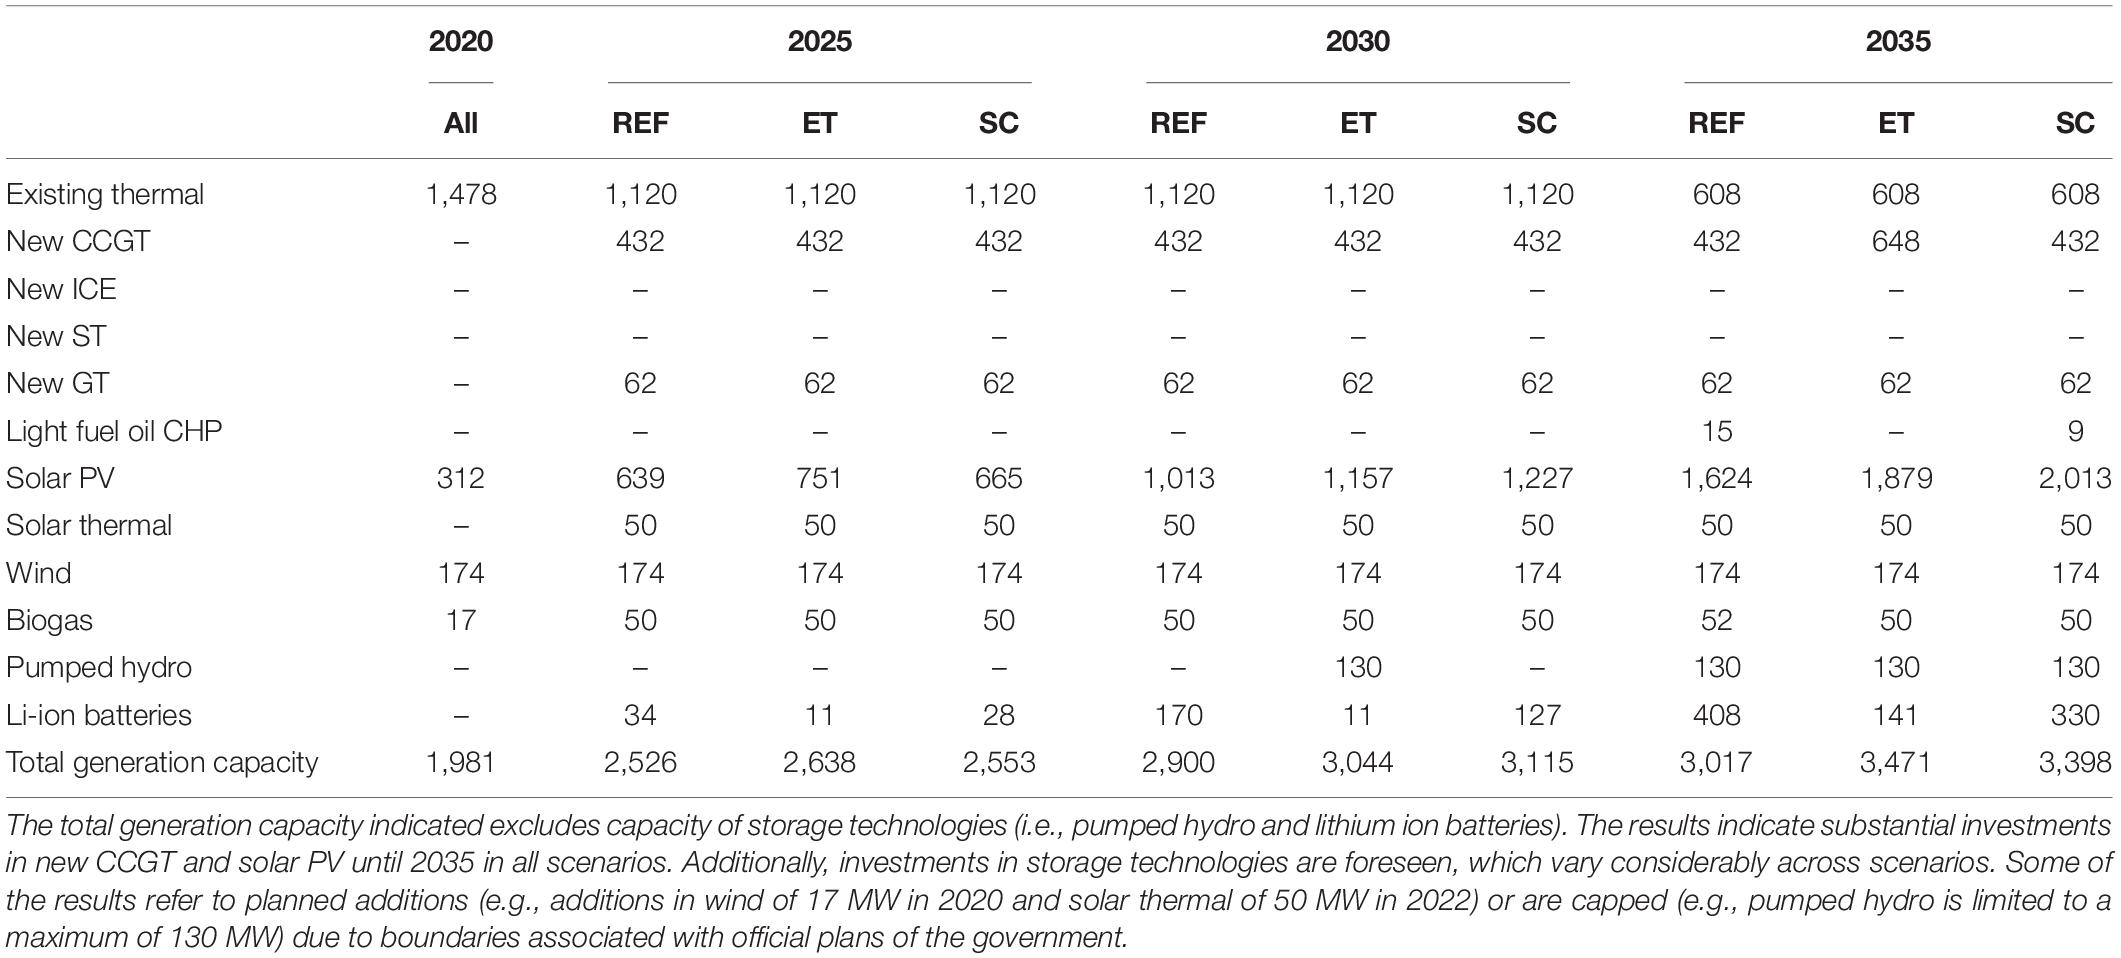
Table 3. Capacity evolution (in MW) for each technology in each scenario (MW).
Deployment of storage technologies varies considerably between scenarios. When the fleet of electric vehicles is limited at current levels in the REF scenario, 170 MW (680 MWh) of lithium ion batteries are deployed by 2030. In the ET scenario, capacity of batteries is reduced to 11 MW (45 MWh), but pumped-hydro storage is developed, giving an overall storage capacity of 1,085 MWh. This additional storage capacity is used for energy arbitrage of the additional renewable electricity generation, which is partially used to satisfy the evening peak charging period. Storage capacity differences are noticed also between the ET and SC scenarios (Table 4). It should be noted that the capacity of the pumped-hydro facility is limited to exactly 130 MW (1,040 MWh) and the model does not have the option to install a different capacity, be it lower or higher. As such, in cases with low storage needs, the cost-effectiveness of batteries as an option is higher.
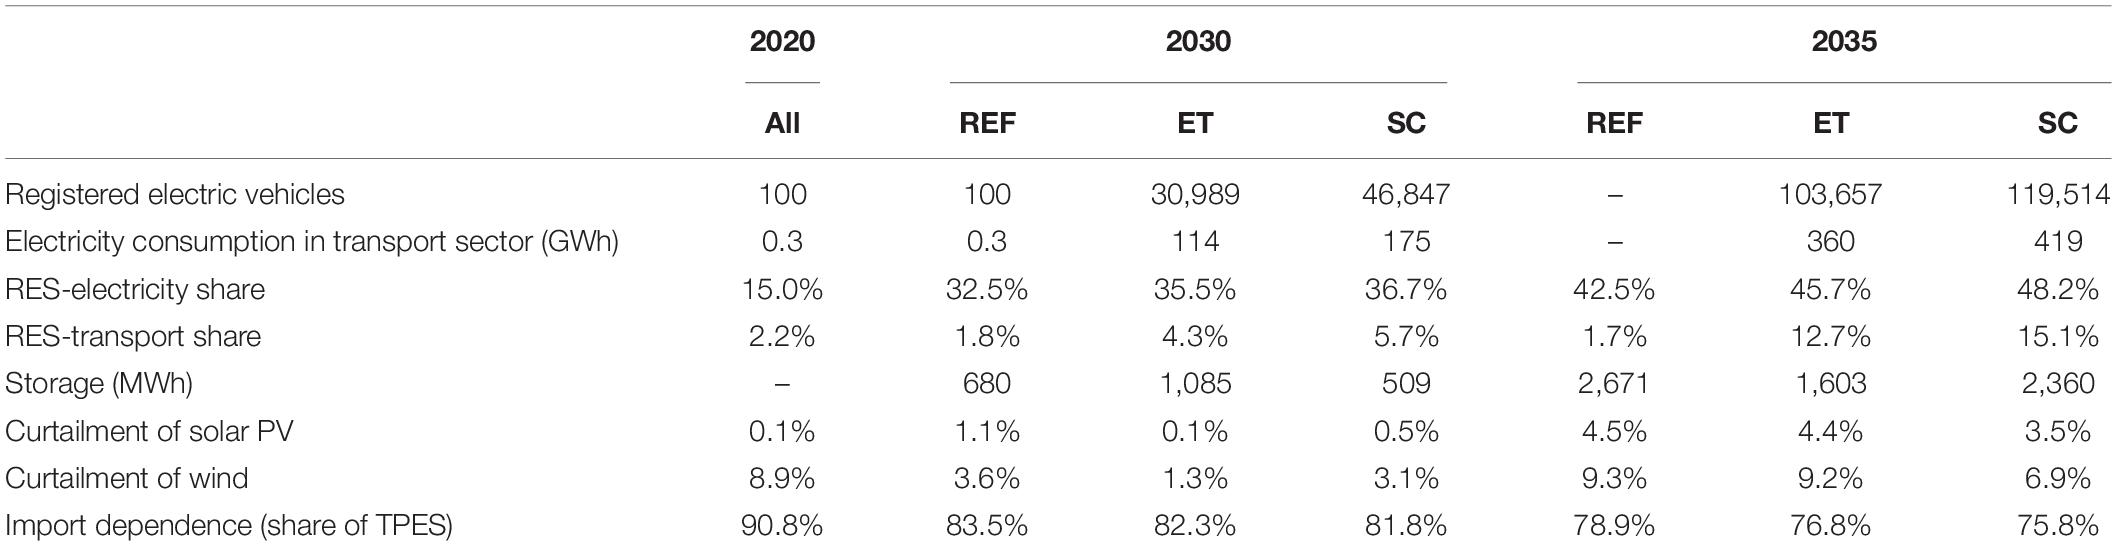
Table 4. Summarized comparison of scenario results.
In terms of electricity generation, the absolute contribution of fossil-fired generation in the REF scenario of the present analysis remains relatively stable between 4,200 and 4,600 GWh (Figure 2). Gas-fired generation is the dominant source of electricity in all scenarios, while even after the introduction of natural gas in the system small amounts of diesel-fired generation can be observed in certain years; the latter is used to satisfy peak demand periods. Nonetheless, the rising electricity demand is met primarily with new solar PV installations. This finding is consistent with EU’s Reference Scenario 2016 for Cyprus; this also indicates that thermal generation will marginally be affected by increasing solar PV generation, which in turn satisfies the increase in electricity demand (European Commission, 2016).
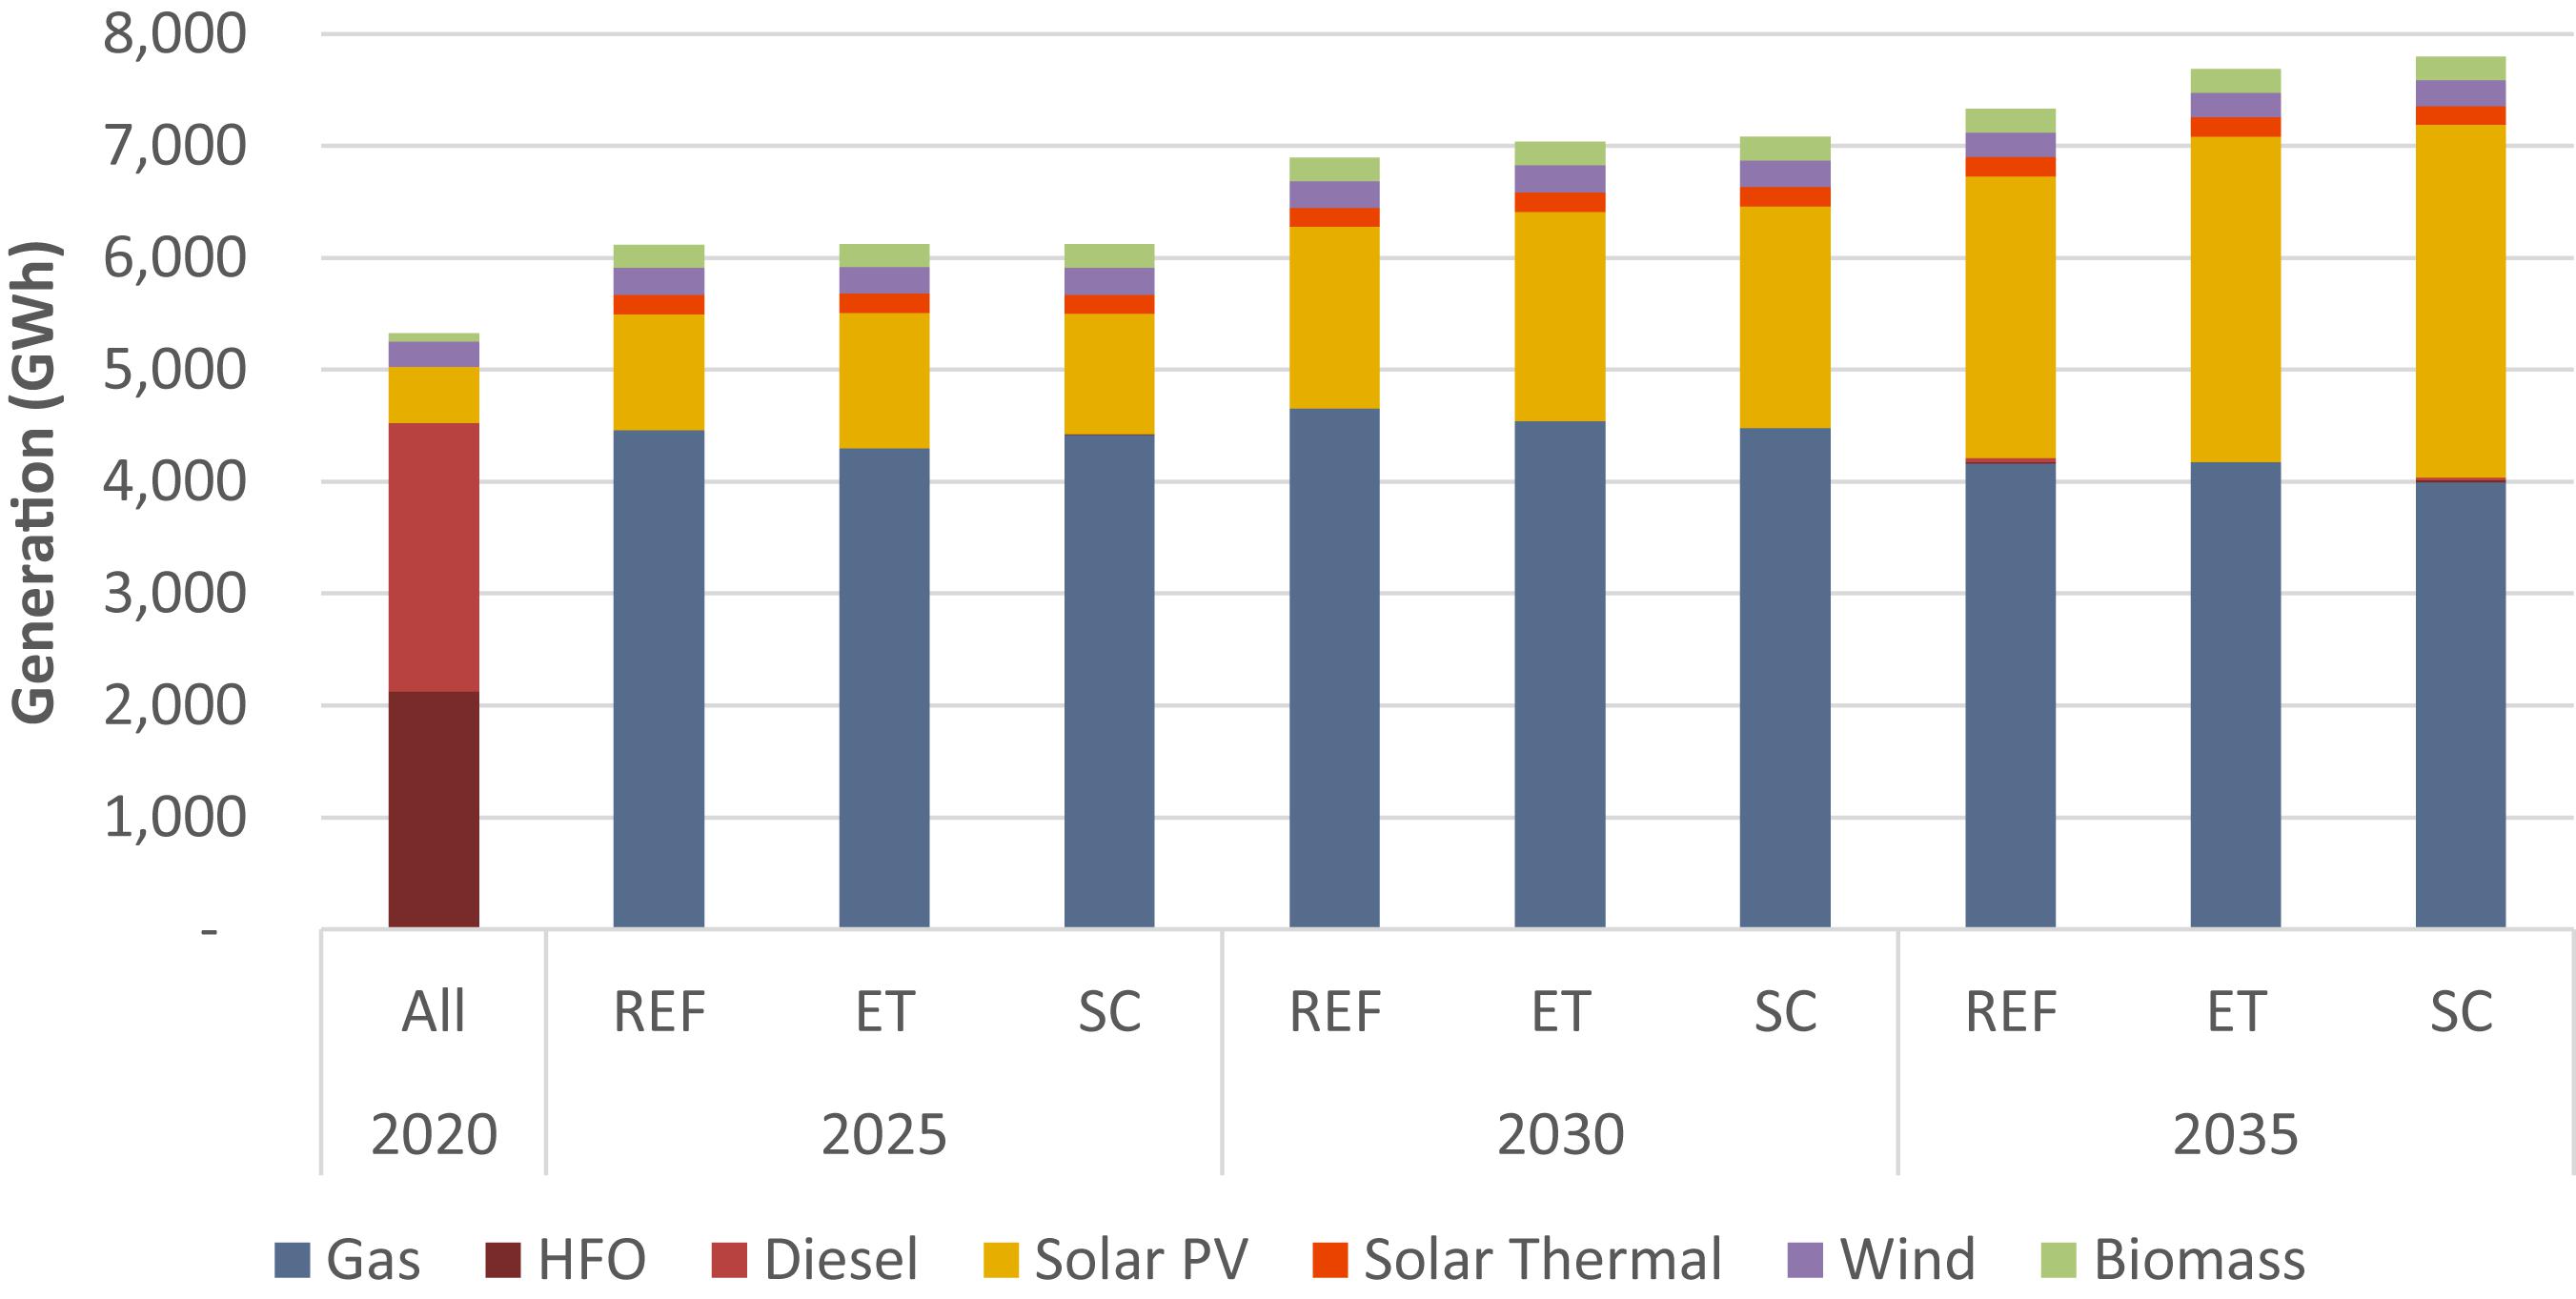
Figure 2. Evolution of generation by technology in each of the three scenarios. Marginal differences are observed between the scenarios, even though generation from renewable energy sources gradually increases as we move from the REF to the ET and the SC scenario. The total amount of electricity generation is noticeably higher in the ET and SC scenarios, as compared to the REF scenario, in 2035 and to a lesser extent in 2030.
The degree of electrification of the transport sector achieved in scenarios ET and SC leads to an increase in the overall electricity demand; electricity generation increases as a result. The ET and SC scenarios are quite comparable, with the exception that renewable electricity generation is higher for the majority of the modeling horizon in the latter. For instance, renewable electricity generation is higher by 100 GWh in 2030 and 245 GWh in 2035 in the SC scenario; this corresponds to an increase of 4% and 7%, respectively, from the ET scenario. The difference can be attributed to the larger electric vehicle fleet and the flexibility offered by smart charging.
Similarly, as compared to the REF scenario, renewable energy generation as a whole is higher in the ET case by 255 GWh and 400 GWh in 2030 and 2035, respectively. Renewable electricity generation reaches 35.5% and 45.7% in the ET scenario and 32.5% and 42.5% in the REF scenario, in 2030 and 2035, respectively. It should be mentioned that the increased renewable energy leads to a marginal reduction in fossil-fired generation. This reduces by 110 GWh in 2030 and 45 GWh when electrification of the transport sector is enabled. The increase in renewable electricity generation can be attributed to the flexibility offered by electric vehicles, as evident in 2035 when storage capacity is lower in the ET scenario, yet the renewable energy share in electricity is higher.
The higher renewable energy share in the ET scenario is on one hand achieved due to the fact that electricity from photovoltaics can be used directly to charge the electric vehicle fleet. It should be noted that, as shown in Figure 1, two charging peaks exist; one at midday and one in the late evening and overnight. The former coincides with the peak photovoltaic generation period. The latter, which is also the highest charging peak occurs during periods of zero generation from photovoltaics, but at a time where electric vehicle charging can help to keep thermal plants online for longer periods. It should be mentioned that additional to the renewable energy investments, thermal plants with higher ramping capability are also deployed on the supply side; 62 MW of flexible ICE units become developed for the period 2020–2040. Similarly, two new CCGT units of 216 MW each are developed in all scenarios by 2030, while a third CCGT unit is needed by 2035 in the ET scenario.
Most electric vehicle purchases occur after 2025 in both the ET and SC scenarios, hence differences in the results are primarily observed in the period 2030–2035. A detailed breakdown of the vehicle fleet projection in each scenario for all modes of transport and vehicle technologies is provided in the Appendix. Table 4 provides an overview of key results from the three scenarios. Penetration of electric vehicles is highest in the SC scenario; for instance, in 2030 the electric vehicle fleet is 50% higher in SC than in the ET scenario. Smart charging in the former case allows vehicles to be charged when cheap electricity is available, whereas peak charging in the latter scenario coincides with peak electricity demand and low renewable energy generation periods. Thus, electric vehicle deployment is more cost-effective in the SC scenario.
The increased electric vehicle deployment results in an equivalent increase in electricity demand. Consumption of electricity in the transport sector corresponds to 2% and 3% in 2030, and 5% and 6% in 2035 of the total final electricity demand in the ET and SC scenarios, respectively. However, this small increase in electricity demand increase allows the electrification of up to 6% and 13% of the total road transport vehicle fleet in 2030 and 2035, respectively in the SC scenario.
Moreover, the renewable energy share in electricity is highest in the SC case, while it is lowest in the REF case throughout the model horizon. This has an analogous effect on the renewable energy share of the transport sector. Even though storage capacity is higher in the ET case than the SC case in 2030, the situation reverses in 2035. The scenario with the highest storage capacity in each of these instances coincides with the lowest level of renewable energy curtailment. As a result of the increasing renewable energy share, when moving from the REF to the ET and the SC scenarios, the import dependence decreases (Table 4); this indicator quantifies the amount of imported energy as a share of Total Primary Energy Supply (TPES). This illustrates the benefits offered by increased electrification to energy security, as it reduces reliance on imported fossil fuels.
Focusing at the end of the model horizon, it is interesting to note that storage capacity is higher in the REF scenario than the ET and SC scenarios in 2035, despite the lower renewable energy share. The necessity for more electrical storage in the REF scenario can be attributed to the lack of adequate electricity demand that can absorb electricity generation from intermittent renewable energy technologies.
Overall, the technology deployment results indicate that electric vehicles have an enabling effect on renewable energy technology deployment. They also affect the requirements for storage, while assist in limiting renewable energy curtailment to lower levels. This effect is enhanced when smart charging is implemented.
Impact on Greenhouse Gas Emissions and System Costs
An important finding of the analysis relates to the fact that fossil-fired generation and, hence, greenhouse gas emissions in the electricity supply sector decrease with increased penetration of renewables in the ET and SC scenarios. At the same time, deployment of electric vehicles as alternatives to internal combustion engine vehicles leads to a simultaneous reduction in greenhouse gas emissions in the transport sector. As such, an overall greenhouse gas emissions decrease can be observed. The combined impact on these emissions in the electricity supply sector, which falls under the EU’s Emission Trading Scheme (ETS), and the non-ETS sectors, which includes the transport sector, is shown in Table 5. In comparison to the REF scenario, by 2030, a reduction of 2.7% and 3.7% in overall energy system emissions is achieved in the ET and SC scenarios, respectively; the overall reduction increases to 6.6% and 7.5% in each of the two scenarios by 2035.
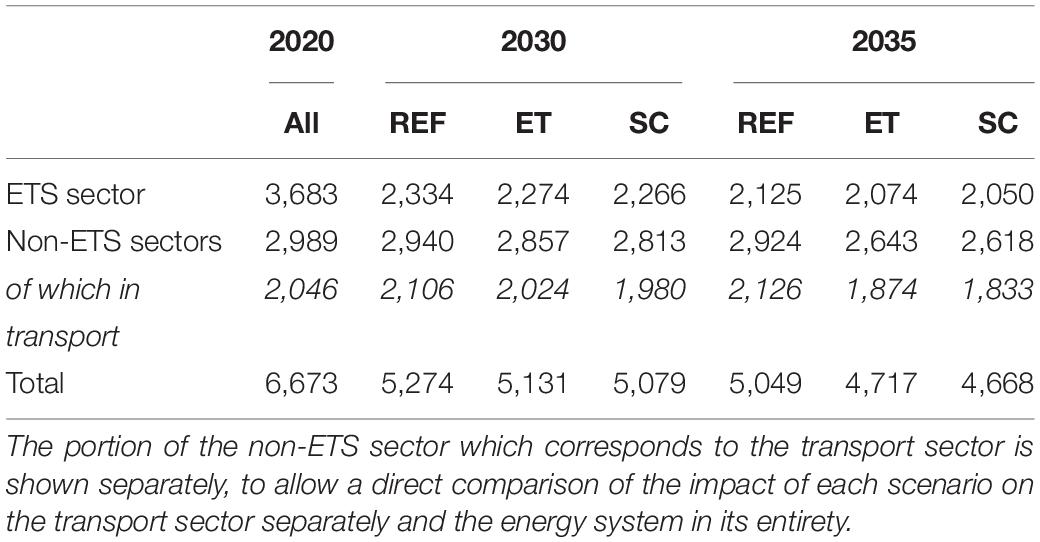
Table 5. Energy related greenhouse gas emissions in the ETS and non-ETS sectors in each scenario (kt CO2 eq).
In order to estimate the overall greenhouse gas intensity of the road transport fleet, the lifecycle carbon intensity factor for each fuel is taken from Directive (EU) 2015/652 (European Union, 2015), while the carbon intensity of electricity is estimated directly from the model results. The total carbon emission of the road transport fleet is then divided by the total distance traveled by the fleet, so as to assess the evolution of the fleet’s carbon intensity across the scenarios (Table 6); this includes all vehicle categories, such as passenger cars, light commercial vehicles and heavy-duty vehicles. An improvement is noticed in all scenarios for the period 2020–2035, but this is greater in the scenarios with electrified transport. In the REF scenario, a reduction of 15% is achieved during this period by 2035; the corresponding reductions amount to 23% in the ET and 24% in the SC scenario.
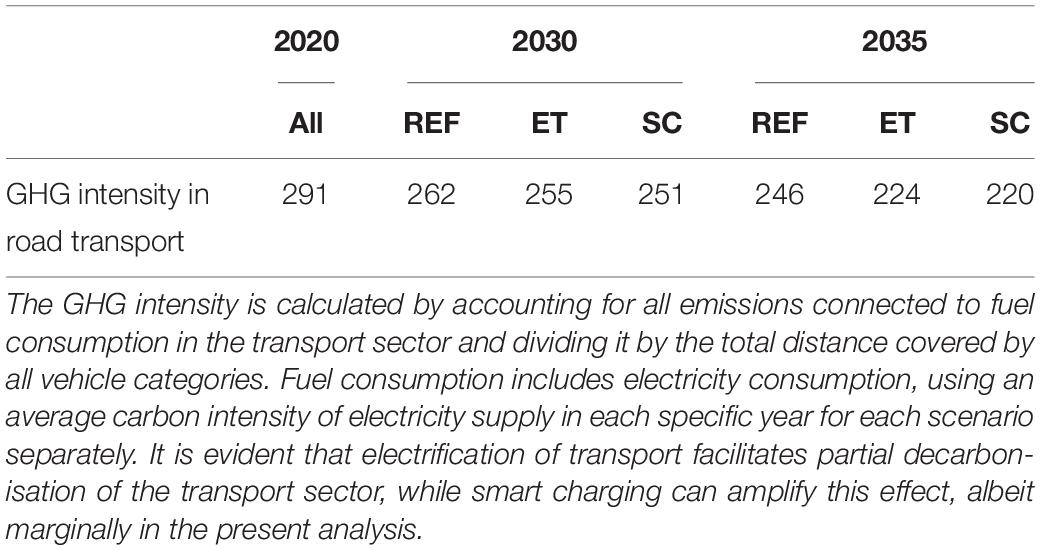
Table 6. Average GHG intensity (g CO2 eq/km) in the road transport sector in each scenario.
The aforementioned differences in generation mix, technology investments and emissions affect the average electricity cost of the system. In the REF scenario, electricity cost varies between 108 EUR2016/MWh in 2020 to 102 EUR2016/MWh in 2030 and 116 EUR2016/MWh in 2035 (Figure 3). When electric vehicles are deployed, electricity cost decreases in the ET scenario to 102 EUR2016/MWh in 2030 and 113 EUR2016/MWh in 2035. Furthermore, in the SC scenario, where smart charging is enabled, electricity cost is comparable to the ET case, but decreases slightly to 112 EUR2016/MWh in 2035. Despite the additional level of investments in solar PV and an increased electricity demand in the ET and SC scenarios, deployment of inexpensive generation options in combination with electrification of transport results in small, albeit noticeable considering the size of Cyprus, cost savings. By 2035 the annual cost savings in electricity supply correspond to 22 million EUR2016 and 34 million EUR2016 in the ET and SC scenarios, respectively.
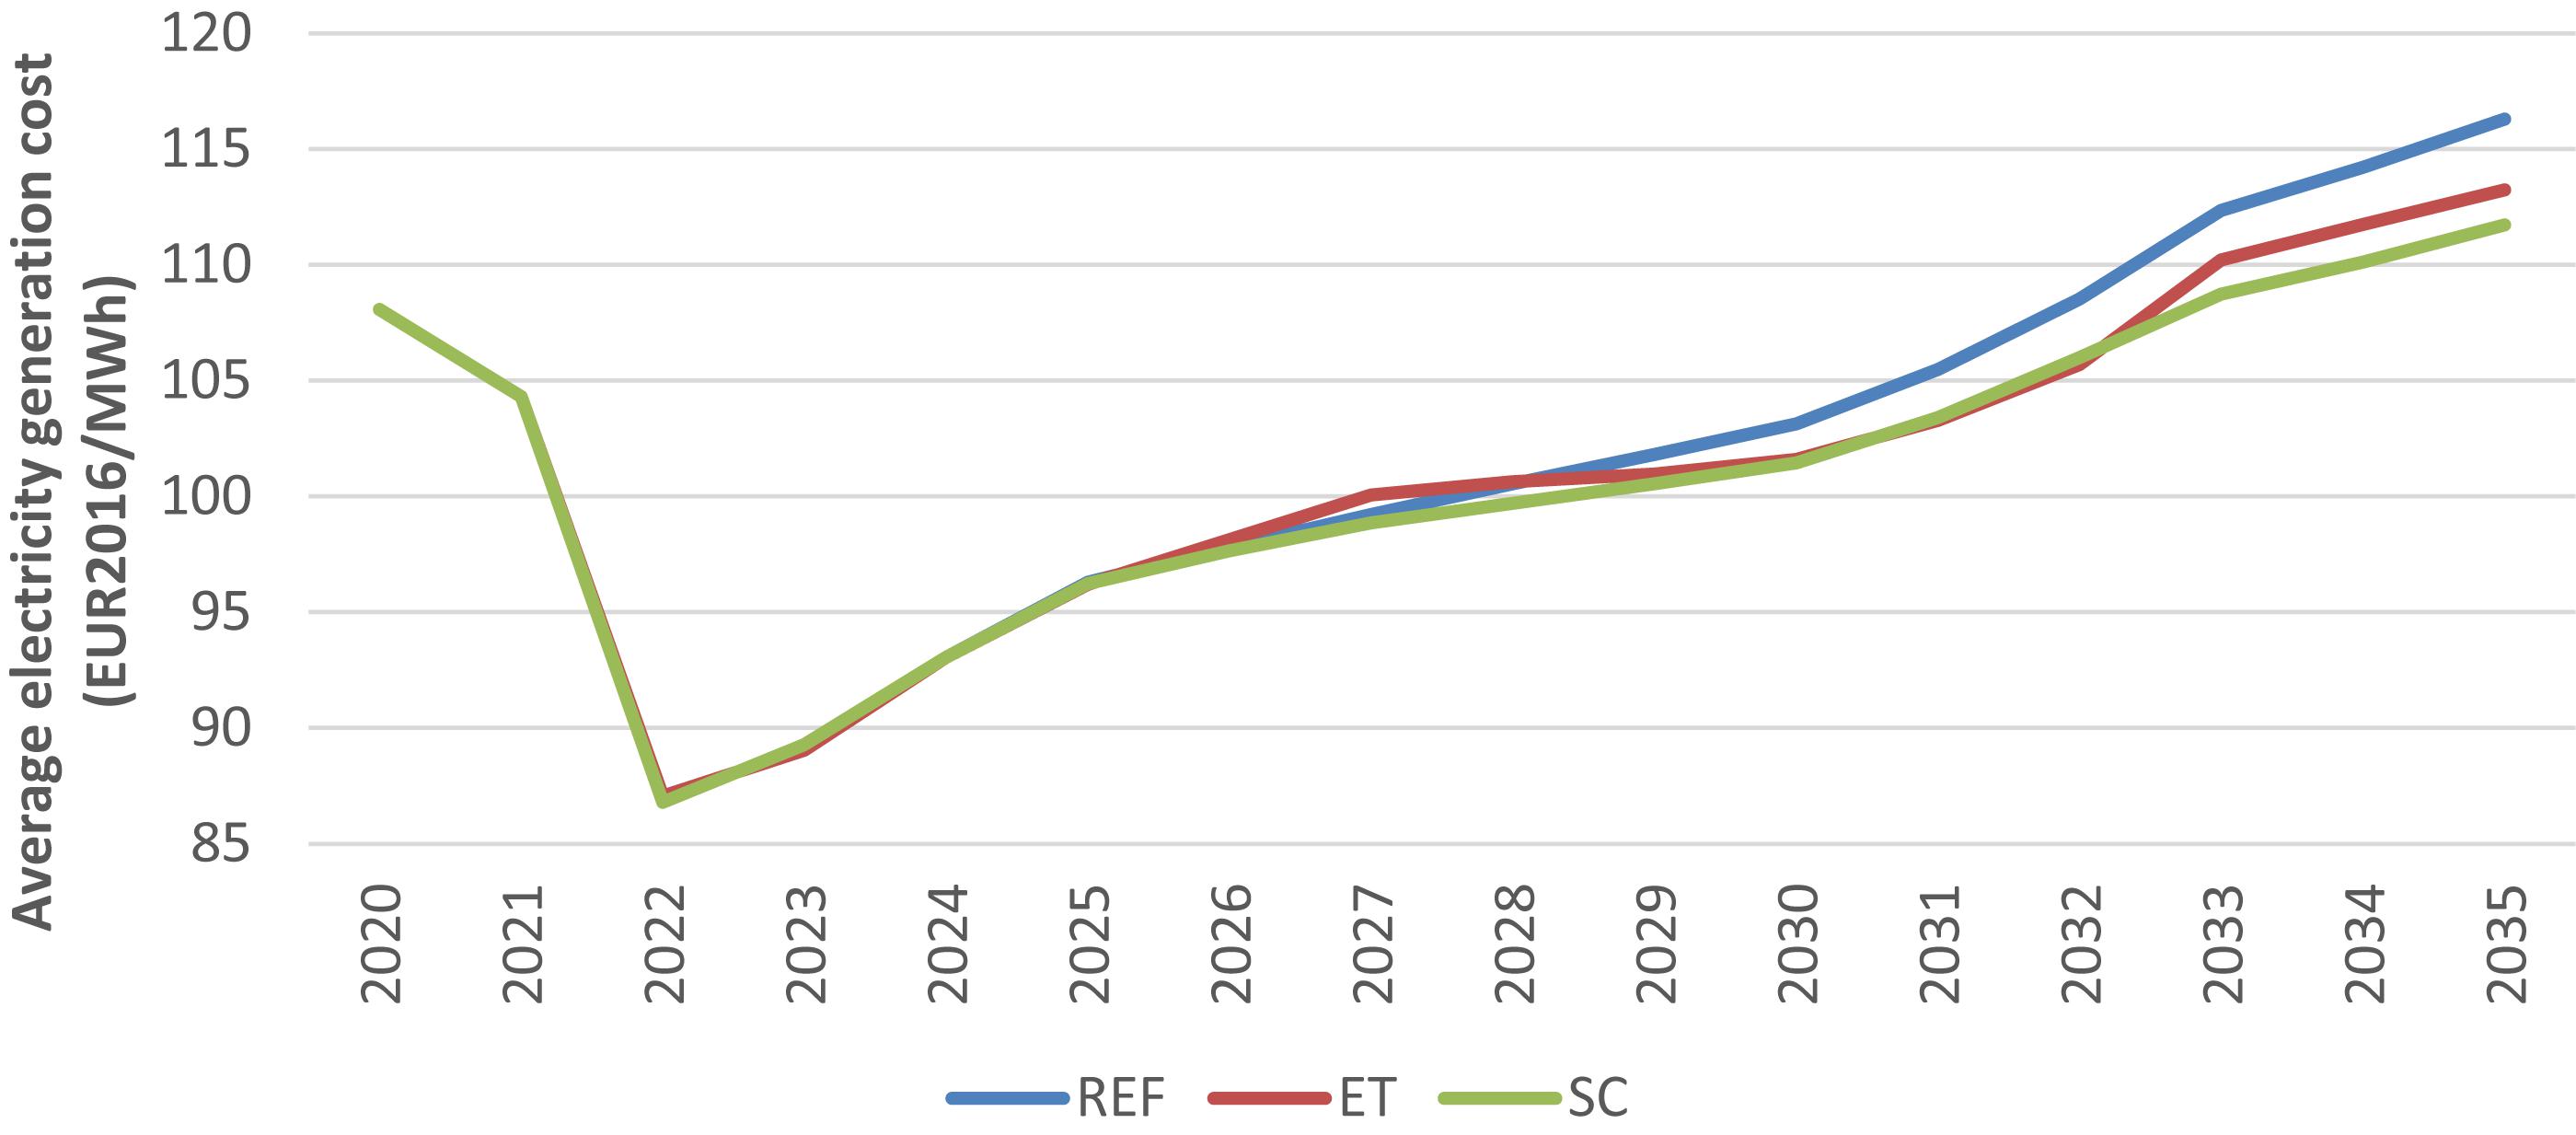
Figure 3. Average electricity generation cost projection in the three scenarios. The electricity cost is the same across scenarios until 2025, as noticeable differences in the electrification of transport only occur after this point. Even though differences between the scenarios are marginal, the REF scenario illustrates the highest electricity cost, while the lowest is observed in the SC scenario.
Conclusion
The analysis presented in this paper provides a strong indication that electrification of the transport sector can assist in the integration of a higher share of renewable energy technologies in the Cyprus electricity supply. This also leads to a reduction of carbon dioxide emissions, without compromising electricity prices.
The number of charging points will have to increase considerably to allow the envisioned electric vehicle deployment, while operation within a broader smart grid will have to be developed for the implementation of smart charging. Non-etheless, additional to the technical infrastructure required to enable such an operation, institutional infrastructure needs to be established to allow consumers to actively participate in the future electricity market. The adoption of time-of-use electricity tariffs is a measure that will promote vehicle charging in low electricity demand or peak renewable energy generation periods. Incentives to consumers will encourage vehicle owners to follow a flexible charging schedule based on the availability of cheap electricity and intra-day fluctuations of electricity demand.
The present study has certain limitations. Cost-optimisation models assuming perfect competition, perfect foresight and a rational economic behavior by consumers are not fully representative of the decision criteria influencing investments, especially so in the transport sector. Similarly, the model assumes perfect access to information and a simultaneous reaction of consumers to real-time energy prices, which does not reflect reality. However, the analysis strives to illustrate the exploitable potential of the respective technology and energy mix in each of the scenarios.
The analysis illustrates that the charging profile of electric vehicles can have a direct impact on the generation mix of the Cyprus system. As the battery pack characteristics of electric vehicles may change in the future to accommodate longer ranges, charging may require higher energy densities, leading to more noticeable peaks, or longer charging times, thus affecting the charging behavior of vehicle owners. This is an aspect that will have to be assessed further as it can potentially introduce challenges in handling sudden electricity load variations, thus reducing the enabling effect of electric vehicles on renewable energy technologies observed in the present paper.
Future work will include development of a scenario assuming operation of a vehicle-to-grid system to assess the further impact of this aspect on renewable energy, electric vehicle deployment, as well as the effect on electric storage investment outlook. Further, adoption of demand profiles based on local data can be enabled when these become available with time.
Finally, the presented work provides insights to some of the benefits of electrified transport and provides results within certain predefined boundaries. It does not make a comparison to the cost of other measures needed to achieve deep decarbonisation of the entire energy system. As an EU member state, Cyprus must adhere with the objectives set out in the European Green Deal. As such, future enhancements of the present work will have to explore pathways for net-zero emissions by 2050, considering the broader financial implications of various decarbonisation strategies.
Data Availability Statement
The datasets for this article are not publicly available because of contractual confidentiality restrictions in the relevant support provided to the authorities of Cyprus. Requests to access the datasets should be directed to CT, c.taliotis@cyi.ac.cy.
Author Contributions
CT performed conceptualization, methodology, data curation, simulations, visualization, and original draft. NF performed conceptualization, supervision, and original draft. GP, FG, VS, and MK reviewed and edited the original draft. CP supervised and reviewed and edited original draft. All authors contributed to the article and approved the submitted version.
Funding
This work is supported by the European Union’s Horizon 2020 Research and Innovation Programme within the context of the CySTEM ERA Chair project, under grant agreement no. 667942.
Conflict of Interest
The authors declare that the research was conducted in the absence of any commercial or financial relationships that could be construed as a potential conflict of interest.
Footnotes
- ^ A noticeable example is the planned addition of a solar thermal facility of 50 MW in the electricity supply sector in 2022.
References
Anjos, M. F., Gendron, B., and Joyce-Moniz, M. (2020). Increasing electric vehicle adoption through the optimal deployment of fast-charging stations for local and long-distance travel. Eur. J. Operat. Res. 285, 263–278. doi: 10.1016/j.ejor.2020.01.055
Bloomberg New Energy Finance (2018). New Energy Outlook 2018. New York, NY: Bloomberg New Energy Finance.
Brady, J., and O’Mahony, M. (2016). Modelling charging profiles of electric vehicles based on real-world electric vehicle charging data. Sustain. Cities Soc. 26, 203–216. doi: 10.1016/j.scs.2016.06.014
Cheng, A. J., Tarroja, B., Shaffer, B., and Samuelsen, S. (2018). Comparing the emissions benefits of centralized vs. decentralized electric vehicle smart charging approaches: a case study of the year 2030 California electric grid. J. Power Sources 401, 175–185. doi: 10.1016/j.jpowsour.2018.08.092
European Commission (2016). EU Reference Scenario 2016 - Energy, Transport and GHG Emissions. Trends to 2050. Brussels: European Commission.
European Commission (2019). Communication From the Commission to the European Parliament, the European Council, the Council, the European Economic and Social Committee and the Committee of the Regions - The European Green Deal, COM(2019) 640 Final. Brussels: European Commission.
European Union (2015). Council Directive (EU) 2015/652 of 20 April 2015 Laying Down Calculation Methods and Reporting Requirements Pursuant to Directive 98/70/EC of the European Parliament and of the Council Relating to the Quality of Petrol and Diesel Fuels, 107. Brussels: European Union.
European Union (2018). Directive (EU) 2018/2001 of the European Parliament and of the Council of 11 December 2018 on the Promotion of the Use of Energy From Renewable Sources (Text with EEA relevance.), 328. Brussels: European Union.
Eurostat (2019). Database - Environment and Energy - Energy Statistics - Complete Energy Balances [WWW Document]. Available online at: https://ec.europa.eu/eurostat/data/database (accessed on 21 May 2019).
evrater (2019). List of Electric Vehicles (2019) [WWW Document]. EV Rater. Available online at: https://evrater.com/evs (accessed on 8 August 2019).
Falahati, S., Taher, S. A., and Shahidehpour, M. (2016). A new smart charging method for EVs for frequency control of smart grid. Int. J. Electr. Power Energy Syst. 83, 458–469. doi: 10.1016/j.ijepes.2016.04.039
Financial Mirror (2019). CYPRUS: Parliament to Summon Energy Minister Over EuroAsia Debacle. Nicosia: Financial Mirror.
Gardumi, F., Shivakumar, A., Morrison, R., Taliotis, C., Broad, O., Beltramo, A., et al. (2018). From the development of an open-source energy modelling tool to its application and the creation of communities of practice: the example of OSeMOSYS. Energy Strat. Rev. 20, 209–228. doi: 10.1016/j.esr.2018.03.005
Groissböck, M. (2019). Are open source energy system optimization tools mature enough for serious use? Renew. Sustain. Energy Rev. 102, 234–248. doi: 10.1016/j.rser.2018.11.020
Howells, M., Rogner, H., Strachan, N., Heaps, C., Huntington, H., Kypreos, S., et al. (2011). OSeMOSYS: the open source energy modeling system: an introduction to its ethos, structure and development. Energy Policy Sustainabil. Biofuels 39, 5850–5870. doi: 10.1016/j.enpol.2011.06.033
IEA (2015). World Energy Outlook 2015. Organisation for Economic Co-operation and Development. Paris: International Energy Agency.
IPCC (2018). Global Warming of 1.5°C. An IPCC Special Report on the Impacts of Global Warming of 1.5 °C Above Pre-Industrial Levels and Related Global Greenhouse Gas Emission Pathways, in the Context of Strengthening the Global Response to the Threat of Climate Change, Sustainable Development, and Efforts to Eradicate Poverty. Geneva: Intergovernmental Panel on Climate Change.
IRENA (2015). Renewable Energy Roadmap for the Republic of Cyprus. Abu Dhabi: International Renewable Energy Agency.
IRENA (2017). Electricity Storage and Renewables: Costs and Markets to 2030. Abu Dhabi: International Renewable Energy Agency.
IRENA (2018). Renewable Power Generation Costs in 2017. Abu Dhabi: International Renewable Energy Agency.
Jian, L., Yongqiang, Z., and Hyoungmi, K. (2018). The potential and economics of EV smart charging: a case study in Shanghai. Energy Policy 119, 206–214. doi: 10.1016/j.enpol.2018.04.037
JRC (2016). Integration of a High Share of Variable RES in the Cyprus Power System - Project Summary. Ispra: JRC.
Keller, V., Lyseng, B., Wade, C., Scholtysik, S., Fowler, M., Donald, J., et al. (2019). Electricity system and emission impact of direct and indirect electrification of heavy-duty transportation. Energy 172, 740–751. doi: 10.1016/j.energy.2019.01.160
Lelieveld, J., Proestos, Y., Hadjinicolaou, P., Tanarhte, M., Tyrlis, E., and Zittis, G. (2016). Strongly increasing heat extremes in the Middle East and North Africa (MENA) in the 21st century. Clim. Change 137, 245–260. doi: 10.1007/s10584-016-1665-6
Löffler, K., Hainsch, K., Burandt, T., Oei, P.-Y., Kemfert, C., and Von Hirschhausen, C. (2017). Designing a model for the global energy system—GENeSYS-MOD: an application of the open-source energy modeling system (OSeMOSYS). Energies 10:1468. doi: 10.3390/en10101468
Niet, T., Lyseng, B., English, J., Keller, V., Palmer-Wilson, K., Robertson, B., et al. (2018). Valuing infrastructure investments to reduce curtailment. Energy Strategy Rev. 22, 196–206. doi: 10.1016/j.esr.2018.08.010
Nykvist, B., and Nilsson, M. (2015). Rapidly falling costs of battery packs for electric vehicles. Nat. Clim. Change 5, 329–332. doi: 10.1038/nclimate2564
Pinto, de Moura, G. N., Loureiro Legey, L. F., Balderrama, G. P., and Howells, M. (2017). South America power integration, Bolivian electricity export potential and bargaining power: an OSeMOSYS SAMBA approach. Energy Strat. Rev. 17, 27–36. doi: 10.1016/j.esr.2017.06.002
Poullikkas, A., Kourtis, G., and Hadjipaschalis, I. (2011). A hybrid model for the optimum integration of renewable technologies in power generation systems. Energy Policy Spec. Sect. Offshore Wind Power Plan. Econ. Environ. 39, 926–935. doi: 10.1016/j.enpol.2010.11.018
Rady, Y. Y., Rocco, M. V., Serag-Eldin, M. A., and Colombo, E. (2018). Modelling for power generation sector in developing countries: case of Egypt. Energy 165, 198–209. doi: 10.1016/j.energy.2018.09.089
Republic of Cyprus (2020). Cyprus’ Integrated National Energy and Climate Plan. Nicosia: The Republic of Cyprus. Available online at: https://ec.europa.eu/energy/sites/ener/files/documents/cy_final_necp_main_en.pdf.
Riahi, K., Dentener, F., Gielen, D., Grubler, A., Jewell, J., Klimont, Z., et al. (2012). Chapter 17 - Energy Pathways for Sustainable Development, in: Global Energy Assessment - Toward a Sustainable Future. Laxenburg: The International Institute for Applied Systems Analysis, 1203–1306.
Robinson, A. P., Blythe, P. T., Bell, M. C., Hübner, Y., and Hill, G. A. (2013). Analysis of electric vehicle driver recharging demand profiles and subsequent impacts on the carbon content of electric vehicle trips. Energy Policy 61, 337–348. doi: 10.1016/j.enpol.2013.05.074
Ruhnau, O., Bannik, S., Otten, S., Praktiknjo, A., and Robinius, M. (2019). Direct or indirect electrification? A review of heat generation and road transport decarbonisation scenarios for Germany 2050. Energy 166, 989–999. doi: 10.1016/j.energy.2018.10.114
Shakya, S. R., and Shrestha, R. M. (2011). Transport sector electrification in a hydropower resource rich developing country: energy security, environmental and climate change co-benefits. Energy Sustain. Dev. 15, 147–159. doi: 10.1016/j.esd.2011.04.003
Siskos, P., Zazias, G., Petropoulos, A., Evangelopoulou, S., and Capros, P. (2018). Implications of delaying transport decarbonisation in the EU: a systems analysis using the PRIMES model. Energy Policy 121, 48–60. doi: 10.1016/j.enpol.2018.06.016
Speidel, S., and Bräunl, T. (2014). Driving and charging patterns of electric vehicles for energy usage. Renew. Sustain. Energy Rev. 40, 97–110. doi: 10.1016/j.rser.2014.07.177
Sridharan, V., Broad, O., Shivakumar, A., Howells, M., Boehlert, B., Groves, D. G., et al. (2019). Resilience of the Eastern African electricity sector to climate driven changes in hydropower generation. Nat. Commun. 10:302. doi: 10.1038/s41467-018-08275-7
Taliotis, C., Howells, M., Partasides, G., and Gardumi, F. (2017a). Cost-Optimal Scenario Analysis for the Cypriot Energy System - Conducted Under the European Commission Grant VC/2015/0004. Stockholm: KTH-dESA.
Taliotis, C., Rogner, H., Ressl, S., Howells, M., and Gardumi, F. (2017b). Natural gas in Cyprus: the need for consolidated planning. Energy Policy 107, 197–209. doi: 10.1016/j.enpol.2017.04.047
Taliotis, C., Taibi, E., Howells, M., Rogner, H., Bazilian, M., and Welsch, M. (2017c). Renewable energy technology integration for the island of Cyprus: a cost-optimization approach. Energy 137, 31–41. doi: 10.1016/j.energy.2017.07.015
Republic of Cyprus (2019). Cyprus Government Initiative for Coordinating Climate Change Actions in the Eastern Mediterranean & Middle East: Work Programme. Available online at: https://www.cyi.ac.cy/images/international_collaborations/cy_climate_change_init/Work_Programme_200724.pdf (accessed August 16, 2020).
TSO Cyprus (2019a). RES Penetration [WWW Document]. Available online at: https://tsoc.org.cy/energy-generation-records/res-penetration/ (accessed January 29, 2019).
Tso Cyprus (2019b). Yearly Record of Total Generation [WWW Document]. Available online at: https://tsoc.org.cy/energy-generation-records/yearly/ (accessed May 20, 2019).
UNFCCC (2015). Historic Paris Agreement on Climate Change - 195 Nations Set Path to Keep Temperature Rise Well Below 2 Degrees Celsius. Rio de Janeiro: UNFCCC.
Wang, D., Gao, J., Li, P., Wang, B., Zhang, C., and Saxena, S. (2017). Modeling of plug-in electric vehicle travel patterns and charging load based on trip chain generation. J. Power Sources 359, 468–479. doi: 10.1016/j.jpowsour.2017.05.036
Welsch, M., Deane, P., Howells, M. Ó, Gallachóir, B., Rogan, F., Bazilian, M., et al. (2014). Incorporating flexibility requirements into long-term energy system models – A case study on high levels of renewable electricity penetration in Ireland. Appl. Energy 135, 600–615. doi: 10.1016/j.apenergy.2014.08.072
Xydas, E., Marmaras, C., Cipcigan, L. M., Jenkins, N., Carroll, S., and Barker, M. (2016). A data-driven approach for characterising the charging demand of electric vehicles: a UK case study. Appl. Energy 162, 763–771. doi: 10.1016/j.apenergy.2015.10.151
Appendix
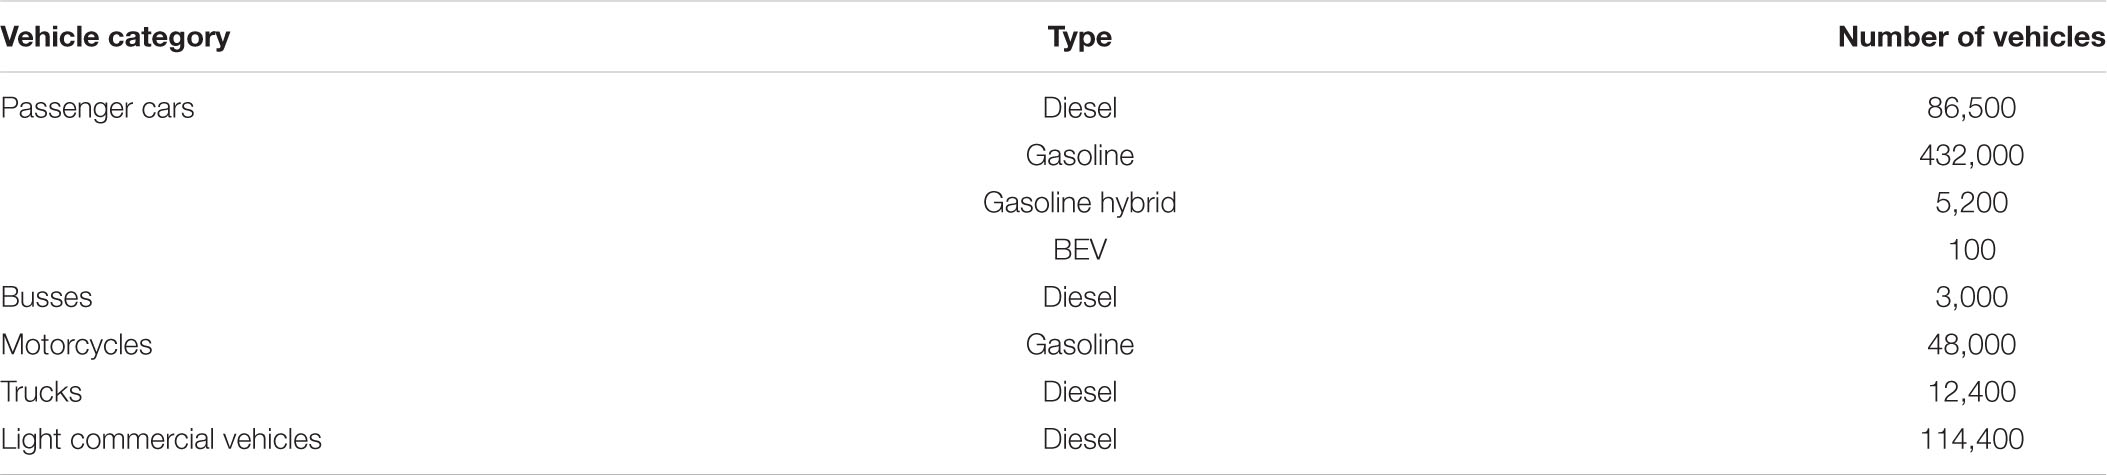
Table A1. Existing vehicle fleet in 2017.
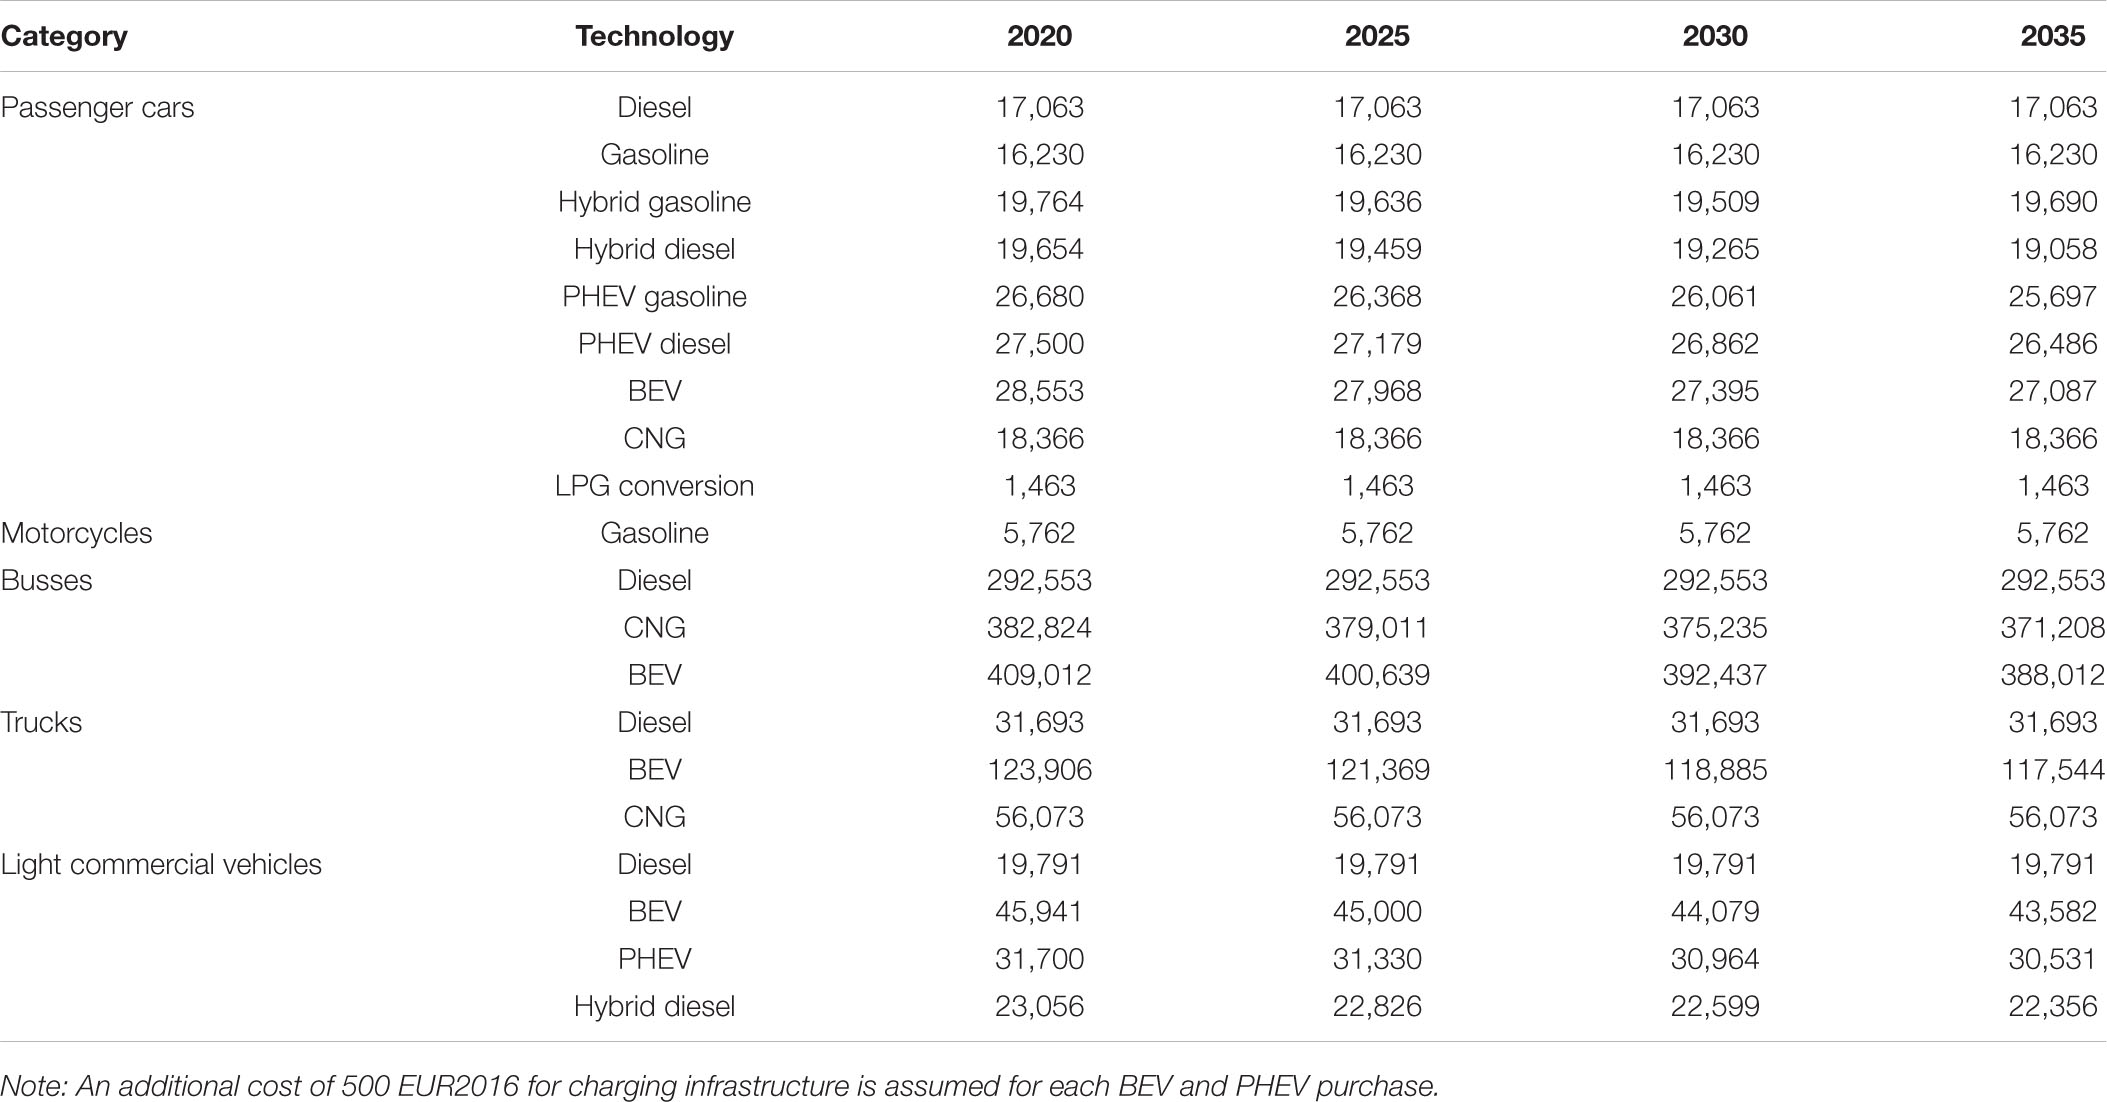
Table A2. Vehicle purchase cost (EUR2016/unit).
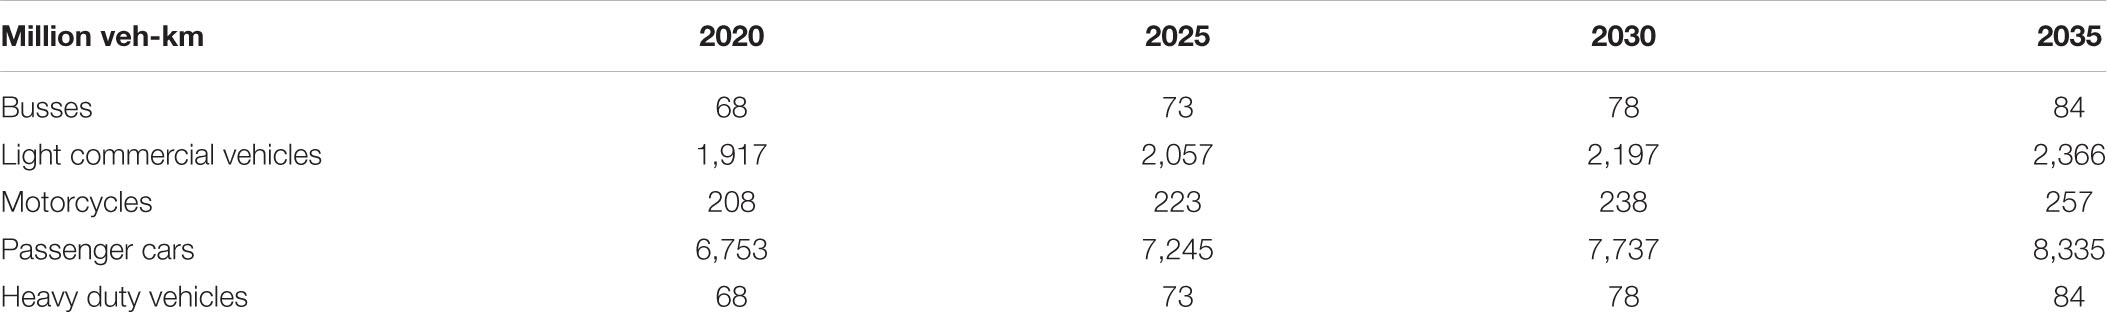
Table A3. Total mileage projection for each mode of transport.
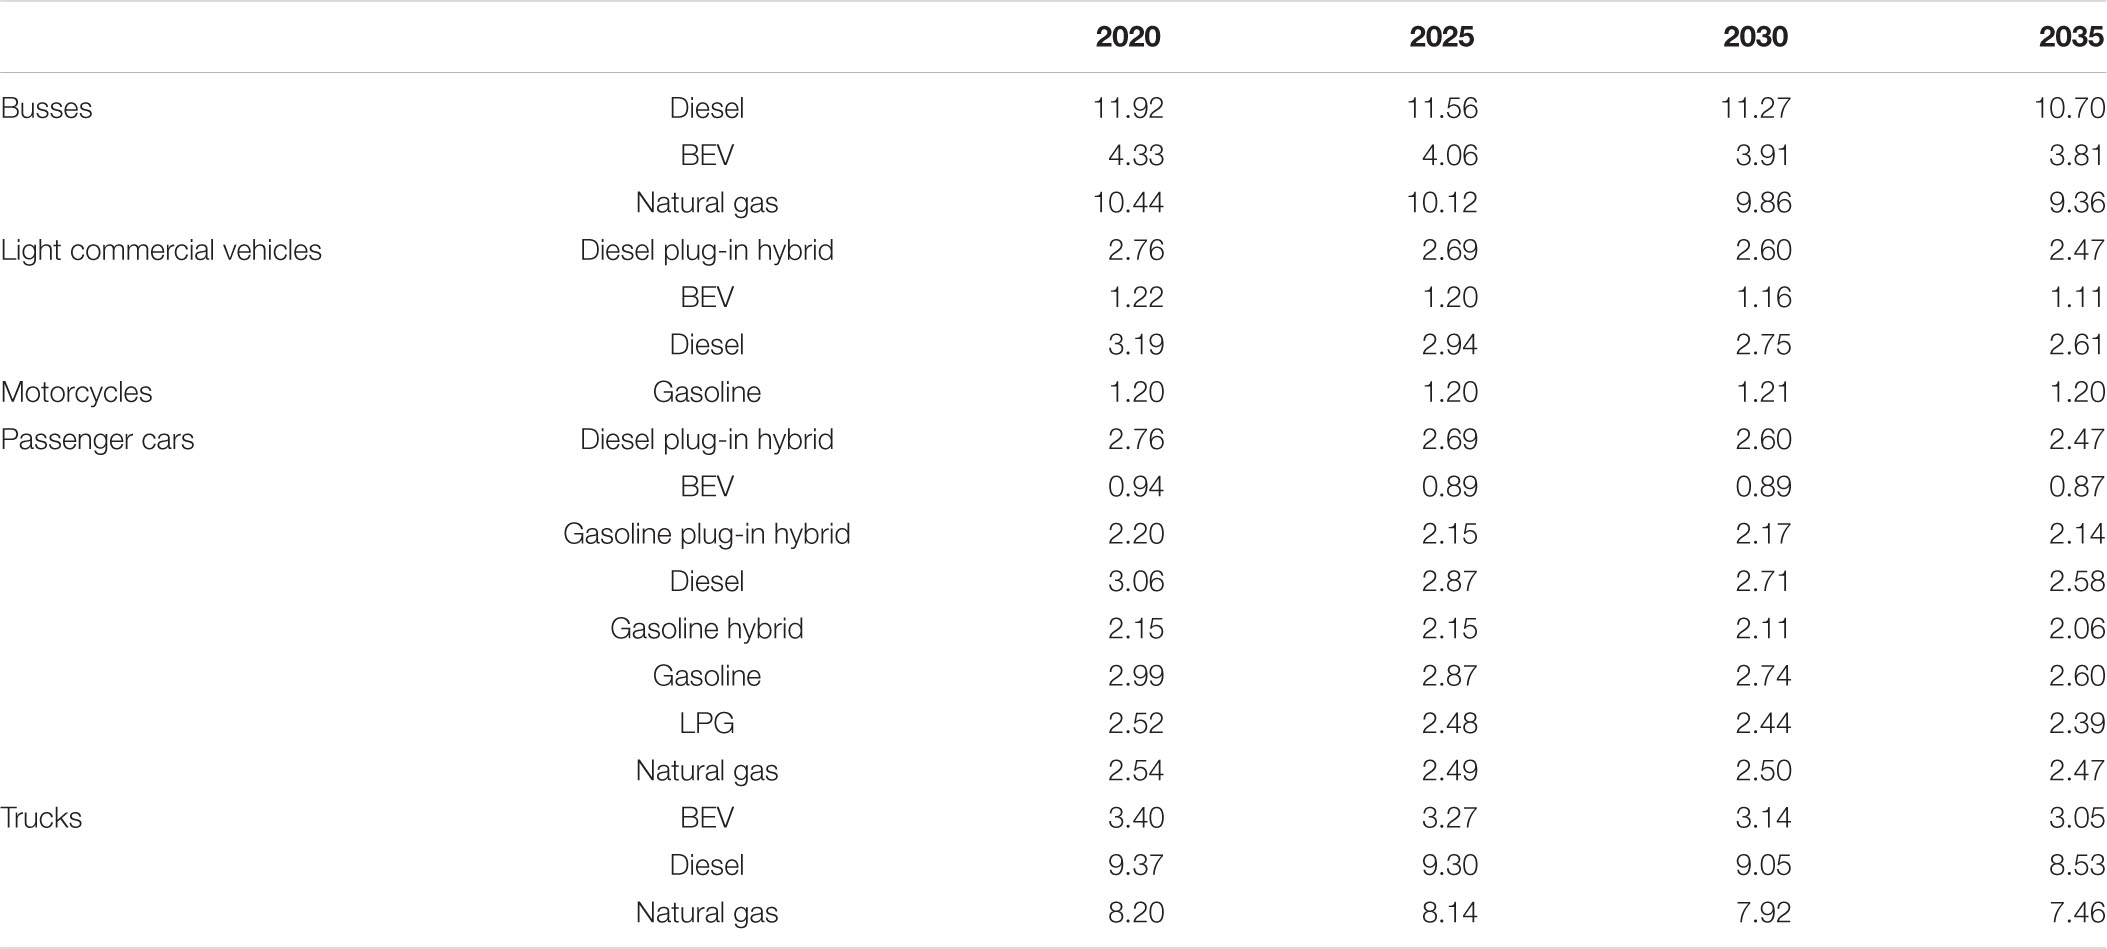
Table A4. Fuel efficiency projections (MJ/km).
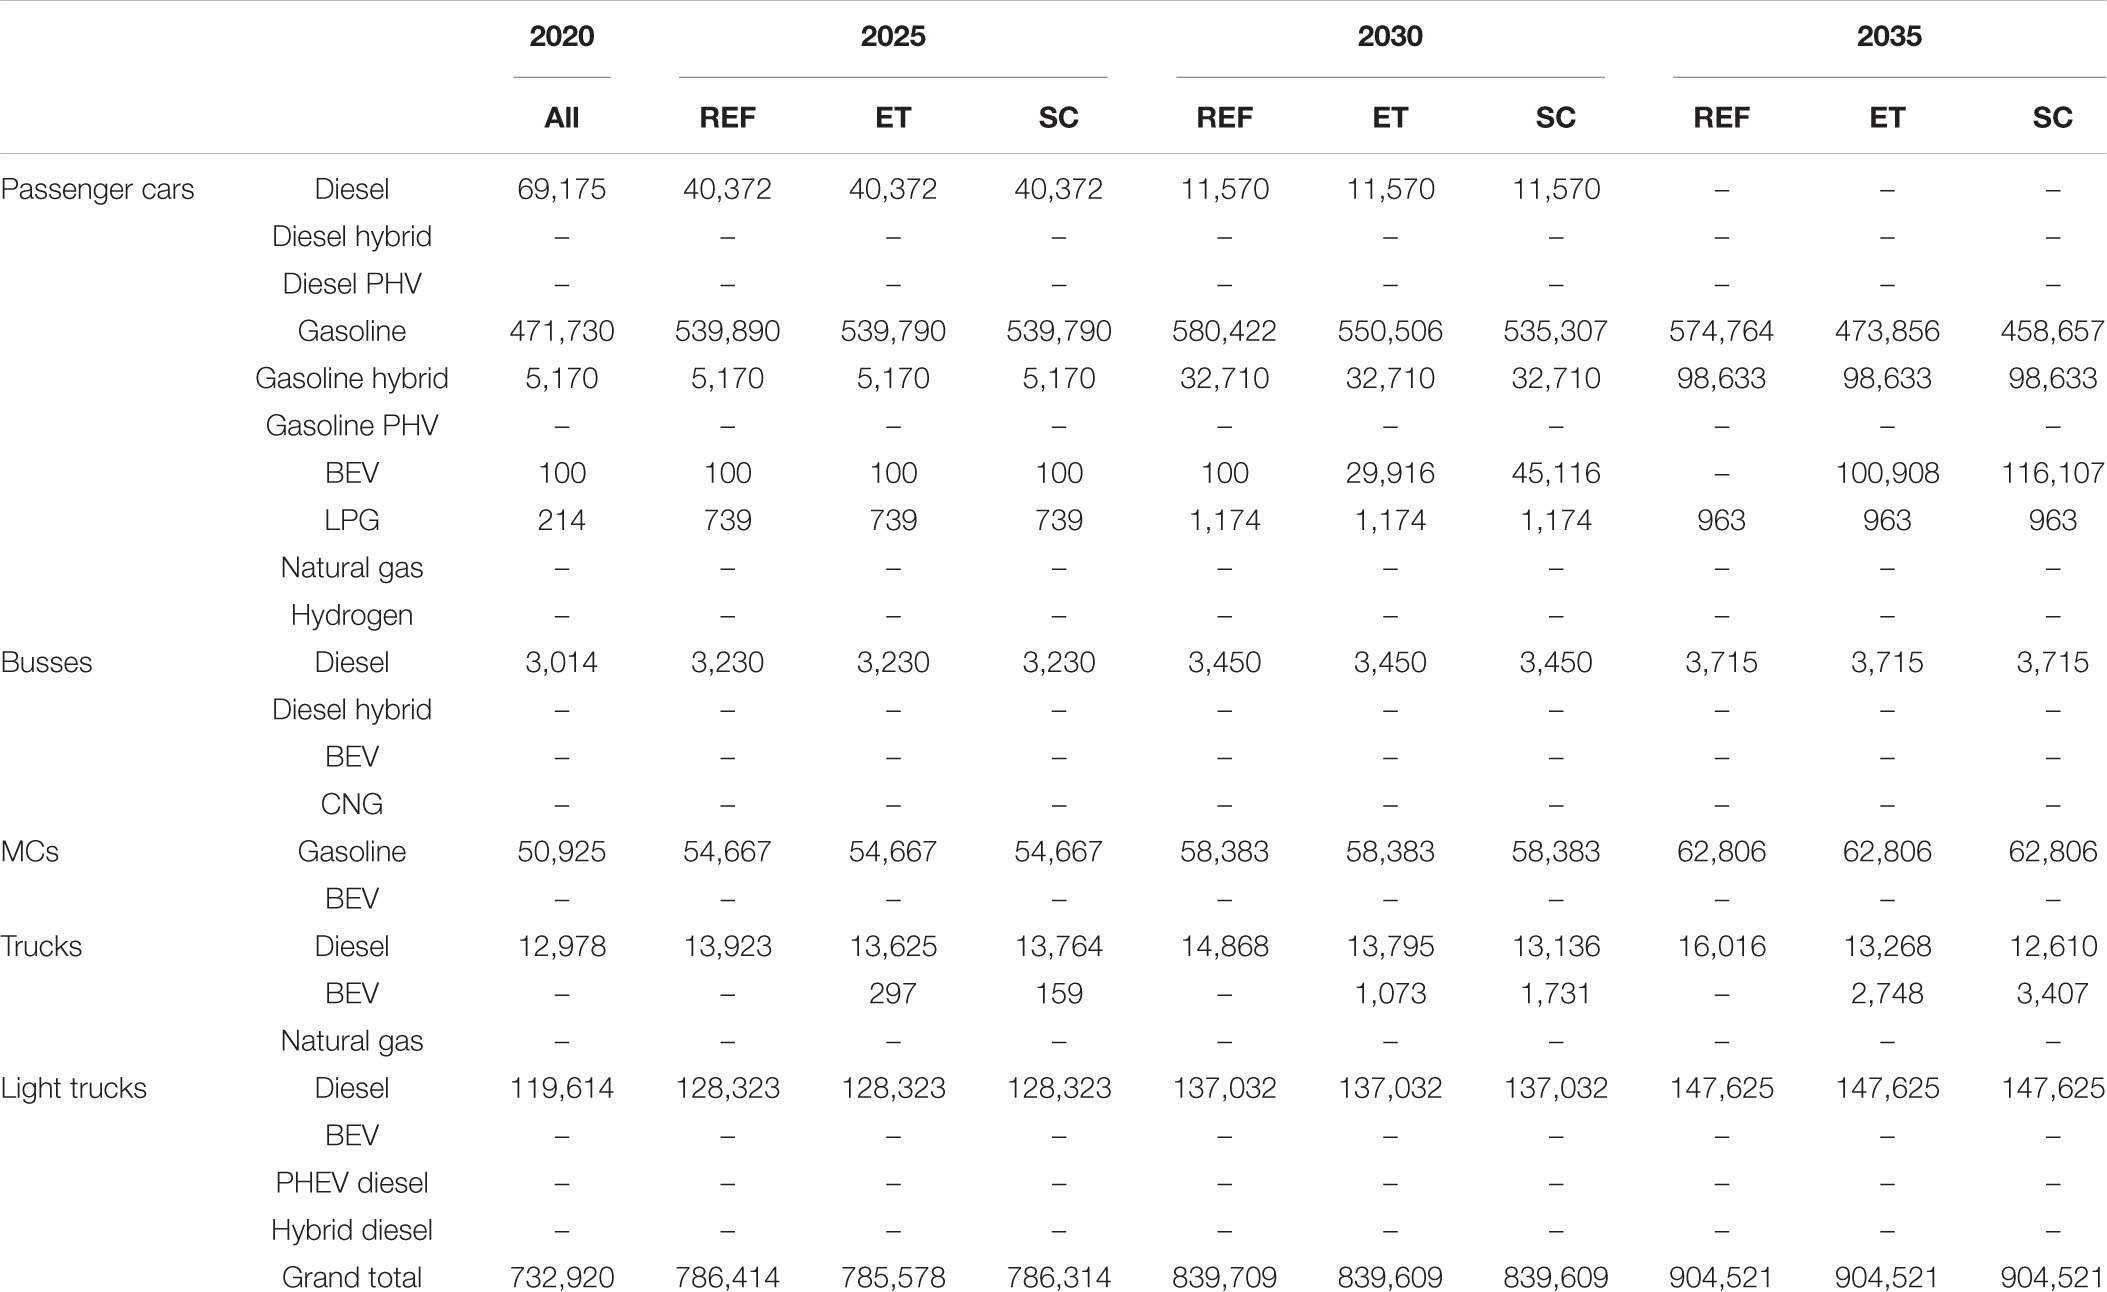
Table A5. Scenario results on vehicle fleet projections in each scenario.
Keywords: energy transition, electric vehicles, OSeMOSYS, renewable energy, national energy and climate plans
Citation: Taliotis C, Fylaktos N, Partasides G, Gardumi F, Sridharan V, Karmellos M and Papanicolas CN (2020) The Effect of Electric Vehicle Deployment on Renewable Electricity Generation in an Isolated Grid System: The Case Study of Cyprus. Front. Energy Res. 8:205. doi: 10.3389/fenrg.2020.00205
Received: 10 March 2020; Accepted: 31 July 2020;
Published: 27 August 2020.
Edited by:
Benedetto Nastasi, Delft University of Technology, NetherlandsReviewed by:
Jay Zarnikau, The University of Texas at Austin, United StatesShree Raj Shakya, Tribhuvan University, Nepal
Copyright © 2020 Taliotis, Fylaktos, Partasides, Gardumi, Sridharan, Karmellos and Papanicolas. This is an open-access article distributed under the terms of the Creative Commons Attribution License (CC BY). The use, distribution or reproduction in other forums is permitted, provided the original author(s) and the copyright owner(s) are credited and that the original publication in this journal is cited, in accordance with accepted academic practice. No use, distribution or reproduction is permitted which does not comply with these terms.
*Correspondence: Constantinos Taliotis, c.taliotis@cyi.ac.cy