
Abstract
In this paper, a new reversible data hiding scheme in encrypted binary image is proposed by shared pixel prediction and halving compression. We first divide binary image into non-overlapping pure color blocks and non-pure color blocks, and then partition each non-pure color block as shared pixels and embeddable pixels by a cross-segmentation mechanism. Then, a location sequence which marked all blocks is further compressed by halving compression and is considered as auxiliary data. Subsequently, after performing image encryption, data hider embeds additional data into the pixels of pure color blocks and embeddable pixels of non-pure color blocks. Finally, separable operations of data extraction, direct image decryption, and image recovery are conducted by the receiver. With shared pixel prediction mechanism, perfect image recovery can be achieved. Extensive experiments demonstrate that compared with existing methods, our scheme can obtain a higher visual quality of decrypted images, while maintaining a larger embedding capacity.
1 Introduction
Reversible data hiding (RDH) tackles the following applying scenario: data owner firstly embeds secret messages into digital media, such as digital images, video, or audio files, and then delivers these files to the receiver. The receiver can extract the secret messages correctly, while achieving perfect recovery for original digital media. Regarding this applying scenario, a number of researchers have reported multiple important works, e.g., difference expansion-based schemes [1, 2], lossless compression-based schemes [3, 4], and histogram shifting-based schemes [5–8]. Furthermore, when the image owners do not want others to access the content of image, they may choose to encrypt these images before delivering them. This problem is termed as RDH in encrypted domain (RDH-ED for short). Several studies have documented two categories: vacating room after encryption (VRAE) [9–13] and reserving room before encryption (RRBE) [14–18]. The former means that embedding rooms can be vacated by special preprocessing in the encrypted image, and the secret data can be subsequently embedded into the vacated room, while the latter implies that content owner needs to preprocess the plaintext image before encryption processing to reserve embedding rooms. Nevertheless, traditional RDH-ED schemes mainly focus on gray or color JPEG images [19]. In some special scenarios, e.g., patent certificate, scanned check, handwritings, and CAD graphs, binary image becomes mainstream formats. Compared with 8 bits per gray pixel or 24 bits per color pixel, binary images always require only 1 bit per pixel (either 0 or 1) so that the embedding process in binary images may lead to more significant distortion on both statistics and vision. Therefore, the RDH issue aiming at encrypted binary images has received considerable critical attention. We term this problem as RDH in encrypted binary domain (RDH-EBD for short).
Although a considerable amount of RDH literature has been published on binary images, such as [20–23]. However, in these literatures, the developments mainly focus on plaintext binary images, while for encrypted binary images, too little RDH work has been devoted [24]. Considering the reversible data hiding requirement on encrypted binary images, one natural question arises: could we directly adopt existing RDH-ED solutions for gray or color images on binary images? Unfortunately, the answer is negative due to the following pitfalls. First, traditional RDH-ED schemes mainly focus on gray or color images, which contain multiple gray levels for each pixel. The embedding rooms are generated more easily by compressing processing due to high pixel correlation. But, binary images (including plaintext binary images and encrypted binary images) only use one bit to represent each pixel. This simple data storage structure has little or no data redundancy, leading to the existing RDH-ED algorithm for gray or color images completely unsuitable. Second, the case is that only two colors of black and white in binary image make that only two possibilities of pixel modification are performed when data is embedded, that is, 1 to 0 or 0 to 1. Since the binary pixel directly corresponds to human sensory experience, the modification of any pixel may cause obvious damage to the visual quality. This makes data embedding more difficult.
Facing the aforementioned problem, this paper is motivated to tackle the reversible data hiding challenge in the context of encrypted binary images. We follow the same view as [24] but present a new solution by using (a) new prediction method with multiple shared pixels and (b) halving compression mechanism. The main novel contributions made are as follows:
-
We propose a new reversible data hiding solution for encrypted binary images, which can implement data embedding and data extraction with high embedding capacity. We claim that our proposed method can work over natural binary images and can achieve separable operations of data extraction, direct image decryption, and image recovery according to the availability of encryption key and data hiding key.
-
We divide binary image into pure color blocks and non-pure color blocks, which are marked by a binary location sequence. A new halving compression mechanism is introduced to further compress the location sequence. This significantly reduces the length of auxiliary data. Accordingly, the embedding capacity of additional data is further improved.
-
We design a cross-segmentation mechanism that is used to divide the non-pure color block into two pixel sets: embeddable pixels and prediction pixels. The former is used to embed additional data, while the latter is used to predict and recover the embeddable pixels that have changed during the embedding operation. Since a prediction pixel can be shared with multiple embeddable pixels’ recovery, it naturally improves the embedding capacity, while ensuring the correct recovery of embeddable pixels.
-
We perform comprehensive experiments with different binary image sources. The experimental results demonstrate that our solution significantly outperforms existing reversible data hiding methods in terms of embedding capacity, visual quality, and security.
The rest of this paper is organized as follows. Section 2 reviews existing state-of-the-art RDH works for binary images. In Section 3, we provide the details of the proposed scheme. Subsequently, comprehensive experiments are performed to evaluate the performance of the proposed scheme. The experimental results and corresponding discussions are presented in Section 4. Finally, Section 5 concludes the paper.
2 Related work
Existing binary image-based RDH solutions are mainly divided into two categories: plaintext binary image-based RDH schemes and encrypted binary image-based RDH schemes. We briefly introduce existing works according to two criteria.
Firstly, regarding plaintext binary image-based RDH schemes, Wang et al. [23] proposed a large volume data hiding scheme of binary image based on block pattern. In this scheme, Wang et al. divide cover binary image into non-symmetrical block and dual-pair block, and then design two matching pairs (MP), internal and external, to reduce embedded changes. Finally, the internal adjustment matching pair (MPIA) method is performed sequentially on the embeddable blocks, which are selected by a randomly generated seed and output a marked image. Although the embedding capacity is limited, Wang’s scheme can still achieve better performance with the same embedding distortion. Furthermore, Nguyen et al. [22] proposed a high embedding capacity data hiding scheme in binary image based on block classification. With a block classification process, this scheme identifies the complex image blocks, in which only a small number of pixels are embedded secret bits to minimize embedding distortion. Comparing with previous schemes for binary images, Wang’s scheme can further improve the embedding capacity under the same embedding distortion. Yin et al. [21] employed symmetrical flipping degree histogram modification to design a reversible data hiding scheme in binary image. In this scheme, the symmetrical flipping degree (SFD) is first calculated to decide whether the secret data can be embedded, and then, the SFD histogram is used to find the embeddable blocks in the original image. With the same embedding capacity, Yin’s scheme can significantly improve visual quality. In [20], a reversible data hiding method based on image magnification was proposed. First, the original image is divided into multiple 3 ×3 blocks. For each 3 ×3 blocks, the cross model is analyzed to find the reference block suitable for magnification, in which the center pixel is magnified into 4 pixels. The pixel’s connectivity and reversibility can be guaranteed by keeping one or two pixels unchanged in the center block. Finally, the secret bits are embedded into each block by the inner-block flippable pixel selection strategy. Zhang’s method has better visual quality comparing with the previous method and does not require auxiliary data to ensure reversibility. Also, due to full use of redundancy, this scheme has considerable performance in terms of computational complexity and cost, although its maximum embedding capacity is usually less than 4000 bits for binary image with size 256×256.
Secondly, regarding encrypted binary image-based RDH schemes, in [24], Ren et al. proposed a new reversible data hiding method in encrypted binary images by pixel prediction. The original binary image is divided into non-overlapping uniform blocks and non-uniform blocks, which are effectively marked by an auxiliary type image including 0 and 1. The type image is embedded by content owner, and secret data is embedded in these blocks by data hider. For the receiver, after extracting the secret data by data embedding key, the original image can be recovered by a “T” pattern and the type image. Ren’s method works well, but the visual quality and embedding rate can be further improved. This is mainly because the “T” pattern involves more different neighbor pixels to predict one embeddable pixel, resulting in an obvious waste of embedding space. In addition, since the auxiliary information is directly embedded into image without any compression, the embedding capacity is further reduced.
Accordingly, a series of works have been developed to address the problem of applying reversible data hiding in binary images. Nevertheless, many existing methods, e.g., Ren’s scheme, borrow the idea from plaintext binary image-based RDH schemes. Since these schemes do not make full use of the prediction performance of neighboring pixels, and also do not consider to optimize the compression space of auxiliary data, they thus have a weak visual quality and lower embedding capacity. This paper tries to further fill this gap.
3 Proposed method
3.1 The framework of proposed method
The proposed RDH-EB framework is mainly comprised of three parts. In the first part, we first divide binary image into pure color blocks and non-pure color blocks, which are rearranged by placing pure color blocks in the back and non-pure color blocks in the front. A binary location sequence which marked these image blocks is further lossless compressed as auxiliary data by introducing a new halving compression mechanism. In addition, each non-pure color block is divided into two pixel sets, embeddable pixels and prediction pixels, by a cross-segmentation mechanism. The former is used to embed additional data, while the latter is used to predict and recover the embeddable pixels that have changed during embedding operation. Finally, the rearranged binary image is encrypted and then is delivered to the data hider. In the second part, additional data are embedded into the encrypted binary image, which is transmitted to the receiver over network. In the third part, according to the availability of encryption key and data hiding key, the receiver can achieve separable operations of data extraction, direct image decryption, and image recovery. The framework is shown in Fig. 1.

The framework of the proposed scheme
3.2 Image preprocessing
Given an original binary image with size M×M, we firstly divide this image into multiple non-overlapping blocks with size N×N, N<M. Since the pixels of binary image are either black or white, we denote the N×N blocks composed of all black or all white pixels as pure color blocks (PB for short). Similarly, we denote other N×N blocks as non-pure blocks (NPB for short). Obviously, if any one pixel in PB block is confirmed, we can fastly determine the color information of all other pixels in this block. It implies that we can use only one pixel to record the color information of PB, while the remaining pixels can be considered as embedding room. Subsequently, we introduce a cross-segmentation mechanism to preprocess NPB blocks. For each NPB, all pixels are divided across into two sets: embeddable pixels and shared prediction pixels. The former is used to embed secret data, while the latter is used to predict the original embeddable pixels if they are modified due to data hiding. In our scheme, since the shared prediction pixels are distributed across in each NPB, one shared prediction pixel can be used to predict multiple embeddable pixels, thereby reserving more embeddable pixels to carry secret data. Figure 2 presents the embeddable pixels and the shared prediction pixels, which are represented by plus symbol and dot symbol, respectively.

Dot set and plus set in a non-pure block. The plus set stands for embeddable pixels, while dot set represents the shared prediction pixels
Subsequently, we denote PB block as 1 and NPB block as 0 and then scan the original image from left to right, top to bottom to generate a series of binary bits, which is denoted as location sequence. Clearly, the location sequence has a fixed length \(\frac {M^{2}}{N^{2}}\) according to the size of original image. For easy understanding, an example is shown in Fig. 3.

Binary location sequence generation. With this location sequence, the position of each block can be located easily in the original image
3.3 Auxiliary data compression
The generated binary location sequence in Section 3.2 indicates the position of each block in original image; we denote it as auxiliary data and deliver it to the receiver to achieve the original image recovery. Apparently, if the binary location sequence is too long, it inevitably occupies the embedding capacity of additional data. In order to avoid this problem, we design a lossless compression method, named as halving compression, to further reduce the length of binary location sequence.
First, we set two thresholds T∈{T0,T1} to perform the compression of consecutive 0 and 1, respectively. A quotient list and a remainder list are used to save the compressed data. Denote the number of consecutive 1 (or 0) in original location sequence as Lt, the compression procedure can be shown as follows in Eq. (1):
In this equation, when T is set to T1, Lt indicates the number of consecutive 1 in the original location sequence and Qt stands for the number of compressed 1, which is added directly to the quotient list. Similarly, when T is set to T0, Lt and Qt correspond to the case of consecutive 0. In addition, if Lt≥T, we calculate Rt as Eq. (2) to represent the remainder of 1 or 0 and add it to the remainder list. Finally, the compressed location sequence can be directly obtained by splicing remainder list and quotient list. The process can be divided into five steps:
-
Step 1: The same continuous bits “xxxxx” are scanned.
-
Step 2: Use Eq. (1) to calculate the quotient and then add it to the quotient list.
-
Step 3: Use Eq. (2) to calculate remainder and then add it to the remainder list.
-
Step 4: Repeat steps 1–3 until all bits are processed.
-
Step 5: Finally, the remainder list is spliced after the quotient list to form a compressed bit stream.
In order to make it easier to understand, an actual example is shown in Fig. 4. As shown in Fig. 4, the original bitstream is “110100000111”, T1 = 2, T0 = 2. And the specific operation of this example is as follows:
-
Step 1: The same continuous bits “11” are scanned.
Fig. 4 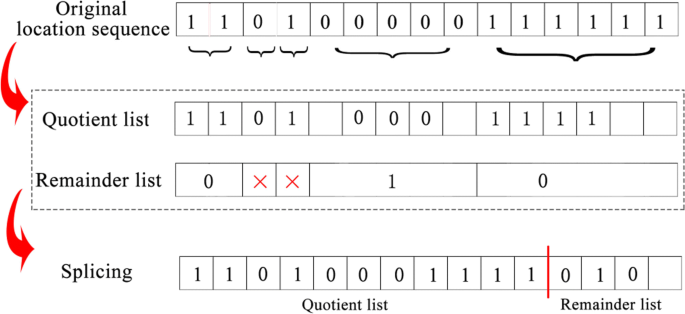
An example for proposed halving compression algorithm with T1 = 2, T0 = 2. The original location sequence 110100000111111, quotient list 11010001111, and remainder list 010. The compressed location sequence 11010001111010 can be directly obtained by combining remainder list and quotient list
-
Step 2: Use Eq. (1) to calculate quotient as 2. Then, add 2 bits “1” to the quotient list.
-
Step 3: Use Eq. (2) to calculate remainder as 0. Then, add the result to the remainder list.
-
Step 4: Repeat steps 1–3 until all bits are processed. At this step, the quotient list is 11010001111, and the remainder list is 010.
-
Step 5: Finally, the remainder list is spliced after the quotient list to form a compressed bit stream.

The decompression procedure can be shown as the following four steps.
-
Step 1: The continuous compressed bit sequence “xxxxx” is scanned from quotient list.
-
Step 2: Based on the above compressed bit sequence, use Eqs. (3) and (4) to calculate the corresponding results as a part of original location sequence Lt.
-
Step 3: Repeat steps 1 and 2 until all bits in the quotient list are processed completely.
-
Step 4: Finally, sequential merging results of steps 1–3 to form the original location sequence.
3.4 Image encryption
Before performing image encryption, we sequentially implement three measures to further improve security performance. First, we rearrange these blocks by placing the NPBs in the front and the PBs in the back. Second, the compressed location sequence is embedded sequentially from the first PB block. Third, we record a fixed pixel in each PB block (e.g., the pixel in bottom right corner) as the recovering pixel and keep it unchanged. Then, the remaining pixels in each PB block, together with the pixels of plus set in NPBs, are filled by random bits. This operation can efficiently resist known plaintext attacks. Finally, we denote the processed image as a rearranged image.
Subsequently, we use stream cipher to encrypt the rearranged image. Denote x = {x1x2⋯xk⋯xM×M} as a vector that represents all pixel values of rearranged image, 1≤k≤M×M. Generating a binary bit sequence r = {r1r2⋯rk⋯rM×M} with the encryption key Ke, the pixel is then encrypted as \(\hat x_{k}\).
Since the stream cipher only performs XOR processing, the position of each pixel in the image is not changed after encryption.
3.5 Data embedding
In this section, we describe the procedure of data embedding. When data hider receives the encrypted image, he can use the data hiding key Kh to randomly select some of the following two types of pixels to embed additional dataFootnote 1.
-
For PB blocks, apart from the recovering pixels (e.g., the pixel marked by the symbol △ in Fig. 5a) and the pixels carrying the auxiliary data, other pixels can be directly replaced by additional data.
Fig. 5 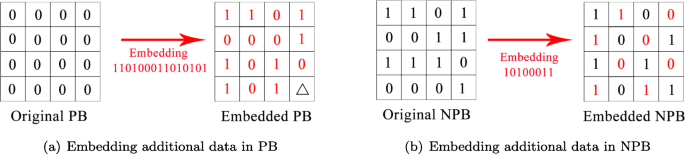
Embedding additional data in 4×4 PB block and NPB block. The symbol △ indicates the recovery pixel, which is not used to embed data
-
For NPB blocks, the embeddable pixels (which correspond to the plus set in Fig. 2) can be directly replaced by additional data, while the shared prediction pixels remain unchanged. The embedding positions can refer to Fig. 5b.

Notably, according to the embedding algorithm, the maximum embedding capacity of PB blocks, denoted by Mp, can be calculated as follows:
where N is the size of block, Np represents the number of PB blocks, and Lc stands for the length of compressed location sequence.
Regarding NPB blocks, since only half of the pixels in each block are used to embed data, its maximum embedding capacity Mn can be also calculated easily:
where Nn represents the number of NPB blocks.
Finally, the total maximum embedding capacity (MEC for short) can be calculated by combining Eqs. (6) and (7). Accordingly, the maximum embedding rate (MER for short) can be expressed as follows:
Obviously, the block size N and compression thresholds T1 and T0 in the above description have a significant influence on embedding capacity. They will be discussed in the experimental section.
3.6 Data extraction and image recovery
In this section, we discuss the data extraction and image recovery procedure. When the encrypted image containing the secret messages is received by the recipient, he can separably achieve three operations, data extraction, direct image decryption, and image recovery, according to the cases of obtaining the keyFootnote 2.
3.6.1 Case 1: Only obtaining the data hiding key
If the recipient only obtained the data hiding key, according to the algorithm, the additional data can be directly extracted, even if the image has not been decrypted.
3.6.2 Case 2: Only obtaining the encryption key
If the recipient only obtained the encryption key, due to the XOR process in encryption procedure, he can perform decryption procedure directly by the encryption key and extract the compressed location sequence from the decrypted image. Accordingly, the original image can be also recovered by the following steps:
-
Step 1: Decrypt the received image and then decompress the extracted location sequence. With the location sequence, the positions of each block can be arranged correctly.
-
Step 2: For each PB block, it can be directly recovered based on the fixed recovery pixel (which correspond to the pixel marked by the symbol △ in Fig. 5a). For each NPB block, since the shared prediction pixels have no changes during data embedding, the embeddable pixel P(i,j) can be calculated by its three adjacent shared prediction pixels D(i,j−1), D(i,j+1), and D(i+,j).
$$\begin{array}{@{}rcl@{}} \begin{aligned} P_{(i,j)} = \left\{\begin{array}{l} 0, \quad {\text{if}} \hspace{0.2cm} \frac{D_{(i,j-1)}+D_{(i,j+1)}+D_{(i+1,j)}}{3} < 0.5 \\ 1, \qquad {\text{otherwise}} \end{array}\right. \end{aligned} \end{array} $$(10) -
Step 3: Repeat step 2 until all image blocks are recovered. The recipient can finally obtain the original binary image.
4 Results and discussions
In this section, we carry out a series of experiments on classical binary image sources, which are formed by three parts: (1) One part is from the classical binary images, such as (8) Cartoon, CAD, and Texture. (2) The second part includes the binary images converted by some classical grayscale images, i.e., Lena, Baboon, and Pepper. (3) Another part is from a large-scale gray image database, BOSSBase v1.01Footnote 3, which contains 10,000 gray images. These images are sequentially converted to binary images. All experimental images are resized to 256×256. Figure 6 shows the experimental images from different sources.

The experimental binary images from different image sources. The first row contains some classical binary images, the second row presents the binary images converted by some classical grayscale image, and the third row shows the binary images converted by a large-scale classical gray image database, BOSSBase v1.01
We test the performance of the proposed scheme in terms of three aspects: embedding capacity, visual quality, and security. The peak signal to noise ratio (PSNR) and structural similarity (SSIM) are used to measure the visual quality. In specific, denote the original image as X and the decrypted image as I:
where MSE is the mean square error between X and I. MAXI=2 represents the maximum value of color due to 2-bit representation in binary image. In general, the larger the PSNR value, the less the distortion and the higher the visual quality. In addition, the structural similarity is also considered as another standard measurement, which can be calculated as follows:
where μX and μI are the average values of original image and the decrypted image, σX and σI are the standard deviation values of two images, and σXI represents the covariance of the two images. c1 and c2 are the constants for stable division.
In general, SSIM value is between 0 and 1. If SSIM value is close to 1, the decrypted image is like the original image with high quality. Moreover, we define embedding rate (ER) as bpp (bits per pixel), that is, each pixel can carry the average number of bits.
4.1 Test for visual quality
In this section, we test the visual quality performance of the proposed scheme. For easy illustration, we first select Cartoon and Lena to validate the effectiveness of proposed method, where Cartoon is from classical binary image set, while Lena is the binary version converted by its classical gray image. The experimental results are shown in Fig. 7. As can be seen from this figure, the proposed method can extract the secret data correctly and obtain the recovery image that is very similar to the original image. This demonstrates that our method can effectively achieve the reversibility, that is, extract secret data correctly while ensuring that the original image is perfectly recovered.

Testing the effectiveness of proposed method with Cartoon and Lena. The first column is the original image (a, e), the second column is their encrypted version (b, f), the third column is the encrypted image containing additional data (c, g), and the forth column is the recovered image (d, h)
In order to further show the advantages of the proposed scheme, we compare our scheme with Ren’s scheme [24]. For this purpose, we implement four different embedding rates, 0.64 bpp, 0.66 bpp, 0.68 bpp, and 0.70 bpp, over the binarized Lena image, and then calculate the PSNR values of its recovery image corresponding to each embedding rate. The experimental results are shown in Fig. 8. It is easy to observe that the PSNR values of the proposed scheme and Ren’s scheme are approximate ∞, even if the embedding rate has reached 0.64 bpp. Moreover, with the same embedding rate, the PSNR values of our proposed scheme are higher than those of Ren’s scheme with an average gain of more than 1.2 dB. This demonstrates that the proposed scheme can obtain a superior performance on visual quality under the same embedding rate, because our scheme significantly reduces the length of auxiliary data by halving compression mechanism. This produces fewer pixel modifications in NPB blocks during the embedding process, leading to a higher visual quality.

Visual quality comparison for the proposed scheme and Ren’s scheme [24] with different embedding rates, 0.64, 0.66, 0.68, and 0.70 (bpp). In this experiment, we use the recovery version of Lena image to calculate PSNR values, where e–h are the experimental results using Ren’s scheme and correspond to four embedding rates, respectively, while a–d are the experimental figures using the proposed scheme and also correspond to four embedding rates, respectively
4.2 Test for embedding rate
According to Eq. (9), several important parameters, compression thresholds T0 and T1 and block size N, have a significant influence on embedding rate. In this section, we implement a series of experiments to discuss these parameters and show the advantage of the proposed scheme on embedding rate.
In order to obtain suitable compression thresholds T0 and T1, we carry out a series of experiments by setting different block sizes N=2,4,8,12. Six classical binary images, (8) Cartoon, CAD, Texture, Mask, Handwriting, and Document, are used to test the experimental results. We change the values of T0 and T1 to calculate the maximum embedding rate (MER for short). While the value of T0 can differ from the value of T1, we let T0=T1 to ease calculation. Eleven different values, from 2 to 12 with step 1, are tested. The experimental results are shown in Fig. 9, where the horizontal axis represents the values of T0(=T1), and the vertical axis indicates the maximum embedding rate. As can be seen that with T0(=T1) increasing, the maximum embedding rate decreases slightly, no matter what images are used. This interesting phenomenon can be explained as follows. Following the description of Eq. (1), the proposed algorithm does not perform compression procedure for the consecutive bits (0 or 1) if their length is less than the corresponding threshold (T0 or T1). This makes that fewer consecutive bits in the original location sequence can be compressed. Accordingly, the length of compressed location sequence becomes longer, resulting in only less additional data can be embedded.

Comparison of the maximum embedding rate (MER) with compression thresholds T0(=T1) changing for four different block sizes a N=2, b N=4, c N=8, and d N=12. Six classical binary images, (8) Cartoon, CAD, Texture, Mask, Handwriting, and Document, are tested in this experiment
In addition, we also test the optimal block size N by setting four fixed compression thresholds T0= T1=2, 12, 24, 32. In this experiment, eleven different block sizes, from 2 to 12 with step 1, are tested. We use the same experimental images as the above experiment and provide the corresponding results in Fig. 10. From this figure, we can observe that when N=5, the maximum embedding rate approximately reaches the highest value for each experimental image, no matter what compression thresholds are used. We can explain this phenomenon as follows. When the block size is too big, there may be more NPB blocks so that the embedding capacity naturally becomes smaller (only half of the pixels can be used to embed data in each NPB block). On the contrary, if the block size is too small, more PB blocks need to record more recovery pixels (e.g., the pixel marked by the symbol △ in Fig. 5a). In this case, the benefit of PB blocks may disappear. Similarly, in the texture image, there is generally no large area of the same white or same black pixels, so when we divide the block, we produce more NPB, but less PB. Therefore, the embedding rate of texture image is relatively low compared with other images.

Comparison of the maximum embedding rate (MER) with block size N changing for four different compression thresholds a T0=T1=2, b T0=T1=12, c T0=T1=24, and d T0=T1=32. Six classical binary images, (8) Cartoon, CAD, Texture, Mask, Handwriting, and Document, are tested in this experiment
Furthermore, we test PSNR and SSIM values of recovery image with N changing. In this test, each image is implemented data embedding with its maximum embedding rate. The testing results are shown in Fig. 11. From this figure, it is clear that the highest PSNR and SSIM can be obtained when the block size is the minimum (N=2). This is because the minimum block size may produce the most unavailable pixels that cannot be used to embed additional data (including the recovering pixels in PB blocks and the shared prediction pixels in NPB blocks), finally resulting in highest visual quality of recovery image. According to Fig. 9, the compression algorithm performs better when the compression parameters are smaller. This is because by choosing smaller compression parameters, we get more pixels that can be used for compression. According to Figs. 10 and 11, the embedding rate reaches the highest when the block size is 5, and the PSNR and SSIM reach the highest when the block size is 2. Considering the above analysis, we can adjust the compression parameters according to different data hiding requirements, e.g., when the better image quality is required, we can set the block size as 2. If the higher embedding capacity is required, the block size can be set to 5. Combining image quality and embedding quantity, the block size of 4 is selected to be more balanced. To give more insight, we set the block size N=4 and test the PSNR values and pixel error rates by comparing the proposed scheme with Ren’s scheme. For a fair comparison, we carry out the experiments with the same embedding rate, which is fixed by 90%, 95%, and 100% the maximum embedding rate of Ren’s scheme. Table 1 provides the corresponding experimental results. Our method almost has a higher PSNR value when the same embedding rate is implemented.

Comparison of the PSNR and SSIM values with block size N changing for two different image sets: a classical binary image source, b binary image source from classical gray images. The experiment uses the maximum embedding rate in each image
4.3 Security analysis
In this section, we implement a series of experiments to show the security performance of the proposed scheme. Since the encryption algorithm can effectively disrupt the correlation between pixels, an encrypted image should minimize the correlation between adjacent pixels. We denote the parameter Cr as a measure of the correlation between adjacent pixels in an image, which can be calculated as follows:
where \(E(X) = \frac {1}{N}\sum _{i=1}^{N}x_{i}\) and \(D(X) = \frac {1}{N}\sum _{i=1}^{N}(x_{i} - E(X))^{2}\). In general, the Cr that is close to 0 indicates a weaker correlation between adjacent pixels; in contrast, the Cr value close to 1 stands for a stronger correlation.
In order to give a sufficient comparison, the correlations between adjacent pixels from three directions (vertical, horizontal, and diagonal) are calculated for an encrypted binary image. We compare the proposed scheme with Ren’s scheme over six classical binary images and BOSSBase image database. The corresponding experimental results are shown in Table 2. We can observe that for each classical binary image, no matter which direction is calculated, the proposed scheme always has a lower Cr value than that of Ren’s scheme and the average reduction is more than 0.001 for vertical, 0.007 for horizontal, and 0.004 for diagonal. In addition, for the large-scale database BOSSBase, the average reduction is also more than 0.005. This implies that the proposed scheme remains a stable superior security performance in encryption processing. We can explain this phenomenon as follows. Since our method can embed more additional data, this is actually equivalent to performing “secondary encryption” on more encrypted pixels, resulting in an improvement of security performance.
To gain more insight, we further compare the security performance of two schemes with gray disorder degree (GDD for short) [24]. Since encryption procedure has a great influence on the distribution of pixel values, GDD can effectively measure the scrambling effect of encrypted images. Therefore, in this paper, we use GDD to test the scrambling effect. Denote I and I′ represent the original image and the encrypted image, respectively, and M is the image size. GDD can be calculated as follows.
where
and
GD represents the average difference between a pixel and the surrounding pixels, while \(\overline {\text {GD}}\) represents the average of GD other than the boundary pixels. When GDD >0.5, the encryption algorithm is believed to produce a good scrambling effect, otherwise, bad scrambling effect. As can be seen from Table 3, the testing GDD values of the proposed scheme are always more than 0.5. Therefore, it can be validated experimentally that the proposed scheme can provide a superior scrambling performance. In addition, we also compare the proposed scheme and Ren’s scheme over different binary images. As can be seen from the testing results, the GDD values of the proposed scheme are consistently higher than those of Ren’s scheme, although the average gain is slight. This result also suggests that the proposed scheme obtains a slight advantage in security performance. In fact, this conclusion is also validated by the above experiments about the correlation between adjacent pixels.
4.4 Comparison with the state of the arts
In this subsection, we carry out a series of experiments to compare the proposed scheme with five existing RDH schemes in binary image, Zhang’s method [20], Ren’s method [24], Nguyen’s method [22], Wang’s method [23], and Yin’s method [21]. Notably, in these RDH schemes, only Ren’s scheme is the RDH scheme in encrypted binary image, while the others are all the RDH schemes in plaintext binary image. In these experiments, we change the embedding rate (ER) of each scheme from 0 to its maximum embedding rate (MER) with a random increment. Each scheme is implemented over six classical images, Lena, Baboon, Airplane, Pepper, Boat, and Cameraman.
To give a fair comparison, we calculate PSNR values of decrypted image containing additional data as the testing results, which are shown in Fig. 12. We can easily observe that no matter what embedding rate is performed, the recovery image of our proposed scheme has a higher PSNR value than that of Ren’s scheme, even if the embedding rate is more than 0.50 bpp. The average PSNR gain is more than 1.7 dB. This implies that the proposed scheme has less error pixels. Actually, this interesting phenomenon can be explained easily. Since the location sequence needs to consume the embedding rooms in PB blocks, our scheme designs a halving compression mechanism to further reduce the length of location sequence so that the embedding rooms in PB blocks significantly increase. Accordingly, the probability of additional data embedded into NPB blocks is reduced. Less embeddable pixels in NPB blocks are used to carry additional data, leading to less error pixels in decrypted image. In addition, it can be also seen that no matter which experimental image is used, our proposed scheme always has a superior overall performance than other schemes, that is, a higher PSNR value under the same embedding rate. Also, our scheme can still achieve separably data extraction, direct image decryption, and image recovery. Comparing with the RDH schemes in plaintext binary image, extra encryption process can further guarantee that the content of binary image is not accessible by others, resulting in a higher security performance.

Overall performance comparison between PSNR and embedding rate for six different RDH schemes in binary image
To further compare the performance between our method and other schemes, we use the large-scale database, BOSSBase including 10,000 images, to test the average maximum embedding rate of six schemes. Table 4 shows the actual experimental results. We can observe that the average maximum embedding rate of the proposed scheme is significantly higher than that of other several schemes. Two reasons can explain this phenomenon. (1) The shared prediction mechanism can reduce the number of prediction pixels so that the embedding rooms increase significantly. This conclusion has been verified in Section 4.2. (2) We implement the lossless halving compression to further compress the length of location sequence. The consumption of embedding room is further reduced, resulting in a higher embedding capacity for additional data.
5 Conclusions and future works
In this paper, we addressed the reversible data hiding problem in encrypted binary image and proposed a new scheme with shared pixel prediction method and halving compression mechanism, which has a significant superior performance than Ren’s scheme [24]. We firstly designed a shared pixel prediction method by introducing a cross-segmentation mechanism on non-pure color blocks. Since a shared pixel can be used to recover multiple embeddable pixels, the embedding capacity is naturally improved comparing with Ren’s scheme. Furthermore, a lossless halving compression mechanism is introduced to compress the location sequence, which is used to mark the position of image block and helps to further increase the embedding capacity. Experimental results show that both the shared pixel prediction method and halving compression mechanism contribute to the improvement of embedding capacity. Compared to the existing RDH solutions in binary images, our method has superior performance when the embedding capacity is large.
While our proposed method has shown good performance in diverse binary image sets, we should note that it may still have a slight prediction error in the recovery image when the embedding rate is high, although the error of our proposed scheme has been validated to be lower than that of other methods. In the case of prediction error, we have two solutions for lossless recovery. First, we do not use NPB to embed additional data. It can be seen from our method that the prediction error generally appears in the recovery process of NPB. Therefore, although not using NPB will lose part of the embedding rate, the bigger advantage is that its prediction error will be greatly reduced. Second, before the embedding process, we calculate whether the prediction results will produce errors. These NPBs which will not cause errors will be used to embed additional data, and the positions of these blocks will be embedded in the image as auxiliary information.
In the future, we plan to carry our work forward in two directions. First, compared to the same block size in the proposed scheme, we try to design an adaptive segmentation mechanism for the pure color blocks. This may further add the embedding capacity due to involving less recovering pixels. Second, we plan to investigate a more accurate prediction model to further lower the prediction error. The above two issues are left as our future works.
Availability of data and materials
Since the data and materials need to be further completed, they are unavailable right now. We will share the data online after the paper is published. People with any questions are welcome to contact us.
Notes
In general, the secret bits of additional data are encrypted beforehand.
To ease description, we assume that some auxiliary keys, e.g., the length of compression location sequence and the starting position of PB blocks in the rearranged image, are delivered to the recipient through public key encryption. This assumption can be relaxed, and our method is still applicable.
BOSSBase. Available from: http://agents.fel.cvut.cz/boss/.
Abbreviations
- RDH:
-
Reversible data hiding
- VRAE:
-
Vacating room after encryption
- RRBE:
-
Reserving room before encryption
- RDH-ED:
-
RDH in encrypted domain
- RDH-EBD:
-
RDH in encrypted binary domain
- SFD:
-
Symmetrical flipping degree
- PB:
-
Pure color blocks
- NPB:
-
Non-pure color blocks
- MEC:
-
Maximum embedding capacity
- MER:
-
Maximum embedding rate
- PSNR:
-
Peak signal to noise ratio
- SSIM:
-
Structural similarity
- ER:
-
Embedding rate
- BPP:
-
Bits per pixel
- GDD:
-
Gray disorder degree
References
J. Tian, in Security and Watermarking of Multimedia Contents IV, vol. 4675. Wavelet-based reversible watermarking for authenticationInternational Society for Optics and Photonics, (2002), pp. 679–690.
J. Tian, Reversible data embedding using a difference expansion. IEEE Trans. Circ. Syst. Video Technol.13(8), 890–896 (2003).
D. M. Thodi, J. J. Rodríguez, Expansion embedding techniques for reversible watermarking. IEEE Trans. Image Process.16(3), 721–730 (2007).
L. Kamstra, H. J. Heijmans, Reversible data embedding into images using wavelet techniques and sorting. IEEE Trans. Image Process.14(12), 2082–2090 (2005).
Z. Ni, Y. -Q. Shi, N. Ansari, W. Su, Reversible data hiding. IEEE Trans. Circ. Syst. Video Technol.16(3), 354–362 (2006).
C. Qin, W. Zhang, F. Cao, X. Zhang, C. -C. Chang, Separable reversible data hiding in encrypted images via adaptive embedding strategy with block selection. Signal Process.53:, 109–122 (2018).
Z. Ni, Y. Q. Shi, N. Ansari, W. Su, Q. Sun, X. Lin, in 2004 IEEE International Conference on Multimedia and Expo (ICME)(IEEE Cat. No. 04TH8763), 3. Robust lossless image data hiding, (2004), pp. 2199–2202.
Z. Ni, Y. Q. Shi, N. Ansari, W. Su, Q. Sun, X. Lin, Robust lossless image data hiding designed for semi-fragile image authentication. IEEE Trans. Circ. Syst. Video Technol.18(4), 497–509 (2008).
Z. Qian, X. Zhang, S. Wang, Reversible data hiding in encrypted jpeg bitstream. IEEE Trans. Multimed.16(5), 1486–1491 (2014).
X. Liao, C. Shu, Reversible data hiding in encrypted images based on absolute mean difference of multiple neighboring pixels. J. Vis. Commun. Image Represent.28:, 21–27 (2015).
H. Wu, F. Li, C. Qin, W. Wei, Separable reversible data hiding in encrypted images based on scalable blocks. Multimed. Tools Appl.78(18), 25349–25372 (2019).
Y. Qiu, Z. Qian, H. Zeng, X. Lin, X. Zhang, Reversible data hiding in encrypted images using adaptive reversible integer transformation. Signal Process.167:, 107288 (2020).
W. Lu, L. He, Y. Yeung, Y. Xue, H. Liu, B. Feng, Secure binary image steganography based on fused distortion measurement. IEEE Trans. Circ. Syst. Video Technol.29(6), 1608–1618 (2018).
K. Ma, W. Zhang, X. Zhao, N. Yu, F. Li, Reversible data hiding in encrypted images by reserving room before encryption. IEEE Trans. Inf. Forensics Secur.8(3), 553–562 (2013).
W. Zhang, K. Ma, N. Yu, Reversibility improved data hiding in encrypted images. Signal Process.94:, 118–127 (2014).
C. Shiu, Y. Chen, W. Hong, Encrypted image-based reversible data hiding with public key cryptography from difference expansion. Signal Process. Image Commun.39:, 226–233 (2015).
X. Cao, L. Du, X. Wei, D. Meng, X. Guo, High capacity reversible data hiding in encrypted images by patch-level sparse representation. IEEE Trans. Cybern.46(5), 1132–1143 (2015).
Z. Ma, F. Li, X. Zhang, Data hiding in halftone images based on hamming code and slave pixels. J. Shanghai Univ.19(2), 111–115 (2013).
F. Li, K. Wu, C. Qin, J. Lei, Anti-compression JPEG steganography over repetitive compression networks. Signal Process.170:, 107454 (2020).
F. Zhang, W. Lu, H. Liu, Y. Yeung, Y. Xue, Reversible data hiding in binary images based on image magnification. Multimed. Tools Appl.78(15), 21891–21915 (2019).
X. Yin, W. Lu, W. Liu, J. Zhang, in International Conference on Security with Intelligent Computing and Big-data Services. Reversible data hiding in binary images by symmetrical flipping degree histogram modification, (2018), pp. 891–903.
T. -S. Nguyen, C. -C. Chang, H. -S. Hsueh, High capacity data hiding for binary image based on block classification. Multimed. Tools Appl.75(14), 8513–8526 (2016).
C. -C. Wang, Y. -F. Chang, C. -C. Chang, J. -K. Jan, C. -C. Lin, A high capacity data hiding scheme for binary images based on block patterns. J. Syst. Softw.93:, 152–162 (2014).
H. Ren, W. Lu, B. Chen, Reversible data hiding in encrypted binary images by pixel prediction. Signal Process.165:, 268–277 (2019).
Acknowledgements
The authors would like to thank the editors and anonymous reviewers for their valuable suggestions and comments.
Funding
This work is supported by the Natural Science Foundation of Shanghai (20ZR1421600) and the Natural Science Foundation of China (61802250).
Author information
Authors and Affiliations
Contributions
Authors’ contributions
FL designed the proposed algorithm and drafted the article. LZ designed and conducted the subjective experiments and tested the proposed algorithm. WW offered useful suggestions and modified the article. All authors read and approved the final article.
Authors’ information
Fengyong Li received the M.S. degree in School of Information and Engineering in 2010 from Zhengzhou University, and the Ph.D. degree in School of Communication and Information Engineering in 2014 from Shanghai University. He is currently an Associate Professor of the College of Computer Science and Technology, Shanghai University of Electric Power, Shanghai, China. He worked as a Visiting Scholar in the University of Victoria, B.C., Canada, from 2018 to 2019. His research interests include multimedia security, information hiding, and machine learning. He has published more than 40 peer-reviewed papers in his research areas.
Lianming Zhang received the B.S. degree in environmental engineering from Anhui Polytechnic University in 2018. He is currently working for the Master’s degree at the College of Computer Science and Technology, Shanghai University of Electric Power, Shanghai, China. His research interests include information hiding and multimedia security.
Weimin Wei received the M.Eng. degree from Wuhan University, China, in 2004, and the Ph.D. degree from Shanghai University, China, in 2010. Currently, he is with College of Computer Science and Technology, Shanghai University of Electric Power. His research interests include image processing, digital forensics, and data mining.
Corresponding author
Ethics declarations
Competing interests
The authors declare that they have no competing interests.
Additional information
Publisher’s Note
Springer Nature remains neutral with regard to jurisdictional claims in published maps and institutional affiliations.
Rights and permissions
Open Access This article is licensed under a Creative Commons Attribution 4.0 International License, which permits use, sharing, adaptation, distribution and reproduction in any medium or format, as long as you give appropriate credit to the original author(s) and the source, provide a link to the Creative Commons licence, and indicate if changes were made. The images or other third party material in this article are included in the article’s Creative Commons licence, unless indicated otherwise in a credit line to the material. If material is not included in the article’s Creative Commons licence and your intended use is not permitted by statutory regulation or exceeds the permitted use, you will need to obtain permission directly from the copyright holder. To view a copy of this licence, visit http://creativecommons.org/licenses/by/4.0/.
About this article

Cite this article
Li, F., Zhang, L. & Wei, W. Reversible data hiding in encrypted binary image with shared pixel prediction and halving compression. J Image Video Proc. 2020, 33 (2020). https://doi.org/10.1186/s13640-020-00522-6
Received:
Accepted:
Published:
DOI: https://doi.org/10.1186/s13640-020-00522-6