Extrapolation and Uncertainty Evaluation of Carbon Dioxide and Methane Emissions in the Qinghai-Tibetan Plateau Wetlands Since the 1960s
 Jiang Zhang1
  Qiuan Zhu1,2,3*
  Minshu Yuan1
  Xinwei Liu4
  Huai Chen4
  Changhui Peng1,5
  Meng Wang6 Zhenan Yang7
  Lin Jiang1 Pengxiang Zhao8*
- 1Center for Ecological Forecasting and Global Change, College of Forestry, Northwest A&F University, Yangling, China
- 2College of Hydrology and Water Resources, Hohai University, Nanjing, China
- 3National Earth System Science Data Center, National Science & Technology Infrastructure of China, Beijing, China
- 4Chengdu Institute of Biology, Chinese Academy of Sciences, Chengdu, China
- 5Department of Biology Sciences, Institute of Environment Sciences, University of Quebec at Montreal, Montreal, QC, Canada
- 6Key Laboratory of Geographical Processes and Ecological Security in Changbai Mountains, Ministry of Education, School of Geographical Sciences, Northeast Normal University, Changchun, China
- 7Key Laboratory of Southwest China Wildlife Resources Conservation (China West Normal University), Ministry of Education, Nanchong, China
- 8College of Forestry, Northwest A&F University, Yangling, China
Wetlands are important modulators of atmospheric greenhouse gas (GHGs) concentrations. However, little is known about the magnitudes and spatiotemporal patterns of GHGs fluxes in wetlands on the Qinghai-Tibetan Plateau (QTP), the world’s largest and highest plateau. In this study, we measured soil temperature and the fluxes of carbon dioxide (CO2) and methane (CH4) in an alpine wetland on the QTP from April 2017 to April 2019 by the static chamber method, and from January 2017 to December 2017 by the eddy covariance (EC) method. The CO2 and CH4 emission measurements from both methods showed different relationships to soil temperature at different timescales (annual and seasonal). Based on such relationship patterns and soil temperature data (1960–2017), we extrapolated the CO2 and CH4 emissions of study site for the past 57 years: the mean CO2 emission rate was 91.38 mg C m–2 h–1 on different measurement methods and timescales, with the range of the mean emission rate from 35.10 to 146.25 mg C m–2 h–1, while the mean CH4 emission rate was 2.75 mg C m–2 h–1, with the ranges of the mean emission rate from 1.41 to 3.85 mg C m–2 h–1. The estimated regional CO2 and CH4 emissions from permanent wetlands on the QTP were 94.29 and 2.37 Tg C year–1, respectively. These results indicate that uncertainties caused by measuring method and timescale should be fully considered when extrapolating wetland GHGs fluxes from local sites to the regional level. Moreover, the results of global warming potential showed that CO2 dominates the GHG balance of wetlands on the QTP.
Introduction
Since the beginning of the Industrial Era, large amounts of greenhouse gases (GHGs) have been released into the atmosphere (Boden et al., 2011). The continuously increasing concentrations of GHGs, particularly carbon dioxide (CO2), methane (CH4), and nitrous oxide (N2O), contribute to the rise of land and ocean surface temperatures globally (IPCC, 2013). The trend of global warming will undoubtedly lead to changes in ecosystem structure, processes and functions in the next decades (Kintisch and Buckheit, 2006).
Although the increasing concentration of GHGs in the atmosphere is due mainly to human activities, about one third derives from natural resources, such as wetland soils (Marin-Muniz et al., 2015). Wetlands are unique in that they are formed by the interaction of terrestrial and aquatic ecosystems (Lewis and Ebrary, 1995). This allows them to serve many important functions, including improving water quality and micro-climate, sequestering carbon, and protecting biodiversity (Costanza et al., 1997; Engelhardt and Ritchie, 2001; Lamers et al., 2014). The wetlands occupy only 5–8% of land areas on Earth, but they store more than 30% of the world’s soil carbon (Bridgham et al., 2012; Malone et al., 2013). Especially, in high-latitude wetlands, the combination of high productivity and low decomposition has resulted in significant carbon storage (Whiting and Chanton, 2001). Wetlands are considered as a major source of GHGs emissions (Bridgham et al., 2012; Mitsch et al., 2013). Therefore, quantifying and modeling the emission of GHGs from wetlands is very important for understanding the impacts of climate change on terrestrial ecosystem processes (Liu et al., 2017).
Many studies identified the production of GHGs in wetlands generally depends on soil temperature, water tables and redox conditions (Inglett et al., 2012; Treat et al., 2014). Soil temperature may impact the gaseous diffusivity of surface soils, soil organic matter decomposition, chemical reaction rates and so on, which ultimately impact GHGs emissions in wetlands (Liu et al., 2017; Yu et al., 2017). Although some studies have evaluated the relationships between GHGs fluxes and different environment factors in wetland, they are still uncertain in different wetlands. For example, a strong correlation between GHGs fluxes and soil temperature was found in artificial wetlands (Liu et al., 2013), but weak correlations were found in northern wetlands (Yu et al., 2017). Therefore, more in situ observations are still needed in wetlands.
The Qinghai-Tibetan Plateau (QTP), also known as the “Third Pole” of the Earth, is the largest and highest plateau in the world, with an average altitude of about 4 km. About 25% of the plateau’s area of 2.5 × 10⁶ km2 (Chen et al., 2013a) is covered in wetlands (Hirota et al., 2004; Lehner and Doell, 2004; Niu et al., 2012; Chen et al., 2014; Wei and Wang, 2016). Since the 1960s, the QTP has experienced substantial changes due to human activities and natural processes, such as climate warming, water pollution and degradation of grassland and wetland (Piao et al., 2010; Chen et al., 2013b; Gao et al., 2013). The temperature of QTP has increased by 0.2°C per decade, faster rate than the global average of 0.74°C over the last century (Chen et al., 2013b; Liu et al., 2017). Climate changes are likely to affect the carbon and nitrogen cycles of alpine wetlands on the QTP (Gao et al., 2009; Tang et al., 2009; Zeng et al., 2017). Therefore, studying the GHGs fluxes in the QTP wetlands is necessary, which will further our understanding of carbon dynamics, as well as provide crucial insight into wetland responses to climate change. Although several studies estimated the dynamic and budget of carbon on the QTP, significant uncertainties of the size and the spatial distribution of carbon still exist when estimating current and future GHGs emissions from wetlands (Chen et al., 2013a; Jin et al., 2015; Wei and Wang, 2016; Cao et al., 2017; Zhang et al., 2020). There is a need for long-term field measurements to quantify carbon dynamics in wetlands under various climatic conditions (Zhao et al., 2006). And to evaluate the differences from different methods at different temporal-spatial scales will contribute to accurately quantify the budget of carbon of wetlands on the QTP.
In the present study, we measured the GHGs (CO2 and CH4) exchange between the atmosphere and wetland ecosystem on the QTP by the manual static chamber-gas chromatography method and the eddy covariance (EC) method. We aimed to (1) investigate spatiotemporal variations in CO2 and CH4 fluxes between soil and atmosphere and their relationship with soil temperature in the wetlands of the QTP, and (2) assess the uncertainties in extrapolation of CO2 and CH4 emissions from wetlands on the QTP.
Materials and Methods
Study Site
The study was conducted at the Riganqiao Provincial Wetland Reserve (33°06′25″ N, 102°38′33″ E) located in the National Nature Reserve of Hongyuan county, China (Figure 1). The study site lies in the northeastern region of the QTP. The alpine wetland has an annual average temperature of 1.5°C and annual average precipitation of 270 mm (Liu et al., 2016; Zhong et al., 2017). The dominant vegetation is herbaceous plants, including Carex mulinesis, Trollius farreri, Gentianan formosa, and Caltha palustris (Yang et al., 2014; Liu et al., 2016; Zhong et al., 2017).
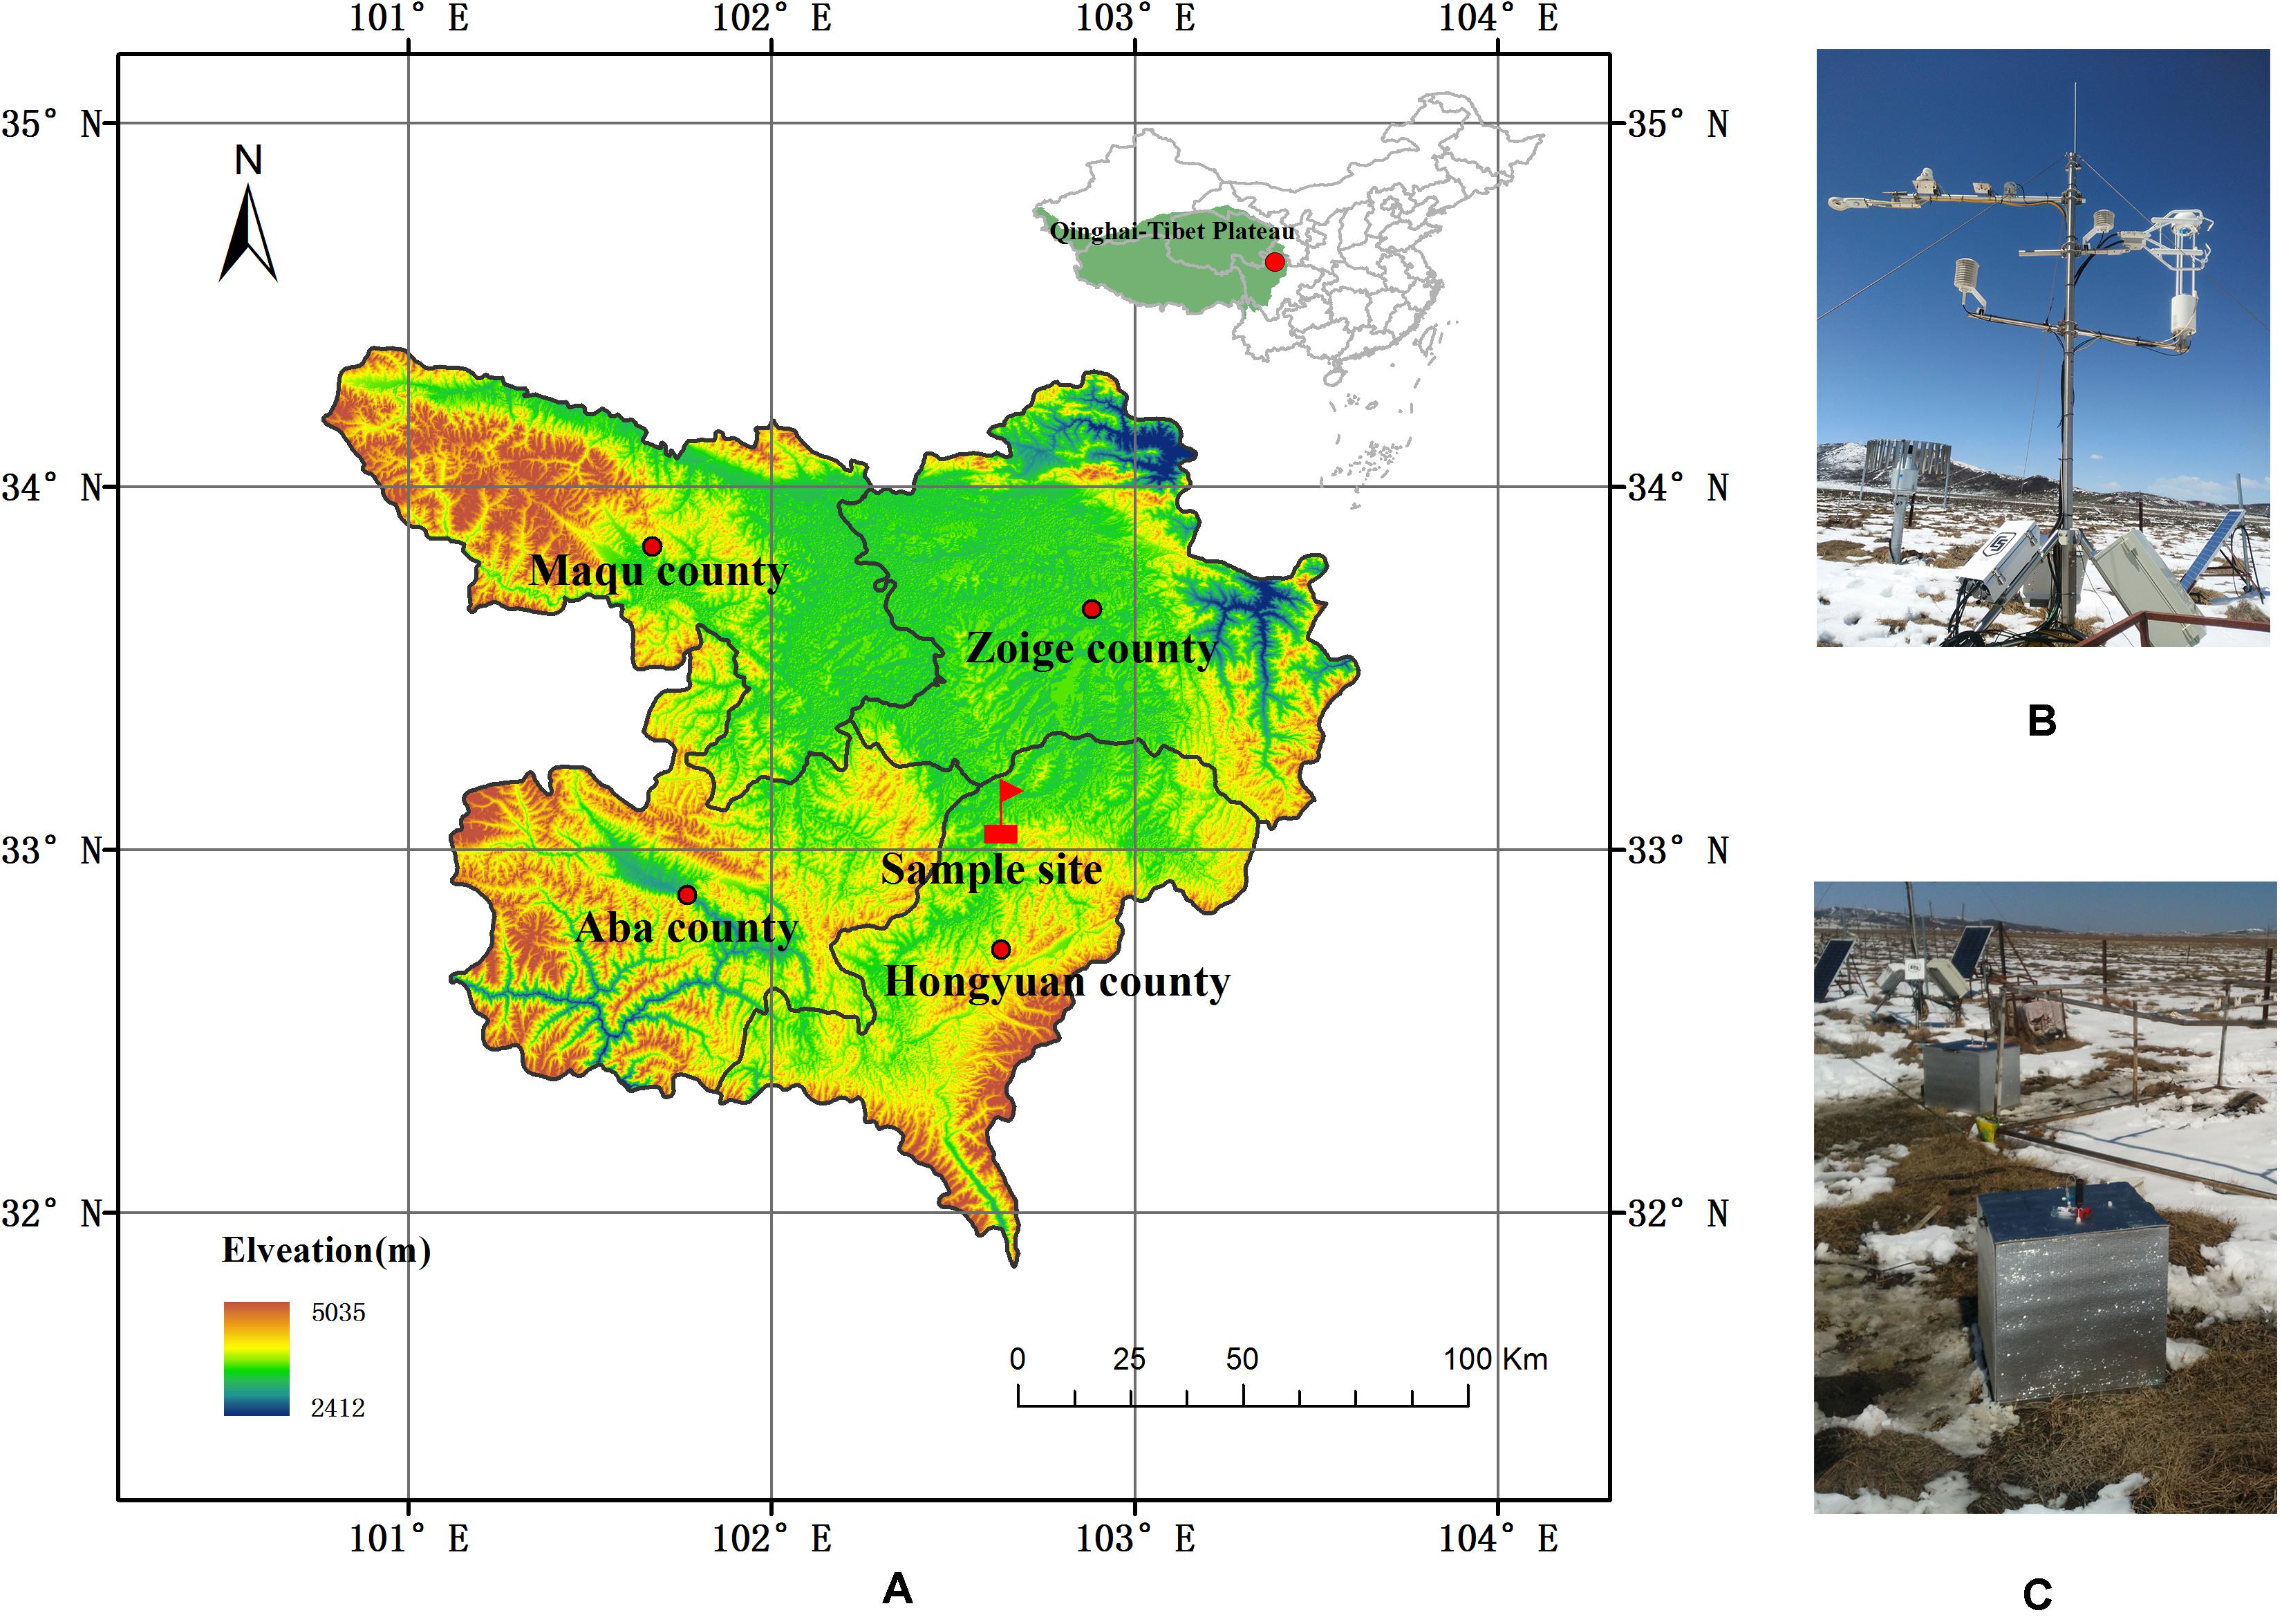
Figure 1. Location of the Riganqiao Provincial Wetland Reserve. (A) Elevation map showing the sample site, denoted with a red flag, located on the Qinghai-Tibetan Plateau in the northeast region of Hongyuan county, China. Photographs of the (B) eddy covariance system and (C) static chamber used in this study.
Gas Flux Measurements and Calculations
We performed in situ measurements primarily using the manual static chamber-gas chromatography method, already used to study most natural ecosystems (Chen et al., 2013a; Marin-Muniz et al., 2015; Wei and Wang, 2016). The eddy covariance (EC) method, a micrometeorological approach widely was applied to continuously measure carbon exchange between the atmosphere and ecosystems (Yu et al., 2017; Cui et al., 2018).
Chamber Method
GHGs fluxes were measured with static chamber method in situ from April 2017 to April 2019. The base of the stainless steel chamber (50 × 50 × 50 cm) was embedded 10 cm into the soil. To begin sampling, the base was filled with water to seal the compartments from outside air. Four static chambers were established on the study site. Four air samples were collected per hour from each chamber, which were taken at 10 min intervals after enclosure, stored in 10 ml air-tight vacuum vials. We took eight measurements from 10:00 to 18:00. Eight GHGs fluxes were collected for each chamber and the average value of four chambers was taken as the monthly emission value. No measurements were taken in February because weather conditions blocked access to the sample site. Temperature was recorded during gas sampling by sensors positioned on the inside and outside of the chamber and connected to an electronic thermometer. The GHGs concentrations were analyzed by gas chromatography (7890A GC System, Agilent Technologies, United States) (Chen et al., 2013a).
The fluxes of CO2 and CH4 were calculated as:
where F is gas flux; H, chamber height above the soil surface; M, molar mass of gas; V0, standard molar volume (22.4 L mol–1); P, atmospheric pressure at the sampling site; P0, atmospheric pressure (101,325 Pa); T0, absolute temperature of 0°C (273.15 K); T, the absolute temperature of the sampling time and dc/dt, change in gas flux rate. Details regarding the calculation of gas fluxes have been described (Chen et al., 2013a; Marin-Muniz et al., 2015).
EC Method
The CH4 fluxes were measured from January 2017 to December 2017 using the open-path EC method at a height of 2.5 m (Figure 1). Flux data were recorded at 10 Hz and logged at 30-min intervals using a data logger (CR3000; Campbell Scientific, United States). The raw CH4 data were postprocessed and quality controlled by EddyPro v4.2 software1 to compute the CH4 fluxes over an half hour interval (Foken et al., 2004). Due to missing and discarded data, in this study, we filled the gaps of CH4 data by an average diurnal variations based on previous and subsequent days. Details of the CO2 data processing have been described in previous study (Liu et al., 2019).
Soil Temperature Measurements in situ
Soil temperature was automatically recorded at 30-min intervals by sensors (WatchDog-B101, Spectrum, Chicago, United States) placed 5 cm below the soil surface at the sample site. Further investigation was conducted to explore the relationships between soil temperature at 5 cm of depth and GHGs emissions.
Additional Data Sources and Preprocessing
Wetland distribution maps (1980, 1990, 2000, and 2008) were acquired from Niu et al. (2009), which had been widely used in wetland classification and ecological regionalization (Liu et al., 2015; Zhu et al., 2016; Wang et al., 2020). In this study, the area overlapping across all four wetland distribution maps was defined as permanent wetland. Grid monthly soil temperatures at a depth of 5 cm (1960–2017) of QTP was extracted form the soil temperature dataset of China, which was constructed by interpolation at a spatial resolution of 5 arc-min using ANUSPLIN based on soil temperature data at a depth of 5 cm of 650 national meteorological stations that obtained from the China Meteorological Data Service Center2.
Statistical Analyses
Mean emissions of CO2 and CH4 were calculated by averaging the replicates of sampling data. Soil temperature was calculated by averaging daily data. Linear and non-linear regressions were used to evaluate the relationship between soil temperatures and GHGs fluxes as measured by both methods (static chamber or EC) at different timescales (annual and seasonal). Results from the best fitting regression models are presented. All statistical analyses were performed using the software package R (R Core Team, 2020).
Extrapolation of GHGs Fluxes
The relationship between soil temperature of 5 cm depth and observed CO2 and CH4 emissions was explorered at different timescales [annual, non-growing (Jan–Apr and Oct–Dec) or growing season (May–Sep) (NG&G seasonal)]. Then the regression equations were applied to extrapolate the CO2 and CH4 emission rates of study site from 1960 to 2017 and the uncertainties were investigated.
In addition, the regression equations from EC method at NG&G seasonal timescales was performed for each wetland grid cell in order to roughly evaluate the long-term total and spatial patterns of wetland CO2 and CH4 emissions on the whole QTP.
Results
Soil Temperature During Measurements
The daily average soil temperature at a depth of 5 cm ranged from -3.35 to 20.13°C during the entire observation period (April 2017–April 2019) (Figure 2A). Soil temperature showed a clear seasonal variation, with higher temperatures recorded during the growing season (from June–September) than during the non-growing season in 2017 and 2018. Daily mean temperatures were often below zero in winter (December–February), when soil layers were frozen.
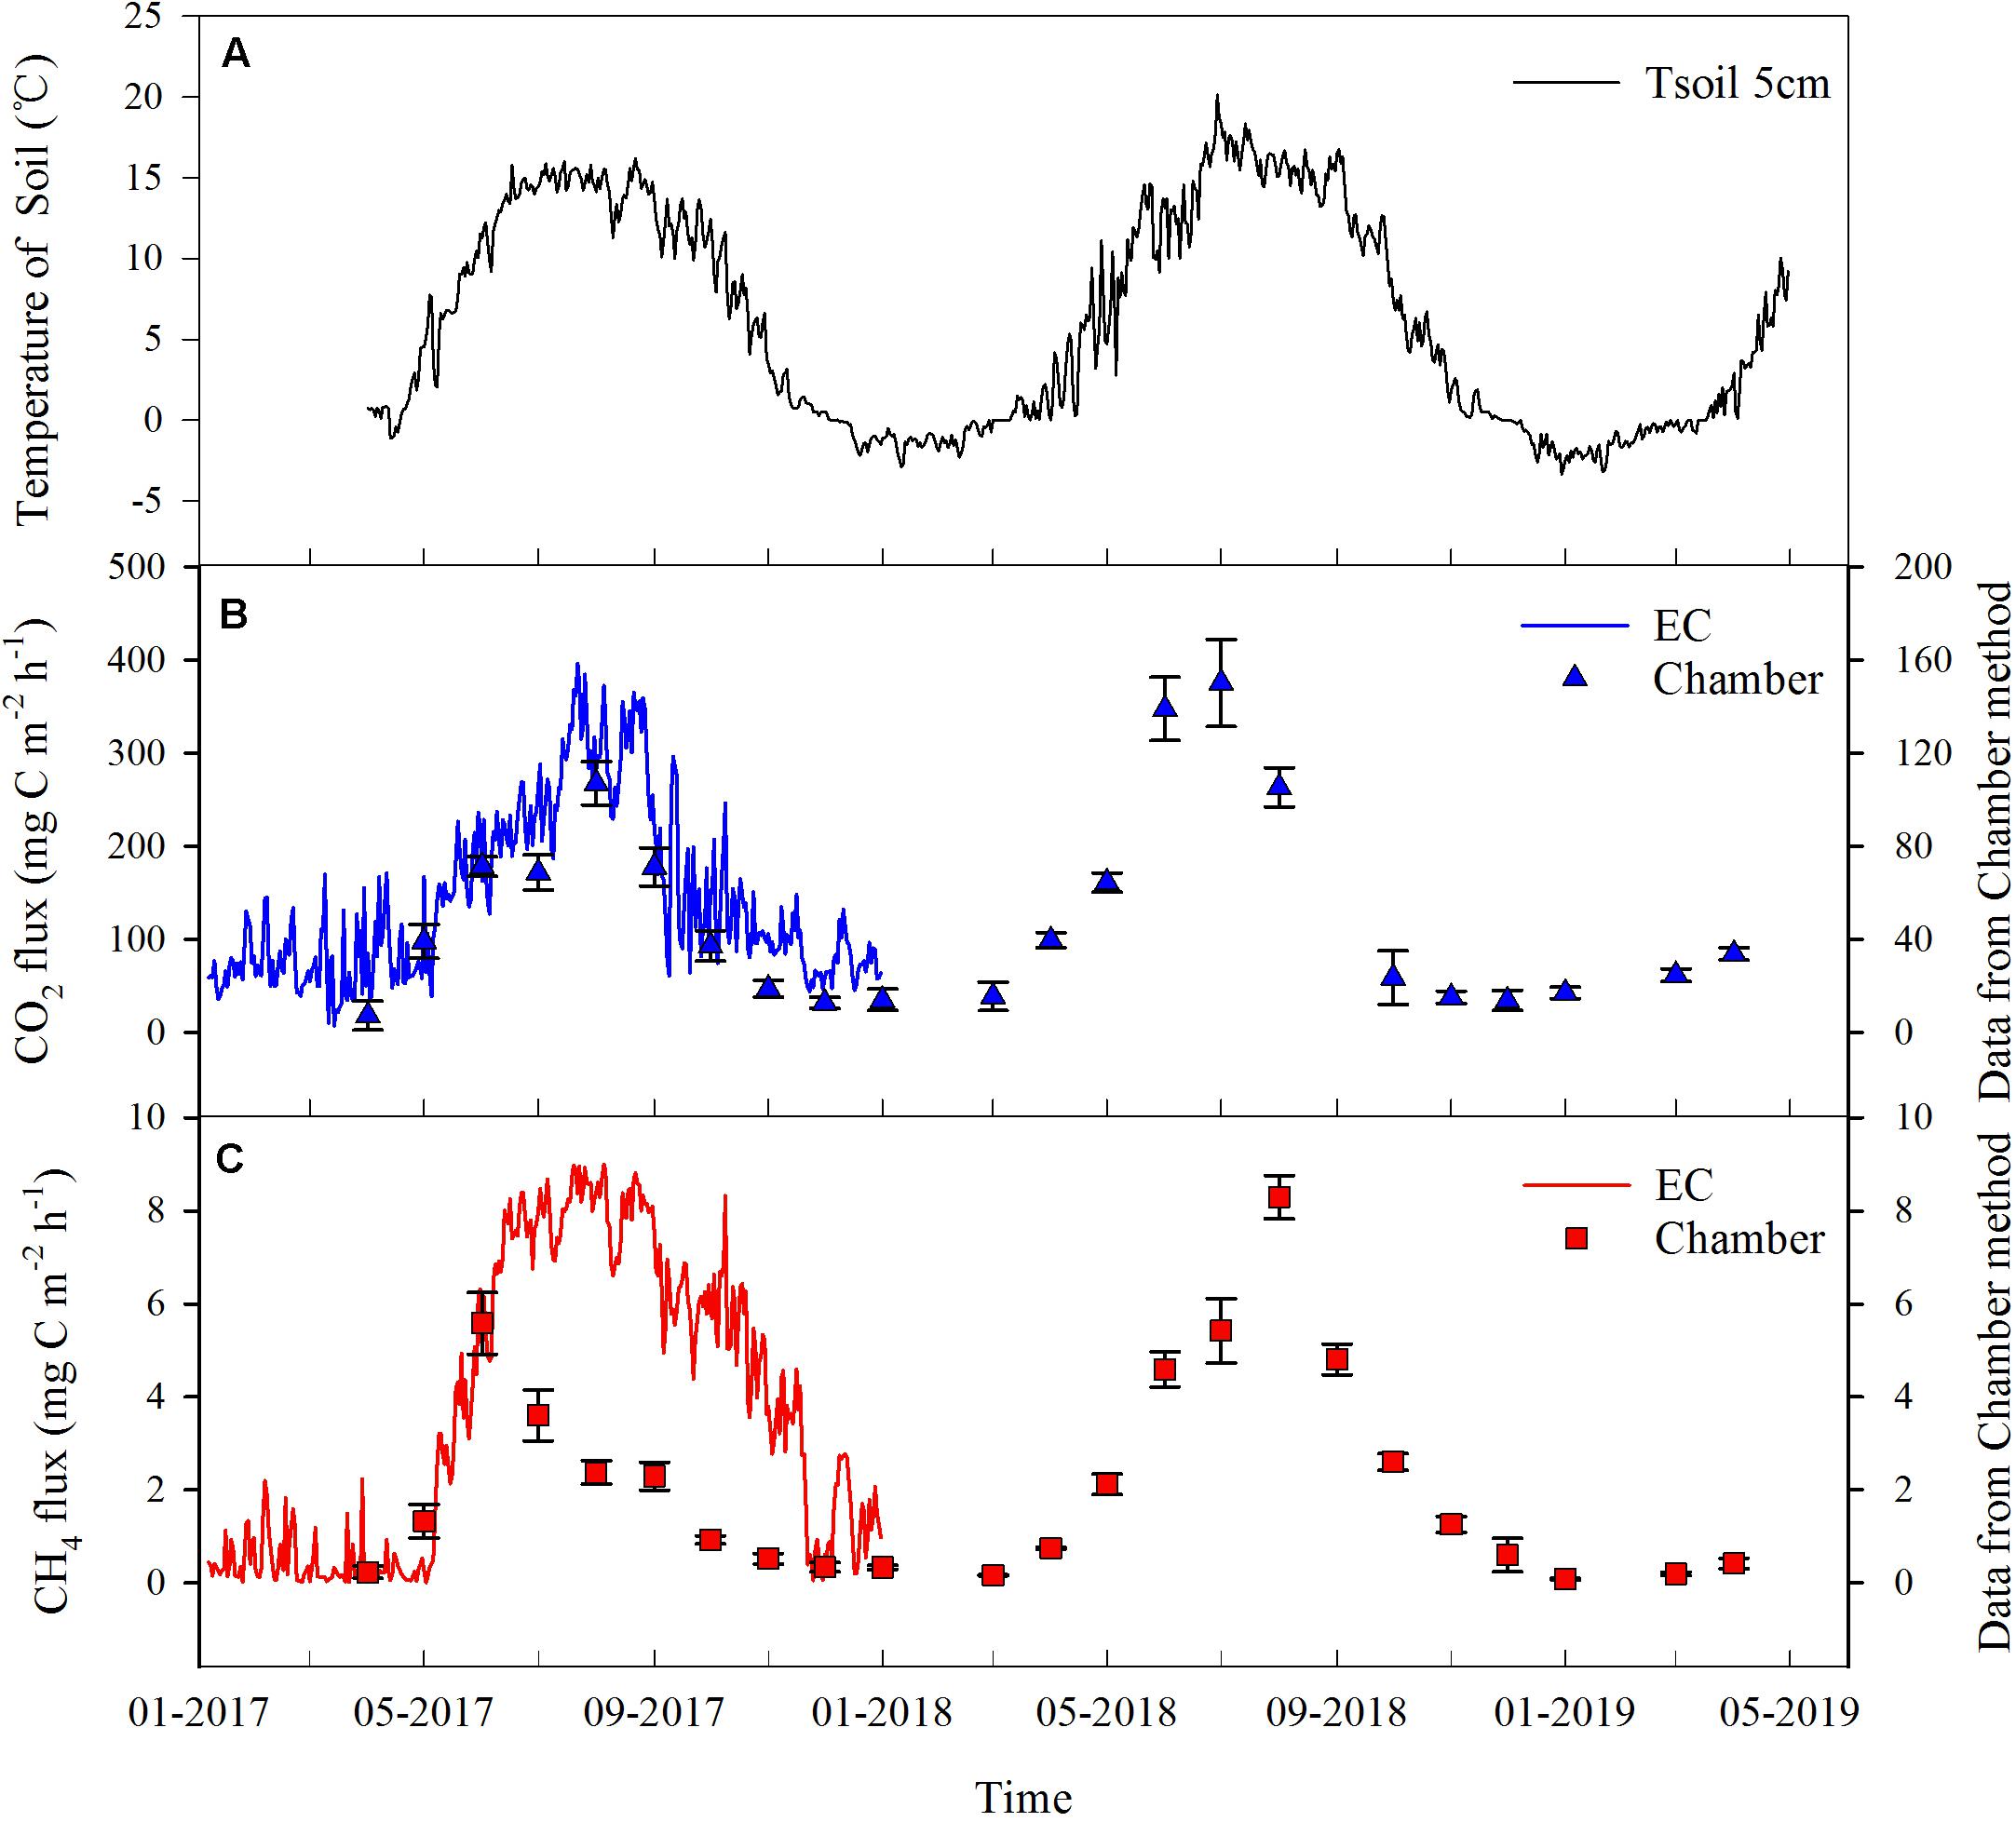
Figure 2. Variations in soil temperature and CO2 and CH4 fluxes of the wetland site during the measurement period. Daily mean values of (A) soil temperature at 5 cm below ground from April 2017 to April 2019, (B) CO2 flux rates, and (C) CH4 flux rates. Solid blue and red lines indicate data obtained using the eddy covariance (EC) method from January to December 2017. The blue triangles and red squares indicate data collected using the chamber method from April 2017 to April 2019. Standard error is represented by vertical lines on triangles and squares.
Seasonal Dynamics of CO2 and CH4 Fluxes
The CO2 fluxes showed a typical seasonal pattern: high fluxes were measured during the plant growing season, and low fluxes during the non-growing season (Figure 2B). The EC method showed greater variability in CO2 fluxes than the chamber method. Measurements by the EC method oscillated between 7.38 and 395.74 mg C m–2 h–1. The CO2 fluxes from the chamber method oscillated between 7.21 ± 6.20 and 150.15 ± 18.73 mg C m–2 h–1. Peak CO2 fluxes were registered in August 2017 by both methods (EC:395.74 mg C m–2 h–1; chamber: 106.94 ± 9.29 mg C m–2 h–1). However, only the chamber method found another peak flux in July 2018 (150.15 ± 18.73 mg C m–2 h–1), as the EC method did not capture data after 2017. Peaks in CO2 fluxes usually coincided with peaks in soil temperature.
The seasonal dynamics of CH4 fluxes paralleled those of CO2 fluxes. The CH4 emission rate measured by the EC method oscillated between 0.01 and 9.00 mg C m–2 h–1, while the rate from the chamber method ranged from 0.08 ± 0.02 to 8.30 ± 0.46 mg C m–2 h–1 (Figure 2C). The EC method measured a higher CH4 emission rate than the chamber method from May to December 2017. The chamber method captured emission spikes in July 2017 and August 2018. Although CH4 emission rates exhibited similar dynamics as soil temperature, they slowed down in June 2017 (2.38 ± 0.25 mg C m–2 h–1) and August 2017 (2.30 ± 0.30 mg C m–2 h–1), despite increasing soil temperature. The winter season also slowed the rate of methane emissions.
Relationship of CO2 and CH4 Fluxes to Soil Temperature
According to regression analyses, CO2 fluxes increased exponentially with rising soil temperatures based on both EC and chamber measurements. Likewise, positive exponential correlations were found between CO2 fluxes and soil temperatures during growing season or non-growing season (Figures 3A,B). The CH4 fluxes correlated well with soil temperatures based on both methods. We also found positive relationships between CH4 fluxes and soil temperatures. The relationship between CH4 emission and soil temperature was exponential during the non-growing season but linear relationship was found during the growing season (Figures 3C,D).
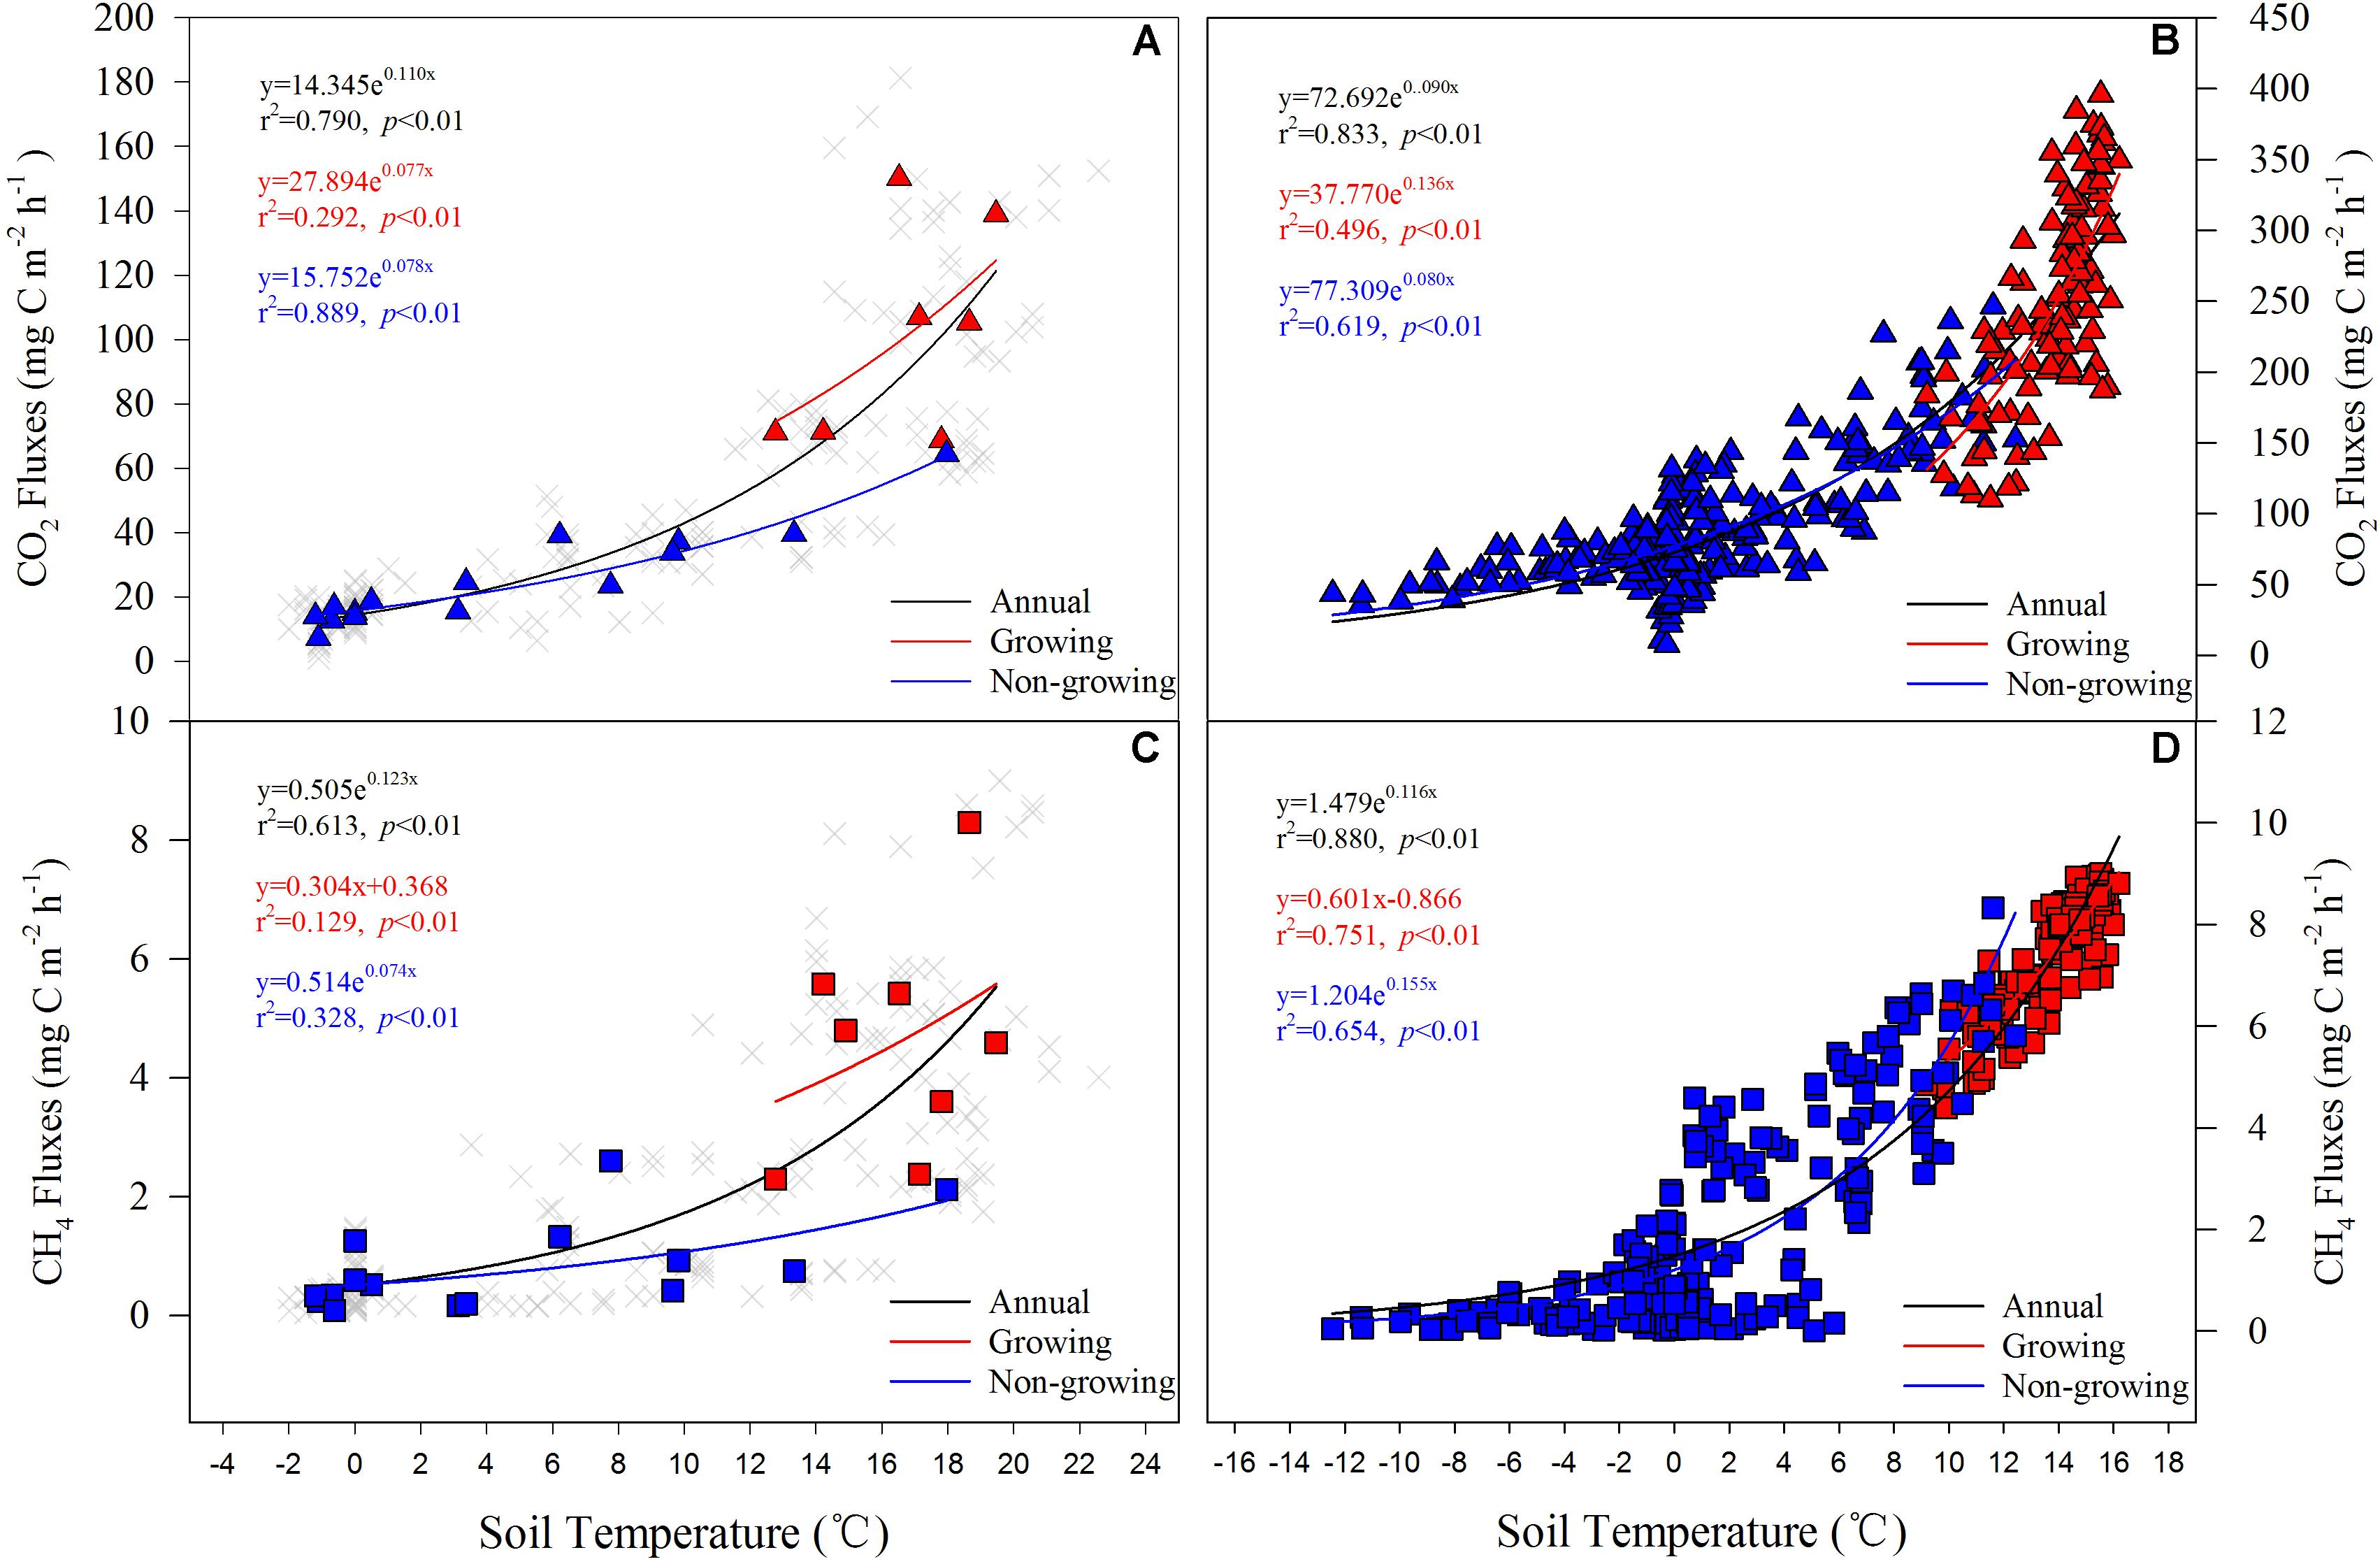
Figure 3. Relationships between GHGs emissions and soil temperatures for annual and growing or non-growing periods, based on linear and non-linear regression. Annual refers data throughout the entire year; Growing, data in the growing season (May-Sep); Non-growing, data in the non-growing season (Jan-Apr and Oct-Dec). Data were collected using thestatic chamber (A,C) or eddy covariance (EC) method (B,D).
Extrapolation of CO2 and CH4 Emission Rates of the Study Site
Based on the soil temperatures of study site and the regression equations, we extrapolated the CO2 and CH4 emission rates of the study site for the last 57 years (Figure 4). For static chamber method, extrapolated GHGs emission rates were higher for regression equations based on the NG&G seasonal scale than for equations based on the annual scale (Figures 4A,C). For the EC method, extrapolated GHGs emission rates are similar at both timescales (Figures 4B,D).
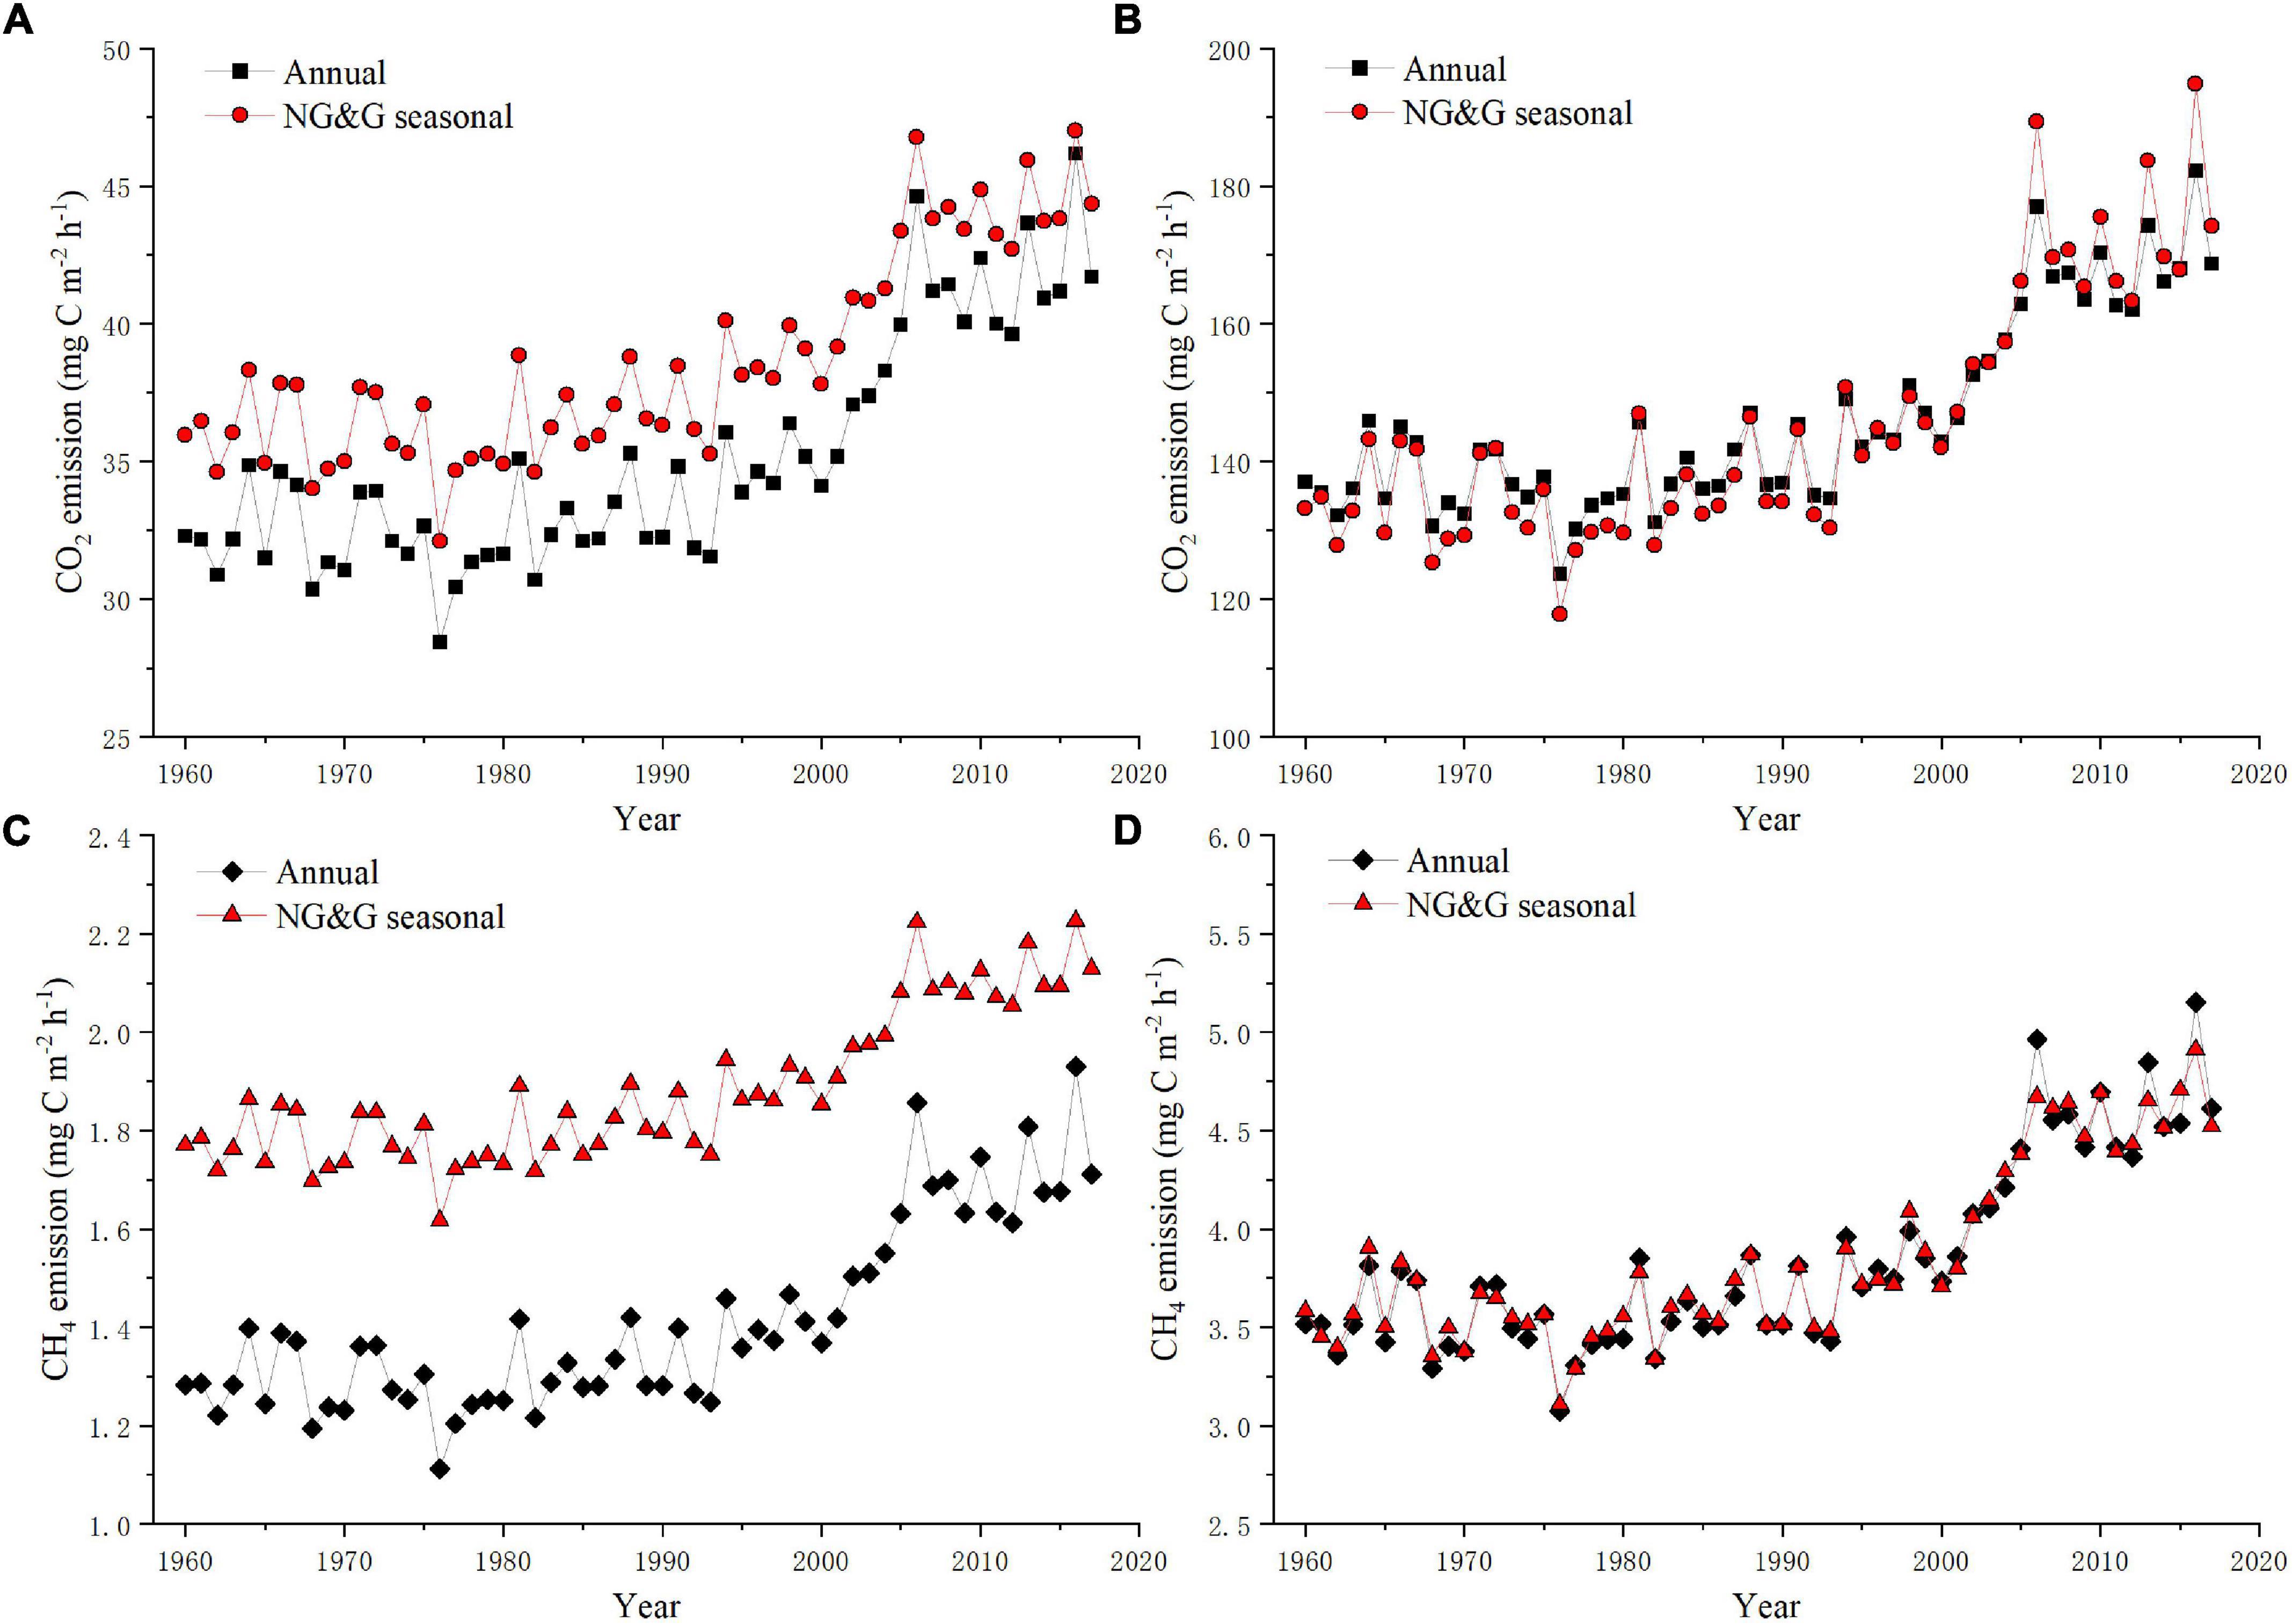
Figure 4. Annual CO2 and CH4 emission rates of the study site from 1960 to 2017 were extrapolated based on regression models between soil temperature and CO2/CH4 emissions measured using the static chamber method (A,C) and using the eddy covariance method (B,D) at different timescales (Annual or NG&G seasonal).
Although extrapolated CO2 emission rate followed similar trends whether based on the static chamber method or the EC method, the two methods gave significantly different magnitudes for the emission rate. the CO2 emission rate in the static chamber method was far less than that measured by the EC method (Figures 4A,B). Extrapolated mean CO2 emission rate of study site from 1960 to 2017 was calculated to be 91.38 mg C m–2 h–1, with the ranges of the mean emission rate from 35.10 to 146.25 mg C m–2 h–1 on different measurement methods and timescales (Table 1). The differences of emission rates between the maximum and minimum values extrapolated for each year reflected uncertainties from the same measurement method at different timescales. Uncertainties in extrapolation of the CO2 emission rates ranged from 0.84 to 4.38 mg C m–2 h–1 based on static chamber data, and from 0.13 to 12.67 mg C m–2 h–1 based on EC data (Figures 5A,B).
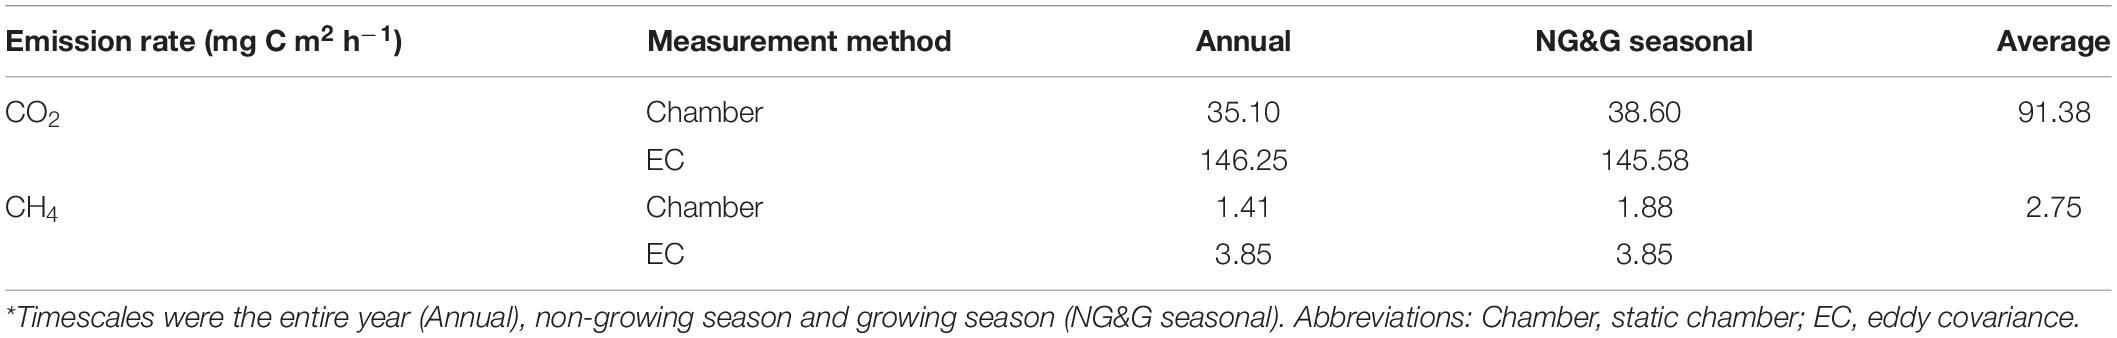
Table 1. Extrapolated mean emission rate of CO2 and CH4 of study site for the period 1960–2017, based on models derived from data obtained using the chamber or EC method at different timescales*.
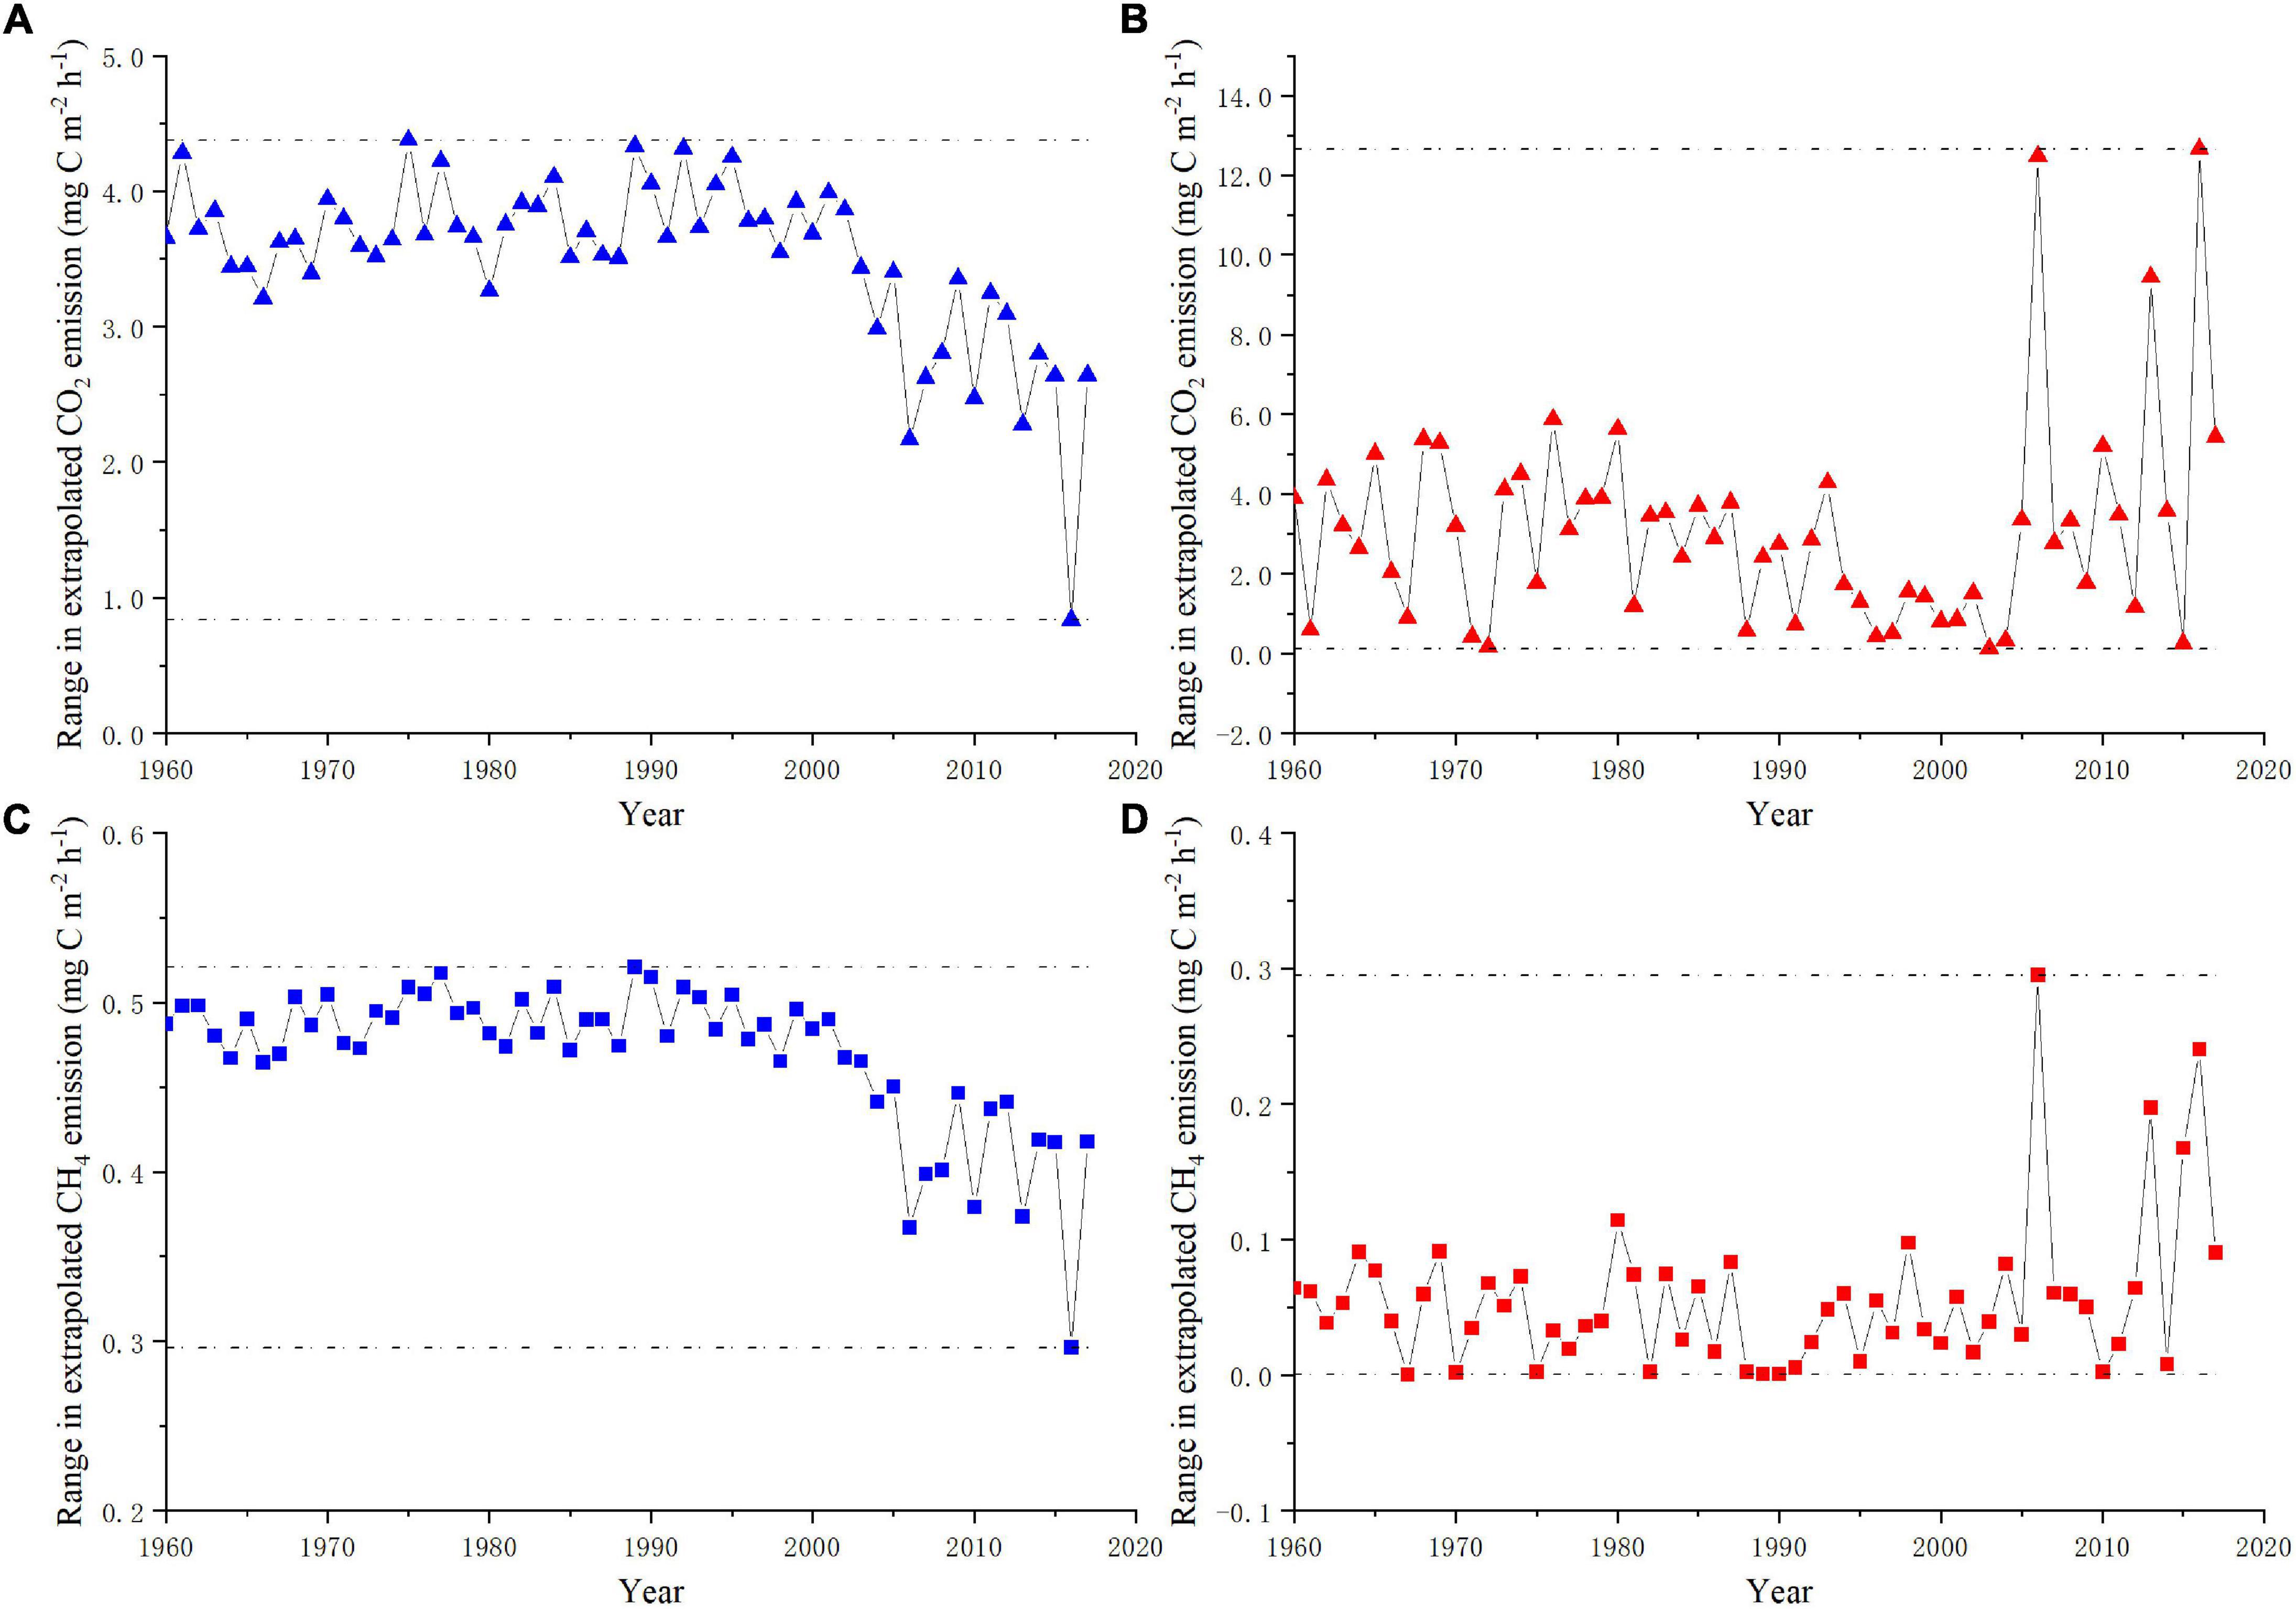
Figure 5. Calculated differences between extrapolated annual greenhouse gas emission rate of study site from 1960 to 2017. CO2 and CH4 emission rates were extrapolated by models based on data derived from the static chamber method (A,C) or Eddy covariance method (B,D) at annual and NG&G seasonal timescales, respectively. The differences between the maximum and minimum extrapolated values of each year were plotted.
Extrapolated values for CH4 emission rate based on EC data were three times larger than extrapolated values based on chamber data (Figures 4C,D). Extrapolated mean CH4 emission rate of the study site was 2.75 mg C m–2 h–1 from 1960 to 2017, with the ranges of the mean emission rate from 1.41 to 3.85 mg C m–2 h–1 on different measurement methods and timescales (Table 1). Differences in annual average maxima and minima reflected uncertainties from static chamber method data ranging from 0.30 to 0.52 mg C m–2 h–1 (Figure 5C), while uncertainties in data extrapolated from the EC method ranged from 0 to 0.30 mg C m–2 h–1 (Figure 5D).
Regional Extrapolation of CO2 and CH4 Emissions From Wetlands on the QTP
Based on spatial soil temperature dataset of wetlands and the regression equations from EC method at NG&G seasonal timescales, total GHGs emissions of permanent wetland on the QTP were roughly extrapolated by performing the model for each wetlands grid cell. The CO2 and CH4 emissions of wetlands displayed pronounced increase on the whole QTP from 1960 to 2017 (Figures 6A,B). And the growth tendencies of CO2 and CH4 emissions showed no significant spatial heterogeneity on the QTP (Figures 6C,D). The northern part of the QTP showed the most obvious increase, while the marginal region displayed a downward trend. Moreover, we examined previously published results on CO2 and CH4 emissions from the QTP wetlands and compared them with average values extrapolated from 2010 to 2017 in the present study (Table 2). Calculated the regional CO2 emission (94.29 Tg C year–1) of wetlands on the QTP were higher than the ranges reported in the literature (40.65–58.34 Tg C year–1). And the CH4 emission (2.37 Tg C year–1) of wetlands on the QTP in this study fell within the range of previous studies (0.17–8.56 Tg C year–1) (Table 2).
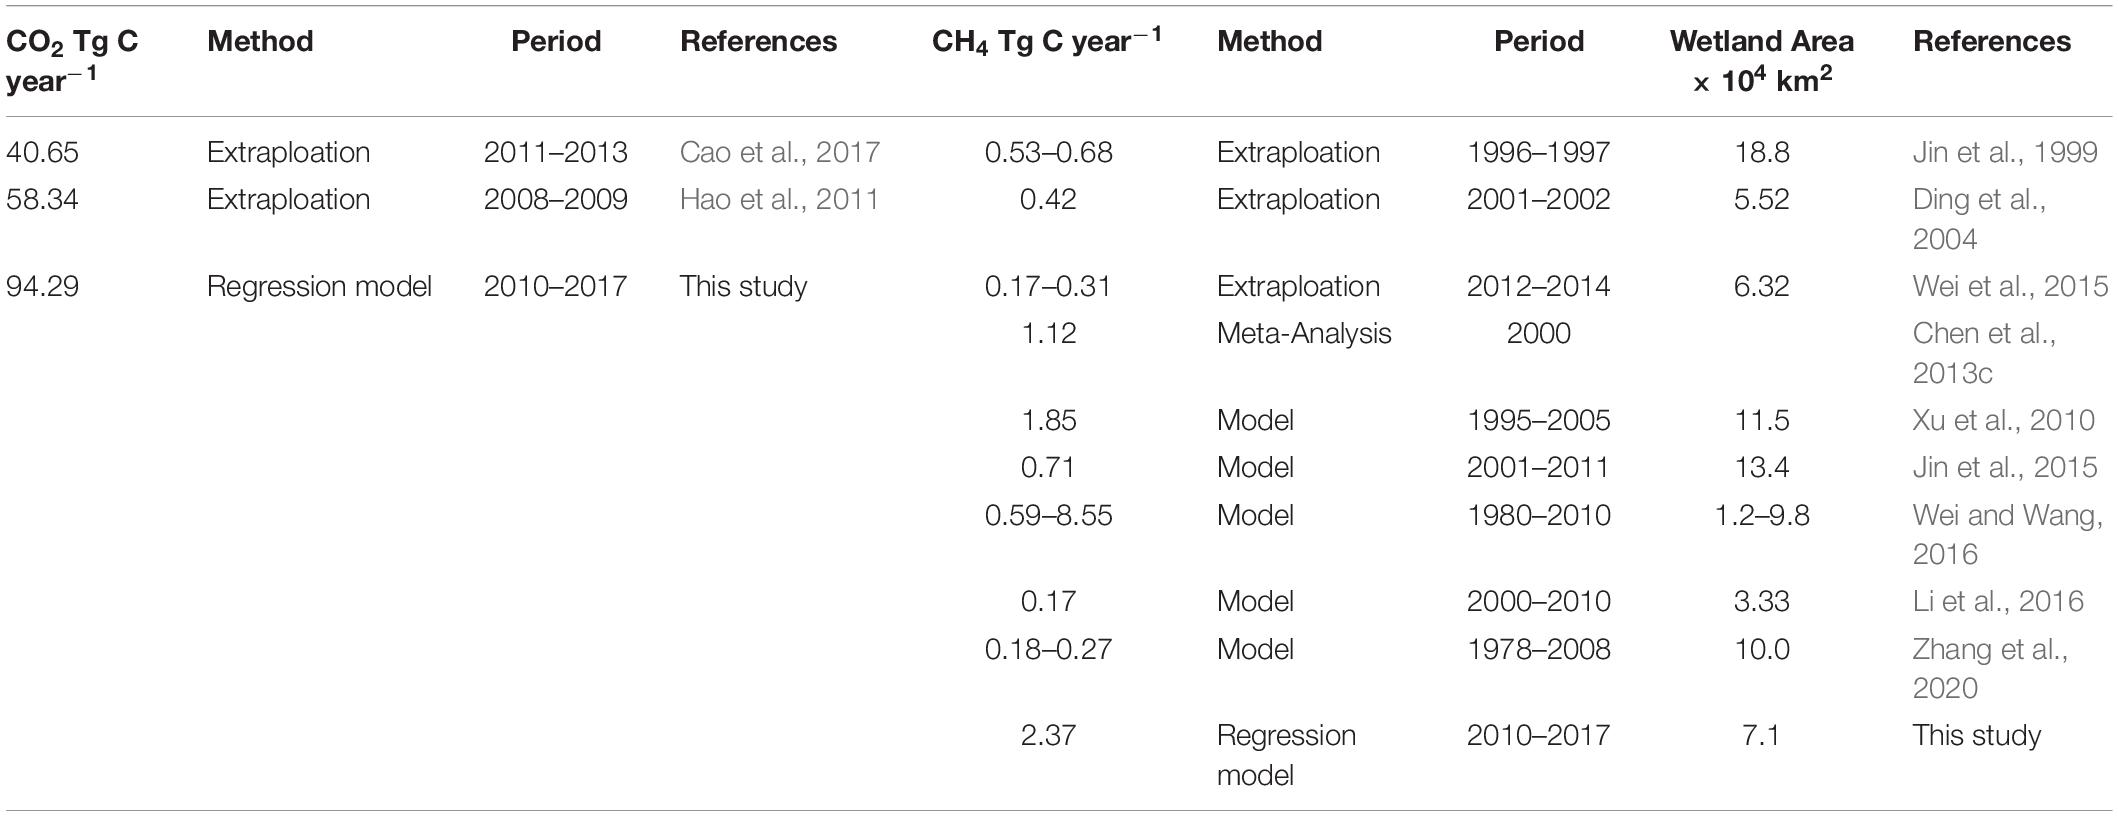
Table 2. Estimated greenhouse gas emissions from the Qinghai-Tibetan Plateau wetlands in the literature.
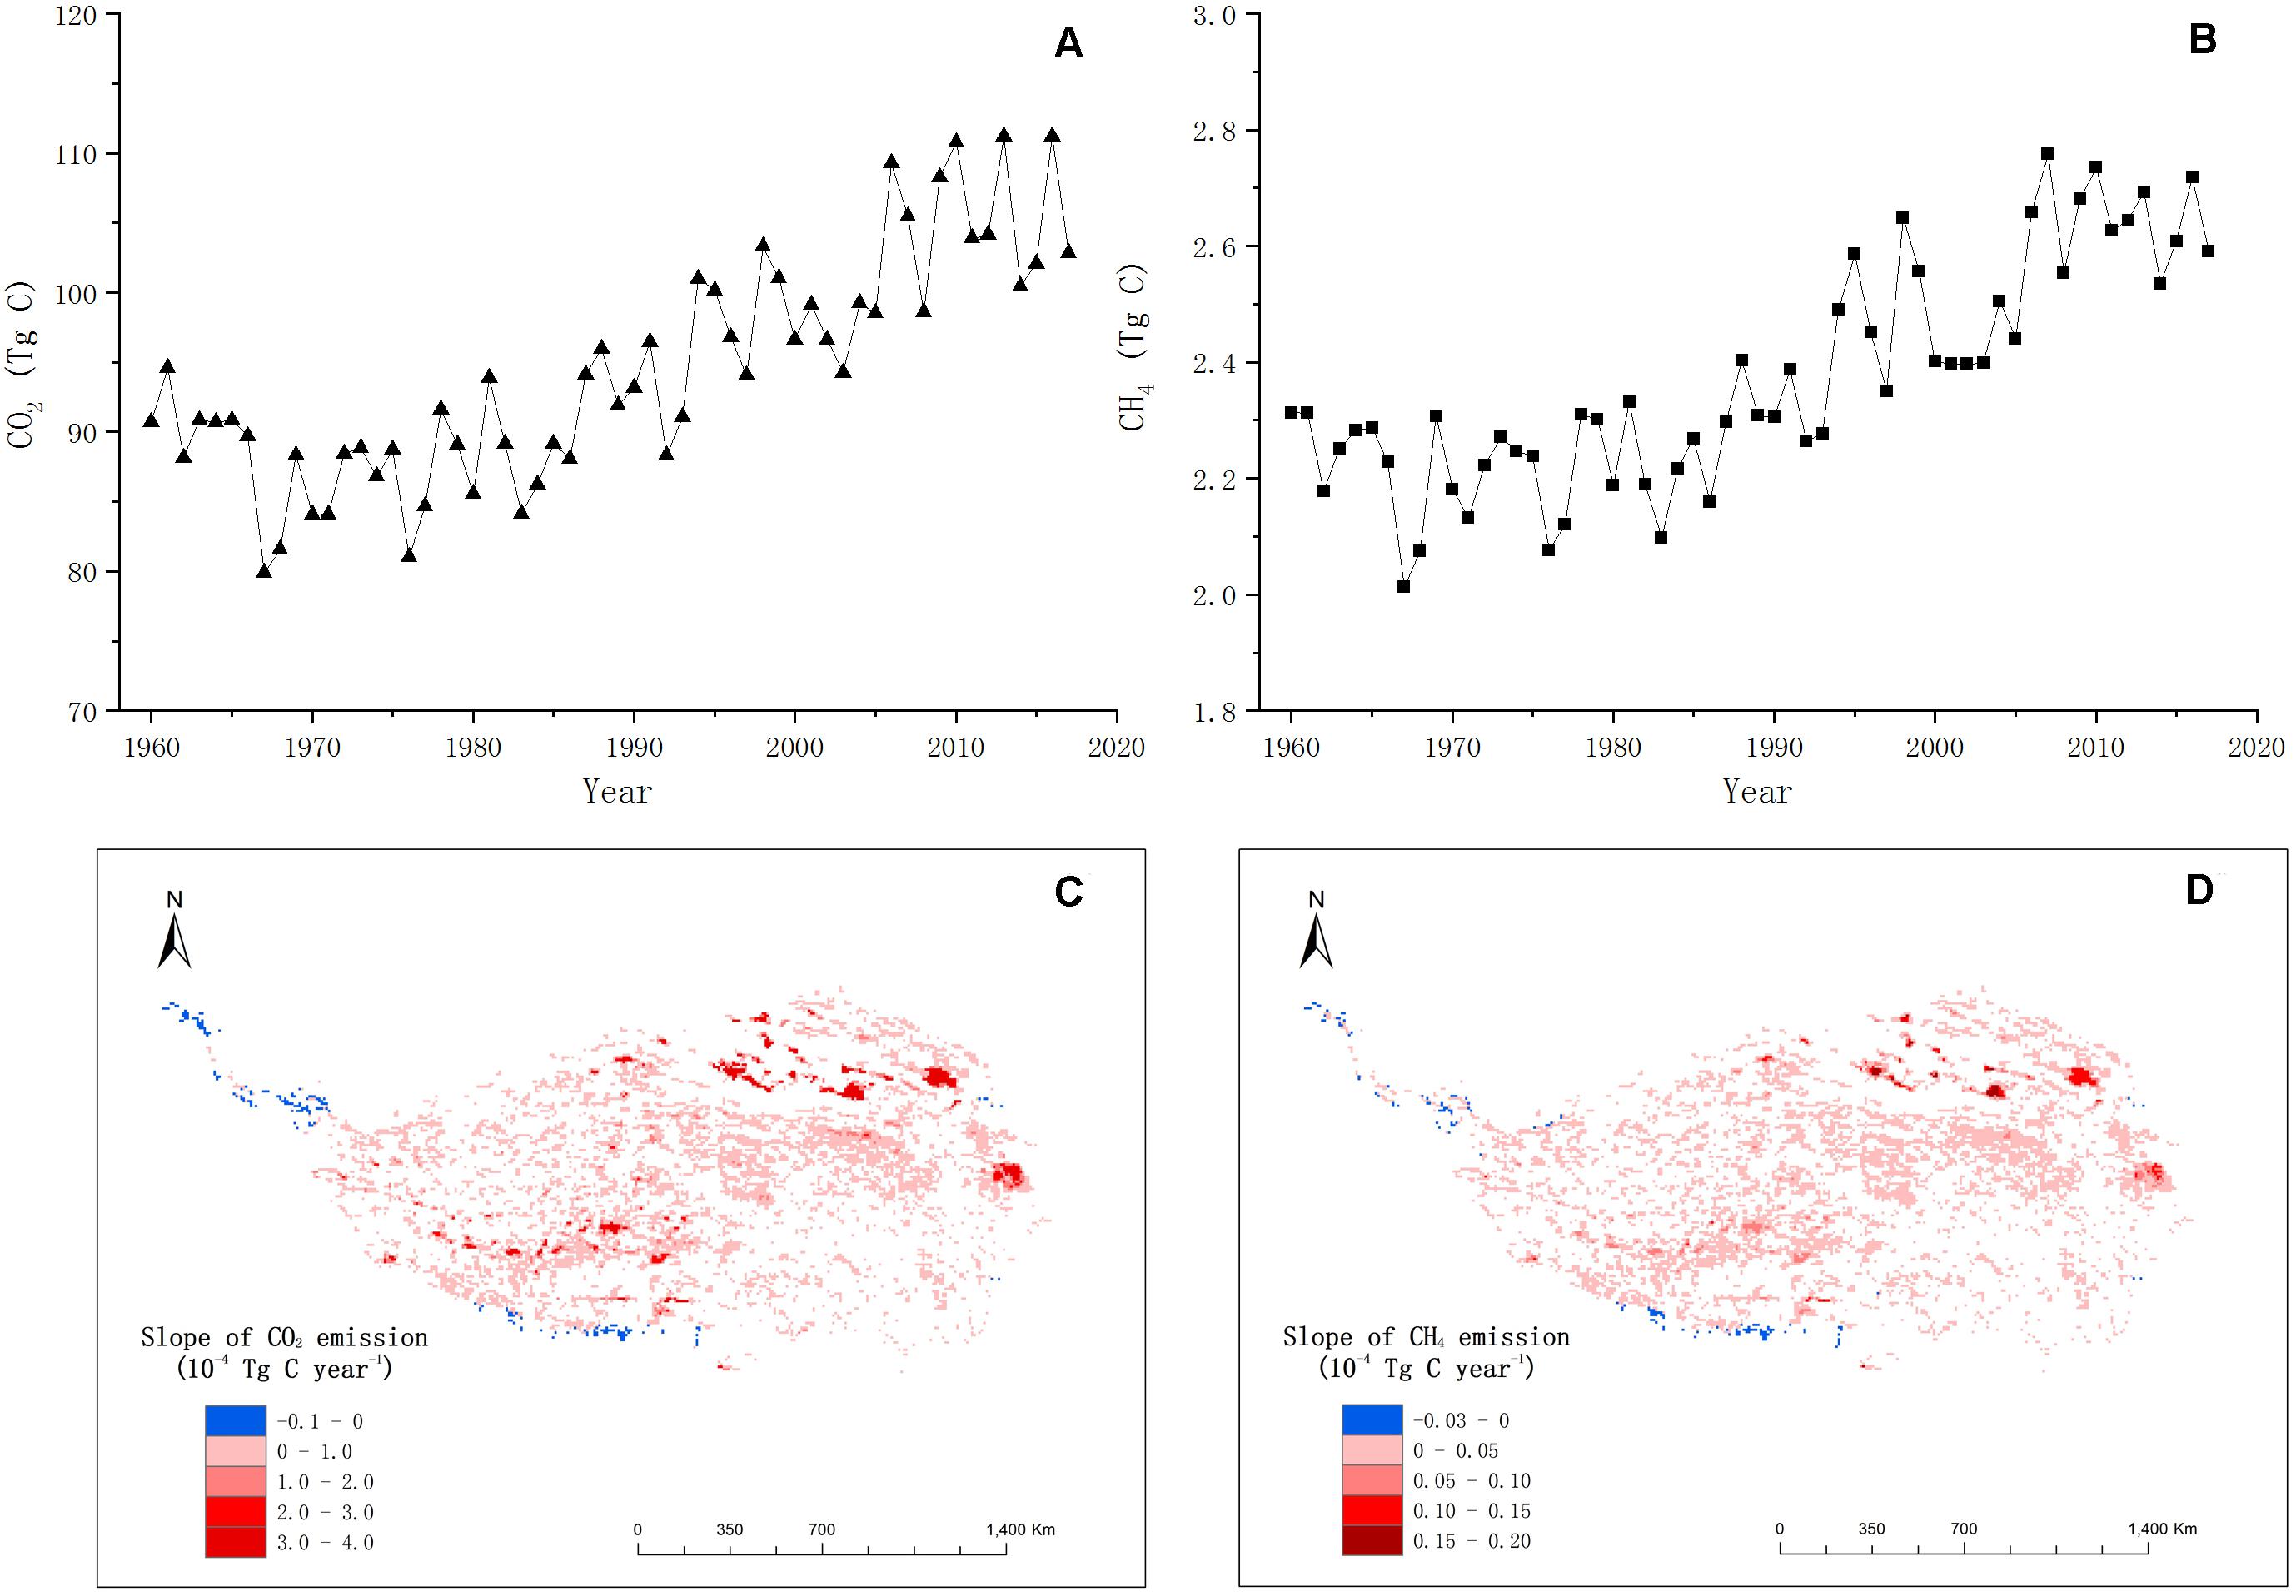
Figure 6. Regional greenhouse gas emissions of wetlands on the Qinghai-Tibetan Plateau from 1960 to 2017. Annual CO2 (A) and CH4 (B) emissions were extrapolated by growing and non-growing seasonal models from the Eddy covariance method. Spatial distribution of (C) CO2 and (D) CH4 emission trends of wetlands on the Qinghai-Tibetan Plateau from 1960 to 2017. Linear regression and the line of best fit were calculated for each grid cell, and the slope of each cell is shown.
The GWP was applied to determine the relative and total contributions of CO2 and CH4 to the greenhouse effect. CH4 values were converted to CO2-equivalents based on published calculations (Kandel et al., 2019). From 1960 to 2017, the CO2 emissions contributed the largest amount to carbon balance and dominated the atmospheric GHGs balance on the wetlands of the QTP. The CO2 contributed approximately four times more than CH4 to the GHGs balance on QTP wetlands (Figure 7A). The ratio of CH4 to CO2 emissions across all wetlands of the QTP has slightly declined in the past 57 years, despite significant increases in emissions of both gases (Figure 7B).
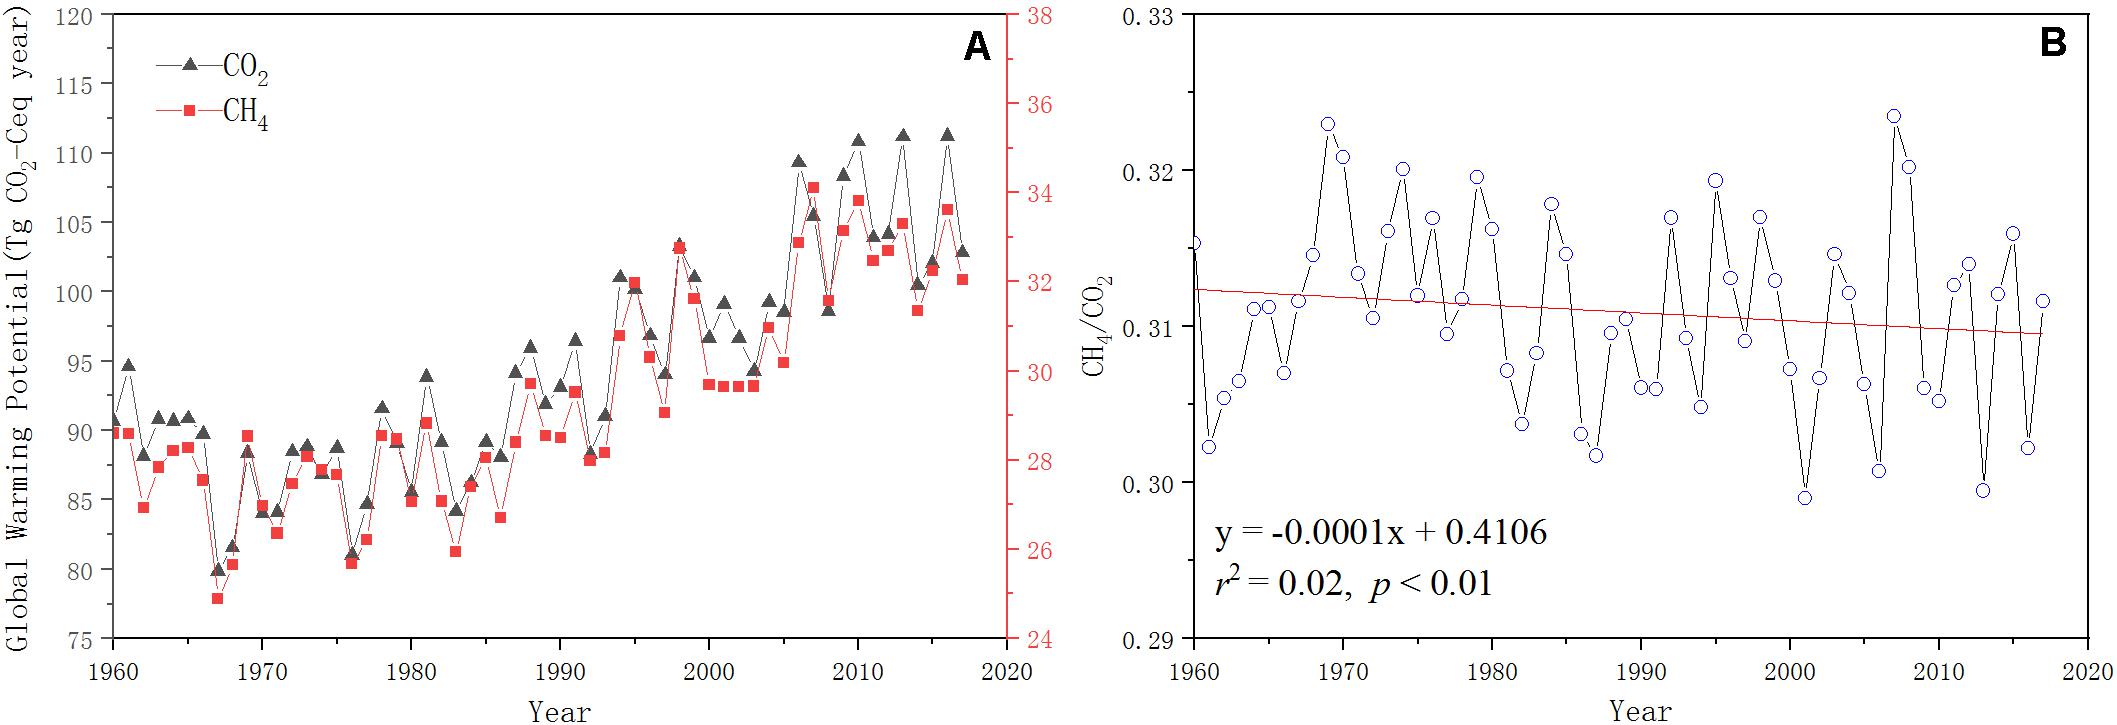
Figure 7. Interannual variation in global warming potential based on CO2 and CH4 emissions from the Qinghai-Tibetan Plateau wetlands for the period 1960–2017. (A) CH4 and CO2 expressed as CO2-C equivalents according to global warming potential (CH4:28 and CO2:1) (Kandel et al., 2019). (B) Ratio of extrapolated CH4–CO2 emissions over time.
Discussion
Relationships Between GHGs Fluxes and Soil Temperatures in situ
The wetland ecosystem of QTP is an important natural emitter of GHGs. The CO2 and CH4 fluxes showed similar seasonal emission patterns, with the greatest emissions noted during the plant growing season (Chen et al., 2013b; Liu et al., 2017). In this study, the CO2 and CH4 emissions were positively related to soil temperature, as reported for other wetlands (Zhao et al., 2006; Marin-Muniz et al., 2015).
The effects of soil temperature on CO2 fluxes depend strongly on the availability of oxygen within the soil (Bonnett et al., 2013; Gao et al., 2013). Oxygen is an important factor that regulates organic matter decomposition in soil and the release of CO2 (Bonnett et al., 2013; Treat et al., 2014; Liu et al., 2017). During the non-growing season on the QTP wetlands, the soil temperature was below freezing, which may inhibit the transport of oxygen from the soil to the rhizosphere zone, resulting in low CO2 flux. Furthermore, soil temperature may also indirectly affect CO2 fluxes by influencing rates of substrate supply, transport, and chemical reactions, which ultimately affect the release of CO2 from wetland soil (Treat et al., 2014; Wei and Wang, 2016).
CH4 emissions depend on anaerobic (production) and aerobic (oxidation) processes (Liu et al., 2017; Wei and Wang, 2017). Wetlands provide good anaerobic environments, and higher temperatures can promote activity of microbes such as methanogens. Both factors significantly increase CH4 production in soil (Inglett et al., 2012). Furthermore, changes in soil temperature can also stimulate CH4 transport from soil into the atmosphere (Yvon-Durocher et al., 2011). This transport slows in winter when soil temperature drops and CH4 becomes trapped under a layer of ice, allowing only a small portion to be oxidized. As ice thaws during the following growing season, the stored CH4 gas is released into the atmosphere. This cycle may partly explain the large CH4 emission from the QTP wetlands during warm seasons. Thus, CH4 emission appears to depend strongly on seasonal changes in the local environment, especially the influence of soil temperature on gas exchange.
Uncertainties in Extrapolation of GHGs Emission Rates of Study Site
With wetland soil temperatures and regression equations, we extrapolated the CO2 and CH4 emission rates of the study site. At different time scales, the GHGs emission rates extrapolated using static chamber measured data had higher uncertain than using EC measured data. The GHGs emission rates extrapolated by EC method were consistent under both time scales (Figure 4).
Measurement methods might result in the difference of estimated emission rates. The carbon balance of wetlands located in high latitude regions is strongly related to microtopography (Sullivan et al., 2008; Li et al., 2017). Although the wetland’s topography and ecosystem appear to be flat and homogeneous, there is a significant amount of spatial heterogeneity at finer scales (a small chamber) or larger scales (the sample site). GHGs fluxes measured with the static chamber method cover only small patches of soil, which are usually not sufficient to make a full-scale understanding of the carbon exchanges of the heterogeneous ecosystems (Song et al., 2015). The EC method measured the carbon exchange between the atmosphere and ecosystems over a large area. Neglecting the effect of spatial heterogeneity might lead to the difference of GHGs emission rate that resulted in larger variance during extrapolation (Li et al., 2017). In addition, the static chamber method introduces so-called “chamber effects,” potentially including modifications of temperature and moisture within the chamber as well as changes in the gas diffusion gradient within the soil profile (Song et al., 2015). The EC method, for its part, is susceptible to intermittent turbulence exchanges, commonly occurring at night, which reduce data quality (Gu et al., 2005; Aubinet et al., 2012; Yu et al., 2017). These limitations may also lead to uncertainties in extrapolated data.
The uncertainties of extrapolated emission rate resulted from the differences of regression models at different timescales. There were linear or non-linear correlations between soil temperature and GHGs fluxes in wetlands in previous studies (Kato et al., 2005; Liu et al., 2013; Song et al., 2015; Yu et al., 2017). Soil temperature has proven to be one of the most important factors affecting GHGs emission, but hydrology, plants, and soil microorganism also have an impact (Bhullar et al., 2013; Marin-Muniz et al., 2015). Particularly in wetlands, GHGs emissions are affected by many complex ecological processes, such as soil carbon and nitrogen cycling and root respiration (Baldock et al., 2012; Liu et al., 2013). All these factors are subject to seasonal and temperature-related changes. For example, during the plant non-growing season, plants begin wilting and gradually lose their ability to transport gas via stomata, and the upper soil and water layers freeze. These seasonal changes alter soil temperature and, consequently, the emission of GHGs (Song et al., 2015). This difference may also reflect the influence of fluctuations in soil temperature and water level. The water level not only limits the oxygen concentration but also influences soil temperature by controlling thermal conductivity (Yu et al., 2017). During the plant growing season, abundant precipitation influences both soil thermal and hydrological conditions, including water table depth, soil temperature and thawing depth. Heat is carried to deeper layers of soil by infiltration, rather than by thermal conduction, due to the low thermal conductance of the wetland and the high efficiency of water infiltration. This heat increases the soil temperature, promoting the thawing of the bottom permafrost. Thus, the rising temperature due to climate change and rising water level due to increased precipitation likely stimulate GHGs emission from wetlands beyond what would occur due to increases in either soil temperature or water level alone (Song et al., 2015). This may explain why, in the present study, the different correlations between soil temperature and the GHGs emission rate were found in different timescales.
Uncertainties in Regional Extrapolation of GHGs Emissions of Wetlands on the QTP
For the whole QTP, we extrapolated regional GHGs emissions from permanent wetlands by the seasonal model calculated EC method. The regional CO2 emission was higher than the ranges reported in the literature, but the CH4 emission fell within the ranges of previous studies. The uncertainties of estimation may result from inaccuracies in the wetland area. Jin reported the earliest estimates of CH4 emissions ranging from 0.53 to 0.68 Tg C year–1, based on observations (Jin et al., 1999). Wei made a challenge estimation of CH4 emissions by integrating a biogeochemical model, which considered the wetland extents, and suggested that previous studies might have underestimated CH4 emissions, due to bias in wetland extents (Wei and Wang, 2016). Currently, the wetland area on the QTP ranges from 1.2 to 18.8 × 10⁴ km2 (Jin et al., 1999; Niu et al., 2009, 2012; Zhang et al., 2020). A large discrepancy of wetland extent products largely affects estimations of GHGs emissions from natural wetland (Wei and Wang, 2016). Thus, improving the ability to obtain accurate data on the distribution and extent of wetlands should be a research priority in the future (Li et al., 2016). In addition, the spatial dataset of soil temperature was obtained by the spatial interpolation method, and its uncertainty might also lead to differences of estimated the total GHGs emissions from wetlands on the QTP. Therefore, the impact of these factors should be taken into account when estimating the GHGs emissions from the QTP wetlands, which will improve our understanding of the role of natural wetlands in the GHGs budget.
Spatial Distribution and GWP of GHGs Emissions of Wetlands on the QTP
Since the 1960s, the QTP has experienced universal and significant warming, heating up by 0.2–0.5°C per decade (Piao et al., 2010; Chen et al., 2013b). Projections of the Inter-governmental Panel on Climate Change showed that this warming trend will continue (IPCC, 2013). It is highly likely this will set up a positive feedback loop in the wetlands, in which warmer climate drives release of more GHGs, which in turn will raise the temperature (Song et al., 2015). Although the absolute amounts of CH4 emitted are small compared to the amounts of CO2, CH4 contributes 28 times more than CO2 to the atmospheric absorption of infrared radiation (Kandel et al., 2019). Previous studies have shown that CO2 fluxes may mitigate the impact of CH4 fluxes (Whiting and Chanton, 2001; Mitsch et al., 2013). The ratio of CH4 fluxes to CO2 fluxes may serve as an important index for an ecosystem’s GHGs exchange balance with the atmosphere (Whiting and Chanton, 2001; Malone et al., 2013). For the entire wetlands of the QTP, the CO2 emissions dominated the carbon balance in the wetland ecosystem and the GHGs balance in the atmosphere. We calculated a declining ratio of CH4 to CO2 for the period 1960–2017, indicating that CO2 has become the main contributor to total GHGs fluxes. Thus, without human interference, the GHGs exchange balance should remain relatively constant on the wetlands of the QTP in the future.
Conclusion
The alpine wetland ecosystem in the QTP is an important source of GHGs. GHGs emissions vary exponentially with soil temperature. The CO2 dominates the GHGs balance on QTP wetlands. Extrapolating GHGs fluxes from local to regional levels involves substantial uncertainties that depend on the measurement technique, timescale and wetlands extent. These parameters should be taken into consideration to ensure accurate estimation of GHGs fluxes in future research.
Data Availability Statement
Monthly CO2 and CH4 flux data and soil temperature data presented in this article will be archived and freely available from figshare, doi: 10.6084/m9.figshare.12703121.v3.
Author Contributions
QZ conceived and designed research. JZ, XL, ZY, and LJ collected data and conducted research. JZ and MY wrote the initial manuscript. HC, CP, MW, and PZ revised the manuscript. All authors read and approved the final manuscript.
Funding
This study was financially supported by the Second Tibetan Plateau Scientific Expedition (2019QZKK0304), the National Natural Science Foundation of China (41571081), the Fundamental Research Funds for the Central Universities (2019B04714), the National Key R&D Program of China (2016YFC0501804).
Conflict of Interest
The authors declare that the research was conducted in the absence of any commercial or financial relationships that could be construed as a potential conflict of interest.
Footnotes
References
Aubinet, M., Vesala, T., and Papale, D. (2012). Eddy Covariance: A Practical Guide to Measurement and Data Analysis. Berlin: Springer, 365–376. doi: 10.1007/978-94-007-2351-1
Baldock, J. A., Wheeler, I., McKenzie, N., and McBrateny, A. (2012). Soils and climate change: potential impacts on carbon stocks and greenhouse gas emissions, and future research for Australian agriculture. Crop Pasture Sci. 63, 269–283. doi: 10.1071/CP11170
Bhullar, G., Iravani, M., Edwards, P., and Olde Venterink, H. (2013). Methane transport and emissions from soil as affected by water table and vascular plants. BMC Ecol. 13:32. doi: 10.1186/1472-6785-13-32
Boden, T. A., Marland, G., and Andres, R. J. (2011). Global, Regional, and National Fossil-Fuel CO2 Emissions. Bethel, PA: Carbon Dioxide Information Analysis Center.
Bonnett, S. A. F., Blackwell, M. S. A., Leah, R., Cook, V., O’Connor, M., and Maltby, E. (2013). Temperature response of denitrification rate and greenhouse gas production in agricultural river marginal wetland soils. Geobiology 11, 252–267. doi: 10.1111/gbi.12032
Bridgham, S., Cadillo-Quiroz, H., Keller, J., and Zhuang, Q. (2012). Methane emissions from wetlands: biogeochemical, microbial, and modeling perspectives from local to global scales. Glob. Change Biol. 19, 1325–1346. doi: 10.1111/gcb.12131
Cao, S., Cao, G., Feng, Q., Han, G., Lin, Y., Yuan, J., et al. (2017). Alpine wetland ecosystem carbon sink and its controls at the Qinghai Lake. Environ. Earth Sci. 76, 210. doi: 10.1007/s12665-017-6529-5
Chen, H., Wu, N., Wang, Y., Zhu, D., Zhu, Q., Yang, G., et al. (2013a). Inter-Annual variations of methane emission from an open fen on the qinghai-tibetan plateau: a three-year study. PLoS One 8:e53878. doi: 10.1371/journal.pone.0053878
Chen, H., Zhu, Q., Peng, C., Wu, N., Wang, Y., Fang, X., et al. (2013b). The impacts of climate change and human activities on biogeochemical cycles on the Qinghai-Tibetan Plateau. Glob. Change Biol. 19, 2940–2955. doi: 10.1111/gcb.12277
Chen, H., Zhu, Q., Peng, C., Wu, N., Wang, Y., Fang, X., et al. (2013c). Methane emissions from rice paddies natural wetlands, and lakes in China: synthesis and new estimate. Glob. Change Biol. 19, 19–32. doi: 10.1111/gcb.12034
Chen, J., Chen, J., Liao, A., Cao, X., Chen, L., Chen, X., et al. (2014). Global land cover mapping at 30 m resolution: a POK-based operational approach. ISPRS J. Photogramm. Remote Sens. 103, 7–27. doi: 10.1016/j.isprsjprs.2014.09.002
Costanza, R., d’Arge, R., de Groot, R., Farber, S., Grasso, M., Hannon, B., et al. (1997). The value of the world‘s ecosystem services and natural capital. Nature 387, 253–260. doi: 10.1038/387253a0
Cui, X., Liang, J., Lu, W., Chen, H., Liu, F., Lin, G., et al. (2018). Stronger ecosystem carbon sequestration potential of mangrove wetlands with respect to terrestrial forests in subtropical China. Agric. For. Meteorol. 249, 71–80. doi: 10.1016/j.agrformet.2017.11.019
Ding, W., Cai, Z., and Wang, D. (2004). Preliminary budget of methane emissions from natural wetlands in China. Atmos. Environ. 38, 751–759. doi: 10.1016/j.atmosenv.2003.10.016
Engelhardt, K., and Ritchie, M. (2001). Effect of Macrophyte Species Richness on Wetland Ecosystem Functioning and Services. Nature 411, 687–689. doi: 10.1038/35079573
Foken, T., Göockede, M., Mauder, M., Mahrt, L., Amiro, B., and Munger, W. (2004). “Post-field data quality control,” in Handbook of Micrometeorology. Atmospheric and Oceanographic Sciences Library, eds X. Lee, W. Massman, and B. Law, vol. 29 (Dordrecht: Springer), doi: 10.1007/1-4020-2265-4_9
Gao, J., Li, X.-L., Cheng, A., and Yang, Y.-W. (2013). Degradation of wetlands on the qinghai-tibet plateau:a comparison of the effectiveness of three indicators. J. Mount. Sci. 10, 658–667. doi: 10.1007/s11629-013-2562-3
Gao, J.-Q., Ouyang, H., Xu, X.-L., Zhou, C.-P., and Zhang, F. (2009). Effects of temperature and water saturation on CO2 production and nitrogen mineralization in alpine wetland soils. Pedosphere 19, 71–77. doi: 10.1016/S1002-0160(08)60085-5
Gu, L., Falge, E., Boden, T., Baldocchi, D., Black, T. A., Saleska, S., et al. (2005). Objective threshold determination for nighttime eddy flux filtering. Agric. For. Meteorol. 128, 179–197. doi: 10.1016/j.agrformet.2004.11.006
Hao, Y., Cui, X., Wang, Y., Mei, X., Kang, X., Wu, N., et al. (2011). Predominance of precipitation and temperature controls on ecosystem CO2 Exchange in Zoige Alpine Wetlands of Southwest China. Wetlands 31, 413–422. doi: 10.1007/s13157-011-0151-1
Hirota, M., Tang, Y., Hu, Q., Hirata, S., Kato, T., Kishimoto-Mo, A., et al. (2004). Methane emissions from different vegetation zones in a Qinghai-Tibetan Plateau wetland. Soil Bio. Biochem. 36, 737–748. doi: 10.1016/j.soilbio.2003.12.009
Inglett, K. S., Inglett, P. W., Reddy, K. R., and Osborne, T. Z. (2012). Temperature sensitivity of greenhouse gas production in wetland soils of different vegetation. Biogeochemistry 108, 77–90. doi: 10.1007/s10533-011-9573-3
IPCC (2013). “Climate Change 2013: the physical science basis. contribution of working group i to the fifth assessment report of the intergovernmental panel on climate change,” in The Intergovernmental Panel on Climate Change, (Cambridge: Cambridge University Press).
Jin, H., Wu, J., Cheng, G., Nakano, T., and Sun, G. (1999). Methane emissions from wetlands on the Qinghai-Tibet Plateau. Chin. Scie. Bull. 44, 2282–2286. doi: 10.1007/BF02885940
Jin, Z., Zhuang, Q., He, J.-S., Zhu, X., and Song, W. (2015). Net exchanges of methane and carbon dioxide on the Qinghai-Tibetan Plateau from 1979 to 2100. Environ. Res. Lett. 10:085007. doi: 10.1088/1748-9326/10/8/085007
Kandel, T. P., Lærke, P. E., Hoffmann, C. C., and Elsgaard, L. (2019). Complete annual CO2, CH4, and N2O balance of a temperate riparian wetland 12 years after rewetting. Ecol. Eng. 127, 527–535. doi: 10.1016/j.ecoleng.2017.12.019
Kato, T., Hirota, M., Tang, Y., Cui, X., Li, Y., Zhao, X., et al. (2005). Strong temperature dependence and no moss photosynthesis in winter CO2 flux for a Kobresia meadow on the Qinghai-Tibetan plateau. Soil Biol. Biochem. 37, 1966–1969. doi: 10.1016/j.soilbio.2005.02.018
Kintisch, E., and Buckheit, K. (2006). Along the road from kyoto: global greenhouse gas emissions keep rising. Science 311, 1702–1703. doi: 10.1126/science.311.5768.1702
Lamers, L., Vile, M., Grootjans, A. P., Acreman, M., Diggelen, R., Evans, M., et al. (2014). Ecological restoration of rich fens in Europe and North America: from trial and error to an evidence-based approach. Biol. Rev. 90, 182–203. doi: 10.1111/brv.12102
Lehner, B., and Doell, P. (2004). Development and Validation of a Global Database of Lakes. Reservoirs and Wetlands. J. Hydrol. 296, 1–22. doi: 10.1016/j.jhydrol.2004.03.028
Lewis, W. M., and Ebrary, I. (1995). Wetlands : Characteristics and Boundaries. Wetlands Characteristics & Boundaries. Washington, DC: National Academy Press.
Li, G., Mu, J., Liu, Y., Smith, N., and Sun, S. (2017). Effect of microtopography on soil respiration in an alpine meadow of the Qinghai-Tibetan plateau. Plant Soil 421, 1–9. doi: 10.1007/s11104-017-3448-x
Li, T., Zhang, Q., Cheng, Z., Ma, Z., Liu, J., Luo, Y., et al. (2016). Modeling CH4 emissions from natural wetlands on the tibetan plateau over the past 60 years: influence of climate change and Wetland Loss. Atmosphere 7:90. doi: 10.3390/atmos7070090
Liu, L., Chen, H., Zhu, Q., Yang, G., Zhu, E., Hu, J., et al. (2016). Responses of peat carbon at different depths to simulated warming and oxidizing. Sci. Total Environ. 548-549, 429–440. doi: 10.1016/j.scitotenv.2015.11.149
Liu, X., Zhu, D., Zhan, W., Chen, H., Zhu, Q., Hao, Y., et al. (2019). Five-year measurements of net ecosystem CO2 exchange at a fen in the Zoige peatlands on the Qinghai-Tibetan Plateau. J. Geophys. Res. 124, 11803–11818. doi: 10.1029/2019JD031429
Liu, Y., Liu, G., Xiong, Z., and Liu, W. (2017). Response of of greenhouse gas emissions from three types of wetland soils to simulated temperature change on the Qinghai-Tibetan Plateau. Atmos. Environ. 171, 17–24. doi: 10.1016/j.atmosenv.2017.10.005
Liu, Y., Sheng, L., and Liu, J. (2015). Impact of wetland change on local climate in semi-arid zone of Northeast China. Chin. Geogr. Sci. 25, 309–320. doi: 10.1007/s11769-015-0735-4
Liu, Y., Wan, K.-Y., Tao, Y., Li, Z.-G., Zhang, G.-S., Li, S.-L., et al. (2013). Carbon dioxide flux from rice paddy soils in central china: effects of intermittent flooding and draining cycles. PLoS One 8:e56562. doi: 10.1371/journal.pone.0056562
Malone, S. L., Gregory, S., Staudhammer, C. L., and Ryan, M. G. (2013). Effects of simulated drought on the carbon balance of Everglades short-hydroperiod marsh. Glob. Change Biol. 19, 2511–2523. doi: 10.1111/gcb.12211
Marin-Muniz, J. L., Hernandez, M. E., and Moreno-Casasola, P. (2015). Greenhouse gas emissions from coastal freshwater wetlands in veracruz mexico: effect of plant community and seasonal dynamics. Atmos. Environ. 107, 107–117. doi: 10.1016/j.atmosenv.2015.02.036
Mitsch, W. J., Nahlik, A. M., Mander, Ü, Zhang, L., Anderson, C. J., Jørgensen, S. E., et al. (2013). Wetlands, carbon, and climate change. Landsc. Ecol. 28, 583–597. doi: 10.1007/s10980-012-9758-8
Niu, Z., Gong, P., Cheng, X., Guo, J., Wang, L., Huang, H., et al. (2009). Geographical characteristics of China’s wetlands derived from remotely sensed data. Sci. China Ser. D 52, 723–738. doi: 10.1007/s11430-009-0075-2
Niu, Z., Zhang, H., Wang, X., Yao, W., Zhou, D., Zhao, K., et al. (2012). Mapping wetland changes in China between 1978 and 2008. Chin. Sci. Bull. 57, 2813–2823. doi: 10.1007/s11434-012-5093-3
Piao, S., Ciais, P., Huang, Y., Shen, Z., Peng, S., Li, J., et al. (2010). The impacts of climate change on water resources and agriculture in China. Nature 467, 43–51. doi: 10.1038/nature09364
R Core Team (2020). R: A Language and Environment for Statistical Computing. Vienna: R Foundation for Statistical Computing.
Song, W. M., Wang, H., Wang, G. S., Chen, L. T., Jin, Z. N., Zhuang, Q. L., et al. (2015). Methane emissions from an alpine wetland on the Tibetan Plateau: neglected but vital contribution of the nongrowing season. J. Geophys. Res. Biogeosci. 120, 1475–1490. doi: 10.1002/2015JG003043
Sullivan, P., Arens, S., Chimner, R., and Welker, J. (2008). Temperature and microtopography interact to control carbon cycling in a high arctic fen. Ecosystems 11, 61–76. doi: 10.1007/s10021-007-9107-y
Tang, Y., Wan, S., He, J., and Zhao, X. (2009). Foreword to the special issue: looking into the impacts of global warming from the roof of the world. J. Plant Ecol. 2, 169–171. doi: 10.1093/jpe/rtp026
Treat, C. C., Wollheim, W. M., Varner, R. K., Grandy, A. S., Talbot, J., and Frolking, S. (2014). Temperature and peat type control CO2 and CH4 production in Alaskan permafrost peats. Glob. Change Biol. 20, 2674–2686. doi: 10.1111/gcb.12572
Wang, J., Zhu, Q., Yang, Y., Zhang, X., Zhang, J., Yuan, M., et al. (2020). High uncertainties detected in the wetlands distribution of the Qinghai–Tibet Plateau based on multisource data. Landsc. Ecol. Eng. 16, 47–61. doi: 10.1007/s11355-019-00402-w
Wei, D., and Wang, X. (2016). CH4 exchanges of the natural ecosystems in China during the past three decades: the role of wetland extent and its dynamics. J. Geophys. Res. 121, 2445–2463. doi: 10.1002/2016jg003418
Wei, D., and Wang, X. (2017). Uncertainty and dynamics of natural wetland CH4 release in China. Atmos. Environ. 154, 95–105. doi: 10.1016/j.atmosenv.2017.01.038
Wei, D., Xu, R., Tarchen, T., Dai, D., Wang, Y., and Wang, Y. (2015). Revisiting the role of CH4 emissions from alpine wetlands on the Tibetan Plateau: evidence from two in situ measurements at 4758 and 4320 m above sea level. J. Geophys. Res. 120, 1741–1750. doi: 10.1002/2015jg002974
Whiting, G. J., and Chanton, J. P. (2001). Greenhouse carbon balance of wetlands: methane emission versus carbon sequestration. Tellus B 53, 521–528. doi: 10.3402/tellusb.v53i5.16628
Xu, K., Kong, C., Liu, J., and Wu, Y. (2010). “Using methane dynamic model to estimate methane emission from natural wetlands in China,” in 2010 18th International Conference on Geoinformatics, Beijing, 1–4.
Yang, G., Chen, H., Wu, N., Tian, J., Peng, C., Zhu, Q., et al. (2014). Effects of soil warming, rainfall reduction and water table level on CH4 emissions from the Zoige peatland in China. Soil Biol. Biochem. 78, 83–89. doi: 10.1016/j.soilbio.2014.07.013
Yu, X., Song, C., Li, S., Wang, X., Shi, F., Qian, C., et al. (2017). Growing season methane emissions from a permafrost peatland of northeast China: observations using open-path eddy covariance method. Atmos. Environ. 153, 135–149. doi: 10.1016/j.atmosenv.2017.01.026
Yvon-Durocher, G., Montoya, J., Woodward, G., Jones, J., and Trimmer, M. (2011). Warming increases the proportion of primary production emitted as methane from freshwater mesocosms. Glob. Change Biol. 17, 1225–1234. doi: 10.1111/j.1365-2486.2010.02289.x
Zeng, M., Zhu, C., Song, Y., Ma, C., and Yang, Z. (2017). Paleoenvironment change and its impact on carbon and nitrogen accumulation in the Zoige wetland, northeastern Qinghai–Tibetan Plateau over the past 14,000 years. Geochem. Geophys. Geosyst. 18, 1775–1792. doi: 10.1002/2016GC006718
Zhang, X., Zhu, Q., Yang, B., Chen, H., and Peng, C. (2020). Evaluating patterns of wetland emission in Qinghai-Tibet plateau based on process model. Acta Ecol. Sin. 40, 3060–3071. doi: 10.5846/stxb201904240838
Zhao, L., Li, Y., Xu, S., Zhou, H., Gu, S., Yu, G., et al. (2006). Diurnal, seasonal and annual variation in net ecosystem CO2 exchange of an alpine shrubland on Qinghai-Tibetan plateau. Glob. Change Biol. 12, 1940–1953. doi: 10.1111/j.1365-2486.2006.01197
Zhong, Q., Chen, H., Liu, L., He, Y., Zhu, D., Jiang, L., et al. (2017). Water table drawdown shapes the depth-dependent variations in prokaryotic diversity and structure in Zoige peatlands. FEMS Microbiol. Ecol. 93:fix049. doi: 10.1093/femsec/fix049
Keywords: climate change, wetlands, greenhouse gas, carbon fluxes, global warming potential
Citation: Zhang J, Zhu Q, Yuan M, Liu X, Chen H, Peng C, Wang M, Yang Z, Jiang L and Zhao P (2020) Extrapolation and Uncertainty Evaluation of Carbon Dioxide and Methane Emissions in the Qinghai-Tibetan Plateau Wetlands Since the 1960s. Front. Earth Sci. 8:361. doi: 10.3389/feart.2020.00361
Received: 30 April 2020; Accepted: 04 August 2020;
Published: 25 August 2020.
Edited by:
Matthias Peichl, Swedish University of Agricultural Sciences, SwedenReviewed by:
Xudong Zhu, Xiamen University, ChinaGil Bohrer, The Ohio State University, United States
Copyright © 2020 Zhang, Zhu, Yuan, Liu, Chen, Peng, Wang, Yang, Jiang and Zhao. This is an open-access article distributed under the terms of the Creative Commons Attribution License (CC BY). The use, distribution or reproduction in other forums is permitted, provided the original author(s) and the copyright owner(s) are credited and that the original publication in this journal is cited, in accordance with accepted academic practice. No use, distribution or reproduction is permitted which does not comply with these terms.
*Correspondence: Qiuan Zhu, zhuq@hhu.edu.cn; Pengxiang Zhao, zhaopengxiang@nwafu.edu.cn