the Creative Commons Attribution 4.0 License.
the Creative Commons Attribution 4.0 License.
 | 25 Aug 2020
Rainfall and rockfalls in the Canary Islands: assessing a seasonal link
Massimo Melillo
Stefano Luigi Gariano
Silvia Peruccacci
Roberto Sarro
Rosa Marìa Mateos
Maria Teresa Brunetti
Rockfalls are frequent and harmful phenomena occurring in mountain ranges, coastal cliffs, and slope cuts. Although several natural processes occur in their formation and triggering, rainfall is one of the most common causes. The prediction of rock failures is of social significance for civil protection purposes and can rely on the statistical analysis of past rainfall conditions that caused the failures. The paper describes the analysis of information on rainfall-induced rockfalls in Gran Canaria and Tenerife, Canary Islands (Spain). An analysis of the monthly rainfall versus the monthly distribution of rockfalls reveals that they are correlated for most of the year, except in summer, when other triggers act to induce collapses. National and regional catalogs with hourly and daily rainfall measurements are used to reconstruct the cumulated amount (E) and the duration (D) of the rainfall responsible for the rock failures. Adopting a consolidated statistical approach, new ED rainfall thresholds for possible rockfall occurrence and the associated uncertainties are calculated for the two test sites. As far as is known, this is the first attempt to predict this type of failure using the threshold approach. Using the rainfall information, a map of the mean annual rainfall is obtained for Gran Canaria and Tenerife, and it is used to assess the differences between the thresholds. The results of this study are expected to improve the ability to forecast rockfalls in the Canary Islands in view of implementing an early-warning system to mitigate the rockfall hazard and reduce the associated risk.


Rockfalls are instability processes affecting mountainous regions, coastal cliffs, and slope cuts. Being very rapid, they are extremely dangerous and life-threatening, especially when they occur in populated areas and along roads and railways. The most frequent triggering factors of rockfalls are rainfall, cycling thermal stress, and seismic activity (Wieczorek and Jaeger, 1996; Keefer, 2002; Mateos, 2016; Ansari et al., 2015; Collins and Stock, 2016; Contino et al., 2017; Sarro et al., 2018; Saroglou, 2019; González de Vallejo et al., 2020). At regional and global scales, empirical approaches to forecasting the occurrence of rockfalls may contribute to reducing risk. Generally, for rainfall-induced slope failures the forecast can rely upon the definition of rainfall thresholds, i.e., the rainfall conditions that, when reached or exceeded, are likely to trigger the failure. Rainfall thresholds are calculated through the statistical analysis of historical rainfall conditions that have resulted in landslides (e.g., Guzzetti et al., 2007, 2008; Cepeda et al. 2010; Sengupta et al., 2010; Ruiz-Villanueva et al., 2011; Berti et al., 2012; Staley et al., 2013; Zêzere et al., 2015; Palenzuela et al., 2016; Rosi et al., 2016; Peruccacci et al., 2017; Segoni et al., 2018; Valenzuela et al., 2018, 2019). The definition of reliable empirical rainfall thresholds relies on the use of objective procedures for (i) the reconstruction of the rainfall events responsible for the failures and (ii) the calculation of the thresholds. For this purpose, Melillo et al. (2018) have proposed an algorithm that reconstructs rainfall events, identifies the rainfall conditions that have resulted in slope failures, and calculates probabilistic cumulated event rainfall–rainfall duration (ED) thresholds at different nonexceeding probabilities and their associated uncertainties (Peruccacci et al., 2012). The obtained thresholds are a set of parallel power law curves in a log–log (duration D, cumulated amount E) plane, which are characterized by a slope and an intercept, the last being a function of the nonexceeding probability value (Brunetti et al., 2010).
In this work, a relationship between the amount of rainfall and the occurrence of rockfalls is assessed, and empirical rainfall thresholds are defined for two test sites in Gran Canaria and Tenerife, Canary Islands (Spain). The possible prediction of rainfall-induced rock failures is of fundamental importance primarily for the safety of the inhabitants and for preserving infrastructures such as roads and buildings. An increasing level of safety against this type of hazard is also important for the local economy, one-third of which is based on tourism. As far as is known, this is the first attempt to predict rock failures triggered by rain using the threshold approach. Recently, it has been observed in Italy that the slope of the power law curve is dependent on the mean annual rainfall (MAR). In particular, the higher the MAR is, the steeper the threshold (Peruccacci et al., 2017). This relationship is explained assuming that, where the landscape has been shaped over long time periods by landslides triggered by a given minimum amount of rainfall, at least as much rainfall is likely necessary to trigger the next landslides (Chen, 2015). For improving the discussion of the results, it has been considered worthwhile to produce a map of the MAR for the islands of Gran Canaria and Tenerife using the available rainfall datasets.
The paper is organized as follows. After a description in Sect. 2 of the general settings of the two test sites, Sect. 3 describes the rainfall and rockfall datasets as well as the methods used to determine ED rainfall thresholds and the map of the MAR. Section 4 illustrates in detail the relationship between the rainfall regime and the occurrence of rock failures and presents the rainfall thresholds for the possible rockfall occurrence at the two test sites. Finally, in Sect. 5, the main findings of the work are summarized and discussed.
The Canary Islands (Spain) are one of the major volcanic chains in the oceans. The archipelago consists of eight islands in the Atlantic Ocean, aligned along a W–SW to E–NE direction: El Hierro, La Palma, La Gomera, Tenerife, Gran Canaria, Fuerteventura, La Graciosa, and Lanzarote. The geological origin of the Canary archipelago (800 km in length) is still under debate, but it has been traditionally interpreted as a hotspot track (Fullea et al., 2015).
The steep topography and the geological complexity of the archipelago influence the activation of intense slope failure activity. Rockfalls are the most frequent landslide type in the Canary Islands, causing damage to built-up areas and communication networks.
Two test sites are selected for assessing the relationship between the rainfall and the occurrence of rockfalls. The first site (GC) is located in the northwestern part of Gran Canaria island, and the second site (TEN) is the entire Tenerife island (Fig. 1).
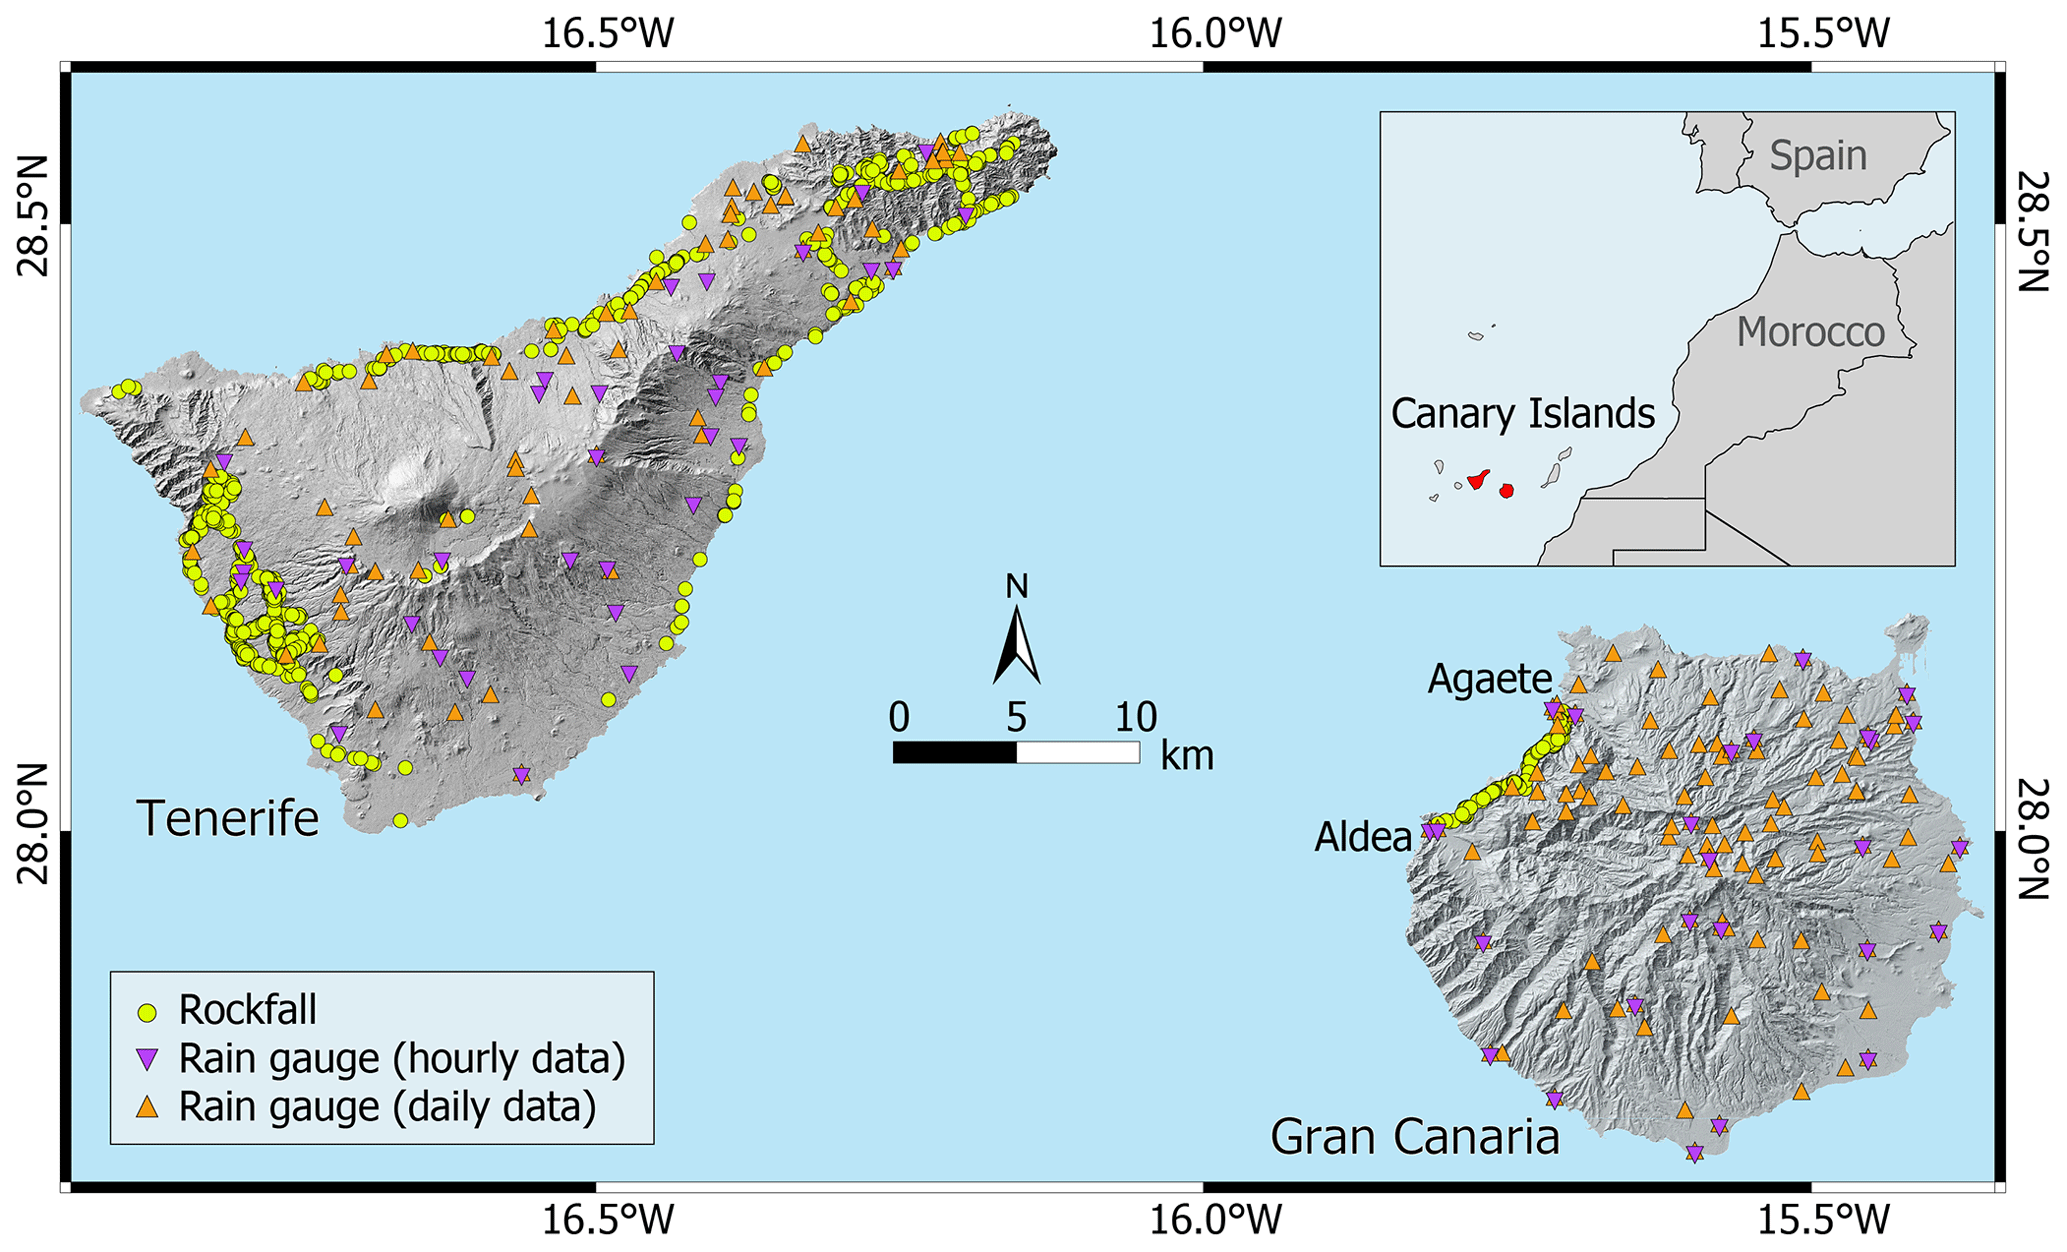
Figure 1GC and TEN test sites. Location of the rain gauges providing hourly (purple triangles) and daily (orange triangles) rainfall measurements and of rockfalls used for threshold calculations (light green dots). Hillshade derived from MDT05 2009 CC-BY 4.0 scne.es.
2.1 Gran Canaria island (GC-200 road)
Gran Canaria is the third-largest island of the Canary archipelago. With an area of 1560 km2 and a maximum altitude of 1956 m a.s.l., the island is approximately circular in shape (Fig. 1). The origin of Gran Canaria can be dated to about 15 million years ago (Miocene), with the first submarine building stages of the Gran Canaria volcano. From a geological point of view, the island presents the greatest variability of igneous rocks of the entire archipelago. Besides the distinctive lavas of the basanite basalt to trachyte phonolite series, Gran Canaria also presents other types of magma, such as tholeiitic basalts and rhyolites (Troll and Carracedo, 2016). Massive flank failures and erosion make space for chaotic deposits that cover large areas.
The test site is the GC-200 road located in the northwestern extreme of Gran Canaria, specifically between the localities of Agaete and Aldea. The road constitutes the main transportation corridor between the two localities. With a length of 34 km, the road path is very tortuous following the contour of the coast, a very step coastline with some of the highest cliffs in Europe. The road has heavy traffic, estimated on average at 1500 vehicles per day. The geology of the test site area is within the domain of the basaltic shield stage, Middle Miocene in age. Along the road, an alternance of alkaline basaltic deposits and pyroclastic flows can be observed. In some parts, gravitational deposits (mainly colluvial) also outcrop covering wide areas.
Regarding climatological conditions, Gran Canaria is located in a transitional zone between temperate and tropical conditions. The conical morphology of Gran Canaria retains the humidity of the predominant N–NE trade winds of the subtropical Azores anticyclone on the north side of the island. As a result, the northern flanks are humid, and vegetation is vigorous, while the south part of the island is very dry, and the conditions are very arid and desert-like. Annual rainfall ranges between 100 and 900 mm on average, increasing with altitude. At the test site the climate is very dry, with low average annual rainfall (<100 mm) and high average annual temperature (∼20 ∘C).
2.2 Tenerife island
Tenerife (Fig. 1) is the largest (2057 km2) and the most populated (950 000 inhabitants and 13.2 million visitors in 2019) island of the archipelago. It is home to the third-largest volcano in the world (Pico del Teide, 3718 m a.s.l.).
From a geological point of view, Tenerife was constructed via Miocene–Pliocene shields that now form the vertices of the island. The shields were unified into a single edifice by later volcanism that continued in central Tenerife from approximately 12 to 8 million years ago and was followed by a period of dormancy. Rejuvenation at approximately 3.5 Ma is recorded by the central Las Cañadas volcano, and long residence times of magmas during this period favored magmatic differentiation processes to produce an episode of felsic and highly explosive felsic volcanism (Troll and Carracedo, 2016).
The steep orography of the island and the climate variety have resulted in a diversity of landscapes and geographical formations. Very impressive coastal cliffs (up to 500 m in height) are present in the northern corner of Tenerife. This area is also characterized by narrow and deep ravines which determine intense slope activity.
The climate of Tenerife is subtropical oceanic; the minimum and maximum annual average temperatures are about 15 ∘C in winter and 24 ∘C in summer. Similarly to Gran Canaria, annual rainfall ranges between 100 and 900 mm. Tenerife offers a large variety of microclimate zones controlled by the altitude and the winds.
The availability of rainfall measurements and landslide information is fundamental to define reliable rainfall thresholds. For the selection of the rain gauges, the data quality and the location of the rain gauges are assessed given that these features are crucial to characterize the spatiotemporal variation in the precipitation. Similarly, the calculation of the MAR relies on the availability of sufficiently long rainfall series (at least 30 years). This is difficult to achieve for a dense network of rain gauges, where sensors may exhibit different operating time periods. The World Meteorological Organization (WMO) guidelines on the calculation of the annual standard normal, specifically the MAR, recommend at least 10 years to define at least provisional MAR maps (WMO, 1989). This is the case at the test sites, where a lot of rainfall information is limited to short time periods (the average is 15.6 years), thus hampering the calculation of the MAR with a detailed space resolution.
3.1 Rainfall data
At the GC test site, hourly rainfall data (purple triangles in Fig. 1) from the Spanish National Meteorological Service (AEMET) network (in total 25 stations, among which 4 are close to the study area) are used for the calculation of rainfall thresholds. Moreover, daily rainfall data (orange triangles in Fig. 1) are provided from the Consejo Insular de Aguas de Gran Canaria (CIAGC) regional rain gauge network (13 stations) and from AEMET (92 stations, among which 7 are close to the study area). Some of the sensors of the AEMET network provide both hourly and daily rainfall in different time periods. Details of the rainfall series are reported in Table 1.
Table 1Summary of the three available rain gauge networks (CIAGC, AEMET, SIAR) at the two test sites (GC and TEN), i.e., network name, network operating time period, temporal resolution, test site, number of rain gauges used, their average operating time, and the use of data.

For the TEN test site, rainfall measurements are provided by AEMET, with contributions from regional networks. As for the GC test site, the rainfall analysis is performed using both hourly and daily data. The two networks at the TEN test site are composed of 34 rain gauges recording hourly data (purple triangles in Fig. 1) and 66 rain gauges recording daily data (orange triangles in Fig. 1).
To calculate the MAR for the two test sites, yearly and monthly rainfall data provided by AEMET and by Sistema de Información Agroclimático y de Regadíos (SIAR), respectively, are used (Table 1). In particular, in order to obtain homogeneous maps, data recorded in the 20-year period from January 2000 to December 2019 at both test sites are selected. Following WMO guidelines (WMO, 1989), only stations with at least 10 years of data are included in the analysis. Overall, 72 (1 every 22 km2) and 67 (1 every 31 km2) rain gauges are used to calculate MAR in Gran Canaria and Tenerife, respectively. The average number of sensors operating per year in the considered period is 56 (84 %; 1 every 28 km2) in Grand Canaria and 47 (65 %; 1 every 43 km2) in Tenerife. The rain gauges used are homogeneously distributed over the test site areas.
Using the monthly and annual rainfall data recorded by the 103 rain gauges on the two islands, the MAR for the period 2000–2019 was calculated for each station. Moreover, the coefficient of variation in the MAR is calculated by dividing its standard deviation by the MAR. This coefficient represents the variability of the MAR in the considered time interval. The map of the MAR and of its coefficient of variation are calculated using the tension spline tool in ESRI ArcMAP 10.7.1.
3.2 Rockfall data
The information on the rockfalls was collected by the Road Maintenance Service at the GC test site and by the Canarian Civil Protection Authorities at the TEN test site. After a rockfall occurrence, quick action is required by local authorities to remove boulders from road and to repair the damage. The average response time for these emergencies is down to 1 d, and therefore the date of the rockfall occurrence is the same as the road inspection. Figure 2 portrays an example of rockfalls that occurred at the GC and TEN test sites.
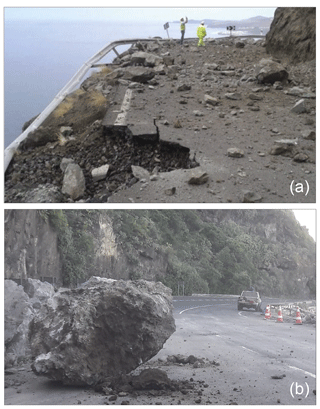
Figure 2Photos of rockfalls at the GC (a) and TEN (b) test sites (credits: R. M. Mateos and S. Leyva Campos).
For the GC test, site a total of 8174 rockfall events that occurred from January 2010 to March 2016 were documented. A catalog was prepared that accurately defined the location of each impact along the road using orthophotos available for the region and technical reports. The information for each event includes kilometer point, number of events, date, and boulder size. In GC only 535 rockfalls characterized by medium to large size are included in the analysis for the thresholds, whereas small and very small rockfalls ( m3) are discarded. Analogously, a catalog of 1898 rockfalls that impacted along Tenerife roads from January 2010 to November 2017 was prepared. For each event, the information includes rockfall localization; geographic accuracy; day, month, year, and time of occurrence (if available); and temporal accuracy.
The influence of the rainfall on the occurrence of rockfalls is assessed analyzing the distribution of monthly rainfall (Fig. 3a and b) and monthly number of rockfalls (Fig. 3c and d) at the two test sites. As expected, an increase in the rainfall in the autumn–winter period, between October and March, is observed on both islands, with a maximum in November.

Figure 3Comparison between monthly rainfall and rockfall occurrence. (a, b) Annual variation in monthly rainfall measures in GC (cyan) and TEN (gray). The whiskers show 1.5 times the interquartile range. (c, d) Number of rockfalls per month in the two test sites.
The monthly distribution of rockfalls in Gran Canaria (Fig. 3c) is coherent with the rainfall values in the period January–April, with a maximum in February (∼130; Fig. 3a). For the remaining dry (May to September) and wet (October to December) months, the number of rock failures decreases and becomes almost flat (below 50). This behavior suggests the presence of triggering mechanisms other than the rainfall. For the TEN test site, the number of rockfalls per month (Fig. 3b) is similar to the rainfall distribution, confirming the presence of one or more additional triggers as evidenced by the abundance of failures between May and September (Fig. 3d), when the rainfall is irrelevant.
3.3 Empirical rainfall thresholds
Empirical ED thresholds are represented by the following power law curve:
where E is the cumulated rainfall event (in millimeters); D is the duration of the rainfall event (in hours or in days), α and γ are the intercept and the slope of the curve, respectively; and Δα and Δγ are the uncertainties associated with them. Thresholds at different nonexceedance probabilities are calculated adopting the frequentist approach and the bootstrap nonparametric statistical technique (Brunetti et al., 2010; Peruccacci et al., 2012) and using 5000 randomly selected synthetic series of DE pairs. A threshold at 5 % nonexceedance probability should leave 5 % of the empirical DE pairs below itself. The parameter uncertainties depend mostly on the number and the distribution of the rainfall conditions. The minimum number of DE pairs needed for having stable mean values of the parameters α and γ (i.e., reliable thresholds) depends on the distribution and dispersion of the empirical data points in the DE domain.
3.4 The CTRL-T algorithm for threshold calculation
The quantitative identification of the rainfall responsible for slope failures and the definition of reliable thresholds are fundamental steps towards a well-founded event prediction (Peruccacci et al., 2017; Melillo et al., 2018). The use of standardized procedures for the reconstruction of the rainfall conditions able to trigger past failures and for the definition of thresholds is necessary for enhancing the objectivity and reproducibility of the curves. The tool named CTRL-T (Calculation of Thresholds for Rainfall-induced Landslides – Tool) proposed by Melillo et al. (2018) is exploited to calculate ED thresholds for the two test sites. CTRL-T reconstructs rainfall events starting from continuous rainfall series. For each rockfall, the algorithm (1) automatically identifies the representative rain gauge, (2) identifies multiple (D,E) rainfall conditions responsible for the failure, and (3) selects among them the maximum-probability rainfall conditions (MPRCs). Then, analyzing the distribution of the MPRCs, it calculates probabilistic rainfall thresholds at different nonexceeding probabilities and their associated uncertainties. In order to avoid using wrong temporal information (i.e., incorrect dates for the occurrence of rockfalls) in the definition of the thresholds, the rainfall conditions with a delay longer than 48 h between the rainfall ending time and the rockfall occurrence are discarded.
Using CTRL-T, 82 rockfalls that occurred between 2012 and 2016 at the GC test site and 626 rockfalls that occurred between 2010 and 2016 at the TEN test site are selected (light green dots in Fig. 1). The remaining records are discarded due to the (1) absence of rainfall data in the period, including the collapse occurrence time; (2) absence of rain gauges within a buffer of 15 km radius, centered on the rockfall; and (3) lack of an evident correlation with the rainfall. The definition of rainfall thresholds relies only upon rainfall conditions that triggered the first failure in each event. As a consequence, numerous rockfalls (106, 39 % in GC and 271, 30 % in TEN) which occurred on the same date and in the same location and which are associated with the same rainfall event are discarded. In GC, among the remaining rockfalls, 53 are analyzed with daily and 29 with hourly rainfall data, respectively. The low number of rock failures associated with hourly based rain gauges is to be ascribed to the low density of the sensors in the area and precludes the definition of rainfall thresholds. In TEN, 245 rockfalls are reconstructed with hourly data and 381 with daily rainfall data. Note that for 83 failures it was possible to reconstruct the rainfall conditions using sensors from (D,E) rainfall conditions with different temporal resolutions; these sensors are used to define both hourly based and daily based rainfall thresholds.
A correlation between the rainfall and the observed failures is confirmed by the comparison between the monthly rainfall and the corresponding number of rockfalls both in GC and in TEN (Fig. 4). Figure 4a–c show the boxplots of cumulated monthly rainfall based on the data recorded in rain gauges used to reconstruct the rainfall responsible for rockfalls for the GC and TEN test sites. Inspection of these figures reveals that the rainfall pattern at the two test sites is typically Mediterranean, with a maximum in winter (but also in October and November) and a minimum in summer, with practically no rain in the warmest months. Analyzing data from seven daily based rain gauges in GC (GC-d), it turns out that the rainiest months are February and November, with an average rainfall of 52.2 and 55.7 mm, a maximum rainfall of 98.6 and 133.9 mm, and a median rainfall of 42.3 and 39.8 mm, respectively (Fig. 4a). A similar trend is found for Tenerife using both daily and hourly data. Data from 40 daily based rain gauges in TEN (TEN-d) are analyzed finding an average rainfall of 64.6 and 86.4 mm, a maximum rainfall of 183.5 and 183.6 mm, and a median rainfall of 56.1 and 93.2 mm for February and November, respectively (Fig. 4b). Data from 21 hourly based rain gauges in TEN (TEN-h) are analyzed finding an average rainfall of 88.8 and 82.0 mm, a maximum rainfall of 169.8 and 190.8 mm, and a median rainfall of 97.5 and 66.4 mm for February and November, respectively (Fig. 4c).
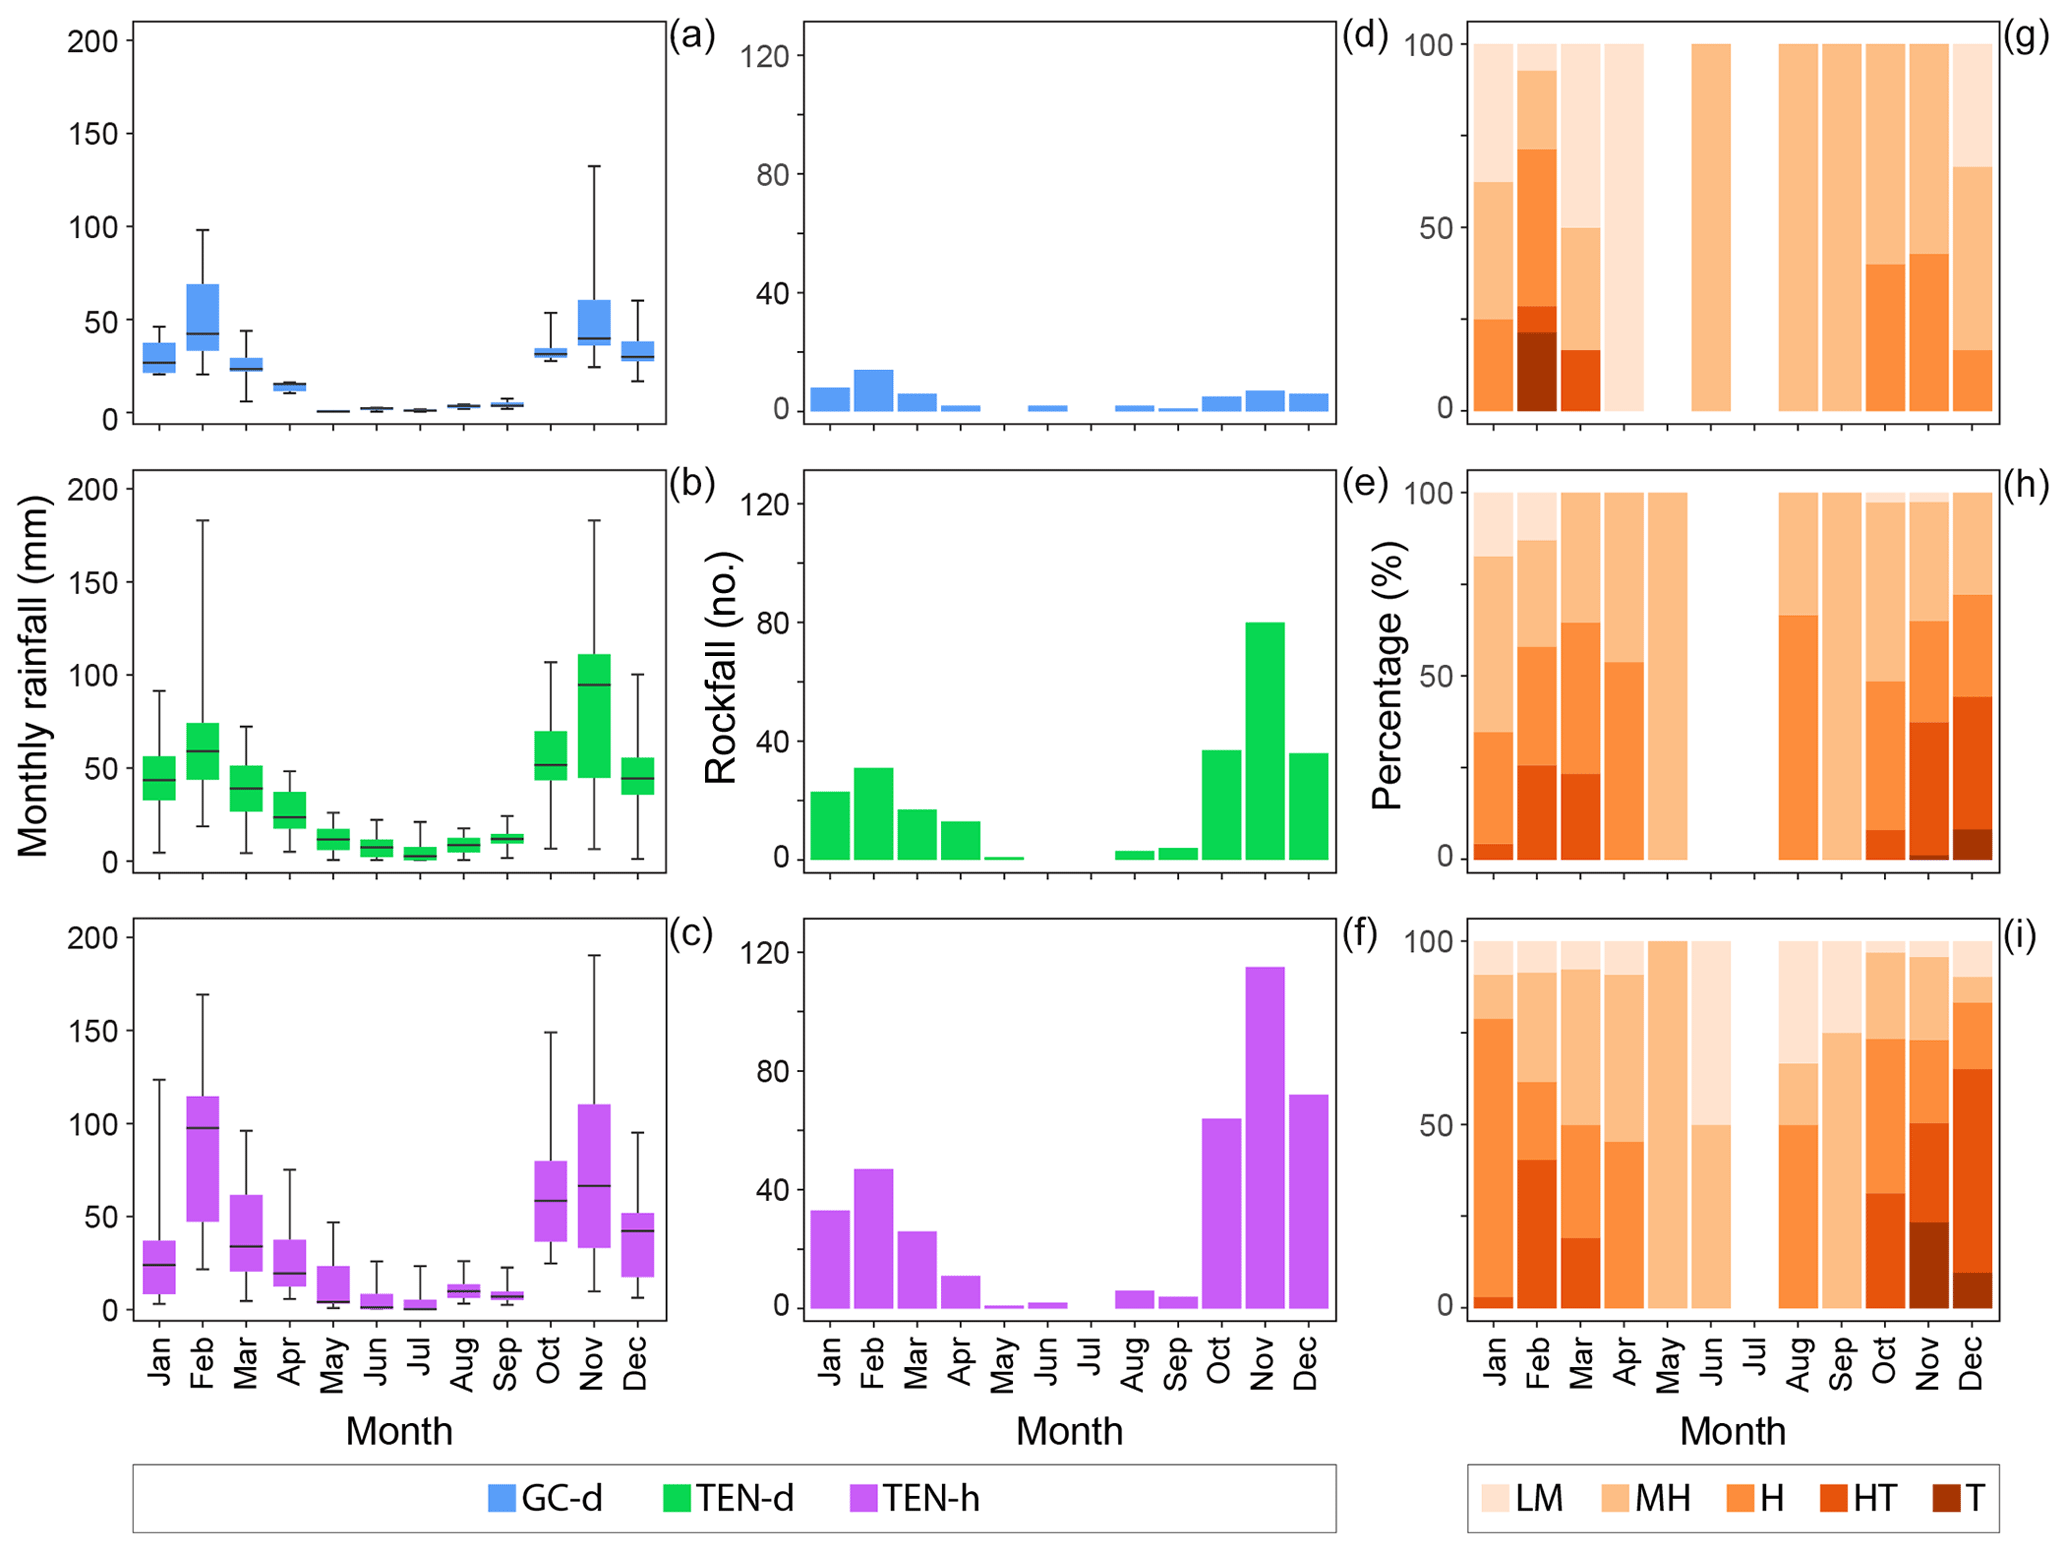
Figure 4Comparison between monthly rainfall and rainfall-induced rockfalls and Alpert classification. (a–c) Annual variation in monthly rainfall measures at the test sites. GC-d: daily rainfall data at the GC test site; TEN-d: daily rainfall data at the TEN test site; TEN-h: hourly rainfall data at the TEN test site. (d–f) Number of rainfall-induced rockfalls per month. (g–i) Cumulated percentage of rainfall events per month classified according to Alpert et al. (2002). LM: light-moderate ( mm); MH: moderate-heavy ( mm); H: heavy ( mm); HT: heavy-torrential ( mm); T: torrential (Ed>128 mm).
Figure 4d–f portray the monthly number of rockfalls associated with rainfall events for GC-d, TEN-d, and TEN-h. The GC catalog lists 53 collapses that occurred in the period from November 2012 to October 2016, with the majority of the failures in 2015 (22). The month with the largest number of rockfalls (14) is February, followed by January (8) and November (7). The lowest number of failures is reported in September (1), and no rainfall-induced rockfalls are reported in May and July (Fig. 4d). The 245 rock failures in the TEN-d catalog cover the period from September 2010 to February 2016, with the majority of records in 2014 (66). The month with the largest number of rockfalls (80) is November, followed by October (37) and December (36). The lowest number of failures is reported in May (1), and no rainfall-induced rockfalls are reported in June and July (Fig. 4e). The TEN-h catalog lists 381 rockfalls that occurred in the period from September 2010 to November 2016, with the majority of the failures in 2014 (90). The month with the largest number of rockfalls (115) is November, followed by December (72) and October (64). The lowest number of failures is reported in May (1), and no collapses are reported in July (Fig. 4f).
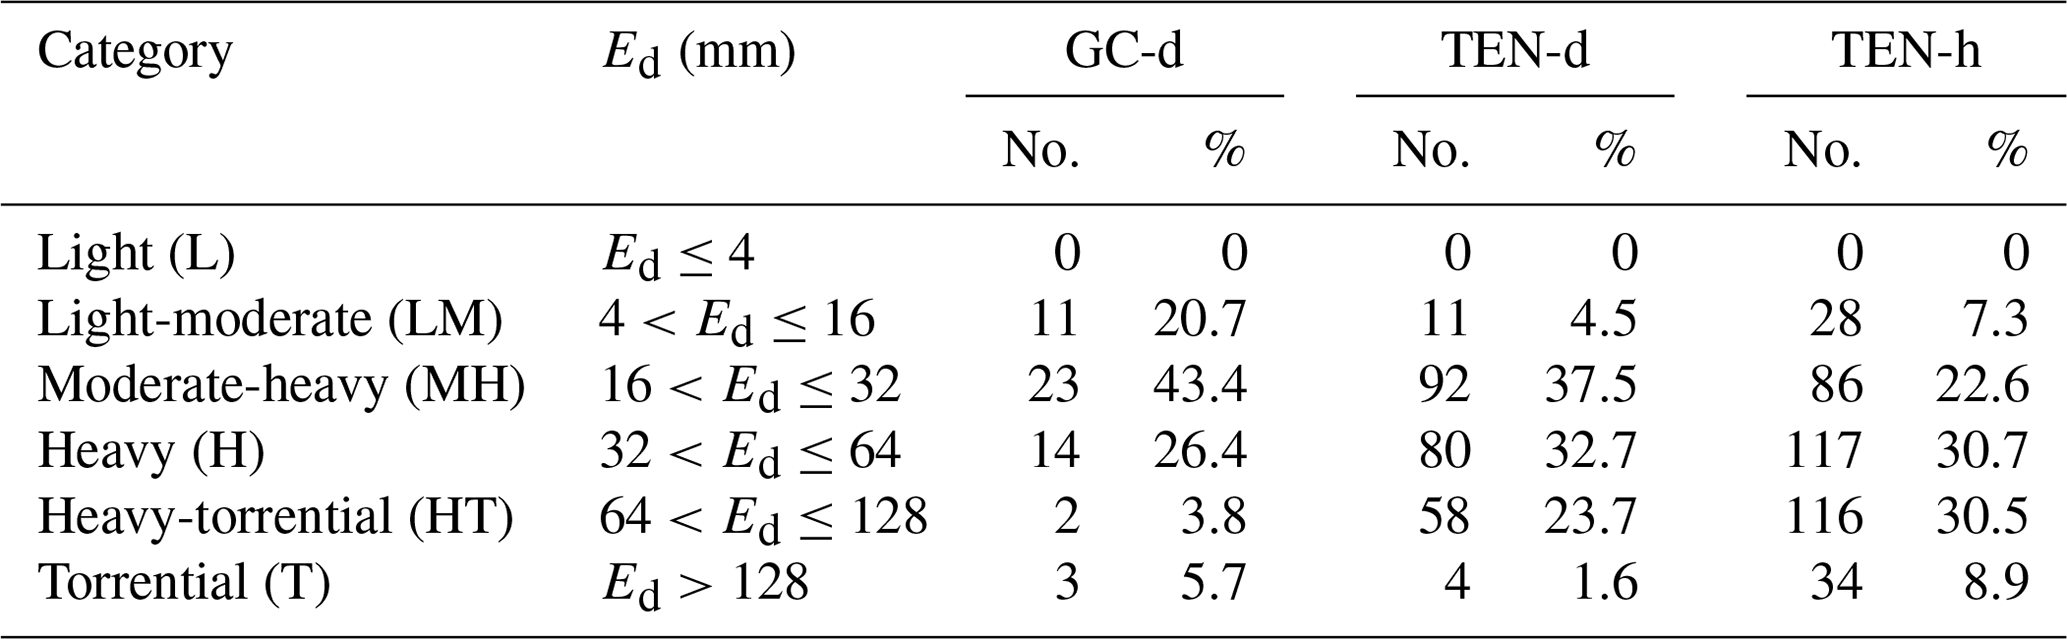
The rainfall that triggered the rockfalls is classified according to the method proposed by Alpert et al. (2002), based on six daily rainfall (Ed) categories from “light” (L) to “torrential” (T) over the Mediterranean (Table 2). Using the procedure adopted by Melillo et al. (2016), each rainfall condition (MPRC) responsible for rock failures is attributed to a specific category. In particular, for events lasting fewer than 24 h, a category based on the total cumulated rainfall of the event is assigned. For events lasting more than 24 h, the maximum value of the cumulated rainfall in 24 h in a moving window is used. In GC, over 40 % of the MPRCs responsible for the collapses are classified as moderate-high (MH); in TEN, approximately 30 % are classified as high (H) and high-torrential (HT). No MPRCs are found in the lowest Alpert's category (L; Table 2). Figure 4g–i show the cumulated percentage of rainfall events per month grouped according to Alpert's classification. In GC-d, in February, (Fig. 4g) 6 rockfalls (43 %) are triggered by a rainfall classified as H, 3 (21 %) as torrential (H), 3 (22 %) as MH, and 1 each as light-moderate (LM) and HT (14 %). In TEN-d, in November, 29 rockfalls (36 %) are triggered by a rainfall classified as HT, 26 (33 %) as MH, 22 (28 %) as H, 2 (2 %) as LM, and 1 (1 %) as T (Fig. 4h). In TEN-h, in November, 5 (4 %), 26 (23 %), 26 (23 %), 31 (27 %), and 27 (23 %) rockfalls are triggered by a rainfall classified as LM, MH, H, HT, and T, respectively (Fig. 4i).
Table 2Summary of the number (no.) and percentage (%) of MPRC in the categories proposed by Alpert et al. (2002) at the two test sites.
Using the catalogs of rainfall events with rockfalls described above and the CTRL-T tool, ED thresholds, and their associated uncertainties are calculated for the GC and TEN test sites. Table 3 lists the number of MPRCs used to define the thresholds, the equations of the power law curves, and the range of validity for the thresholds, expressed in hours or days. Note that D must be expressed in days in the equations for the thresholds calculated with daily data and in hours in the equations for the thresholds calculated with hourly data (Gariano et al., 2020).
Table 3ED rainfall thresholds at different nonexceedance probabilities (1 %, 5 %, 10 %, 20 %, 35 %, and 50 %) for the GC and TEN test sites. The number of MPRCs and the duration range of each threshold are also reported.
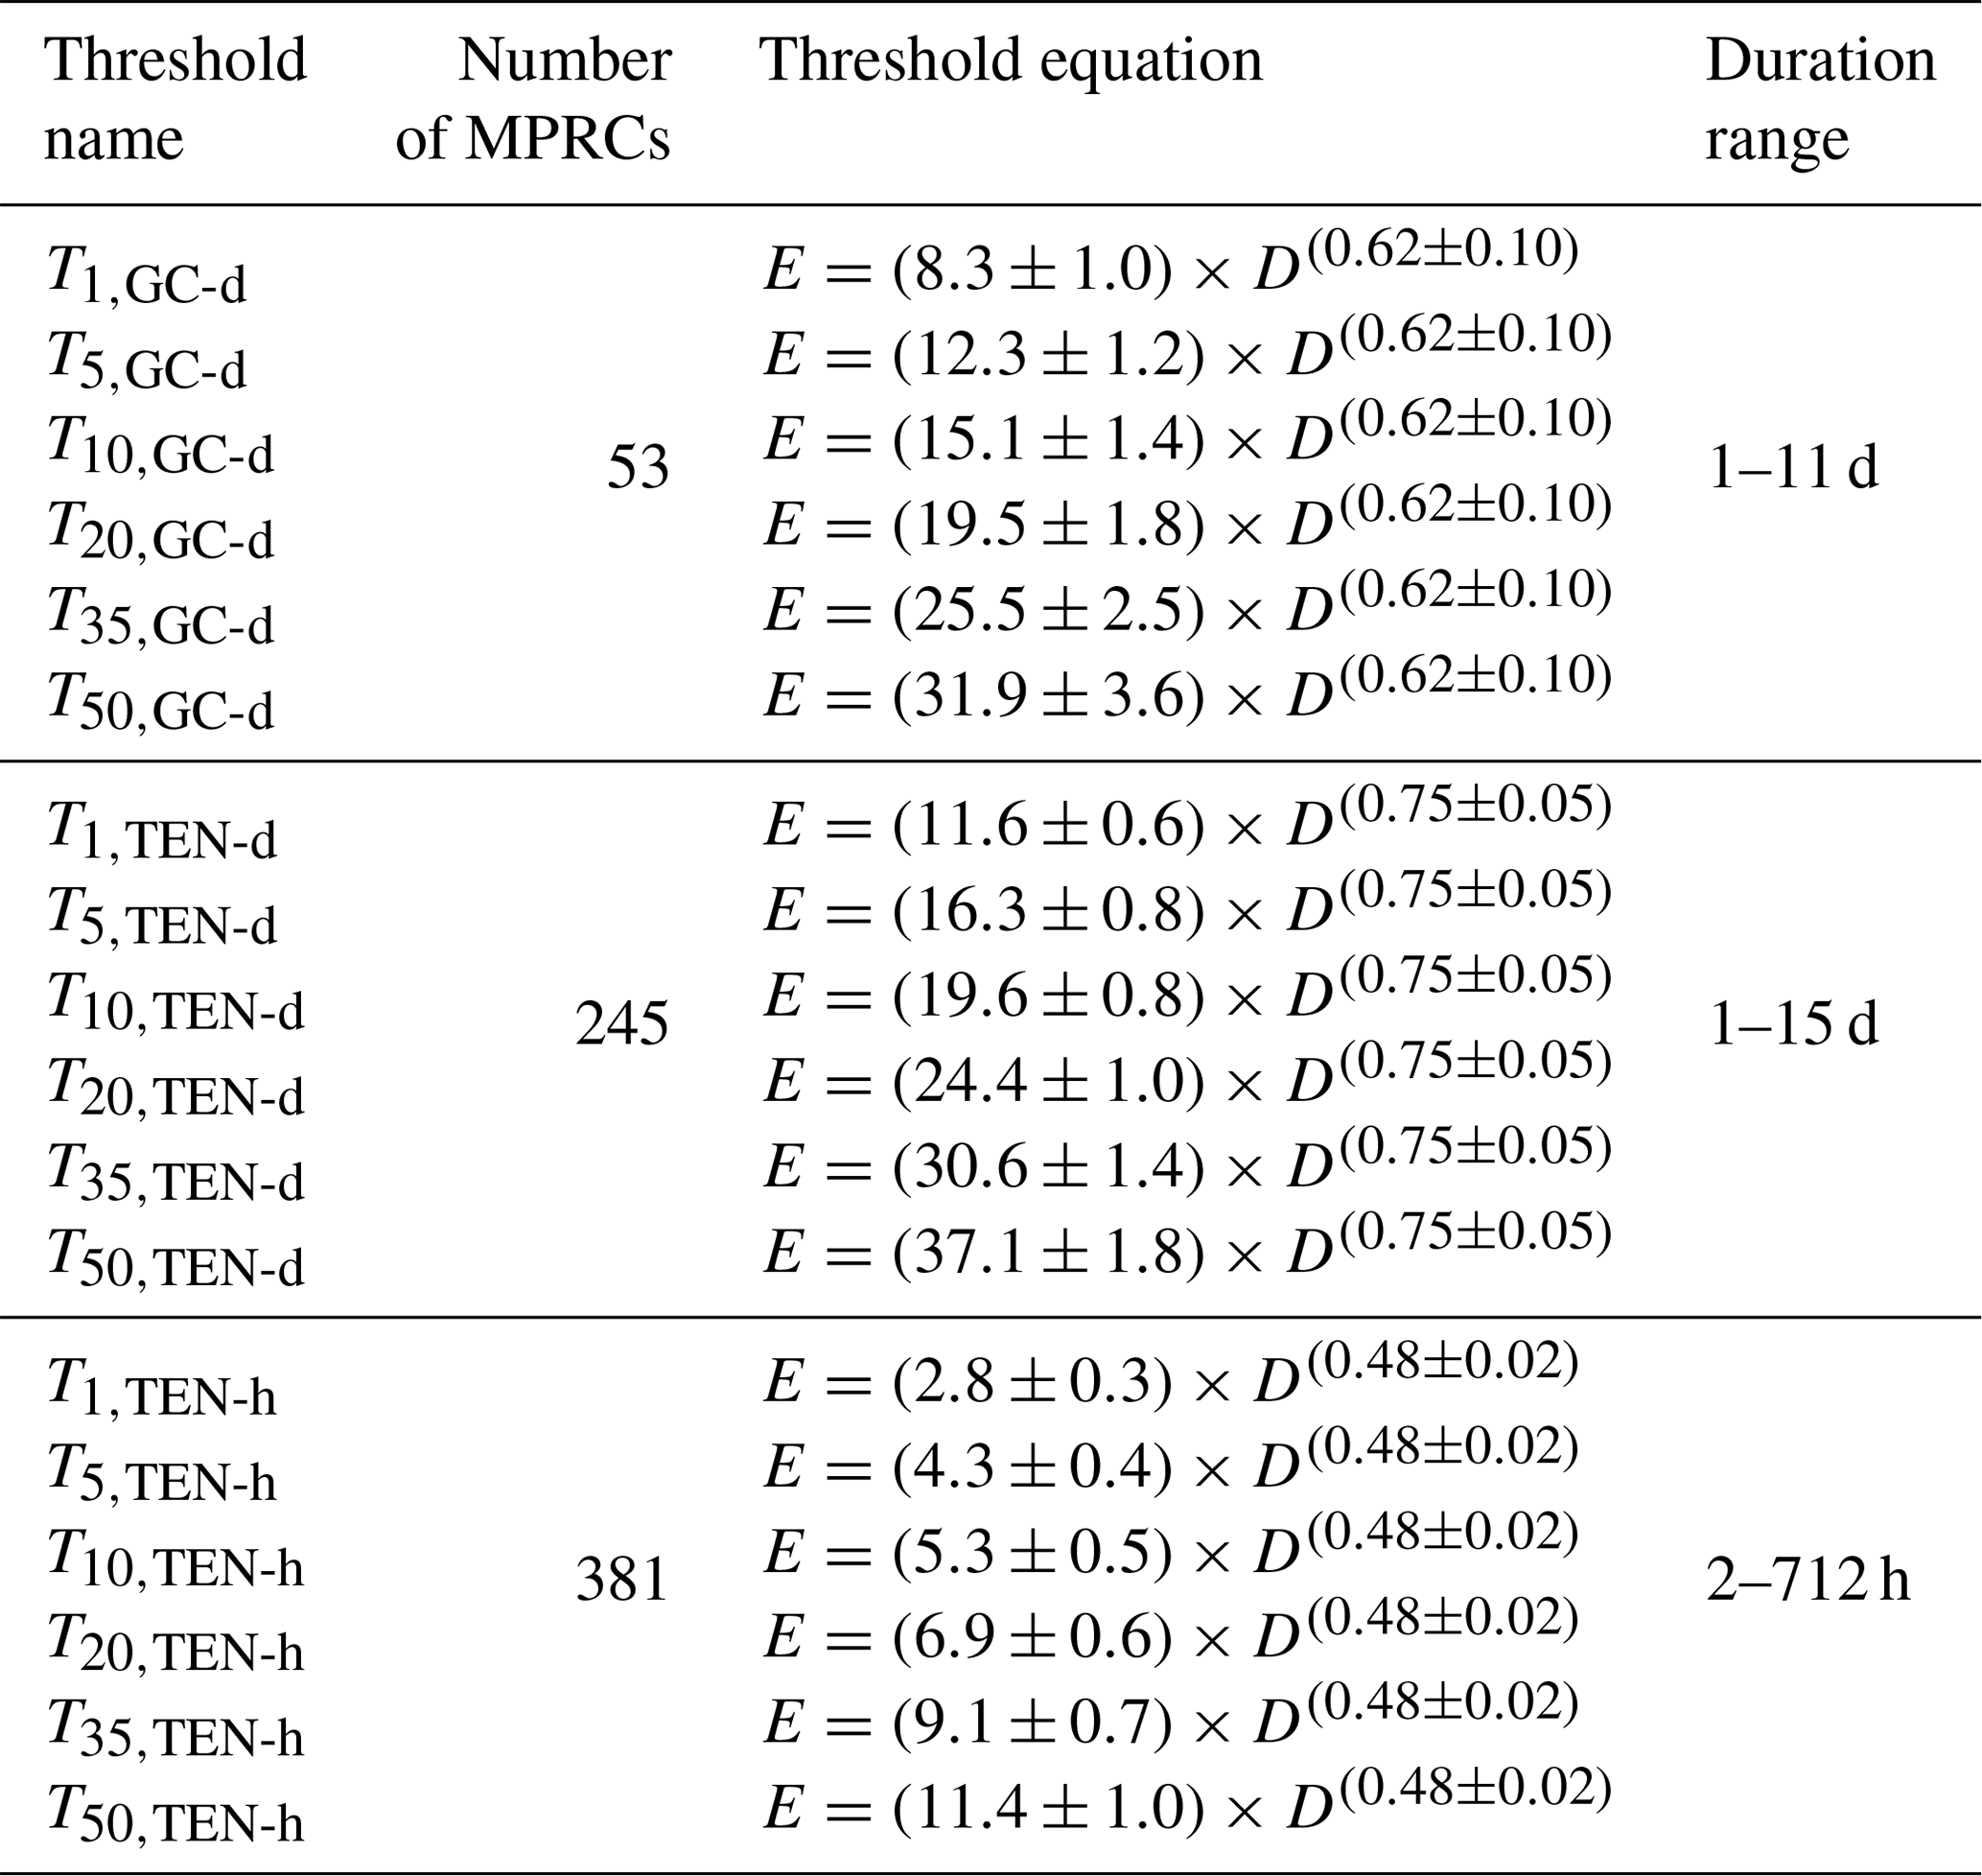
Figure 5a shows, in logarithmic coordinates, the distribution of the (D,E) rainfall conditions, reconstructed with daily data, that have caused rockfalls in GC (53 blue dots) and in TEN (245 green dots). In particular, the 53 daily rainfall conditions responsible for the rockfalls in GC have durations in the range of d (with an average value of 2 d) and cumulated rainfall in the range of mm (average value 51.6 mm). All the conditions were recorded in rain gauges located at a maximum distance of 5.7 km from the failures, with a mean value of 2.8 km. The 245 daily based rainfall conditions associated with the collapses in TEN have durations ranging from 1 to 15 d, with a mean value of 2 d. The cumulated rainfall ranges from 15.4 to 235.0 mm, with an average of 71.5 mm. The average distance between the rockfalls and their representative rain gauges is 2.2 km, with a maximum distance of 5 km. Figure 5a also portrays the 5 % ED thresholds for GC (T5,GC-d, blue curve) and TEN (T5,TEN-d, green curve). The shaded areas around the threshold lines show the uncertainty regions associated with the thresholds (Table 3). Figure 5b portrays the same T5,GC-d and T5,TEN-d, in linear coordinates, in the range of d.
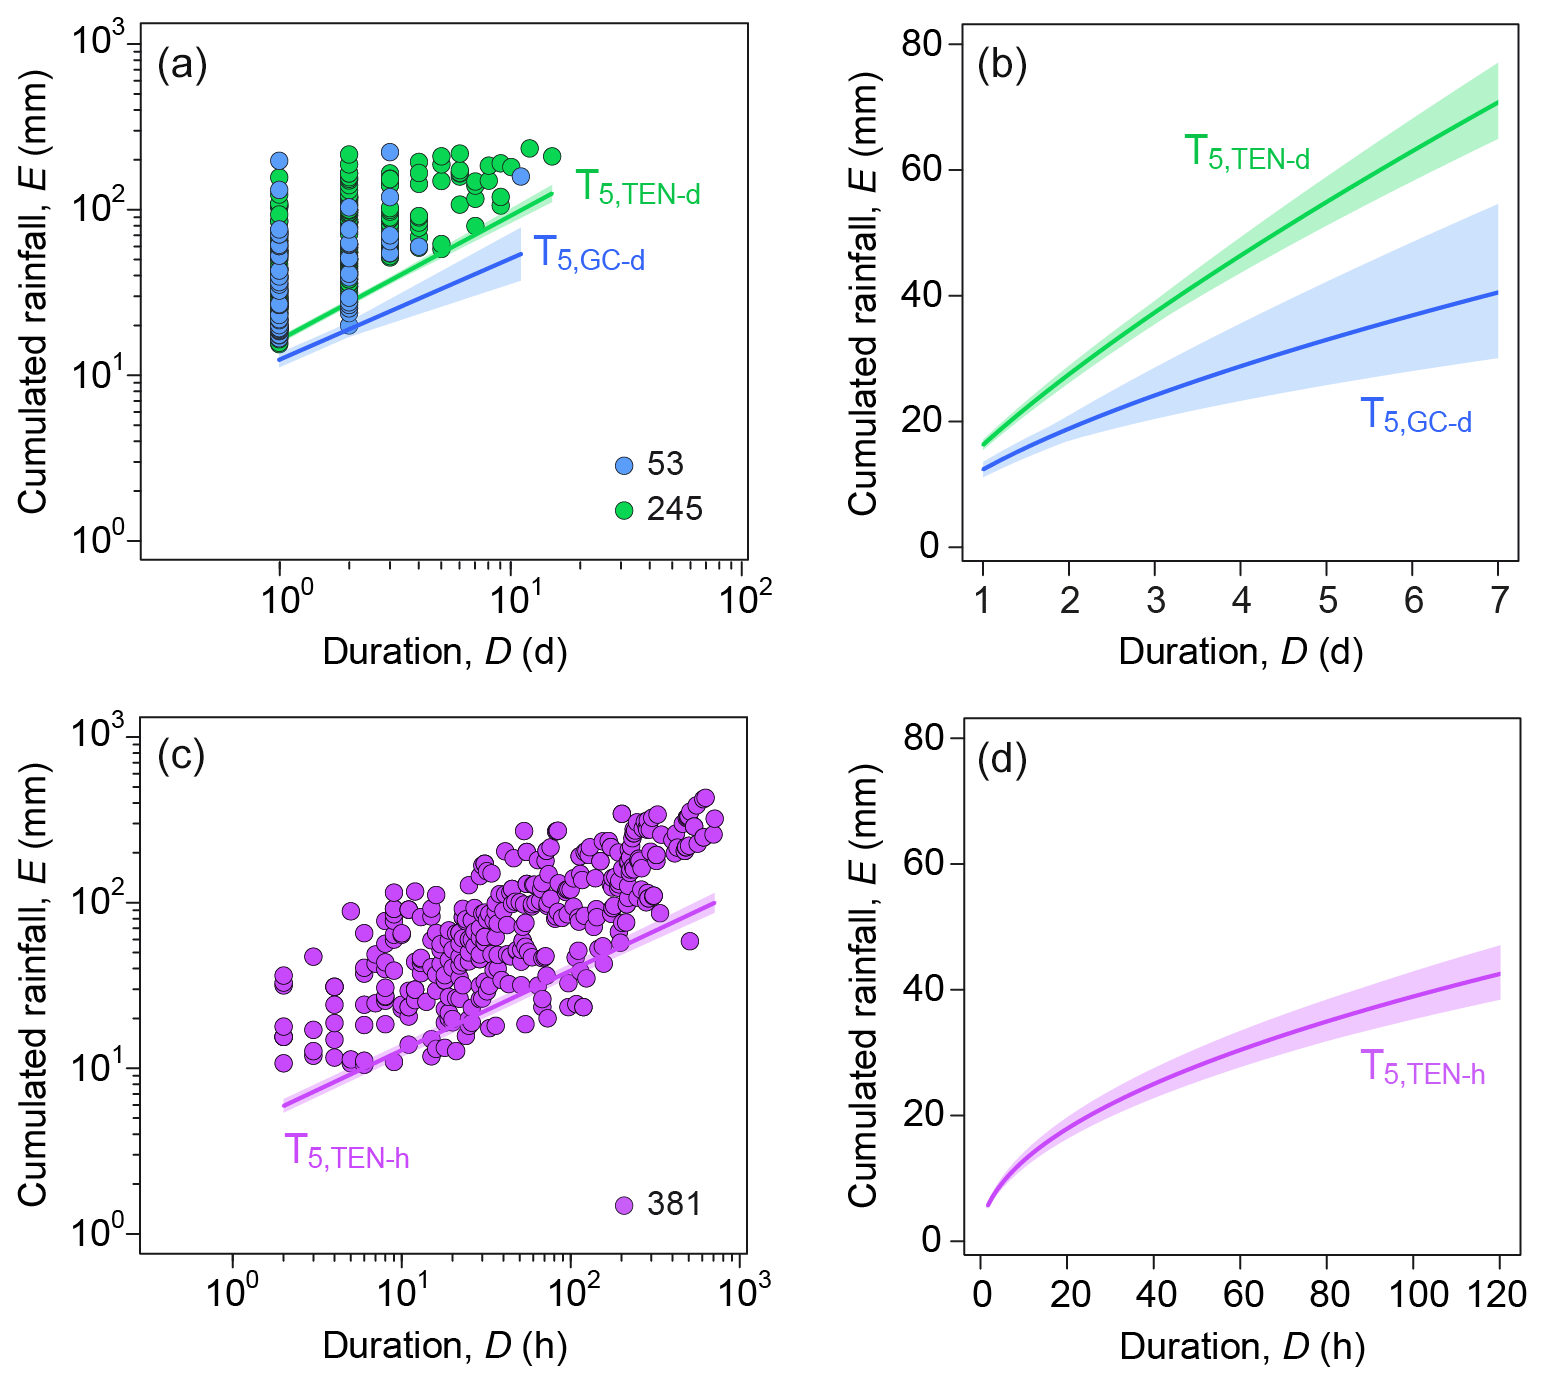
Figure 5Rainfall thresholds for possible rockfall occurrence at the two test sites. (a) Rainfall duration D (x axis, in days) and cumulated event rainfall E (y axis, in millimeters) conditions that have produced rockfalls at the GC (53 blue dots) and TEN (245 green dots) test sites, respectively. Green and blue curves are the 5 % power law thresholds (T5,TEN-d, T5,GC-d). (b) 5 % daily ED thresholds for GC and TEN, in linear coordinates, in the duration range of d. (c) Rainfall duration D (x axis, in hours) and cumulated event rainfall E (y axis, in millimeters) conditions that have produced rockfalls at the TEN (381 purple dots) test site. The purple curve is the 5 % power law threshold (T5,TEN-h). (d) 5 % hourly ED thresholds for GC and TEN, in linear coordinates, in the duration range of h.
Figure 5c shows, in logarithmic coordinates, the distribution of the (D,E) rainfall conditions, reconstructed with hourly data, that have triggered rock failures in TEN (381 purple dots). The hourly rainfall conditions associated with rockfalls have durations ranging from 2 to 712 h and a mean value of 111 h. The cumulated rainfall ranges from 10.6 to 433.9 mm, with an average of 105.6 mm. The average distance between the rockfalls and the representative rain gauges is 6.7 km, with a maximum distance of 14.9 km. In the log–log plot the purple curve is the 5 % threshold for TEN (T5,TEN-h) obtained with hourly data. Figure 5d portrays, in linear coordinates, the same T5,TEN-h in the range of h. The uncertainty associated with the threshold (purple shaded area in Fig. 5c and d) is also shown.
The difference between the T5,GC-d and T5,TEN-d thresholds can be ascribed to the different MAR at the two test sites. Figure 6 portrays the maps of the MAR and of its coefficient of variation, which is the percentual variability (standard deviation) of the MAR in the considered time interval. The geographical distribution of the MAR values exhibits the highest values in the northern parts of both islands, where it overcomes 800 mm (Fig. 6a). In contrast, the highest values of the coefficient of variation (i.e., an index of the MAR variability) are localized in the southern part of the islands, where the rain gauge density is lower (Fig. 6b).

Figure 6Maps of (a) mean annual rainfall and (b) of its coefficient of variation. The rain gauges used for these analyses (cf. Table 1) are also shown.
Canary Island rainfall is the most important triggering factor for rockfalls (Fig. 3). Nevertheless, there are other factors that predispose directly or indirectly the trigger of the failure (Temiño et al., 2013a). Factors that greatly accentuate this hazard at the two test sites are wind, geomorphological characteristics (e.g., slope, aspect), type of soil, and seismic activity. Regarding the wind, many collapses are caused by strong gusts of wind that affect the northern side of Tenerife island and the road GC-200 from Agaete to Aldea in Gran Canaria (Temiño et al., 2013b). Regarding the geomorphology, the existence of many sections of road running through the old basaltic massifs with significant subvertical jointing makes the area very susceptible to rock failures. In addition, the action of the trade winds in the higher-altitude areas produces an increase in the relative humidity as large masses of water vapor are retained by steep slopes, resulting in intense weathering (and weakening) of the rock masses. Finally, the large flank instability of the two test sites (especially in the northwest sector of the Gran Canaria island) could be related to structural control and to seismic activity connected to the dynamic geologic condition that characterizes them (Masson et al., 2002; Temiño et al. 2013b; Urgeles et al., 2001).
By selecting the subset of rockfalls triggered by rainfall, it can be observed that their monthly frequency is linked to the monthly distribution of the rainfall measured in nearby rain gauges (Fig. 4a–f). For GC-d (Fig. 4a and d) the correlation is apparently weaker in fall than in winter, but this could be ascribed to a statistical fluctuation and should be confirmed by increasing the number of events. Conversely, for TEN-d (Fig. 4b and e) the monthly number of rock failures well reflects the monthly rainfall amount, suggesting that rainfall is the only triggering cause. Hourly rainfall data in TEN-h (Fig. 4c and f) partially confirm this outcome since even with a lower median amount of rainfall, a higher number of rock failures is expected to occur from October to December than in February.
The number of rockfalls for which it has been possible to reconstruct the rainfall conditions (MPRCs) using daily and hourly data at the TEN test site (Fig. 4e and f) is different. This is mostly due to the worst temporal resolution of the TEN-d dataset.
At the two test sites, the majority of the rainfall responsible for rockfalls belongs to the Alpert's category MH (Fig. 4g and i). In TEN-h, 31 events belong to the most severe category T, whereas in TEN-d only one event is found in the T category. This result could be ascribed to the time step of the moving window used to assign the Alpert's category. For a rainfall event lasting more than 1 d, the Alpert's category varies depending on the data's temporal resolution since the time step is 1 h or 1 d for the hourly and daily data, respectively. In TEN-d, the total amount of rainfall responsible for the failure is shared in 2 or more consecutive days, causing a lowering of the Alpert's category, as confirmed by the paucity of T events in TEN-d.
Figure 5 shows that T5,TEN-d is higher and steeper than T5,GC-d. This means that, at increasing values of D, a smaller amount of rainfall (E) is necessary to trigger the collapses in GC than in TEN. Comparing Figs. 1 and 5, the recorded rockfalls at the TEN test site are localized in areas including several classes of MAR (ranging from 100 to 800 mm), while at the GC test site they fall in the area characterized by the lowest class of MAR (≤100 mm). The different ranges of MAR values at the two test sites are able to explain the observed differences in the two daily ED thresholds (Fig. 5a). This finding confirms that where the MAR is higher, the minimum rainfall conditions able to trigger a failure, specifically a rockfall, are also higher.
Moreover, the threshold defined for the TEN test site has an uncertainty smaller than the threshold for the GC test site. Peruccacci et al. (2012) observed that the parameter uncertainty reduces as the number of MPRCs used to calculate the threshold increases. In particular, as derived from Table 3, the relative uncertainty of the intercept (Δα∕α) is 9.8 % for T5,GC-d and 4.9 % for T5,TEN-d. Regarding the slope of the curves, Δγ∕γ is 16.1 % for T5,GC-d and 6.7 % for T5,TEN-d. Given the lower uncertainty range and relative uncertainties of both parameters, T5,TEN-d has a reliability higher than that of T5,GC-d. The same analysis for the T5,TEN-h threshold gives % and . Thresholds with an hourly temporal resolution and relative uncertainties of the parameters α and γ lower than 10 % could be implemented in an operative system for the prediction of rainfall-induced failures (Peruccacci et al., 2012, 2017). The thresholds for different nonexceedance probabilities obtained for the TEN test site using hourly rainfall data are suited for the design of probabilistic schemes for the operative prediction of rainfall-induced rockfalls. An improvement in the number of rain gauges providing hourly measurements as well as in the number of recorded rock failures would be necessary at the GC test site in order to reduce the uncertainty of the threshold.
Currently, neither prototype nor operative early-warning systems for rainfall-induced failures are present in the Canary Islands (Guzzetti et al. 2020). The findings of this work can contribute to the understanding of the rainfall conditions that can trigger rainfall-induced rockfalls in Tenerife and in the western part of Gran Canaria as well as their relationship with the mean annual rainfall regime. These findings have scientific and social implications given that, at both test sites, spring and autumn are also characterized by a moderate occurrence of rock failures, with relevant impacts on the population, tourism activities, and local economy. As long as a sufficient number of empirical data will be available at both test sites (and also on other islands of the archipelago), the method adopted in this work for the definition of reliable rainfall thresholds can be replicated, and the results can be implemented in a prototype early-warning system.
The code of CTRL-T was written using the R open-source software and can be freely downloaded at http://geomorphology.irpi.cnr.it/tools/rainfall-events-and-landslides-thresholds/ctrl-t-algorithm/ctrl-code/ctrl_t_code.r/view (last access: August 2020) (CNR-IRPI, 2020a). An example of the input files required by the algorithm can be freely downloaded at http://geomorphology.irpi.cnr.it/tools/rainfall-events-and-landslides-thresholds/ctrl-t-algorithm/input-demo/INPUT.zip/view (last access: August 2020) (CNR-IRPI, 2020b).
All authors designed the experiment and carried it out. MM, SP, and MTB developed the model code; RS and RMM provided the data; and MM and SLG performed the simulations. All authors analyzed the results and prepared the manuscript.
The authors declare that they have no conflict of interest.
The authors would also like to thank Luis E. Hernández Gutiérrez from the Regional Service of Studies and Ecological Impacts of the Canary Islands government.
Research conducted within the framework of the U-Geohaz project (Geohazard Impact Assessment for Urban Areas) was funded by the European Commission, Directorate-General Humanitarian Aid and Civil Protection (ECHO), under the call UCPM-2017-PP-AG. This work was also funded by the Salvador de Madariaga Mobility Program from the Spanish Ministry of Science (project PRX18/00020) and by the University of Alicante.
This paper was edited by Thomas Glade and reviewed by two anonymous referees.
Alpert, P., Ben-Gai, T., Baharan, A., Benjamini, Y., Yekutieli, D., Colacino, M., Diodato, L., Ramis, C., Homar, V., Romero, R., Michaelides, S., and Manes, A.: The paradoxical increase of Mediterranean extreme daily rainfall in spite of decrease in total values, Geophy. Res. Lett., 29, 31-1–31-4, https://doi.org/10.1029/2001GL013554, 2002.
Ansari, M. K., Ahmed, M., Rajesh Singh, T. N., and Ghalayani, I.: Rainfall, a major cause for rockfall hazard along the roadways, highways and railways on hilly terrains in India, in: Engineering Geology for Society and Territory – Vol. 1, edited by: Lollino, G., Manconi, A., Clague, J., Shan, W., and Chiarle, M., Springer, Cham, 457–460, https://doi.org/10.1007/978-3-319-09300-0_87, 2015.
Berti, M., Martina, M. L. V., Franceschini, S., Pignone, S., Simoni, A., and Pizziolo, M.: Probabilistic rainfall thresholds for landslide occurrence using a Bayesian approach, J. Geophys. Res., 117, F04006, https://doi.org/10.1029/2012JF002367, 2012.
Brunetti, M.T., Peruccacci, S., Rossi, M., Luciani, S., Valigi, D., and Guzzetti, F.: Rainfall thresholds for the possible occurrence of landslides in Italy, Nat. Hazards Earth Syst. Sci., 10, 447–458, https://doi.org/10.5194/nhess-10-447-2010, 2010.
Cepeda, J., Höeg, K., and Nadim, F.: Landslide-triggering rainfall thresholds: a conceptual framework, Q. J. Eng. Geol. Hydrog., 43, 69–84, https://doi.org/10.1144/1470-9236/08-066, 2010.
Chen, C., Saito, H., and Oguchi, T.: Rainfall intensity–duration conditions for mass movements in Taiwan, Prog. Earth Planet. Sci., 2, 1–13, https://doi.org/10.1186/s40645-015-0049-2, 2015.
CNR-IRPI: CTRL-T algorithm, available at: http://geomorphology.irpi.cnr.it/tools/rainfall-events-and-landslides-thresholds/ctrl-t-algorithm/ctrl-code/ctrl_t_code.r/view (last access: August 2020), 2020a.
CNR-IRPI: Input Files, available at: http://geomorphology.irpi.cnr.it/tools/rainfall-events-and-landslides-thresholds/ctrl-t-algorithm/input-demo/INPUT.zip/view (last access: August 2020), 2020b.
Collins, B. D. and Stock, G. M.: Rockfall triggering by cyclic thermal stressing of exfoliation fractures, Nat. Geosci., 9, 395–400, https://doi.org/10.1038/ngeo2686, 2016.
Contino, A., Bova, P., Esposito, G., Giuffré, I., and Monteleone, S.: Historical analysis of rainfall-triggered rockfalls: the case study of the disaster of the ancient hydrothermal Sclafani Spa (Madonie Mts, northern-central Sicily, Italy) in 1851, Nat. Hazards Earth Syst. Sci., 17, 2229–2243, https://doi.org/10.5194/nhess-17-2229-2017, 2017.
Fullea, J., Camacho, A. G., Negredo, A. M., and Fernández, J.: The Canary Islands hot spot: new insights from 3D coupled geophysical–petrological modelling of the lithosphere and uppermost mantle, Earth Planet. Sc. Lett., 409, 71–88, https://doi.org/10.1016/j.epsl.2014.10.038, 2015.
Gariano, S. L., Melillo, M., Peruccacci, S., and Brunetti, M. T.: How much does the rainfall temporal resolution affect rainfall thresholds for landslide triggering?, Nat. Hazards, 100, 655–670, https://doi.org/10.1007/s11069-019-03830-x, 2020.
González de Vallejo, L. I., Hernández-Gutiérrez, L. E., Miranda, A., and Ferrer, M.: Rockfall Hazard Assessment in Volcanic Regions Based on ISVS and IRVS Geomechanical Indices, Geosciences, 10, 220–239, https://doi.org/10.3390/geosciences10060220, 2020.
Guzzetti, F., Peruccacci, S., Rossi, M., and Stark, C. P.: Rainfall thresholds for the initiation of landslides in central and southern Europe, Meteorol. Atmos. Phys., 98, 239–267, https://doi.org/10.1007/s00703-007-0262-7, 2007.
Guzzetti, F., Peruccacci, S., Rossi, M., and Stark, C. P.: The rainfall intensity–duration control of shallow landslides and debris flows: an update, Landslides, 5, 3–17, https://doi.org/10.1007/s10346-007-0112-1, 2008.
Guzzetti, F., Gariano, S. L., Peruccacci, S., Brunetti, M. T., Marchesini, I., Rossi, M., and Melillo, M.: Geographical landslide early warning systems, Earth-Sci. Rev., 200, 102973, https://doi.org/10.1016/j.earscirev.2019.102973, 2020.
Keefer, D. K.: Investigating landslides caused by earthquakes – A historical review, Surv. Geophys., 23, 473–510, https://doi.org/10.1023/A:1021274710840, 2002.
Masson, D. G., Watts, A. B., Gee, M. J. R., Urgeles, R., Mitchell, N. C., Le Bas, T. P., and Canals, M.: Slope failures on the flanks of the western Canary Islands, Earth-Sci. Rev., 57, 1–35, https://doi.org/10.1016/S0012-8252(01)00069-1, 2002.
Mateos, R. M., García-Moreno, I., Reichenbach, P., Herrera, G., Sarro, R., Rius, J., and Aguiló, R.: Calibration and validation of rockfall modelling at regional scale: application along a roadway in Mallorca (Spain) and organization of its management, Landslides, 13, 751–763, https://doi.org/10.1007/s10346-015-0602-5, 2016.
Melillo, M., Brunetti, M. T., Peruccacci, S., Gariano, S. L., and Guzzetti, F.: Rainfall thresholds for the possible landslide occurrence in Sicily (southern Italy) based on the automatic reconstruction of rainfall events, Landslides, 13, 165–172, https://doi.org/10.1007/s10346-015-0630-1, 2016.
Melillo, M., Brunetti, M. T., Peruccacci, S., Gariano, S. L., Roccati, A., and Guzzetti, F.: A tool for the automatic calculation of rainfall thresholds for landslide occurrence, Environ. Model. Softw., 105, 230–243, https://doi.org/10.1016/j.envsoft.2018.03.024, 2018.
Palenzuela, J. A., Jiménez-Perálvarez, J. D., and Chacón, J.: Assessing critical rainfall thresholds for landslide triggering by generating additional information from a reduced database: an approach with examples from the Betic Cordillera (Spain), Nat. Hazards, 84, 185–212, https://doi.org/10.1007/s11069-016-2416-8, 2016.
Peruccacci, S., Brunetti, M. T., Luciani, S., Vennari, C., and Guzzetti, F.: Lithological and seasonal control of rainfall thresholds for the possible initiation of landslides in central Italy, Geomorphology, 139–140, 79–90, https://doi.org/10.1016/j.geomorph.2011.10.005, 2012.
Peruccacci, S., Brunetti, M. T., Gariano, S. L., Melillo, M., Rossi, M., and Guzzetti, F.: Rainfall thresholds for possible landslide occurrence in Italy, Geomorphology, 290, 39–57, https://doi.org/10.1016/j.geomorph.2017.03.031, 2017.
Rosi, A., Peternel, T., Jemec-Auflič, M., Komac, M., Segoni, S., and Casagli, N.: Rainfall thresholds for rainfall-induced landslides in Slovenia, Landslides, 13, 1571–1577, https://doi.org/10.1007/s10346-016-0733-3, 2016.
Ruiz-Villanueva, V., Bodoque, J. M., Díez-Herrero, A., and Calvo, C.: Triggering threshold precipitation and soil hydrological characteristics of shallow landslides in granitic landscapes, Geomorphology, 133, 178–189, https://doi.org/10.1016/j.geomorph.2011.05.018, 2011.
Saroglou, C.: GIS-based rockfall susceptibility zoning in Greece, Geosciences, 9, 163, https://doi.org/10.3390/geosciences9040163, 2019.
Sarro, R., Riquelme, A., García-Davalillo, J., Mateos, R., Tomás, R., and Pastor, J.: Rockfall Simulation Based on UAV Photogrammetry Data Obtained during an Emergency Declaration: Application at a Cultural Heritage Site, Remote Sens., 10, 1923, https://doi.org/10.3390/rs10121923, 2108.
Segoni, S., Piciullo, L., and Gariano, S. L.: A review of the literature on rainfall thresholds for landslide occurrence, Landslides, 15, 1483–1501, https://doi.org/10.1007/s10346-018-0966-4, 2018.
Sengupta, A., Gupta, S., and Anbarasu, K.: Rainfall thresholds for the initiation of landslide at Lanta Khola in north Sikkim, India, Nat. Hazards, 52, 31–42, https://doi.org/10.1007/s11069-009-9352-9, 2010.
Staley, D. M., Kean, J. W., Cannon, S. H., Schmidt, K. M., and Laber, J. L.: Objective definition of rainfall intensity–duration thresholds for the initiation of post-fire debris flows in southern California, Landslides, 10, 547–562, https://doi.org/10.1007/s10346-012-0341-9, 2013.
Temiño, J. Y., Rodrìguez-Peces, M. J., Marchesini, S., Leyva, S., and Dìaz-Hernàndez, J. L.: Amplification of the destructive effects of rock falls by sliding on volcanic soils: examples from the Anaga Massif (Tenerife Island, Spain), in: Landslide Science and Practice, Vol. 1, edited by: Margottini, C., Canuti, P., and Sassa, K., Springer-Verlag, Berlin, Heidelberg, 191–195, https://doi.org/10.1007/978-3-642-31325-7_25, 2013a.
Temiño, J. Y., Rodrìguez-Peces, M. J., Sànchez, N., Galindo, I., and del Potro, R.: Geomorphologic evidences of flank instabilities in the eastern sector of the Tejeda volcano (Canary Islands, Spain) during the Quaternary, in: Landslide Science and Practice, Vol. 7, edited by: Margottini, C., Canuti, P., and Sassa, K., Springer-Verlag, Berlin, Heidelberg, 65–72, https://doi.org/10.1007/978-3-642-31313-4_9, 2013b.
Troll, V. R. and Carracedo, J. C.: The Geology of the Canary Islands, Elsevier, 636 pp., available at: https://www.elsevier.com/books/the-geology-of-the-canary-islands/troll/978-0-12-809663-5 (last access: August 2020), 2016.
Urgeles, R., Canals, M., and Masson, D. G.: 2001 Flank stability and processes off the western Canary Islands: a review from El Hierro and La Palma, Sci. Mar., 65, 21–31, https://doi.org/10.3989/scimar.2001.65s121, 2001.
Valenzuela, P., Domínguez-Cuesta, M. J., Mora García, M. A., and Jiménez-Sánchez, M.: Rainfall thresholds for the triggering of landslides considering previous soil moisture conditions (Asturias, NW Spain), Landslides, 15, 273–282, https://doi.org/10.1007/s10346-017-0878-8, 2018.
Valenzuela, P., Zêzere, J. L., Domínguez-Cuesta, M. J., and Mora García, M. A.: Empirical rainfall thresholds for the triggering of landslides in Asturias (NW Spain), Landslides, 16, 1285–1300, https://doi.org/10.1007/s10346-019-01170-2, 2019.
Wieczorek, G. F. and Jaeger, S.: Triggering mechanisms and depositional rates of postglacial slope movement processes in the Yosemite Valley, California, Geomorphology, 15, 17–31, https://doi.org/10.1016/0169-555X(95)00112-I, 1996.
WMO – World Meteorological Organization: Calculation of Monthly and Annual 30-Year Standard Normals, WMO/TD No. 341, WCDP-No. 10, Geneva, 1989.
Zêzere, J. L., Vaz, T., Pereira, S., Oliveira, S. C., Marques, R., and Garcia, R. A. C.: Rainfall thresholds for landslide activity in Portugal: a state of the art, Environ. Earth Sci., 73, 2917–2936, https://doi.org/10.1007/s12665-014-3672-0, 2015.