the Creative Commons Attribution 4.0 License.
the Creative Commons Attribution 4.0 License.
 | 25 Aug 2020
Characteristics and performance of wind profiles as observed by the radar wind profiler network of China
Boming Liu
Wei Gong
Lijuan Shi
Yong Zhang
Yingying Ma
Wind profiles are fundamental to the research and applications in boundary layer meteorology, air quality and numerical weather prediction. Large-scale wind profile data have been previously documented from network observations in several countries, such as Japan, the USA, various European countries and Australia, but nationwide wind profiles observations are poorly understood in China. In this study, the salient characteristics and performance of wind profiles as observed by the radar wind profiler network of China are investigated. This network consists of more than 100 stations instrumented with 1290 MHz Doppler radar designed primarily for measuring vertically resolved winds at various altitudes but mainly in the boundary layer. It has good spatial coverage, with much denser sites in eastern China. The wind profiles observed by this network can provide the horizontal wind direction, horizontal wind speed and vertical wind speed for every 120 m interval within the height of 0 to 3 km. The availability of the radar wind profiler network has been investigated in terms of effective detection height, data acquisition rate, data confidence and data accuracy. Further comparison analyses with reanalysis data indicate that the observation data at 89 stations are recommended and 17 stations are not recommended. The boundary layer wind profiles from China can provide useful input to numerical weather prediction systems at regional scales.
- Article
(1825 KB) -
Supplement
(142 KB) - BibTeX
- EndNote


It is increasingly recognised that atmospheric wind profiles and vertical wind shear are crucial to better understanding the more frequent extreme rainfall events (Huuskonen et al., 2014; Nash and Oakley, 2001; Weber et al., 1990), the intensification of clear-air turbulence associated with aircraft safety (Williams and Joshi, 2013), complicated aerosol–cloud–precipitation interaction (Fan et al., 2009; Guo et al., 2016a, 2019; Lee et al., 2016) and persistent particulate-pollution episodes (Yang et al., 2019; Zhang et al., 2020). For the wind speed in the planetary boundary layer (PBL), the most striking feature is that the turning of winds with height dominates the whole PBL and beyond, which can be explained in terms of force vectors (drag, pressure gradient force, Coriolis force) at the surface and the top of the PBL (pressure gradient force and Coriolis force) (LeMone et al., 2018). Under the influence of large-scale dynamic forcing and land surface processes, wind speed and direction will dramatically vary (Michelson and Bao, 2008), which poses a great challenge for models to simulate or forecast the variation in wind very well, especially in the PBL (Constantinescu et al., 2009; Guo et al., 2016b; Liu et al., 2017).
Radar wind profilers (RWPs), which are generally a Doppler radar that operates in either the VHF (30–300 MHz) or UHF (300-1000 MHz) bands, have been widely applied to atmospheric wind field research (Dolman et al., 2018; Molod et al., 2015; Ishihara et al., 2006; Schlatter and Zbar, 1994). To date, a large spectrum of field campaigns involving the RWP-observed wind profiles, especially over the regions with intensive anthropogenic and industrialised activities, have been conducted and their archived dataset has been increasingly receiving attention (Liu et al., 2019, 2020; Kottayil et al., 2016; Singh et al., 2016; LeMone et al., 2013; Bianco et al., 2008; Le et al., 1998); most of these are based on ground-based remotely sensed measurements. The earliest space-borne wind products generally referred to the atmospheric motion vectors that are derived by tracking clouds or areas of water vapour through consecutive infrared remote-sensing images (Schmetz et al., 1993; Velden et al., 2005). Later on, the vector winds over the ocean surface were measured by the spaceborne microwave instruments such as SeaWinds onboard QuikSCAT (Bentamy et al., 1999; Draper and Long, 2002). Since 2018, new satellite-based wind observational era has set in with the launch of the European Space Agency (ESA)'s Aeolus wind satellite on which the direct-detection Doppler wind lidar ALADIN is accommodated, which provides line-of-sight winds along the satellite track (Reitebuch et al., 2009; Reitebuch, 2012). To ensure the quality of Aeolus wind products, the ALADIN team conducted several airborne wind measurement experiments for the validation of the Aeolus satellite winds product, which were based on Doppler wind lidar on research aircraft (Lux et al., 2018, 2020; Zhai et al., 2020). Meanwhile, the Aeolus experts from different organisations worked together in the Data Innovation and Science Cluster team and ultimately optimised the data processing and bias correction methods. Starting on 12 May 2020, the Aeolus data went public after the bias correction of the winds has been adequately made and are now being distributed publicly to forecasting services and scientific users within less than 3 h of the measurements being made from space (https://www.esa.int/Applications/Observing_the_Earth/Aeolus/Aeolus_goes_public, last access: 19 August 2020).
To gain a panoramic picture of regional-scale wind fields, a number of RWP networks have been set up across the world. As early as 1990s, the demonstration wind profile network is deployed and maintained by the National Oceanic Atmospheric Administration (NOAA), which is also termed NOAA profiler network (NPN) and operated at a frequency of 404 MHz (Schlatter and Zbar, 1994; van de Kamp, 1993; Weber at al., 1990). The second type of profiler is the 915 MHz boundary-layer profiler that is much smaller, transportable, commercially available but lacks height coverage compared with the 404 MHz wind profiler and thus is mainly used for NOAA research and outside agencies. Nevertheless, probably due to the fact that the RWPs reached the end of their useful lives, the NPN largely ceased to operate in 2014 and the last stations closed in 2017. As an alternative data source, the high-density airborne wind and temperature profiles from the civil-aviation industry have gradually taken over the role of the RWP since then (https://madis.ncep.noaa.gov/madis_npn.shtml, last access: 22 May 2020). To combine the best sampling attributes of the abovementioned two types of wind profiler, a third type of profiler operated at 449 MHz. Later on (in 1996), the European Cooperation in Science and Technology framework (COST) initiated the project Wind Initiative Network Demonstration in Europe (CWINDE). The European RWP network named E-PROFILE was constructed within the framework of CWINDE as part of the EUMETNET Composite Observing System (EUCOS), providing the monitoring of vertical profiles of wind across Europe (Dibbern et al., 2001; Oakley et al., 2000; Nash and Oakley, 2001). Moreover, the Japan Meteorological Agency developed the operational wind profiler network in Japan in 2011, which is a nationwide network of 33 wind profilers currently in operation. The wind data have significant influence on improving numerical weather prediction (Ishihara et al., 2006; Rennie and Isaksen, 2020). The Australian Bureau of Meteorology completed the installation of the Australian wind profiler network of 19 wind profilers in 2017 that runs in the 55 MHz frequency band, which produces wind data of sufficient accuracy for the presentation to forecasters and ingestion into global numerical weather prediction models (Dolman et al., 2018). The aforementioned networks have provided vertical profiles of wind for model assimilation through the Global Telecommunication System at a regional or national scale (e.g. Benjamin et al., 2004; Chipilski et al., 2019), which was found to significantly improve the forecast of rainfall onset and atmospheric pollution episodes (Liu et al., 2018, 2019; Singh et al., 2016; LeMone et al., 2013; Du et al., 2012; Bianco et al., 2008; Angevine et al., 1994).
Given the considerable advantages over conventional ground-based in situ or remote-sensing observations, wind profiler measurements have been applied well in a variety of applications in China, including air quality and weather forecast (Sun, 1994; Hu and Li, 2010; Dong et al., 2011; Miao et al., 2018; Zhang et al., 2020). Nevertheless, the RWP is generally deployed either in specific regions or for short time periods. Recent model simulation work by assimilating wind measurements from a regional wind profiler network in north China indicated the network observation significantly improved the convective forecasting (Wang et al., 2020). Meanwhile, extreme precipitation is continuously intensified under global warming and atmospheric pollution is increasing, especially in Eastern Asian countries such as China and India (Zhang et al., 2006; Pfahl et al., 2017; Guo et al., 2019, 2020; Li et al., 2020). However, the characteristics and performance of the nationwide profiler network in China have never been revealed, and the assessment of systematic observation performance and data accuracy is still lacking, to the best of our knowledge. This motivates us to evaluate the performance and accuracy of the RWP network of China, ultimately in an attempt to present wind profile data as a new data source for numerical weather prediction or climate-related studies. The remainder of this paper is organised as follows. The RWP network of China is briefly introduced in Sect. 2. The performance and accuracy are evaluated in Sect. 3. Section 4 will discuss the detailed application of wind profile data. A summary of results is presented in Sect. 5.
This network began to be constructed in 2008, when there were five sites having wind profiling measurements transmitted to the headquarter of the China Meteorological Administration (CMA). The number of RWP sites continuously increased to 92 by the end of 2017, all of which operate in the 405 MHz frequency band. The RWP network of China was comprised of 106 stations by March 2019 and is designed primarily for measuring winds at various altitudes. Afterwards, the working frequency band changed to the L band (1290 MHz), and the number increased to 128 in February 2020 (personal communication with Ruiyi Li from the CMA, 22 May 2020). The Meteorological Observation Center (MOC) of the CMA is responsible for the operation and maintenance of the nationwide wind profiler network. Table 1 shows the instrument information for RWPs used in this study; there are three types of RWP: high-troposphere, low-troposphere and boundary layer RWPs. It can be seen that the majority of the radars are boundary layer RWPs operating in the L band (101 sites), and a few of the sites are instrumented with tropospheric RWPs operating in the P band (five sites). Figure 1 shows the spatial distribution of the wind profiler network in China, which exhibits a large spatial domain extending from the northernmost site located at Wulumuqi to the southernmost one at Nanhai and from the westernmost site also located at Wulumuqi to the easternmost one in Shenyang. Detailed information on the RWP network of China is shown in Table S1 in the Supplement.
Table 1Instrument information of the radar wind profiler network of China.
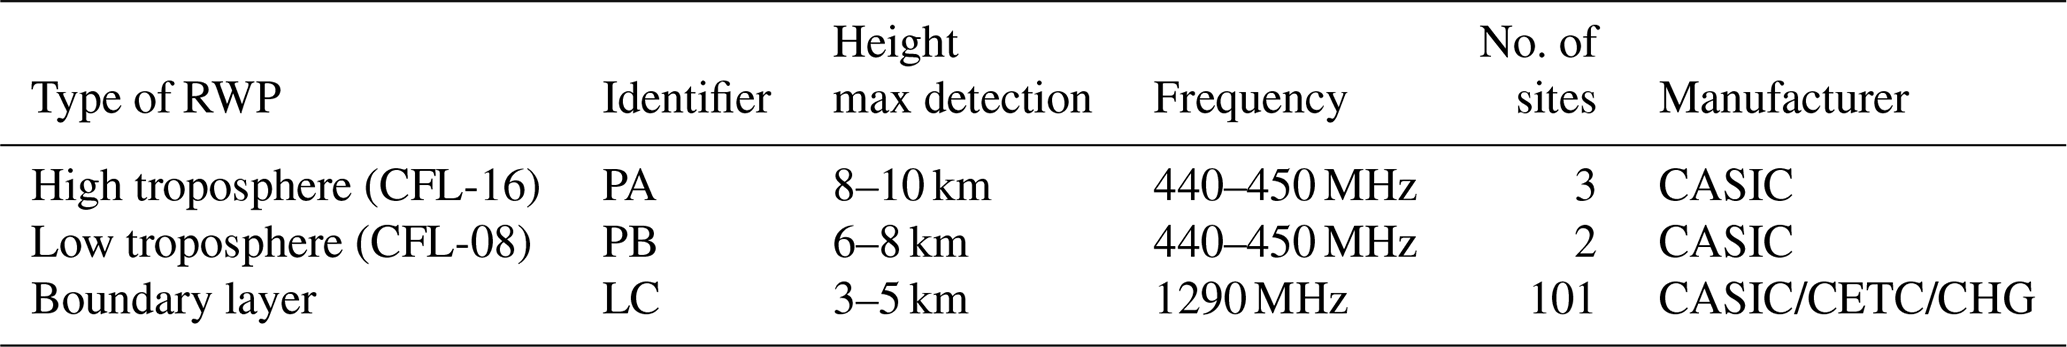
CASIC: China Aerospace Science & Industry Corp.
CETC: China Electronics Technology Group Corp.
CHG: China Huayun Meteorological Technology Group Corp.
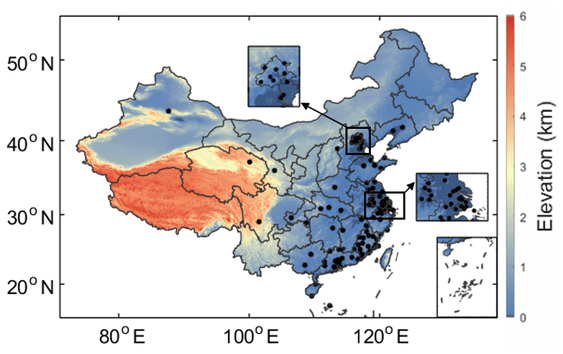
Figure 1The site distribution of the radar wind profiler network of China. Colour bar means the elevation.
The MOC (CMA) is responsible for the maintenance and collection of wind measurements from the wind profiler network, as shown in Fig. 2. Specifically, the data transfer from radar sites to MOC (CMA) is mainly done using internet connections. The data centre of the CMA was established to efficiently process the data collected via the internet. There are two main types of data collected from the wind profiler network: raw data and product data. The former data include the power spectrum data files (indicated by FFT) and radial data files (indicated by RAD). The power spectrum data file is composed of file identification, basic parameters of the station, performance parameters, observation parameters and observation data. The power spectrum data file is dynamically generated in real time according to demand. The radial data files are of two kinds: one is reference information, such as the basic parameters of the station, radar performance parameters and observation parameters; the other is the observation data of each beam at each sampling height, including sample height, velocity spectrum width, signal-to-noise ratio and radial velocity. As for the product data, three main wind profile products are produced by the data centre of the CMA:
-
The real-time sampling data file (at 6 min intervals), mainly including the sampling height, horizontal wind direction, horizontal wind speed, vertical wind speed, horizontal credibility, vertical credibility and refractive index structure parameter (). An individual file will be produced for every 6 min detection and is marked as ROBS.
-
The half-hour data file (at 30 min intervals), which is broadly consistent with the ROBS file in terms of both data content and format, except for the file produced for every half hour (48 files per day), and the file is marked as HOBS.
-
The 1 h observation sampling data file (at 60 min intervals) with 24 files per day, which is marked as OOBS.
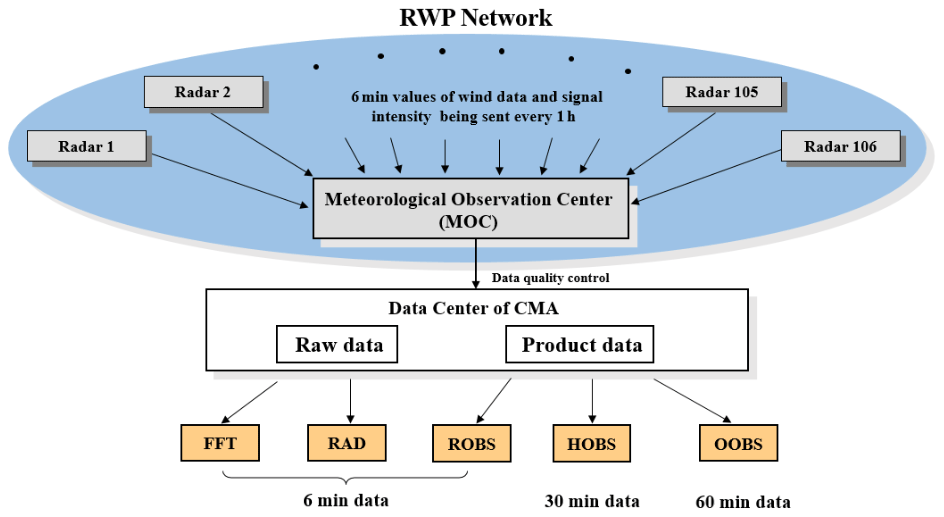
Figure 2Data transmission framework of the radar wind profiler network of China. The RWP network is maintained by the Meteorological Observation Center (MOC), China Meteorological Administration (CMA).
These wind profile products are generated for each observation site. The vertical resolution of wind profile data at most sites is 120 m. However, a few sites use a low-level detection mode with a high sampling rate; these provide a vertical resolution of 60 m. Examples of the wind profile product are shown in Fig. 3. Seven different heights (150, 500, 1000, 1500, 2000, 2500 and 3000 m) are selected to show the atmospheric vertical wind field (Fig. 3e). It can provide the vertical profiles of horizontal wind direction, horizontal wind speed and vertical wind speed. These products are available for official duty use and for research and education. The observation data from November 2018 to March 2019 are used to evaluate the performance of the RWP network of China. Due to the fact that the measurements from the China RWP network have to be further assessed, data sharing via the Global Telecommunications System is expected to occur in the next several years, which depends greatly on the process of data quality assessment.
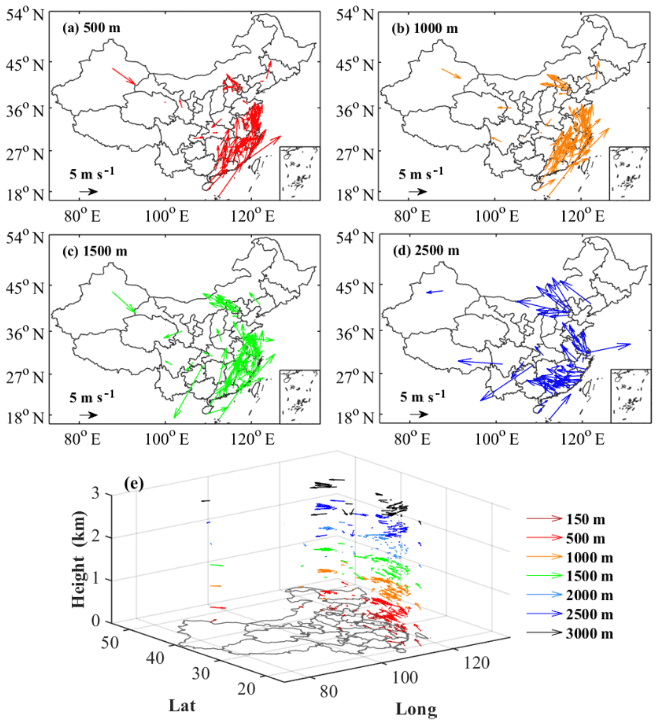
Figure 3Spatial distribution of average wind field at different heights: (a) 500 m, (b) 1000 m, (c) 1500 m and (d) 2500 m above ground level (a.g.l.). Also shown is (e) the three-dimensional atmospheric wind field observed by the radar wind profiler network of China.
The RWP network of China includes a variety of types of RWPs, including high-troposphere, low-troposphere and boundary layer RWPs. Because the algorithms and setting parameters of different instruments are inconsistent, the system performance index and data accuracy are inhomogeneous. Therefore, it is necessary to evaluate the system performance index and data accuracy of the radars in the RWP network. This is a major step forward in the harmonisation of the product generation and data quality of the RWP network of China. Three system performance indicators on data application are investigated: effective detection height, data acquisition rate and data confidence. In order to estimate the data accuracy, the wind profiles from the RWP are compared with hourly wind measurements in a ∘ latitude–longitude grid from the fifth-generation European Centre for Medium-range Weather Forecasts (ECMWF) atmospheric reanalysis of the global climate (ERA5; Hoffmann et al., 2019; Hersbach et al., 2020).
3.1 System performance index
The operation mode of the RWP network includes high-, medium- and low-detection modes, which can detect wind field information at different altitudes. The high mode is generally used to detect the wind fields at a height of 5–10 km above ground level (a.g.l.). The medium and low modes are used to detect wind fields at a height of 0–5 km above the ground. We here define “effective detection height” as the effective detection height up to where wind measurements are available. Figure 4a–b show the mean effective height detected by each RWP during the period from November 2018 to March 2019. There are 90 stations with an average height greater than 3 km; 10 of them can even reach more than 7 km. As for the acquisition rate, it refers to the ratio of the actual acquisition time to the total theoretical acquisition time, which is used to evaluate the normal operation of the wind profile radar. Figure 4c–d represent the data acquisition rate of wind measurement in the RWP network during the period from November 2018 to March 2019. The data collection rate of most sites is greater than 90 %, while the data collection rate of four sites is less than 50 %. Figure 4e–f represent the average confidence of wind measurement in the RWP network. Confidence is a credible parameter set by the system for the wind speed information at each sampling point, which is used to evaluate the credibility of the wind field information retrieved at each altitude position. The results indicate that there are 100 sites with more than 90 % confidence, but six sites have less than 90 % confidence.
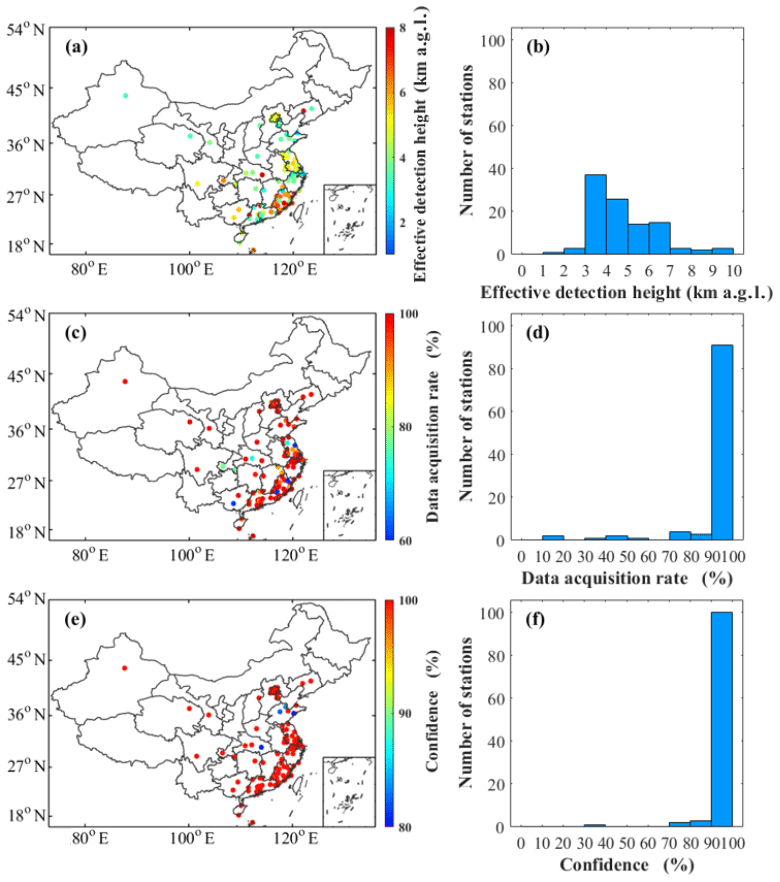
Figure 4Spatial distribution of (a) mean effective detection height, (c) mean data acquisition rate and (e) mean data confidence at each station during November 2018 to March 2019; (b), (d) and (f) correspond to the histograms for (a), (c) and (e), respectively.
In order to make the criteria of the RWP network data consistent, we have to set corresponding screening criteria for each system index, which to some degrees reflects the needs of future applications. For instance, the RWP network data are expected to be used to derive boundary layer parameters, such as boundary layer height (Liu et al., 2019) and wind shear that are closely related to atmospheric pollution (Zhang et al., 2020). Therefore, it would be better for the effective detection height of the RWP to reach 3 km, with the acquisition rate being above 60 %. In addition, according to the user manual of the RWP, only those wind profile data with a 100 % confidence level are recommended. According to these criteria, the wind profile data at each site are screened, and the screening results are shown in Fig. 5. Figure 5a shows the results of screening for effective detection height. The results show that the effective height detected by the RWPs of 102 stations meets this standard, and four stations do not meet the standard. The substandard sites are 54752, 58365, 58474 and 58730 (five-digit numeric weather station codes). Figure 5b shows the screening results of the data acquisition rate. The results show that the data acquisition rate of 100 sites is satisfactory, and six sites do not meet the standard. These substandard sites are 16078, 58158, 58460, 58927, 58933 and 59431. Figure 5c illustrates the results of the confidence level screening. We can see that 100 sites meet the standard and six sites are substandard. The substandard sites are 54727, 54736, 54857, 57494, 58365 and 58460. Overall, 92 sites of the RWP network have a good system performance.
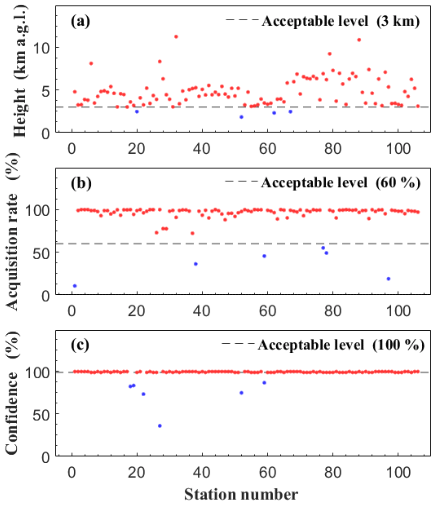
Figure 5Recommended (red dots) and non-recommended sites (blue dots) of the radar wind profiler network by different performance metrics: (a) effective height detected by RWP, (c) data acquisition rate and (e) data confidence. The horizontal grey lines indicate their corresponding acceptable threshold levels.
3.2 Data accuracy
The echo signal from RWPs can be processed to provide the wind profile at RWP sites. However, it should be noted that the accuracy of wind profile data is also closely related to the processing algorithm. Therefore, work to check the accuracy of the data is necessary before using these observations. The comparison statistics against the wind profile data from the ERA5 numerical model is an important monitoring tool (Huuskonen et al., 2014). Figure 6 shows the comparison results between wind profiles from RWPs and those from ERA5 at six stations. The vertical validation range is from 0 to 3 km. The mean speed difference (MSD) and root-mean-square difference (RMSD) of horizontal wind speed between RWPs and ERA5 (RWP–ERA5) are calculated at each height. The red and blue lines represent the MSD and RMSD at different heights, respectively. The vertical distribution of MSD at different sites is different, but most MSDs are less than 5 m s−1. It is clear that a discrepancy does not automatically imply that the wind profile is in error, but in general a gross deviation from the model results can be regarded as an indication of a radar error. Ishihara et al. (2006) evaluated the wind accuracy of the Japanese RWP network by comparisons with the numerical weather prediction model profiles, and the RMSDs are around 3 m s−1. Huuskonen et al. (2014) compared the wind profiles observed by EUMETNET with the ERA5 model profiles and set a 5 m s−1 RMSD as a target for acceptable wind observations.
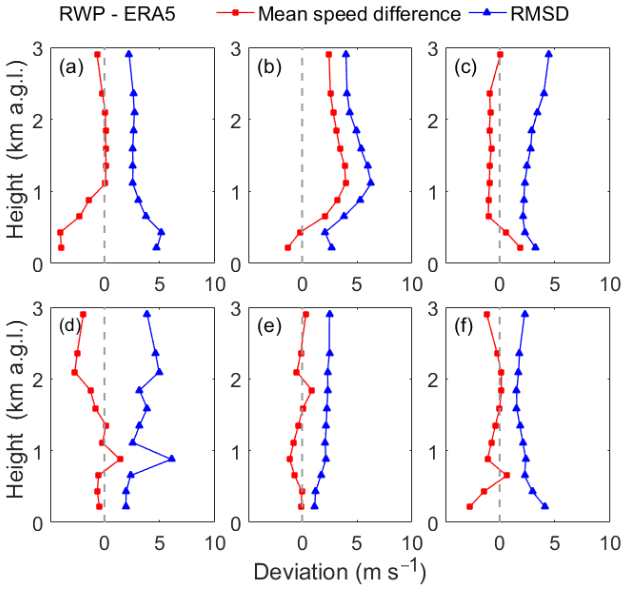
Figure 6Comparison results between RWPs and ERA5 at six RWP stations: (a) Beijing (40∘ N, 116∘ E), (b) Wulumuqi (43∘ N, 87∘ E), (c) Chongqing (30∘ N, 106∘ E), (d) Shanghai (31∘ N, 121∘ E), (e) Zigui (31∘ N, 111∘ E) and (f) Haikou (20∘ N, 110∘ E). The grey, red and blue lines represent the reference line, mean speed difference and root-mean-square difference (RMSD), respectively.
Here, the horizontal wind speed measurements at all levels ranging from 0 to 3 km are used to calculate the MSD and RMSD at each site. Moreover, the magnitude of mean speed difference (MMSD) and RMSD are set to be 4 and 6 m s−1, respectively, which serves as a target for an acceptable criterion. Figure 7 shows the MMSD and mean RMSD from 0 to 3 km for all RWPs, calculated by comparing them with ERA5 wind data. It is seen that most RWPs consistently meet the acceptance criterion of a 4 m s−1 MMSD and a 6 m s−1 RMSD, while a few radars also show larger differences. Moreover, the MMSD and RMSD of the RWP network have a certain spatial difference. According to the average difference in latitude bands (histograms in Fig. 7), the RWPs at 28–32∘ N have a relatively large difference, where the zonal MMSD is larger than 2 m s−1 and zonal mean RMSD is larger than 5 m s−1. The sites with an MMSD greater than 4 m s−1 are 54857, 57494 and 59046; and the sites with an RMSD greater than 6 m s−1 are 52889, 57494, 58448 and 59046. The wind data at these sites have large difference and are not recommended. The large difference may be caused by either hardware or configuration problems, such as the ageing of components. Therefore, it is important to conduct regular maintenance and replacement of aged components. In addition, there are 11 RWP sites which are equipped with radiosonde (i.e. 51463, 54342, 54511, 54727, 54857, 57494, 57516, 58238, 59758, 59948 and 59981).
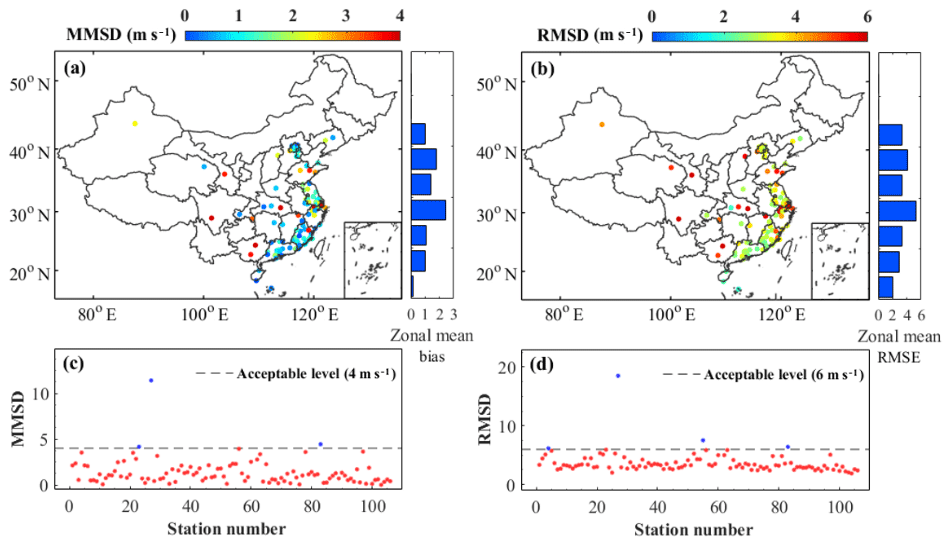
Figure 7Spatial distribution of (a) the magnitude of the mean speed difference (MMSD) and (b) the root-mean-square difference (RMSD) at each station during November 2018 to March 2019; the corresponding histogram represents the average difference in zonal direction; (c) and (d) are corresponding recommended (red dots) and non-recommended (blue dots) sites for (a) and (b), respectively. The MMSD and REMD at each station were derived from the measurements over all levels from 0 to 3 km.
Overall, the availability of the RWP network of China can be evaluated by combining the system performance index and data accuracy. Figure 8 shows the spatial distribution and number of recommended and non-recommended sites. The availability of the RWP network of China is 84 %, and 89 stations are recommended and 17 stations are not recommended. These non-recommended sites include: 16078, 52889, 54752, 54727, 54736, 54857, 57494, 58158, 58365, 58448, 58460, 58474, 58730, 58927, 58933, 59046 and 59431. For the sites with low height coverage or a low data acquisition rate, the data availability can be improved by changing the radar observation modes and increasing radar runtime. But for the sites with a low confidence level or low data accuracy, which is caused by the inversion algorithm or the instrument system, one needs to choose the appropriate optimisation method for specific problems. Some methods on data quality control have been given in previous studies (Holleman, 2005).

Figure 8Recommended and non-recommended sites of the radar wind profiler network of China. The blue dots represent the 89 recommended sites and red dots the 17 non-recommended sites.
4.1 Daily maximum winds
The wind profile data can be used to monitor the diurnal cycle. Figure 9 presents the spatial distribution of diurnal phase and amplitude of wind speed averaged during the period from November 2018 to March 2019 according to mean maximum hourly wind speed within 24 h. The occurrence time of maximum hourly wind speed is marked as early morning (00:00–06:00 China standard time, CST: UTC+8), morning (06:00–12:00 CST), afternoon (12:00–18:00 CST) and evening (18:00–24:00 CST). To highlight the vertical detection capabilities of wind radar, the mean maximum wind speeds at four different heights above ground level (500, 1000, 1500 and 2500 m) are investigated. As shown in Fig. 9a (at 500 m), among the 106 observational sites, the mean maximum wind speed occurs in the morning at 76 sites (about 71.9 %), followed by 12 sites (11.3 %) with peaks in the early morning. On the other hand, only 6 sites (5.5 %) have an afternoon peak, whereas 12 sites (11.3 %) have an evening peak. The story with respect to the diurnal phase and amplitude of the mean maximum wind speed at other heights is almost the same (Fig. 9b–d). In terms of vertical direction, the occurrence timing of the mean maximum wind speed at most stations is consistent, but some stations in northwest China (Wulumuqi, Lanzhou and Qinghai) show a different pattern. Moreover, the amplitude of the mean maximum wind speed at 2500 m height is 2 or 3 times than that at other heights, indicating that the maximum wind speed increases with height. In terms of the spatial pattern, the mean maximum wind speed generally occurs in the morning in the coastal region of eastern China, with a magnitude generally lower than 10 m s−1. By comparison, both early morning and afternoon peaks contribute almost equally to the diurnal cycle in the inland region.
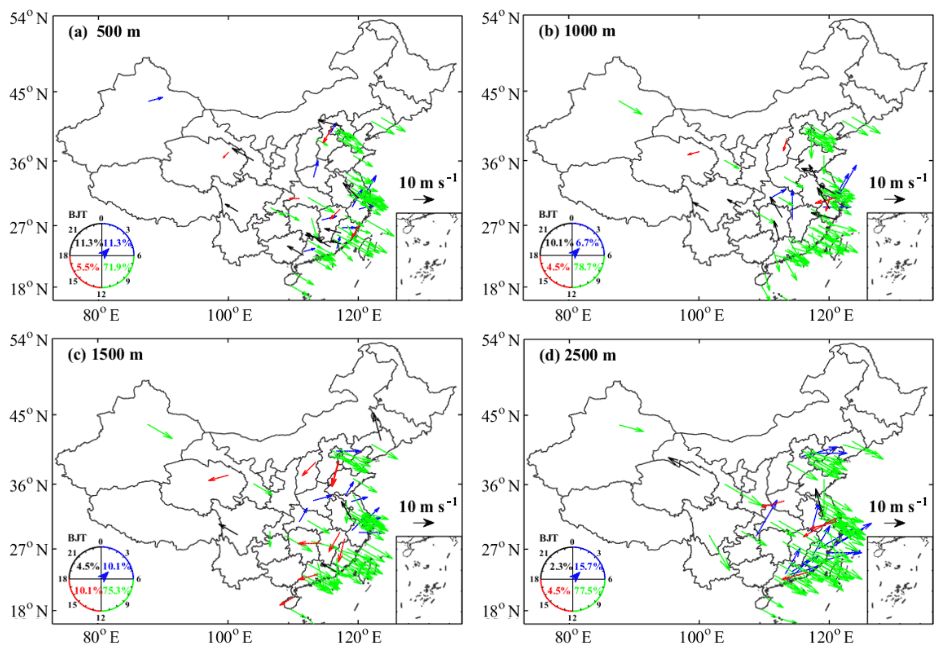
Figure 9Diurnal phase and amplitude of mean maximum wind speed over the period from November 2018 to March 2019 at (a) 500 m, (b) 1000 m, (c) 1500 m and (d) 2500 m above ground level (a.g.l.). The direction in which an arrow points denotes the China standard time (CST) when the maximum occurs (shown on the clock dial in the bottom left corner of each panel) and the arrow length represents magnitudes of mean maximum wind speed. The arrow colour denotes varying diurnal phases: blue (00:00–06:00 CST), green (06:00–12:00 CST), red (12:00–18:00 CST) and black (18:00–24:00 CST).
4.2 Regional wind field analysis
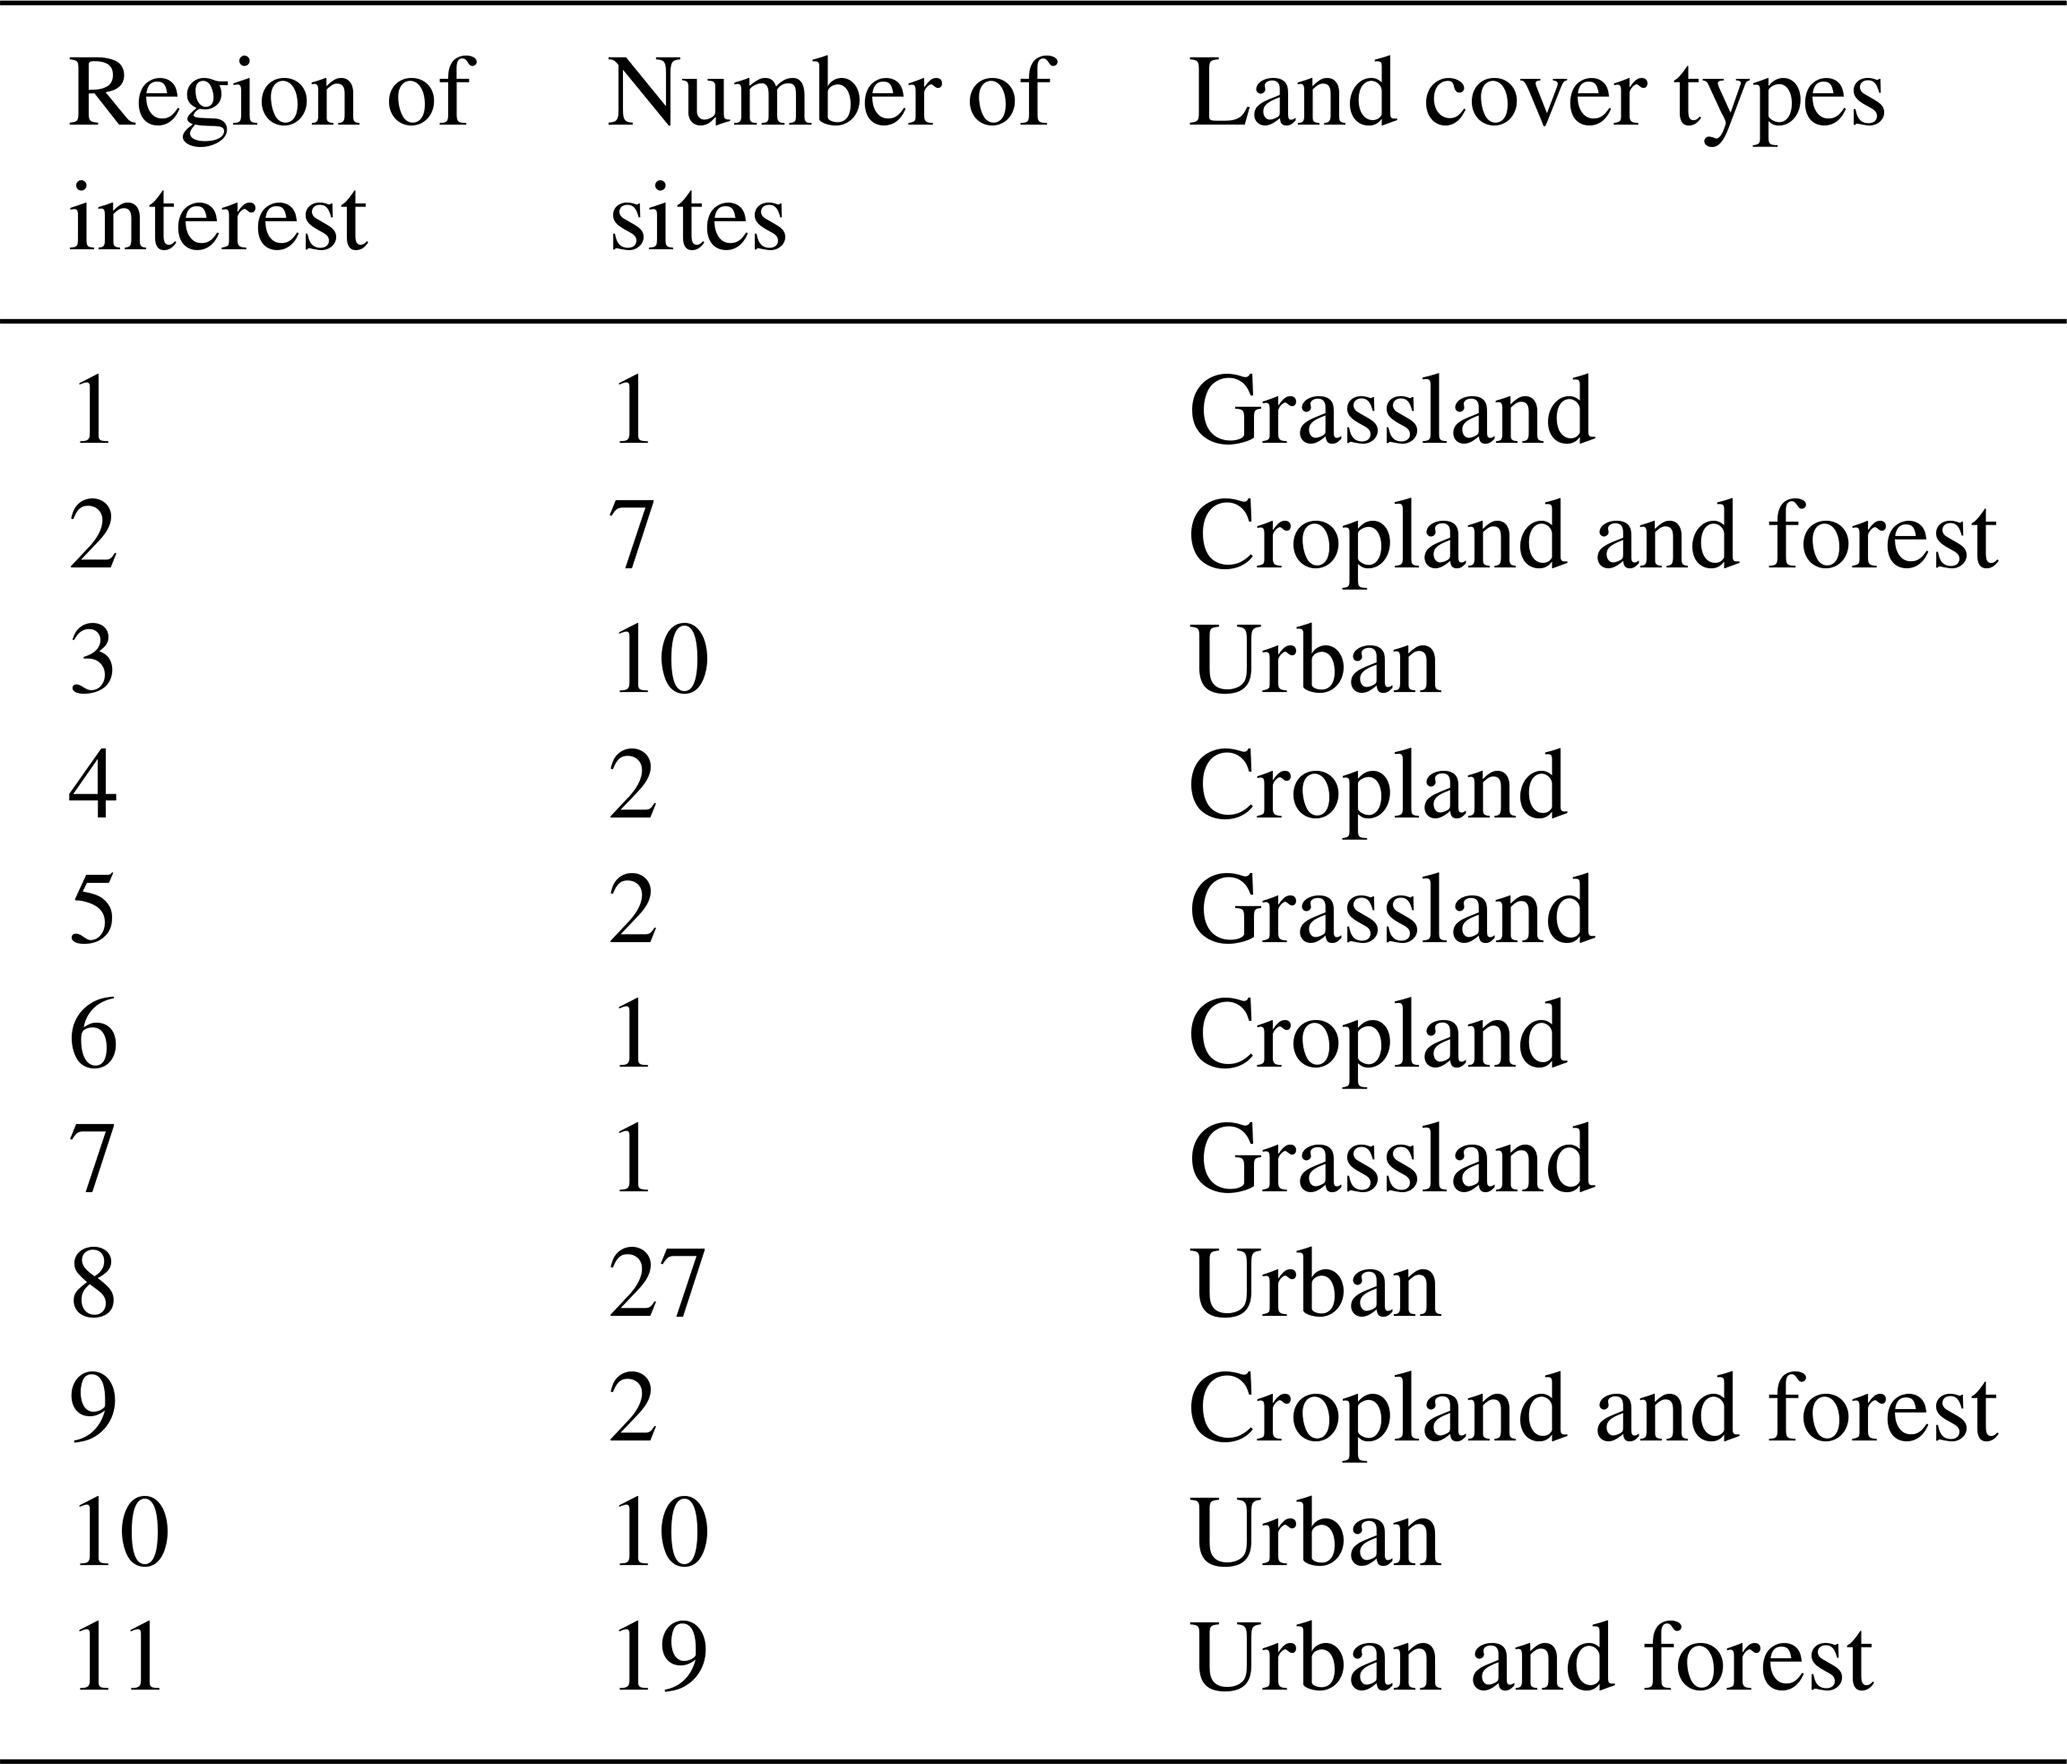
The wind profile data can also be used to investigate the regional wind field. As shown in Fig. 10, there are a total of 11 regions of interest (ROIs) selected for further analysis on the regional wind characteristics according to the spatial distribution of RWP stations as well as land cover (Table 2). The land cover type data are obtained from the Moderate-resolution Imaging Spectroradiometer (MODIS). The MODIS Land Cover product is derived through a supervised decision-tree classification method. The land cover types are divided into 17 classes: 11 natural vegetation classes, 3 human-altered classes and 3 non-vegetated classes (Friedl et al., 2019). Figure 10 shows the atmospheric wind field variation in each ROI at 500 m above ground level during the study period. From the perspective of wind direction, the North China Plain mainly experiences a southwest wind during the study period; the southwest wind at ROIs 3 and 4 accounted for 40.3 % and 48 %, respectively. The south China area is mainly dominated by a northeast wind, such as in ROIs 8, 9, 10 and 11. The distribution of wind direction over central China is more uniform. Western China is dominated by a northwest wind, and the percentage of northwest wind at ROI 1 is 45.8 %. In terms of the spatial pattern wind speed, the wind speed in western China is relatively low. The percentages of wind speed less than 4 m s−1 at ROIs 1, 5 and 7 are 76.2 %, 78.7 % and 83.2 %, respectively. Moreover, the land cover type of ROIs 1, 5 and 7 is grassland. By contrast, the wind speed in the central and eastern regions is significantly large, and 60 % of the wind speed in most ROIs can reach 6 m s−1. Especially in coastal areas, such as in ROIs 4 and 9, 30 % of wind speed is larger than 8 m s−1 over the whole study period.
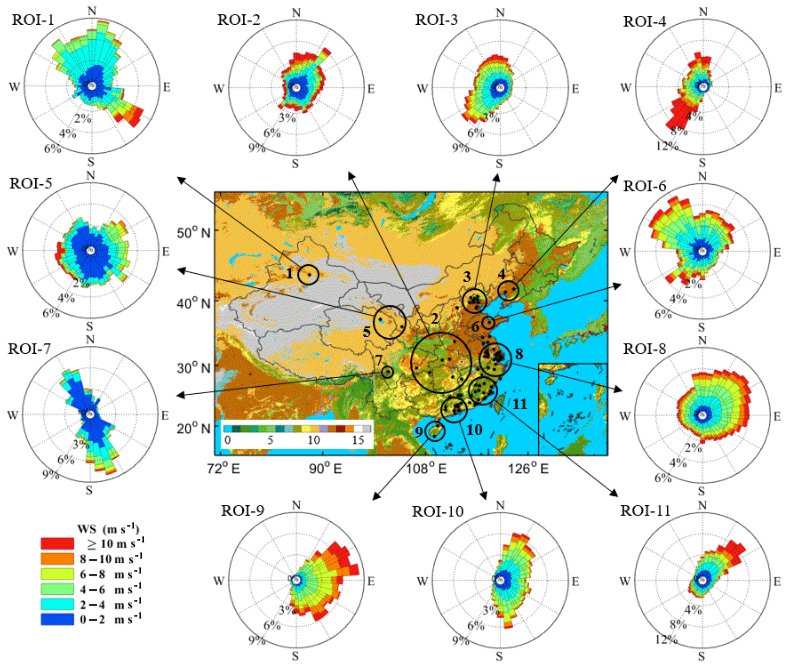
Figure 10Spatial distribution of the statistical results of atmospheric wind fields at 500 m above ground level (a.g.l.) for 11 regions of interest (ROIs). The wind rose plots over the 11 ROIs are calculated from hourly observations of wind direction and wind speed from November 2018 to March 2019. The land cover types 0–16 represent water, evergreen needleleaf forest, evergreen broadleaf forest, deciduous needleleaf forest, deciduous broadleaf forest, mixed forest, closed shrublands, open shrublands, woody savannas, savannas, grasslands, permanent croplands, urban and built-up areas, cropland/natural vegetation mosaic, snow and ice, and barren or sparsely vegetated areas, respectively.
Table 2Statistics of the number of sites and land cover types for the 11 regions of interest (ROIs) in Fig. 10.
In the long run, the accumulation of more wind profile measurements across China, especially in the lowest part of the PBL, will provide a valuable benchmark database for the assessment of wind power potentials and will be useful for numerical weather prediction (Ishihara et al., 2006; Yim et al., 2007). The policymakers will determine whether the wind turbines (60–100 m above ground level) will be installed or not, aided by high-resolution model simulation analyses. Moreover, the real-time wind field data can be used to predict typhoon and sandstorm paths (Ishihara et al., 2006; Huuskonen et al., 2014). The RWP network of China can provide powerful data support for disaster warning and air pollution prevention.
The wind profiles are of great importance to the accuracy of numerical weather prediction models, the prediction of precipitation, the diffusion of air pollution, research on regional climate change and site selection for wind power plants. For the first time, to the best of our knowledge, we reported the height-resolved winds starting from ground surface to as high as 3–10 km, based on the RWP network of China, which consists of more than 100 RWP stations. It can provide the vertical profiles of horizontal wind direction and horizontal wind speed. Then, the availability of the RWP network was investigated regarding the system performance index and data accuracy. The evaluation criteria are that the effective detection height reaches 3 km, the data acquisition rate exceeds 60 % and the data confidence is 100 %. In addition, in terms of data accuracy, the MMSD is better less than 4 m s−1 and the RMSD is less than 6 m s−1. Under this criterion, the availability of the RWP network of China is 84 %, and 89 stations are recommended and 17 stations are not recommended. Finally, the wind profile data have a wide range of applications, such as daily maximum wind detection and regional atmospheric wind field research. This RWP network would serve as a key data source on the spatiotemporal distribution of atmospheric wind field in support of scientific research related to renewable energy, severe weather, climate and climate change in the future.
The radar wind profiler data used in this paper can be provided for non-commercial research purposes upon motivated request (Jianping Guo, Email: jpguocams@gmail.com). The ECWMF dataset can be downloaded from https://doi.org/10.24381/cds.bd0915c6 (ECWMF, 2018). Instructions for use and data download methods can be found on the official website.
The supplement related to this article is available online at: https://doi.org/10.5194/amt-13-4589-2020-supplement.
The study was completed with close cooperation between all authors. JG and BL designed the idea for assessing the radar wind profiler data in China; JG and BL conducted the data analyses and co-wrote the paper; LS, YZ, YM and WG discussed the experimental results, and all coauthors helped reviewing the paper and the revisions.
The authors declare that they have no conflict of interest.
We are very grateful to the China Meteorological Administration for instalment and maintenance of the radar wind profiler observational network.
This research has been supported by the National Key Research and Development Program of China (grant nos. 2017YFC0212600 and 2017YFC1501401) and the National Natural Science Foundation of China (grant nos. 41771399, 41401498, and 41627804).
This paper was edited by Ad Stoffelen and reviewed by two anonymous referees.
Angevine, W. M., White, A. B., and Avery, S. K.: Boundary-layer depth and entrainment zone characterization with a boundary-layer profiler, Bound.-Lay. Meteorol., 68, 375–385, https://doi.org/10.1007/BF00706797, 1994.
Benjamin, S. G., Schwartz, B. E., Szoke, E. J., and Koch, S. E.: The value of wind profiler data in US weather forecasting, B. Am. Meteorol. Soc., 85, 1871–1886. 2004.
Bentamy, A., Queffeulou, P., Quilfen, Y., and Katsaros, K.: Ocean surface wind fields estimated from satellite active and passive microwave instruments, IEEE T. Geosci. Remote, 37, 2469–2486, https://doi.org/10.1109/36.789643, 1999.
Bianco, L., Wilczak, J. M., and White, A. B.: Convective boundary layer depth estimation from wind profilers: Statistical comparison between an automated algorithm and expert estimations, J. Atmos. Ocean. Tech., 25, 1397–1413, https://doi.org/10.1175/2008jtecha981.1, 2008.
Chipilski, H. G., Wang, X., and Parsons, D. B.: Impact of Assimilating PECAN Profilers on the Prediction of Bore-Driven Nocturnal Convection: A Multi-Scale Forecast Evaluation for the 6 July 2015 Case Study, Mon. Weather Rev., 148, 1147–1175, https://doi.org/10.1175/MWR-D-19-0171.1, 2019.
Constantinescu, E. M., Zavala, V. M., Rocklin, M., Lee, S., and Anitescu, M.: Unit commitment with wind power generation: integrating wind forecast uncertainty and stochastic programming (No. ANL/MCS-TM-309), Argonne National Lab. (ANL), Argonne, IL, United States, 2009.
Dibbern, J., Monna, W., Nash, J., and Peters, G.: COST Action 76-final report. Development of VHF/UHF wind profilers and vertical sounders for use in European observing systems, European Commission, 350 pp., 2001.
Dolman, B. K., Reid, I. M., and Tingwell, C.: Stratospheric tropospheric wind profiling radars in the Australian network, Earth Planet. Space, 70, 170, https://doi.org/10.1186/s40623-018-0944-z, 2018.
Dong, B. J., Zhang, Y., Xu, A. L., and Fu, Z. J.: Comparative analysis on wind data from radar wind profiler and balloon sounding, Journal of Yunnan University, 1, 18–25, 2011 (in Chinese).
Draper, D. W. and Long, D. G. An assessment of SeaWinds on QuikSCAT wind retrieval, J. Geophys. Res.-Oceans, 107, 3212, https://doi.org/10.1029/2002JC001330, 2002.
Du, Y., Zhang, Q., Ying, Y., and Yang, Y.: Characteristics of low-level jets in Shanghai during the 2008–2009 warm seasons as inferred from radar wind profiler data, J. Meteorol. Soc. Japan. Ser. II, 90, 891–903, 2012.
ECWMF: ERA5 hourly data on pressure levels from 1979 to present, https://doi.org/10.24381/cds.bd0915c6, 2018.
Fan, J., Yuan, T., Comstock, J. M., Ghan, S., Khain, A., Leung, L. R., Li, Z., Martins, V. J., and Ovchinnikov, M.: Dominant role by vertical wind shear in regulating aerosol effects on deep convective clouds, J. Geophys. Res.-Atmos., 114, https://doi.org/10.1029/2009JD012352, 2009.
Friedl, M., Gray, J., and Sulla-Menashe, D.: MCD12Q2 MODIS/Terra+Aqua Land Cover Dynamics Yearly L3 Global 500m SIN Grid V006 [Data set], NASA EOSDIS Land Processes DAAC, https://doi.org/10.5067/MODIS/MCD12Q2.006, 2019.
Guo, J., Deng, M., Lee, S. S., Wang, F., Li, Z., Zhai, P., Liu, H., Lv, W., Yao, W., and Li, X.: Delaying precipitation and lightning by air pollution over the Pearl River Delta. Part I: Observational analyses, J. Geophys. Res.-Atmos., 121, 6472–6488, https://doi.org/10.1002/2015JD023257, 2016a.
Guo, J., He, J., Liu, H., Miao, Y, Liu, H., and Zhai, P.: Impact of various emission control schemes on air quality using WRF-Chem during APEC China 2014, Atmos. Environ., 140, 311–319, https://doi.org/10.1016/j.atmosenv.2016.05.046, 2016b.
Guo, J., Su, T., Chen, D., Wang, J., Li, Z., Lv, Y., Guo, X., Liu, H., Cribb, M., and Zhai, P.: Declining summertime local-scale precipitation frequency over China and the United States, 1981–2012: The disparate roles of aerosols, Geophys. Res. Lett., 46, 13281–13289, https://doi.org/10.1029/2019GL085442, 2019.
Guo, J., Yan, Y., Chen, D., Lv, Y., Han, Y., Guo, X., Liu, L., Miao, Y., Chen, T., Nie, J., and Zhai, P.: The response of warm-season precipitation extremes in China to global warming: an observational perspective from radiosonde measurements, Clim. Dynam., 54, 3977–3989, https://doi.org/10.1007/s00382-020-05216-3, 2020.
Hersbach, H., Bell, B., Berrisford, P., Hirahara, S., Horányi, A., Muñoz‐Sabater, J., Nicolas, J., Peubey, C., Radu, R., Schepers, D., Simmons, A., Soci, C., Abdalla, S., Abellan, X., Balsamo, G., Bechtold, P., Biavati, G., Bidlot, J., Bonavita, M., De Chiara, G., Dahlgren, P., Dee, D., Diamantakis, M., Dragani, R., Flemming, J., Forbes, R., Fuentes, M., Geer, A., Haimberger, L., Healy, S., Hogan, R. J., Hólm, E., Janisková, M., Keeley, S., Laloyaux, P., Lopez, P., Lupu, C., Radnoti, G., de Rosnay, P., Rozum, I., Vamborg, F., Villaume, S., and Thépaut, J.‐N.: The ERA5 global reanalysis, Q. J. Roy. Meteorol. Soc., 146, 1999–2049, https://doi.org/10.1002/qj.3803, 2020.
Hoffmann, L., Günther, G., Li, D., Stein, O., Wu, X., Griessbach, S., Heng, Y., Konopka, P., Müller, R., Vogel, B., and Wright, J. S.: From ERA-Interim to ERA5: the considerable impact of ECMWF's next-generation reanalysis on Lagrangian transport simulations, Atmos. Chem. Phys., 19, 3097–3124, https://doi.org/10.5194/acp-19-3097-2019, 2019.
Holleman, I.: Quality control and verification of weather radar wind profiles. J. Atmos. Ocean. Tech., 22, 1541–1550, 2005.
Hu, M. and Li, M.: The development and technologic status of wind profiling radar, Scientia Meteorologica Sinica, 30, 724–729, 2010 (in Chinese).
Huuskonen, A., Saltikoff, E., and Holleman, I.: The operational weather radar network in Europe, B. Am. Meteorol. Soc., 95, 897–907, 2014.
Ishihara, M., Kato, Y., Abo, T., Kobayashi, K., and Izumikawa, Y.: Characteristics and performance of the operational wind profiler network of the Japan Meteorological Agency, J. Meteorol. Soc. Japan. Ser. II, 84, 1085–1096, 2006.
Kottayil, A., Mohanakumar, K., Samson, T., Rebello, R., Manoj, M. G., Varadarajan, R., Santosh, K. R., Mohanan, P., and Vasudevan, K.: Validation of 205 MHz radar wind profiler located at Cochin, India, using radiosonde wind measurements, Radio Sci., 51, 106–117, 2016.
Lee, S.-S., Guo, J., and Li, Z.: Delaying precipitation by air pollution over Pearl River Delta. Part 2: model simulations, J. Geophys. Res.-Atmos., 121, 11739–11760, https://doi.org/10.1002/2015JD024362, 2016.
LeMone, M. A., Tewari, M., Chen, F., and Dudhia, J.: Objectively determined fair-weather CBL depths in the ARW-WRF model and their comparison to CASES-97 observations, Mon. Weather Rev., 141, 30–54, 2013.
LeMone, M. A., Angevine, W. M., Bretherton, C. S., Chen, F., Dudhia, J., Fedorovich, E., Katsaros, K. B., Lenschow, D. H., Mahrt, L., Patton, E. G., Sun, J., Tjernström, M., and Weil, J.: 100 Years of Progress in Boundary Layer Meteorology, Meteorol. Monogr., 59, 9.1–9.85, https://doi.org/10.1175/AMSMONOGRAPHS-D-18-0013.1, 2018.
Li, Z., Wang, Y., Guo, J., Zhao, C., Cribb, M. C., Dong, X., Fan, J., Gong, D., Huang, J., Jiang, M., Jiang, Y., Lee, S.-S., Li, H., Li, J., Liu, J., Qian, Y., Rosenfeld, D., Shan, S., Sun, Y., Wang, H., Xin, J., Yan, X., Yang, X., Yang, X., Zhang, F., and Zheng, Y.: East Asian study of tropospheric aerosols and their impact on regional clouds, precipitation, and climate (EAST-AIRCPC), J. Geophys. Res.-Atmos., 124, 13026–13054, https://doi.org/10.1029/2019JD030758, 2020.
Liu, B., Ma, Y., Gong, W., Zhang, M., and Yang, J.: Study of continuous air pollution in winter over Wuhan based on ground-based and satellite observations, Atmos. Poll. Res., 9, 156–165, 2018.
Liu, B., Ma, Y., Guo, J., Gong, W., Zhang, Y., Mao, F., Li, J., Guo, X., and Shi, Y.: Boundary layer heights as derived from ground-based Radar wind profiler in Beijing, IEEE T. Geosci. Remote, 57, 8095–8104, https://doi.org/10.1109/TGRS.2019.2918301, 2019.
Liu, B., Guo, J., Gong, W., Shi, Y., and Jin, S.: Boundary Layer Height as Estimated from Radar Wind Profilers in Four Cities in China: Relative Contributions from Aerosols and Surface Features, Remote Sens., 12, 1657, https://doi.org/10.3390/rs12101657, 2020.
Liu, H., He, J., Guo, J., Miao, Y., Yin, J., Wang, Y., Xu, H., Liu, H., Yan, Y., Li, Y., and Zhai, P.: The blue skies in Beijing during APEC 2014: A quantitative assessment of emission control efficiency and meteorological influence, Atmos. Environ., 167, 235–244, https://doi.org/10.1016/j.atmosenv.2017.08.032, 2017.
Lux, O., Lemmerz, C., Weiler, F., Marksteiner, U., Witschas, B., Rahm, S., Schäfler, A., and Reitebuch, O.: Airborne wind lidar observations over the North Atlantic in 2016 for the pre-launch validation of the satellite mission Aeolus, Atmos. Meas. Tech., 11, 3297–3322, https://doi.org/10.5194/amt-11-3297-2018, 2018.
Lux, O., Lemmerz, C., Weiler, F., Marksteiner, U., Witschas, B., Rahm, S., Geiß, A., and Reitebuch, O.: Intercomparison of wind observations from the European Space Agency's Aeolus satellite mission and the ALADIN Airborne Demonstrator, Atmos. Meas. Tech., 13, 2075–2097, https://doi.org/10.5194/amt-13-2075-2020, 2020.
Miao, Y., Guo, J., Liu, S., Wei, W., Zhang, G., Lin, Y., and Zhai, P.: The climatology of low level jet in Beijing and Guangzhou, China, J. Geophys. Res.-Atmos., 123, 2816–2830, https://doi.org/10.1002/2017JD027321, 2018.
Michelson, S. A. and Bao, J. W.: Sensitivity of low-level winds simulated by the WRF model in California's Central Valley to uncertainties in the large-scale forcing and soil initializatio, J. Appl. Meteorol. Climatol., 47, 3131–3149, 2008.
Molod, A., Salmun, H., and Dempsey, M.: Estimating planetary boundary layer heights from NOAA profiler network wind profiler data, J. Atmos. Ocean. Tech., 32, 1545–1561, 2015.
Nash, J. and Oakley, T. J.: Development of COST 76 wind profiler network in Europe, Phys. Chem. Earth B, 3, 193–199, 2001.
Oakley, T., Nash, J., and Turp, M.: CWINDE project office networking European profilers 1997–2000, Proc. of the MST9 and COST76 Workshop, 525–528, 2000.
Pfahl, S., O'Gorman, P. A., and Fischer, E. M.: Understanding the regional pattern of projected future changes in extreme precipitation, Nature Clim. Change, 7, 423–427, 2017.
Reitebuch, O.: The spaceborne wind lidar mission ADM-Aeolus, Atmospheric Physics, pp. 815–827, Springer, Berlin, Heidelberg, 2012.
Reitebuch, O., Lemmerz, C., Nagel, E., Paffrath, U., Durand, Y., Endemann, M., Fabre, F., and Chaloupy, M.: The airborne demonstrator for the direct-detection Doppler wind lidar ALADIN on ADM-Aeolus. Part I: Instrument design and comparison to satellite instrument, J. Atmos. Ocean. Tech., 26, 2501–2515, 2009.
Rennie, M. and Isaksen, L.: The NWP impact of Aeolus Level-2B winds at ECMWF, ECMWF Technical Memo 864, Shinfield Park, Reading, UK, https://doi.org/10.21957/alift7mhr, 2020.
Schlatter, T. W. and Zbar, F. S. (Eds.): Wind Profiler Assessment Report and Recommendations for Future Use, NOAA, Silver Spring, Maryland, 141 pp., 1994.
Singh, N., Solanki, R., Ojha, N., Janssen, R. H. H., Pozzer, A., and Dhaka, S. K.: Boundary layer evolution over the central Himalayas from radio wind profiler and model simulations, Atmos. Chem. Phys., 16, 10559–10572, https://doi.org/10.5194/acp-16-10559-2016, 2016.
Schmetz, J., Holmlund, K., Hoffman, J., Strauss, B., Mason, B., Gaertner, V., and Van De Berg, L.: Operational cloud-motion winds from Meteosat infrared images, J. Appl. Meteorol., 32, 1206–1225, https://doi.org/10.1175/1520-0450(1993)032<1206:OCMWFM>2.0.CO;2, 1993.
Sun, X. Z.: Atmosphere Remote-Sensing Sounding System-Radar wind profiler, Modern Radar, 1, 1–14, 1994.
van de Kamp, D. W.: Current status and recent improvements to the Wind Profiler Demonstration Network. Preprints, 26th Int. Conf. on Radar Meteorology, Norman, OK, 24–28 May 1993, Amer. Meteorol. Soc., Boston, 552–554, 1993.
Velden, C., Daniels, J., Stettner, D., Santek, D., Key, J., Dunion, J., Holmlund, K., Dengel, G., Breskand, W., and Menzel, P.: Recent innovations in deriving tropospheric winds from meteorological satellites, B. Am. Meteorol. Soc., 86, 205–224, 2005.
Wang, C., Chen, Y., Chen, M., and Shen, J.: Data assimilation of a dense wind profiler network and its impact on convective forecasting, Atmos. Res., 238, 104880, https://doi.org/10.1016/j.atmosres.2020.104880, 2020.
Weber, B. L., Wuertz, D. B., Strauch, R. G., Merritt, D. A., Moran, K. P., Law, D. C., van de Kamp, D. W., Chadwick, R. B., Ackley, M. H., Barth, M. F., Abshire, N. L., Miller, P. A., and Schlatter, T. W.: Preliminary evaluation of the first NOAA demonstration network profiler, J. Atmos. Ocean. Tech., 7, 909–918, 1990.
Williams, P. D. and Joshi, M. M.: Intensification of winter transatlantic aviation turbulence in response to climate change, Nature Clim. Change, 3, 644–648, 2013.
Yang, Y., Yim, S. H., Haywood, J., Osborne, M., Chan, J. C., Zeng, Z., and Cheng, J. C.: Characteristics of heavy particulate matter pollution events over Hong Kong and their relationships with vertical wind profiles using high-time-resolution Doppler lidar measurements, J. Geophys. Res.-Atmos., 124, 9609–9623, 2019.
Yim, S. H., Fung, J. C., Lau, A. K., and Kot, S. C.: Developing a high-resolution wind map for a complex terrain with a coupled MM5/CALMET system, J. Geophys. Res.-Atmos., 112, https://doi.org/10.1029/2006JD007752, 2007.
Zhai, X., Marksteiner, U., Weiler, F., Lemmerz, C., Lux, O., Witschas, B., and Reitebuch, O.: Rayleigh wind retrieval for the ALADIN airborne demonstrator of the Aeolus mission using simulated response calibration, Atmos. Meas. Tech., 13, 445–465, https://doi.org/10.5194/amt-13-445-2020, 2020.
Zhang, Y., Xu, Y., Dong, W., Cao, L., and Sparrow, M.: A future climate scenario of regional changes in extreme climate events over China using the PRECIS climate model, Geophys. Res. Lett., 33, https://doi.org/10.1029/2006GL027229, 2006.
Zhang, Y., Guo, J., Yang, Y., Wang, Y., and Yim, S. H. L.: Vertical wind shear modulates particulate matter pollutions: A perspective from Radar wind profiler observations in Beijing, China, Remote Sens., 12, 546, https://doi.org/10.3390/rs12030546, 2020.