
Abstract
Aim
Cereal-legume intercropping can result in yield gains compared to monocrops. We aim to identify the combination of crop traits and management practices that confer a yield advantage in strip intercropping.
Methods
We developed a novel, parameter-sparse process-based crop growth model (Minimalist Mixture Model, M3) that can simulate strip intercrops under well-watered but nitrogen limited growth conditions. It was calibrated and validated for spring wheat (Triticum aestivum) and spring faba bean (Vicia faba) grown as monocrops and intercrops, and used to identify the most suitable trait combinations in these intercrops via sensitivity analyses.
Results
The land equivalent ratio of intercrops was greater than one over a wide range of nitrogen fertilizer levels, but transgressive overyielding, with total yield in the intercrop greater than that of either sole crop, was only obtained at intermediate nitrogen applications. We ranked the local sensitivities of the individual yields of wheat and faba bean of the whole intercrop under various nitrogen input levels to various crop traits.
Conclusions
The total intercrop yield can be improved by selecting specific traits related to phenology of both species, as well as light use efficiency of faba bean and, under high nitrogen applications, of wheat. Changes in height-related crop traits affected individual yields of species in intercrops but not the total intercrop yield.
Introduction
Intercropping is the practice of growing more than one species in the same place with a substantial overlap between their growing seasons (Willey and Rao 1980a; Willey and Rao 1980b). This is in contrast to the more common practice of growing monocrops, in which only one species is grown in a field during the growing season. Intercropping can have various advantages over growing monocrops. For instance, intercropping often results in an increased abundance of natural enemies of herbivores relative to monocrops (Letourneau et al. 2011), a stronger weed suppression in comparison with monocrops (Liebman and Dyck 1993), higher soil organic carbon and nitrogen (N) contents (Cong et al. 2015), and a higher yield stability (Raseduzzaman and Jensen 2017). Yield advantages of intercrops can occur if the growth of at least one of the species in the intercrop is less inhibited due to the combined effect of interspecific and intraspecific competition than it would be due to intraspecific competition when grown as monocrop (Klimek-Kopyra et al. 2013). This can occur if there is sufficient niche differentiation between the species in the intercrop (Jensen 1996; Li et al. 2020; Loreau 2010; Malezieux et al. 2009; Tilman 2020; Yahuza 2011).
Yield advantages of intercropping over monocrops can be substantial. One commonly used index to quantify the yield advantage of an intercrop over a monocrop is the land equivalent ratio LER (De Wit 1960; Willey and Rao 1980b). For an intercrop of two species, LER is defined as the sum of the partial land equivalent ratios of each species (pLER1 and pLER2, where the subscripts 1 and 2 refer to the species in the intercrop). The partial land equivalent ratio of a species is defined as the ratio of the yield of this species in an intercrop with the other species to the yield that is obtained in the monocrop, such that the LER is given by:
where Yic, 1 and Yic, 2 are the yields (weight per unit of area) of species 1 and 2 grown in an intercrop; Ymc, 1 and Ymc, 2 are the yields of species 1 and 2 obtained when they are grown as monocrops. If the LER is larger than 1, the land area that is required to obtain a certain yield with two monocrops is larger than in an intercrop. Meta-analyses report average LER values for 1,32 for maize-soybean (Xu et al. 2020), 1.29 for intercrops with maize (Li et al. 2020), 1.17 for cereal-legume intercrops (Yu et al. 2016) and, for a broader range of species, 1.30 (Martin-Guay et al. 2018). The LER is often used to quantify whether or not two species yield more in an intercrop than if these species would be grown as two separate pure cultures, but a LER > 1 does not necessarily indicate that the total yield of the intercrop is higher than the highest yielding monocrop; i.e., that transgressive overyielding (Cardinale et al. 2007; Fridley 2001; Loreau 2010). To quantify whether the intercrop confers an advantage in terms of total yield relative to a monocrop of the highest yielding species in that that intercrop, the transgressive overyielding index (TOI) should be used (Cardinale et al. 2007; Yu 2016):
where the max() function takes the maximum of yields of both species that would be obtained in a monocrop, and, as above, Y is the yield, in intercrop (subscript ic) and monocrop (subscript mc), for the two species (1 and 2).
Cereal-legume intercrops are an example of an intercropping system with a clear potential for niche differentiation. While cereals take up inorganic nitrogen (NO3−, NH4+) from the soil to fulfil their nitrogen demands, legumes fulfill a large part of their nitrogen demand by fixing atmospheric nitrogen (N2). Consequently, the cereal plants experience less competition for inorganic nitrogen from a legume neighbor than from a neighbor of its own species. Yet, how advantageous this reduced competition for nitrogen is, depends on nitrogen availability in the soil, and hence the nitrogen input level. Furthermore, cereal and legume species in an intercrop still compete for other resources like water (Ozier-Lafontaine et al. 1998), solar radiation (Keating and Carberry 1993) and nutrients other than nitrogen. This remaining competition could substantially reduce the advantages of complementarity for nitrogen acquisition of growing these species together. In an intercrop, the extent of interspecific competition for these other resources is determined by differences in various crop traits between the two species. For example, differences in canopy structure and crop height (Gou et al. 2017a; Gou et al. 2017b; Keating and Carberry 1993; Kropff 1993; Pronk et al. 2003), root system architecture (Corre-Hellou et al. 2007; Ozier-Lafontaine et al. 1998), and nutrient uptake capacity (Corre-Hellou et al. 2006) substantially affect the competitive ability of one species against the other one. Additionally, management decisions like row configuration, plant density, fertilization amounts and timing, as well as sowing dates and densities can also play a role in the interspecific competition (Yu et al. 2015). All these variables affect interspecific competition simultaneously and, therefore, yield, TOI, and LER. Hence, a system approach is essential to study a cereal-legume system.
Crop growth models allow a system approach to the evaluation of intercropping systems. These process-based models can be parametrized and applied to a variety of conditions and thus allow evaluating the performance of cereal and legume species with a wide range of traits in monocrops and intercrops grown under different pedo-climatic conditions and nitrogen availabilities. The extensive analysis of the combined effects of crop traits and pedo-climatic conditions made possible by a model are a stepping-stone towards the development of varieties better suited for applications in intercrops. Nevertheless, only few crop models have been developed to simulate intercropping systems. Examples are APSIM (Keating et al. 2003), CERES (Hoogenboom et al. 2017; Ritchie and Otter 1985) and STICS (Brisson et al. 2003). Even for these models, applications to intercrops are few. For some examples, see Brisson et al. (2004) and Corre-Hellou et al. (2009) for STICS; Carberry et al. (1996), Chimonyo et al. (2016), Knörzer et al. (2011b), Weih et al. (2019), and Berghuijs et al. (2019) for APSIM; Knörzer et al. (2011b) and Knörzer et al. (2011a) for the model CERES. In the case of APSIM, the model was found to have limited capabilities to simulate cereal-legume intercrops of wheat-faba bean (Berghuijs et al. 2019; Weih et al. 2019) and wheat-fieldpea (Knörzer et al. 2011b), because the competitive ability of one species in an intercrop over the other was overestimated. Furthermore, the aforementioned models exclusively consider homogeneously mixed system and do not account for the heterogeneity of light capture in strip intercropping systems. A strip intercrop is defined as an intercrop, in which the species are grown in separate strips consisting of one or more crop rows.
Aside for the geometric arrangement of the plants, simulating intercrops with these models can be challenging, because they contain a large number of parameters. The uncertainties in the estimates of these parameters are large given the set of measurements typically available from most field experiments. This makes it difficult to use them to simulate existing intercropping systems and determine which combinations of, for instance, a cereal and a legume cultivar result in yield advantages.
A minimalist modelling approach can reduce the uncertainties inherent in parameter estimation. Moreover, a limited number of parameters makes it easier to adjust the model for other combinations of species in an intercrop grown under different conditions (Van der Werf et al. 2007). Some minimalist models have been developed for strip intercrops of wheat-maize under potential growth conditions (Gou et al. 2017b; Liu et al. 2017) and water limited growth conditions (Tan et al. 2020). Nevertheless, to the best of our knowledge, there are currently no crop growth models for any species to simulate strip intercrops grown under nitrogen-limited growth conditions. In this study, we developed, calibrated, and validated a process-based minimalist model (M3: Minimal Mixture Model). We aimed to address the need for a model that is suitable for strip intercropping and accounts for nitrogen limitation, while requiring as few parameters as possible, while keeping the model suitable for making simulations that are useful for making predictions under actual field conditions. M3 explicitly describes intra-and inter-specific interactions typical of strip intercrops and relies on a limited number of parameters, which have clear bio-physical meanings. It aims to simulate cereal-legume intercrops explicitly considering, amongst others, nitrogen limited growth and row configuration. The model is used to answer the following research questions, of relevance for management and variety choice and breeding: 1) for which nitrogen input levels is the total yield of a cereal-legume strip intercrop higher than the monocrop yield of any of the species present in this intercrop? 2) which crop traits affect the total grain yield of a strip cereal-legume intercrop the most? 3) which crop traits affect the individual yields of the cereal and the legume in a cereal-legume strip intercrop the most? 4) how does the nitrogen input level influence which of the crop traits affect grain yields the most? In the remaining sections, we first describe the development of M3 and its calibration and validation based on data of monocrops and intercrops of spring wheat (Triticum aestivum) and spring faba bean (Vicia faba) grown in Wageningen (The Netherlands). Finally, we present the results of local and global sensitivity analyses to answer the previously stated research questions.
Materials and methods
Model description
General overview M3
M3 simulates the daily biomass production and its partitioning over plant organs of either one crop species (monocrop) or two crop species (intercrop) that have partially or fully overlapping growing seasons. The state variables of the model are i) the leaf area index (i.e., the projected leaf are per unit ground area; Li(t); m2 leaf m/2 ground), ii) the total aboveground biomass (Bi(t); kg dry matter m−2 ground), iii) the storage organ dry matter (Yi(t); kg dry storage organ matter m−2 ground), iv) crop height (Hi(t); m), v) the temperature sum from sowing (Si(t); °C d), vi) the crop nitrogen amount (Nc, i(t); kg N m−2 ground), and vii) the soil mineral nitrogen amount in the rooting zone (Ns(t); kg mineral N m−2 ground). The subscript i refers to the crop species. In the remainder of this manuscript, when necessary, it is replaced by “w” or “f”, in order to indicate whether it refers to wheat or faba bean.
M3 considers the joint effects of two potential limitations to plant growth: photosynthetically active radiation and nitrogen, explicitly describing the light interception by the crops and the soil and plant nitrogen dynamics, and their effects on crop growth. The focus on nitrogen stems from the pivotal role of nitrogen availability for plant growth and the niche differentiation typical of a legume-cereal intercrop. Conversely, M3 does not simulate the effect of water stress on plant growth, thus implicitly assuming that the plants are well-watered throughout the season in which drought stress was prevented. In line with this assumption, all experiments that were used to calibrate and validate M3 were irrigated. Plants extract resources, nitrogen in particular, from the rooting zone i.e. the soil layer where most of the roots are located. The depth of this zone is assumed the same for both crop species, and characterized by horizontally and vertically uniform conditions. Given the lack of information on root distribution in most field experiments, this depth is assumed constant throughout the growing season.
M3 calculates daily how much photosynthetic active radiation is intercepted by either of the two species in an intercrop or by a single species in a monocrop. From that, M3 calculates the potential daily biomass production (i.e., the production in the absence of water or nutrient shortages, pest and diseases or other growth reducing factors) (Van Ittersum and Rabbinge 1997) of each species.
Subsequently, M3 calculates for each species the demand for inorganic nitrogen. This demand for nitrogen is the amount of nitrogen that needs to be taken up by the plant in order to sustain a nitrogen concentration in the tissues that would be more than enough to enable maximum performance. This concentration is referred to here as the maximum nitrogen concentration of the crop (Justes et al. 1994; Stöckle and Debaeke 1997); see Fig. 1 for a schematic overview. Legumes can obtain a fraction of their demand by nitrogen fixation. If there is enough soil mineral nitrogen in the soil to meet the demand of a species, that species takes up an amount of nitrogen equal to that demand. If its demand cannot be met, the species takes up all nitrogen it has access to. If the crop nitrogen concentration in the plant drops below a critical crop nitrogen concentration (Greenwood et al. 1990), the actual daily biomass production is reduced relative to the potential daily biomass production (Fig. 2). Note that the maximum nitrogen concentration is larger than the critical nitrogen concentration, which allows M3 to consider that crops can take up more nitrogen then they need to reach their maximum relative growth rate (Greenwood et al. 1990; Justes et al. 1994; Van Wijk et al. 2003; Ågren 1988; Ågren and Weih 2020). If the crop nitrogen concentration drops below a so-called minimum nitrogen concentration, the actual daily biomass production is reduced to zero. Even if the plants are grown under conditions in which they can fulfill their nitrogen demand throughout their growing season, the crop nitrogen concentration still decreases over time, because the leaf:stem weight ratio decreases over time and stems maintain lower nitrogen concentrations than leaves (Greenwood et al. 1990; Justes et al. 1994). M3 considers this nitrogen dilution by assuming empirical power relationships between the aboveground dry matter and the minimum, critical and maximum nitrogen concentrations; these relationships are often referred to as “dilution curves” (Justes et al. 1994). After calculation of the newly produced biomass for a species, the newly created biomass is distributed over the leaves, storage organs, and other plant organs of that species.

Schematic representation of nitrogen dilution curves (Greenwood et al. 1990; Justes et al. 1994; Stöckle and Debaeke 1997) of the maximum (νmax, i(t)), critical (νcrit, i(t)) and minimum nitrogen concentrations (νmin, i(t)) with aboveground dry crop biomass. At very low biomasses, the maximum, critical and minimum nitrogen concentrations are equal to νmax, 0, i, νmax, 0, i ∙ fcrit, i, and νmax, 0, i ∙ fmin, i respectively. At higher biomasses, the curves are described by a power law. The nitrogen demand Di(t) for a given biomass Bi(t) is calculated as the difference between the amount of nitrogen that would result to the maximum nitrogen concentration for that biomass, νmax, i(t) ∙ Bi(t)

Schematic representation of the relationship between the growth reduction factor due to nitrogen stress (σN, i(t)) and the crop nitrogen concentration. The growth reduction factor is 0 if the crop nitrogen concentration is smaller than the minimum nitrogen concentration νmin, i(t). For nitrogen concentrations between the minimum and the critical nitrogen concentration νcrit, i(t), the growth reduction factor increases from 0 to 1. If the crop nitrogen concentration is higher than νcrit, i, the nitrogen growth reduction factor remains constant at 1
Finally, M3 calculates daily biomass loss, and the accompanying nitrogen loss, due to leaf senescence. Re-allocation is considered by assuming the nitrogen concentration of dying leaves equals the minimum nitrogen concentration. In parallel, M3 defines the temporal evolution of phenological stage, leaf area index and plant height.
The equations describing the temporal evolution of the state variables are justified in the next sections. The model was implemented in the C# programming language (Hejlsberg et al. 2010) within the .NET 4.6.1 framework (Microsoft Corporate). The dynamics of the key variables is forced with observed meteorological data and solved numerically using an explicit Euler scheme with a daily time step (i.e., Δt = 1 d). The source code will be published on the website of the EU Horizon 2020 project Diversify (https://www.plant-teams.eu/).
The remaining part of this section describes M3 in detail.
Simulation of developmental stage
Temperature accumulation drives phenological phenomena like dry matter partitioning, flowering, and grain filling. Hence, temperature sum is calculated. The rate of increase of the temperature sum for crop i, Si, from the date of sowing is calculated as (Van der Werf et al. 2007):
where T(t) is the temperature (°C) at time t; and Tb, i is the base temperature (°C) of species i, i.e., the threshold temperature below which no increase in temperature sum occurs. The temperature sum from emergence is used to calculate the development stage δi(t) as:
where Se, i, Sa, i and Sm, i are the temperature sums required to transition from sowing to emergence, emergence to anthesis and anthesis to maturity, respectively. δi(t) ranges between 0 and 2: it is 0 until emergence, 1 at anthesis and 2 after physiological maturity (Supit and Hooijer 1994). Anthesis refers to 50% flowering in both wheat and faba bean. Figure 3 shows eq. 4 graphically.

Schematic overview of the relationship between development stage and temperature sum from sowing (°C d)
Simulation of leaf area index
The leaf area index of species i, Li(t), changes in time as the net result of leaf biomass growth, driven by light and nitrogen availability, and senescence:
where σN, i(t) is a factor between 0 and 1 that accounts for a reduction of crop growth of species i at time t as a result of nitrogen limitation (i.e., if the crop nitrogen concentration is below its critical nitrogen concentration), which will be further specified. Sla, i is the specific leaf area (m2 leaf kg−1 leaf) of species i. fL, i(t) is the fraction of newly produced biomass of species i allocated to the leaves at time t. Ppot, i(t) is the rate of total dry matter production of species i (kg m−2 d−1), which is calculated as:
where ηi is the light use efficiency of photosynthetic active radiation (PAR) by species i. fp is the fraction of photosynthetic active radiation (PAR) in the global radiation (J J−1, assumed to be 0.5 (Van Oijen and Leffelaar 2008)). fint, i(t) is the fraction of global radiation that is intercepted by species i at time t. I0(t) is the global radiation (J radiation m−2 land d−1) at time t. μi(t) is the relative mortality rate of leaf biomass (d−1). The calculation of fint, i(t) largely follows the radiation interception model described by Gou et al. (2017a). This model takes into account the light distribution in a mixed canopy with species grown in strips, whereby the strip width, the plant height and the leaf area index per species are accounted for using algorithms first derived by Goudriaan (1977) and Pronk et al. (2003). A detailed description can be found in Supplementary Text S1.
The calculation of the biomass partitioning to leaves in M3, fL, i(t), follows the approach of the Yield-SAFE model (Van der Werf et al. 2007). Until species i reaches the developmental stage δi(t) = d1, i (see equation 4), fL, i(t) has a constant value fL, 0, i. After this developmental stage has been reached, fL, i(t) decreases linearly with development until it reaches the value 0 at developmental stage δi(t) = d2, i. Beyond this development stage, no more newly produced biomass is allocated to the leaves. fL, i(t) is calculated as:
For the relative mortality rate μi(t), M3 assumes that senescence in species i takes place after anthesis (δi(t) > 1) and above a threshold temperature Tsen, i. Above this temperature, the rate of mortality due to leaf senescence increases with temperature:
Simulation of the aboveground biomass
The rate of change of the aboveground dry matter is calculated as:
which combines the production from equation 5 and the loss from equation 8. M3 assumes that only leaf tissue can die within the growing season: hence, the mortality rate of leaf dry matter equals the mortality rate of total aboveground dry matter.
Simulation of storage organ weights
The growth rate of the dry matter of the storage organs of species i (Yi(t)) is calculated as:
where fy, i(t) is the fraction of newly produced biomass that is partitioned to the storage organs of species i at time t. Until a development stage δi(t) = d3, i (equation 4) has been reached, no biomass is partitioned to the storage organs. d3, w refers to the development state at which floral initiation takes place. d3, f refers to the development state where the first flowers are initiated. Subsequently, the fraction of newly produced biomass that is assigned to the storage organs increases linearly with δi(t) until the development stage δi(t) = d4, i is reached. After that, all newly produced biomass is partitioned to the grains and, if d4, i < d2, i (and consequently fL, i(t) > 0), also to the leaves (Fig. 4). In summary,

Schematic representation of the relationship between changes in partitioning fractions to the leaves (“Leaf”), storage organs (“Stor.”), and remaining aboveground organs (“Rem.”) and development state (equation 7 and 11). fL, 0 is the partitioning fraction of newly produced biomass to the leaves from emergence until δi(t) = δ1, i As there is no biomass assigned to the storage organs at that stage, the fraction of biomass assigned to the remaining organs at emergence is 1 − fL, 0
Simulation of crop height
M3 follows the model of Gou et al. (2017b) by assuming that the height growth rate of species i is proportional to the effective temperature (difference between T(t) and Tb, i) and that the height asymptotically approaches a maximum height Hm, i following a logistic growth trajectory in thermal time:
where rh, i is the temperature sensitive relative growth rate of height growth (°C−1 d−1) of species i.
Simulation of soil and crop mineral nitrogen
Nitrogen dynamics of the soil-plant system is a complex process. In order to keep the number of parameters low, M3 adopts a number of simplifying assumptions similar to the LINTUL3 model (Shibu et al. 2010). M3 assumes that all inorganic nitrogen that is applied as fertilizer is available for uptake by each crop species and that the net mineralization rate is constant throughout the growing season. In reality, mineralization rate is temperature dependent (Kirschbaum 1995; Kätterer et al. 1998). However, no large seasonal change in mineralization rate are expected, because we only simulate spring crops. So, the range of possible daily temperatures is limited (Eckersten et al. 2010). M3 then calculates the rate of change of the soil mineral nitrogen as the difference between the two source terms, the addition of nitrogen to the soil by fertilization application and the net mineralization, and one loss term, the removal of soil mineral nitrogen by crop uptake:
where frecov is the recovery fraction, i.e., the fraction of mineral nitrogen in the fertilizer that is not lost due to volatilization and leaching; it is set to 0.7 (Wolf 2012). F(t) is the amount of mineral nitrogen that is applied at time t (kg N m−2 d−1). M is the mineralization rate (kg N m−2 d−1); we determined its value based on experimental data as the ratio of an assumed amount 25 kg N ha−1 that was mineralized during the growing season (Gou et al. 2017c) and the mean of the length of the spring wheat growing season (148 d), leading to M = 1.69 · 10−5 kg N m−2 d−1. \( \sum \limits_j{U}_{\mathrm{j}}(t) \) is the sum of the nitrogen uptake rates of all species in the intercrop system (kg N m−2 d−1). The calculation of uptake rates will be specified in the next section.
The change in crop nitrogen amount is simulated as:
where Ui(t) is the uptake rate of species i (kg N m−2 d−1). Φi(t) is the amount of N2 fixation at time t (kg N m−2 d−1). Both Ui(t) and Φi(t) will be further specified. μN(t) is the nitrogen loss rate (kg N m−2 d−1) of species i at time t, which will also be further specified.
Calculation of the plant nitrogen uptake and use
Four key nitrogen crop concentrations are used in M3 (Fig. 1): they are all expressed in kg N kg−1 aboveground dry weight. The actual nitrogen concentration νi(t) is the crop nitrogen concentration at time t. The maximum nitrogen concentration νmax, i(t) is the crop nitrogen concentration above which species i does not take up any nitrogen from the soil at time t. The critical nitrogen concentration is the crop nitrogen concentration νcrit, i(t) above which the plant can maintain its potential growth (i.e., σN = 1; see equations 5, 9, and 10). If νi(t) is lower than νcrit, i(t), the actual biomass production is smaller than the potential biomass production (σN(t) < 1). If νi(t) is also lower than the minimum nitrogen concentration νmin, i(t), the biomass growth is completely halted (σN = 0) (Fig. 2). M3 calculates the crop nitrogen concentration νi(t) as:
In order to calculate νmax, i(t), νcrit, i(t), and νmin, i(t), M3 applies three nitrogen dilution curves. Previous dilution curves (Greenwood et al. 1990; Justes et al. 1994; Stöckle and Debaeke 1997) were defined for monocrops. However, in strip intercrops each species is grown on a fraction of the land. Consequently, the aboveground dry matter term in nitrogen dilution curves for a species in a strip intercrop should be expressed in aboveground dry weight per unit of land on which this species is grown. This variable is obtained from the biomasses in the model, which are expressed in kg per unit area of the system as a whole, by multiplying the biomass of that species with the inverse of the fraction of land on which this species is grown. This results in the following nitrogen dilution curves:
where are the βcrit, i, βmax, i, and βmin, i are dimensionless shape exponents. νmax, 0, i (kg N kg−1 aboveground dry matter) is the maximum crop nitrogen concentration at low biomass (in this study, we assumed a biomass less than 1000 kg ha−1) for which the maximum nitrogen concentration is biomass independent (Justes et al. 1994; Stöckle and Debaeke 1997). fcrit, i and fmin, i (both <1) are the ratios of the critical and minimum concentration at these biomasses to νmax, 0 respectively. The parameters Bmax, i, Bcrit, i, and Bmin, i are the aboveground biomasses for which, respectively, the maximum, critical and minimum nitrogen contents equal to 1, in case the model would not assume constants values for these nitrogen contents at low biomasses (i.e. νmax, 0, i, fcrit · νmax, 0, i, and fmin · νmax, 0, i). ℓi is the strip width of species i and ℓj is the strip width of the second species in the intercrop. In monocrop of species i, ℓj = 0 and, therefore, the ratio \( \frac{\ell_{\mathrm{i}}+{\ell}_{\mathrm{j}}}{\ell_{\mathrm{i}}} \) equals 1. Figure 1 shows the nitrogen dilution curves schematically.
The nitrogen demand Di(t) (kg N m−2 d−1) of each species i in the system is calculated as:
where tc is a relative rate (d−1) equal to 1 d−1.
Whether the crop nitrogen demand can be met depends on the soil mineral nitrogen supply, the nitrogen demand of all species in the system, and their capability to fix nitrogen. M3 assumes that each species can fix a fraction ffix, i of its demand from N2 in the atmosphere (Wolf 2012). M3 calculates rate of nitrogen fixation as:
ffix, i equals 0 for species unable to fix N along this pathway. The extent to which faba bean obtains nitrogen from fixation relative to obtaining nitrogen from the soil varies substantially. A meta analysis of 18 studies conducted in different parts in the world (Jensen et al. 2010) showed that the fraction of shoot nitrogen obtained from fixation varies from 0.34 to 0.88 in fertilized field trials and from 0.44 to 0.99 in unfertilized field trials. It has also been shown in pea that the fraction of fixed nitrogen can vary in time (Corre-Hellou et al. 2006; Liu et al. 2011) and that it can be both positively (Ghaley et al. 2005) and negatively affected by fertilizer input (Corre-Hellou et al. 2006). Given these large uncertainties, we decided to assume ffix, f to be a constant and set it equal to 0.8 (Wolf 2012), which falls within the range of values reported by Jensen et al. (2010).
All species have to fulfil the remaining part of their demand nitrogen uptake from the soil. This nitrogen demand from the soil Dsoil, i(t) is calculated as:
M3 daily splits the soil mineral nitrogen into two pools for species i and j, which both contain a fraction of the total amount of soil mineral nitrogen (facN, i(t) and facN, j(t)). These fractions are determined by the transpiration rate of species i relative to species j. The transpiration rate τ(t) (m3 H2O m−2 soil) of species i is calculated as (Allen et al. 1998; Tan et al. 2020):
where σw, i(t) is the fraction of reduction of growth and transpiration due to water stress of species i. Ktr, i(t) is the potential transpiration coefficient of species i at time t; this is the ratio of the potential transpiration rate of crop i to a reference crop as defined by the FAO (Allen et al. 1998). E0(t) is the reference evapotranspiration rate (m3 H2O m−2 ground d−1) at time t. It is assumed that σw, i(t) = σw, j(t) = 1 (no water stress, in line with the experimental setup used for model calibration and validation) and that Ktr, i(t) = Ktr, j(t). Given these assumptions, facN, i(t) is given by:
If species i is grown in a monocrop, fint, j(t) = 0; otherwise fint, j(t) is the fraction of light interception by the second species in the intercrop.
The nitrogen uptake of species i equals its nitrogen demand from the soil, if that is lower than the soil mineral nitrogen that is available to this species. If this is not the case, each species takes up all soil mineral nitrogen that they have access to:
Each day the reduction factor of biomass production is calculated as a piecewise linear function of the plant nitrogen concentration at that time:
where biomass production is completely inhibited if σN(t) = 0, i.e., if νi(t) ≤ νmin, i(t). Conversely, the biomass production is equal to the potential production rate if σN(t) = 1 (Fig. 2).
Crop nitrogen loss
M3 assumes that crops lose nitrogen via leaf senescence while the senescence of other plant organs is negligible. M3 considers that the plants minimize this nitrogen loss by nitrogen retranslocation from senescing leaves to other plant organs, so that the nitrogen concentration of senesced leaves is νmin, i(t). As such, M3 calculates the rate of nitrogen loss μN (see equation 14) as:
We note however that there is a large variability in the residual nitrogen in the senesced tissues, because cultivars can differ in the extent to which they retain chlorophyll after anthesis and, therefore, nitrogen in their leaves (Thomas and Howarth 2000). Nevertheless, replacing νmin, i(t) with ν(t) in equation 26 (i.e., assuming no retranslocation) has almost no effect on the aboveground dry weight, leaf area index, and yield (data not shown).
Initialization of state variables
Each M3 simulation starts at sowing date ts, defined with reference to the species of the intercrop that is sown the earliest. At this date, each of the state variables is set equal to 0, with the exception of the soil nitrogen amount at the sowing date Ns(ts), which is set equal to an initial amount of nitrogen Ns, 0:
Once the crop emerges (Si(t) = Se,i, t = te.i), the other state variables are set to values larger than 0. The crop height is set equal to an initial value H0, i:
M3 assumes that each plant of crop species i has a certain leaf area per plant A0, i (m2 leaf plant−1) at the time of emergence. The initial leaf area at the day of emergence is calculated from this leaf area and the plant density (plant m−2 ground) ρi:
M3 also assumes that the aboveground dry matter of crop species i at the day of emergence consists entirely of leaves. Therefore, the aboveground dry matter is calculated as:
The initial amount of nitrogen in the crop as:
Field trial data
We used data from three experiments to calibrate and validate M3 for simulating growth and partitioning of light and nitrogen in mixtures of wheat. Experiment 1 and 2 were used to calibrate M3, while experiment 3 was used for validation. The experiments were carried out in different years in Wageningen, the Netherlands (51° 59′ 24” N, 5° 39′ 0″ E) and provided within-season observations of leaf area index and total aboveground dry matter. More details on these experiments can be found in Supplementary Tables S1 (Boons-Prins et al. 1993; Kropff 1989), S2 (Gou et al. 2017a; Gou et al. 2016), and S3 (Wang et al., unpublished data). From experiment 1, we used the control treatment monocrops of faba bean (cv. Monica) as monocrop (Boons-Prins et al. 1993; Kropff 1989). From experiment 2, we used the monocrop treatment for spring wheat (cv. Tybalt) (Gou et al. 2017a; Gou et al. 2016). Experiment 3 consisted of both monocrops and intercrops of spring wheat (cv. Nobless) and faba bean (cv. Fanfare) (Wang et al., unpublished data). Both species were grown within 1.5 m wide strip widths, with 6 rows per strip. During each experiment, irrigation was applied to avoid drought stress. The total amount of nitrogen applied as fertilizer was 20 kg N ha−1 for faba bean in experiment 1. In experiment 2, 159 kg N ha−1 in 2013 and 172 kg N ha−1 in 2014 for wheat. In experiment 3, 125 kg N ha−1 for wheat monocrops and 20 kg N ha−1 for faba bean monocrops. In the intercrop treatment in experiment 3, the total amount of nitrogen that was applied to the wheat strips was 125 kg N ha−1 land occupied by wheat strips and 20 kg N ha−1 land occupied by the faba bean strips. Hence given that each crop covered half of the area, the overall amount of nitrogen applied to the intercrop is therefore (125 + 20)/2 = 72.5 kg N ha−1 intercropped land.
Meteorological data
Minimum daily temperature, maximum daily temperature and daily global solar radiation data were obtained from the weather station De Veenkampen, west of Wageningen, maintained by the Wageningen University and Research chair group Meteorology and Air Quality. Supplementary Figs. S1 - S5 display these meteorological observations for the periods covering experiment 1 (1985–1986), 2 (2013–2014), and 3 (2019). Additionally, we used daily minimum and maximum temperature data from 1980 to 1982 from the same weather station to calculate the temperature sum between sowing and emergence for faba bean.
Model calibration and validation
Most crop parameters in M3 are adopted from literature (Table 1). The sub-sections below describe the estimation of the radiation use efficiencies (ηi), parameters related to crop height growth (H0,i, rh,i, Hmax,i), and various phenological parameters (Se,i, Sa,i, Sm,i, d4,i) using data from experiments 1 and 2. We conclude the section by describing how M3 was validated using data from experiment 3.
Estimation of light use efficiency
A key parameter in M3 is the light use efficiency. This parameter was estimated by first approximating the time course of the leaf area index by linear interpolation between the measured values. We then used Beer’s law for each day between emergence and anthesis to calculate the daily amount of intercepted radiation, assuming an extinction coefficient of 0.6 (Zhang et al. 2014) for both wheat and faba bean. We then fitted a linear model to describe the relationship between the observed aboveground dry matter and the cumulated intercepted radiation. The radiation use efficiencies ηf and ηw were calculated as twice the slope of this relationship, because only half of the global radiation is photosynthetic active (i.e., fp = 0.5). For wheat, we only used the data observed before the date of anthesis, so that the estimate of ηw is not affected by leaf senescence. The data set of faba bean did not contain enough observations of aboveground dry matter and leaf area indices before anthesis to do this. Therefore, we used observations throughout the growing season to estimate ηf.
Estimation of crop height growth parameters
We fitted the numerical solution of equation 12 to the height observations from experiment 1 for faba bean and experiment 2 for wheat in order to estimate H0, Hm, and rh. For experiment 1, only the data from 1985 contained height observations. For this nonlinear regression analysis, we used the Nelder-Mead algorithm (Nelder and Mead 1965) within the optim() function in the programming language R (R Core Team, 2018).
Phenological parameters, estimation of initial leaf area and temperature sensitive leaf senescence rate
Phenological observations and meteorological data were used to calculate the temperature sums from sowing to emergence (Se, i), emergence to anthesis Sa, i, and anthesis to maturity Sm, i (equation 3) for faba bean (based on experiment 1) and wheat (based on experiment 2). Although the emergence dates of faba bean were known, the sowing dates in experiment 1 were unknown (Boons-Prins et al. 1993; Kropff 1989). We therefore assumed in the simulations of the field trials in experiment 1 that the fertilizer was applied at the emergence date. Therefore, we calculated the temperature sum from sowing to emergence for faba bean, Se, f based on the sowing dates and observed emergence data from another data set, in which the same cultivar was grown in the period 1980–1982 in Wageningen (Boons-Prins et al. 1993; Grashoff 1990a, 1990b). The parameter d4, w was calculated from phenological observations in experiment 2. This was not possible for d4, f, because the only available phenological information in experiment 1 was the date of anthesis. We therefore adopted a value from the WOFOST crop growth model (Boons-Prins et al. 1993).
We fitted M3 on the leaf area index observations that were measured before anthesis to estimate the initial leaf area per plant A0, i. Subsequently, we fitted M3, with the previously estimated value for A0, i, on leaf area index observations that were measured after anthesis to determine the temperature-sensitive leaf area senescence rate ssen. For these non-linear regression analyses, we used the L-BFGS-B algorithm (Byrd et al. 1995) within the optim() function of the R programming language (R Core Team, 2018).
Model validation
We simulated both the monocrops and the intercrops from the field trials in experiment 3 (Table S3) and compared observed leaf area indices and the total aboveground dry weights and storage organ dry weights to simulated values.
Quantification of model performance
We considered two indices to evaluate the correspondence between calculations with and the calibration data from experiment 1 and 2 and the validation data from experiment 3. These indices are the root mean squared error (RMSE) and the mean bias error (MBE), calculated as (Salo et al. 2016):
where yκ is the average of observed values of a focal variable y at measurement day κ, \( {\hat{y}}_v \) is the simulated value of the same variable, n is the number of measurement days. MBE quantifies to what extent M3 overestimates (MBE < 0) or underestimates (MBE >0) the field observation. RMSE is the square root of the mean square deviations of the model from the data.
Sensitivity analyses
Global sensitivity analysis of nitrogen input level
M3 calculates the yield as the dry weight of the storage organs at the end of the growing season. We ran a global sensitivity analysis to investigate how the yield of monocrops and intercrops of wheat and faba bean would be affected by different nitrogen input levels. We used the nitrogen input level of experiment 3 as reference point and summarized different nitrogen input levels by means of the ration ffert of the simulated amount of applied nitrogen to the amount of nitrogen that was actually applied in experiment 3.For instance, if ffert = 0.5, then 62.5 kg N ha−1 was applied to the simulated wheat monocrop (while the actual total amount applied to wheat in experiment 3 was 125 kg N ha), 10 kg N ha−1 was applied to the simulated faba bean monocrop (while the actual amount was 20 kg N ha−1), and the same amount to the wheat and fab bean strips in the intercrop leading to an average of 36.25 kg N ha−1 for the intercrop (actual amount was 72.5 kg N ha−1), ffert was varied between 0 and 1.25 in steps of 0.025. We determined the final yields of wheat and faba bean in the monocrop and the intercrop for each value of ffert. From these yields, we calculated the total yield of the wheat-faba bean intercrop, LER (equation 1) and TOI (equation 2).
Local sensitivity analysis of crop traits
We ran a local sensitivity analysis for each model parameter p, which represent crop traits, listed in Table 1 to see how small changes of size Δp in the value of this parameter affect the total yield of the intercrop. We calculated the relative sensitivity (also called elasticity) of the yields of wheat and faba bean in the intercrop and of the total yield of the intercrop to parameter p as (Van der Werf et al. 2007):
where Yc(p) is the yield for a given value of parameter p and the subscript c indicates whether Yc refers to the total yield of the wheat-faba bean intercrop, the yield of wheat in that intercrop or the yield of faba bean in that intercrop. \( {e}_{\mathcal{i}}(p) \) is the relative sensitivity of \( {Y}_{\mathcal{i}} \) to small changes in parameter p. In all cases, \( \Delta p=\frac{1}{1000}\cdotp p \). We conducted this analysis for three levels of fertilization: the nitrogen input levels of experiment 3 (ffert = 1), no fertilization (ffert = 0) and an intermediate nitrogen input level (ffert = 0.5).
Results
Model calibration using data from monocrops
When applied to monocrops, M3 underestimates the crop heights of wheat in both 2013 and 2014 during the early growth stages but was is in line with the observations in the later growing season (Fig. 5a). There was a good agreement between the measured and simulated values for crop height for faba bean (Fig. 5b). The model performed well in simulating the aboveground dry matter of wheat (Fig. 5c). It also performed well in simulating the aboveground dry matter of faba bean (Fig. 5d). There was good agreement between simulated and measured storage organ dry matter for both species (Fig. 5e and f), lending support to the use of M3 to simulate yields.
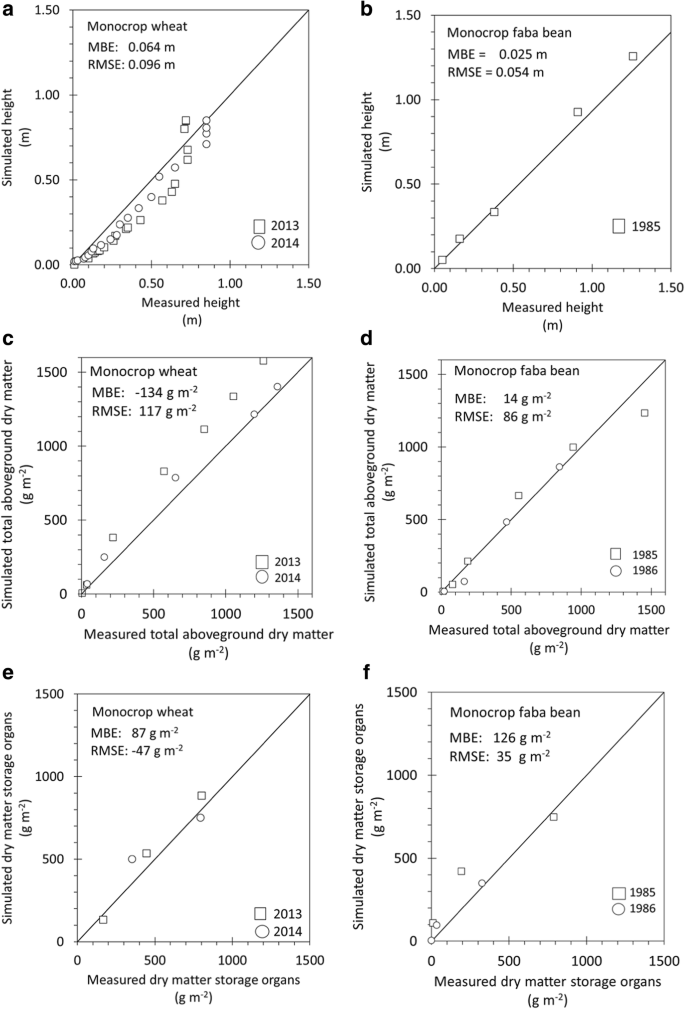
Simulated versus measured values for crop height (a-b), total aboveground dry matter (c-d), and storage organs (e-f) for wheat (a,c,e) and faba bean (b,d,f). The solid lines are the one-to-one lines. RMSE and MBE are the root mean squared error and the mean bias error (eqs 30 & 31) . The data for faba bean were from experiment 1, conducted in 1985 and 1986. The data for wheat were from experiment 2, conducted in 2013 and 2014
Model validation using monocrop and intercrop data
We simulated both the monocrops and the intercrops from the field trials in experiment 3 (Table S3). Figure 6 compares measured and simulated results. There was a general good agreement between measurements and simulations, as indicated by the relatively low values for RMSE and MBE for both the monocrop (subscript “MC”) and the intercrop (“IC”). However, the model substantially overestimated the leaf area index for faba bean after anthesis (Fig. 6b). The effect of this overestimation on the total aboveground biomass of faba bean and the storage organ weights was limited, because also the measured leaf area indices were rather high after anthesis (over 4) indicating a near total interception of light. As a consequence, the modelled light interception and thereby the biomass was not much overestimated.

Measured (dots) and simulated (lines) leaf area indices, aboveground dry weights and storage organ weights in experiment 3 (2019), grown in monocrop (MC) and intercrops (IC). RMSE and MBE are the root mean squared error and the mean bias respectively
Sensitivity analyses
Global sensitivity analysis nitrogen input level
We conducted a global sensitivity analysis of the yields of wheat and faba bean in monocrops and in intercrops to the nitrogen input level ffert. Additionally, we have done this analysis for the total yield of the intercrop. Figure 7 shows the response of these yields to the nitrogen input level.. The yield of a monocrop of wheat was higher than the yield of faba bean or the total yield of an intercrop if ffert ≥ 0.975. The simulated total intercrop yield was the higher than those of both monocrops (transgressive overyielding) if 0.775 < ffert ≤ 0.975 (shaded area in Fig. 7) The simulated yield of a monocrop of faba bean was the highest if ffert < 0.775.

Global sensitivity analysis of various types of yields. The highlighted area represents the nitrogen input level for which transgressive overyielding occurs; i.e. where the transgressive overyielding index (TOI) is larger than 1
We also derived LERs (Fig. 8a) and the TOIs (Fig. 8b) from the simulated yields. TOI was larger than 1 if the nitrogen input level ffert was between 0.775 and 0.975. This trend differed for the land equivalent ratio. It equaled 1.40, if ffert = 0. It decreased with ffert until it equaled 0.99 at ffert = 1.25.

Global sensitivity analysis for the land equivalent ratio and the transgressive overyielding index. The highlighted area represents the nitrogen input level for which transgressive overyielding occurs (i.e., TOI > 1)
Local sensitivity analysis
We conducted a local sensitivity analysis for three types of yields (wheat yield in intercrops, faba bean yield in intercrops, and total intercrop yield) at three different model nitrogen input levels (low: ffert = 0, intermediate: ffert = 0.5, high: ffert = 1) to all model parameters. Figure 9 shows for all yield types to which 10 parameters these yields are the most sensitive at each nitrogen input level. At high nitrogen input levels, the wheat yield was most sensitive to the extinction coefficient of wheat kw and radiation use efficiency of wheat ηw. At intermediate and low nitrogen input levels, the wheat yield was most sensitive to the maximum nitrogen concentration νmax, 0, w. Nevertheless, kw and ηw were still among the top 10 parameters to which the wheat yields were the most sensitive. The top 10 parameters to which the faba bean yield was most sensitive were identical for all nitrogen input levels. For all nitrogen input levels, the top 5 includes three phenological parameters for faba bean. These are the temperature sums from emergence to flowering (Sa, f) and from sowing to emergence (Se, f), and the development stage above which no more biomass partitioning to other organs than storage organs and takes place (d4, f). Additionally, this top 5 includes the radiation use efficiency of faba bean (ηf) and the maximum height of faba bean (Hm, f).

Local sensitivity analyses of the yields of wheat (a-c), faba bean (d-f) grown in a wheat-faba bean strip intercrop and the yield of the whole intercrop (g-i) to model parameters under three different nitrogen input levels (ffert ∈ (1,0.5,0)). For each figure, only the top 10 parameters for that yield (i.e for which the absolute value of the relative sensitivity is the highest) are shown. White bars indicate that increasing the parameter will increase the corresponding yield. Black bars indicate that increasing the parameter will decrease the corresponding yield. The last subscript of each parameters indicates whether it refers to wheat (‘w’) or faba bean (‘f’). Table 1 lists the meaning of the various parameter symbols and their symbols
Regardless the nitrogen input level, ηf, Sa, f, and d4, f were always in the top 4 of parameters to which the total yield of the intercrop was most sensitive. ηw was also in the top 10 at high (rank 1) and intermediate input levels (rank 8).
Interestingly, none of the parameters related to height growth (initial height: H0, maximum height: Hm, or height relative growth rate: rh) of wheat or faba bean are in the top 10 most relevant parameters affecting the total intercrop yield under high and intermediate nitrogen input levels. Only at low nitrogen input levels, Hm, w, Hm, f, and rh, f are present in the top 10. Increasing Hm, w will then decrease the total yield, while increasing the other two parameters will increase the total yield. In contrast, Hm, w, Hm, f, and rh, f were always in the top 10 of parameters to which the faba bean yield was most sensitive. At high nitrogen input levels, these parameters ended in the top 10 parameters to which wheat yields is sensitive as well.
Discussion
Here we present a new minimalist mixture model for growth and resource partitioning in cereal legume intercropping, M3, and we calibrate the model to represent the growth and resource competition between wheat and faba bean in strip intercropping. The model performed well in simulating the aboveground dry matter, storage organ weights and the leaf area index of wheat, with the exception of substantially overestimating the leaf area index of faba bean after anthesis. One possible explanation is that M3 does not consider accelerated leaf senescence due to shading (Ackerly and Bazzaz 1995; Bazzaz and Harper 1977; Woledge 1972). Another explanation is that, although the model links senescence to temperature (equation 8), it does not explicitly consider the effect of short periods of high temperatures on senescence. Experiment 3 was conducted during the spring and summer of 2019. That summer had often higher maximum temperatures than average summers in Wageningen (Supplementary Fig. S5). The maximum daily temperature exceeded 30 °C on 11 days in 2019, while it exceeded 30 °C only two days in 1986 and it never exceeded 30 °C in 1985, i.e., the temperature was lower in the years on which the calibration data were collected than in the year 2019 in which the model was tested and which was characterized by one of the hottest summers on record (KNMI 2019). Finally, a further possible explanation is that the cultivar ‘Monica’, which was used for calibration (experiment 1), senesces later than anthesis more (Thomas and Howarth 2000) than the cultivar ‘Fanfare’, which was used for validation (experiment 3). This highlights the possibility of asymmetric cultivar influence on crops grown in pure or mixed stands, which can be explored by using models such as M3, especially when they are calibrated and validated with data from intercrops using same and different cultivars.
M3 assumes that the species in the intercrop take up nitrogen from the same pool of soil mineral nitrogen, similar to the assumption of another model that species in a strip intercrop take up water from the same pool (Tan et al. 2020). This simplifying assumption was made to keep the model simple in terms of the number of parameters and state variables and of the data requirements for calibration. In contrast, explicit modelling of these soil mineral nitrogen and root density gradients would require the addition of a 2-D model for root distribution and possibly growth, soil water movement, and mass flow and diffusion of soil mineral nitrogen (Chen et al. 2020). Also, the validation of such a model would require measurements of horizontal and lateral root distributions of both species (Chen et al. 2017; Gao et al. 2010; Li et al. 2017; Streit et al. 2019; Yu 2016), which are laborious to collect. Similarly to the YIELD-SAFE model (Van der Werf et al. 2007), M3 also makes simplifying assumptions that the rooting depth is constant throughout the growing season and that species in the intercrop have the same rooting depth. These various simplifying assumption were made to keep the number of parameters low. However, the current version of the model can therefore not be used to investigate to what extent differences in rooting depth and density affect interspecific competition and under which circumstances these differences can lead to niche complementarity for nutrient uptake. For instance, it has been reported that faba bean has a lower root density than wheat (Streit et al. 2019) and maize (Li et al. 2006), while faba bean has been reported to also have greater rooting depths than wheat (Bargaz et al. 2015). In order to test to what extent the assumptions regarding a constant rooting depth or one single pool of soil mineral nitrogen affects the distribution of nitrogen between two species in the intercrop, M3 should be validated on additional strip intercrop field trials with various fertilization levels and, if necessary, extended with a module to simulate the rooting depth, vertical and horizontal root growth, and root length.
M3 currently assumes that crops are grown under well-watered conditions, which is not always applicable. Although a model for strip intercrops grown under water-limited growth conditions has been published for wheat-maize strip intercrops (Tan et al. 2020), M3 does include the possibility to simulate nitrogen limited growth, which is of particular importance in cereal-legume intercrops. To the best of our knowledge, there is currently no model available that can simulate strip intercrops under both water and nitrogen limited conditions. Future contributions will aim at extending, calibrating, and validating M3 with a water balance and considering the effects of drought and water lodging on biomass production.
The effect of nitrogen input level on yields of wheat-faba bean intercrops.
We conducted a global sensitivity analysis for the nitrogen input level, ffert. The results of this analysis show that the land equivalent ratio equals 1.00 for the highest simulated nitrogen input levels. In the unfertilized case, i.e., ffert = 0, the land equivalent ratio, LER, was 1.4, indicating a major advantage of intercropping at this low level of nitrogen input (Fig. 8a). However, in absence of fertilization, the total yield of the intercrop was substantially lower than that of a monocrop of faba bean in the absence of fertilization. Several meta-analyses used LER to assess the performance of cereal-legume intercrops in terms of yield (Martin-Guay et al. 2018; Yu et al. 2015; Yu et al. 2016). A LER larger than 1 indicates that the yield of an intercrop of two species is higher than the yield of two monocrops of these species grown at the same location, in the same growing season. However, our results illustrate that this index alone does not provide information on whether the intercrop yield is higher than the yield of any of the species grown as monocrop (i.e., transgressive overyielding). This additional index TOI would provide additional insight in performance of the two systems. Figure 8 shows that transgressive overyielding only takes place within a relatively narrow intermediate range of nitrogen input levels and Fig. 7 provides an explanation for the relation between nitrogen input level and transgressive overyielding. At the highest fertilizer input level, the highest yield can be obtained by wheat monocrops due to the absence of nitrogen limitation. Consequently, there is neither substantial intraspecific nor interspecific competition for nitrogen and there is no mechanism for niche complementarity. At low nitrogen input, the highest yield is obtained by faba bean monocrops. Indeed, faba bean is able to fix N2 from the atmosphere in order to fulfill most of its nitrogen demand, so the nitrogen input level has little effect on the yield, except when there is very little soil mineral nitrogen in the soil due to low mineralization rates. In contrast, the growth of wheat in the wheat-faba bean intercrop is substantially affected by nitrogen stress under low nitrogen input levels and the presence of faba bean cannot fully compensate the yield loss of the wheat. If specifically aiming at quantifying a yield advantage in legume-cereal intercropping systems, it is thus necessary to consider these separately for different nitrogen input levels and analyse explicitly whether transgressive overyielding is achieved. The latter can be achieved by including the transgressive overyielding index (Yu 2016) (equations 1–2), as we illustrated in Fig. 8b. Although the sensitivity analysis of the transgressive overyielding index shows for which nitrogen input levels the intercrop outperforms monocrops of both species in terms of yield, it should be mentioned that there are also indicators for other measures of crop performance. One example is the gross margin ratio, which quantifies whether the intercrop outperforms both monocrops in terms of gross margin (Van Oort et al. 2020). Another example is the fertilizer N equivalent ratio which indicates whether or not an intercrop that receives the same amount of fertilizer as two monocrops has a higher yield than two monocrops (Xu et al. 2020). The use of these indicators should depend on the aims of analyses and may result in different predictions of optimal nitrogen input levels in intercrops. Also crops are grown to support a complex food system in which multiple crop products are used and needed anyway. In that sense when wheat and faba bean need to be grown for a food system going for the most productive sole wheat would not produce the required faba beans and thus LER would be a relevant metric rather than TOI.
The effect of crop traits on intercrop yields and the interaction with nitrogen input level.
The relative sensitivities of the total wheat-faba bean intercrop yield to parameters related to height growth of any species (H0, Hm, rh) under high and intermediate nitrogen input levels were low in comparison to other parameters. In contrast, the individual yields of faba bean in the intercrop were substantially affected by Hm, f, Hm, w, and rh, f under all nitrogen input levels. In addition, the yields of wheat were affected by these parameters, but only under high nitrogen input levels. This suggests that, under high and intermediate nitrogen input levels, increasing the height of one species will increase the light interception and accompanying biomass production of that species, but will also increase the extent to which this species shades the other species. As a consequence, the yield of this species decreases and the sum of the yields of both species will not be substantially affected. An explanation for the absence of an effect of wheat height on wheat yield at low nitrogen input levels is that, although wheat may intercept more light at these regimes, it can only convert this light to a limited extent to biomass due to nitrogen shortage. On the one hand, the total yield of the intercrop cannot be substantially affected by growing combinations of cultivars with different maximum plant heights under high and intermediate nitrogen input levels. On the other hand, the yield of one species can be favored, at the cost of a yield reduction of the other, by choosing cultivars of wheat and/or faba bean based on the relative heights that they can reach.
An interactive effect between species maximum height and planting geometry is also to be expected. Another model (Gou et al. 2017b) exploiting a similar concept of light interception applied to wheat-maize strip intercrops showed that the strip width can substantially affect the crop yields, as narrowing the strips increases the extent to which the tallest crop species shades the shorter crop species (Van Oort et al. 2020). Consequently, height-related parameters might have a more prominent effect on crop yields in intercrops with smaller strip widths and even more so in homogeneously mixed intercrops. This topic requires attention in future research, to evaluate the most suitable combinations of planting geometry and crop trait. M3 can be used for this purpose, even if the system of interest is an alternate row intercrop or a homogenously mixed intercrop. Specifically, M3 can simulate species in an alternate row intercrop by setting their strip widths equal to their row widths (Van Oort et al. 2020). And homogeneously mixed intercrop can be simulated as a system with strip widths equal to 0 (Gou et al. 2017a).
The local sensitivity analysis furthermore showed that some of the phenological parameters of faba bean (Sf, f, d3, f) and light use efficiency of faba bean are important parameters for the total yield of the intercrop. At high nitrogen application rates, the light use efficiency of wheat also has a strong positive (emc, w(ηw) = 2.05) effect on wheat yield, while this effect is less important at intermediate nitrogen application rates (emc, w(ηw) = 0.97) or no nitrogen application (emc, w(ηw) = 0.2; not in the top 10 most relevant parameters). This result can be explained from the relationship between light use efficiency and leaf nitrogen concentration mentioned by Sinclair and Horie (1989) that reaches a plateau at high leaf nitrogen values where growth becomes purely light limited. While this concept was not directly built in M3, it is implicit in the incorporated concept of the critical nitrogen concentration (Greenwood et al. 1990). The crop biomass production is directly determined by light interception and light use efficiency at high crop nitrogen concentrations. Conversely, M3 includes a reduction factor of the light use efficiency (σM, i) at crop nitrogen concentrations below the critical concentration, which makes the light use efficiency of wheat a less dominant factor. It would be challenging to select good combinations of wheat and faba bean cultivars for increased light use efficiency, because light use efficiency is a complex trait, here assessed at a high level of aggregation. Indeed, light use efficiency is determined by various component traits at lower levels of aggregation. The component traits of light use efficiency include the photosynthetic capacity of leaves (Rodriguez et al. 1999), which is in turn determined by various component traits in the form of leaf biochemical parameters (Farquhar et al. 1980). In addition, the distribution of this photosynthetic capacity over the canopy is an important determinant of the light use efficiency (De Wit 1965; Goudriaan 1986; Kropff 1993; Rodriguez et al. 1999), and it is in turn affected by the distribution of nitrogen over the canopy of each species (Anten et al. 1995). If one would be interested in further improving the simulation of light use efficiency, models that are more mechanistic would have to be used. These models could elucidate which component traits of light use efficiency affect the yields in intercrops the most. However, this is only necessary for the components traits of the light use efficiency of wheat at high fertilizer application rates, as the light use efficiency of wheat had a less prominent effect on the yields at intermediate and low nitrogen input levels.
Conclusions
We developed a minimalist crop growth model for cereal-legume strip intercrops grown under nitrogen-limited, well-watered conditions. We calibrated and validated the model on monocrops and intercrops of wheat-faba bean. We aimed at identifying the key traits and nitrogen input levels leading to high yields of both species in the intercrop, high land equivalent ratios and the occurrence of transgressive overyielding. By means of global and local sensitivity analyses, we can conclude that:
-
Transgressive overyielding only occurred in this system in a limited range of intermediate nitrogen input levels, whereas high values of land equivalent ratios occurred at low nitrogen input levels. Nevertheless, total yields of the crops and intercrops grown with low to intermediate nitrogen input levels did not exceed that of an optimally nitrogen-fertilized wheat monocrop.
-
Height-related crop traits had little effect on the total yield of wheat-faba bean strip intercrops under high and intermediate nitrogen input levels.
-
The maximum crop height of both species substantially affects the yield of faba bean and, at high nitrogen input levels, the yield of wheat in wheat-faba bean intercrops.
-
The light use efficiency of faba bean can substantially affect the total yield of a wheat-faba bean intercrop, regardless the nitrogen input level. The light use efficiency of wheat has a substantial effect only at high nitrogen input levels.
-
These results can provide guidance for choice and selection of cereal and legume varieties for sowing in intercrops. We recommend for further research to:
-
Include transgressive overyielding indices in future meta-analyses that quantify yield advantages.
-
Investigate the effect of crop height on the total yield of the intercrop in cereal-legume intercropping with narrow strip widths or no strips.
-
Include mechanistic descriptions of radiation use efficiencies in crop growth models for intercrops, if one is interesting in increasing yields by changing their component traits.
-
Further validate M3 by testing to what extent the assumptions of a single soil mineral nitrogen pool and a rooting depth that is constant over the season and equal for both intercropped species affect the nitrogen distribution between the two species in a strip intercrop.
-
Extend M3 with a water balance and modules for water limited growth.
References
Ackerly DD, Bazzaz FA (1995) Leaf dynamics, self-shading and carbon gain in seedlings of a tropical pioneer tree. Oecologia 101:289–298. https://doi.org/10.1007/Bf00328814
Allen RG, Pereira LS, Raes D, Smith M (1998) Crop evapotranspiration - guidelines for computing crop water requirements - FAO irrigation and drainage paper 56. FAO - Food and Agricultural Organization of the United Nations, Rome
Anten NPR, Schieving F, Werger MJA (1995) Patterns of light and nitrogen distribution in relation to whole canopy carbon gain in C3 and C4 monocotyledonous and dicotyledonous species. Oecologia 101:504–513. https://doi.org/10.1007/Bf00329431
Bargaz A, Isaac ME, Jensen ES, Carlsson GE (2015) Intercropping of Faba bean with wheat under low water availability promotes Faba bean nodulation and root growth in deeper soil layers
Bazzaz FA, Harper JL (1977) Demographic analysis of growth of Linum usitatissimum. New Phytol 78:193–208. https://doi.org/10.1111/j.1469-8137.1977.tb01558.x
Berghuijs HNC, Weih M, Van der Werf W, Vico G (2019) Can the APSIM crop growth model simulate the growth of pure cultures and intercrops of wheat and faba bean in temperate zones in Europe? In: A Messéan, D Drexler, I Heim, L Paresys, D Stilmant, H Willer (eds) First European conference on crop diversification, Budapest, Hungary
Boons-Prins ER, De Koning GHJ, Van Diepen CA, De Vries FWT (1993) Crop specific simulation parameters. In: Van Keulen H, Goudriaan J (eds) Simulation reports CABO-TT. DLO Centre for Agrobiological Research, Wageningen
Brisson NFB, Ozier-Lafontaine H, Tournebize R, Sinoquet H (2004) Adaptation of the crop model STICS to intercropping. Theoretical basis and parameterisation. Agronomie 24:409–424
Brisson N, Gary C, Justes E, Roche R, Mary B, Ripoche D, Zimmer D, Sierra J, Bertuzzi P, Burger P, Bussiere F, Cabidoche YM, Cellier P, Debaeke P, Gaudillere JP, Henault C, Maraux F, Seguin B, Sinoquet H (2003) An overview of the crop model STICS. Eur J Agron 18:309–332. https://doi.org/10.1016/S1161-0301(02)00110-7
Byrd RH, Lu PH, Nocedal J, Zhu CY (1995) A limited memory algorithm for bound constrained optimization. SIAM J Sci Comput 16:1190–1208. https://doi.org/10.1137/0916069
Carberry PS, Adiku SGK, McCown RL, Keating BA (1996) Application of the APSIM cropping systems model to intercropping systems. In: C Ito, C Johansen, K Adu-Gyamfi, K Katayama, JVDK Kumar-Rao, TJ Rego (eds) Dynamics of roots and nitrogen in cropping systems of the semi-arid tropics. Japan International Resource Centre of Agricultural Sciences
Cardinale BJ, Wright JP, Cadotte MW, Carroll IT, Hector A, Srivastava DS, Loreau M, Weis JJ (2007) Impacts of plant diversity on biomass production increase through time because of species complementarity. P Natl Acad Sci USA 104:18123–18128. https://doi.org/10.1073/pnas.0709069104
Chen N, Li X, Šimůnek J, Shi H, Hu Q, Zhang Y (2020) Evaluating soil nitrate dynamics in an intercropping dripped ecosystem using HYDRUS-2D. Sci Total Environ 718. https://doi.org/10.1016/j.scitotenv.2020.137314
Chen P, Du Q, Liu ZG, Zhou L, Hussain S, Lie L, Song C, Wang XC, Liu ZG, Yang F, Shu K, Liu J, Du J, Yang WY, Yong TW (2017) Effects of reduced nitrogen inputs on crop yield and nitrogen use efficiency in a long-term maize-soybean relay strip intercropping system. Plos One
Chimonyo VGP, Modi AT, Mabhaudhi T (2016) Simulating yield and water use of a sorghum-cowpea intercrop using APSIM. Agric Water Manag 177:317–328. https://doi.org/10.1016/j.agwat.2016.08.021
Cong WF, Hoffland E, Li L, Six J, Sun JH, Bao XG, Zhang FS, van der Werf W (2015) Intercropping enhances soil carbon and nitrogen. Glob Chang Biol 21:1715–1726
Corre-Hellou G, Brisson N, Launay M, Fustec J, Crozat Y (2007) Effect of root depth penetration on soil nitrogen competitive interactions and dry matter production in pea-barley intercrops given different soil nitrogen supplies. Field Crop Res 103:76–85. https://doi.org/10.1016/j.fcr.2007.04.008
Corre-Hellou G, Faure M, Launay M, Brisson N, Crozat Y (2009) Adaptation of the STICS intercrop model to simulate crop growth and N accumulation in pea-barley intercrops. Field Crop Res 113:72–81. https://doi.org/10.1016/j.fcr.2009.04.007
Corre-Hellou G, Fustec J, Crozat Y (2006) Interspecific competition for soil N and its interaction with N2 fixation, leaf expansion and crop growth in pea-barley intercrops. Plant Soil 282:195–208. https://doi.org/10.1007/s11104-005-5777-4
De Wit CT (1960) On competition. Verslagen Landbouwkundige Onderzoekingen 66:1–82
De Wit CT (1965) Photosynthesis of leaf canopies. Agricultural Research Reports. Institute for Biological and Chemical Research on Field Crops and Herbage, Wageningen
Eckersten H, Lundkvist A, Torssell B (2010) Comparison of monocultures of perennial sow-thistle and spring barley in estimated shoot radiation-use and nitrogen-uptake efficiencies. Acta Agricult Scandinav Sect B-Soil Plant Sci 60:126–135. https://doi.org/10.1080/09064710902721347
Farquhar GD, Caemmerer SV, Berry JA (1980) A biochemical model of photosynthetic CO2 assimilation in leaves of C3 species. Planta 149:78–90. https://doi.org/10.1007/Bf00386231
Fridley JD (2001) The influence of species diversity on ecosystem productivity: how, where, and why? Oikos 93:514–526. https://doi.org/10.1034/j.1600-0706.2001.930318.x
Gao Y, Duan AW, Qiu XQ, Liu ZG, Sun JS, Zhang JP, Wang HZ (2010) Distribution of roots and root length density in a maize/soybean strip intercropping system. Agric Water Manag 98:199–212. https://doi.org/10.1016/j.agwat.2010.08.021
Ghaley BB, Hauggaard-Nielsen H, Hogh-Jensen H, Jensen ES (2005) Intercropping of wheat and pea as influenced by nitrogen fertilization. Nutr Cycl Agroecosyst 73:201–212. https://doi.org/10.1007/s10705-005-2475-9
Gou F, van Ittersum MK, Simon E, Leffelaar PA, van der Putten PEL, Zhang LZ, van der Werf W (2017a) Intercropping wheat and maize increases total radiation interception and wheat RUE but lowers maize RUE. Eur J Agron 84:125–139
Gou F, van Ittersum MK, van der Werf W (2017b) Simulating potential growth in a relay-strip intercropping system: model description, calibration and testing. Field Crop Res 200:122–142. https://doi.org/10.1016/j.fcr.2016.09.015
Gou F, van Ittersum MK, Wang GY, van der Putten PEL, van der Werf W (2016) Yield and yield components of wheat and maize in wheat-maize intercropping in the Netherlands. Eur J Agron 76:17–27. https://doi.org/10.1016/j.eja.2016.01.005
Gou F, Yin W, Hong Y, van der Werf W, Chai Q, Heerink N, van Ittersum MK (2017c) On yield gaps and yield gains in intercropping: opportunities for increasing grain production in Northwest China. Agric Syst 151:96–105. https://doi.org/10.1016/j.agsy.2016.11.009
Goudriaan J (1977) Crop micrometeorology; a simulation study. Department of Theoretical Production Ecology. Agricultural University Wageningen, Wageningen
Goudriaan J (1986) A smple and fast numerical method for the computation of daily totals of crop photosynthesis. Agric For Meteorol 38:249–254. https://doi.org/10.1016/0168-1923(86)90063-8
Grashoff C (1990a) Effect of pattern of water supply on Vica faba L. 1. Dry matter partitioining and yield variability. Netherlands J Agricult Sci 38:1–44
Grashoff C (1990b) Effect of pattern of water supply on Vicia faba L .1. Dry matter partitioning and yield variability. Neth J Agric Sci 38:21–44
Greenwood DJ, Lemaire G, Gosse G, Cruz P, Draycott A, Neeteson JJ (1990) Decline in percentage N of C3 and C4 crops with increasing plant mass. Ann Bot 66:425–436. https://doi.org/10.1093/oxfordjournals.aob.a088044
Hejlsberg A, Torgersen M, Wiltamuth S, Golde P (2010) The C# programming language. Addison-Wesley Professional, Upper Saddle River
Hoogenboom G, Porter CH, Shelia V, Boote KJ, Singh U, White JW, Hunt LA, Ogoshi R, Lizaso JI, Koo J, Asseng S, Singels A, Moreno LP, Jones JW (2017) Decision support system for Agrotechnology transfer (DSSAT) version 4.7 (https://DSSAT.net). DSSAT Foundation, Gainsville, Florida, USA
Jensen ES (1996) Grain yield, symbiotic N2 fixation and interspecific competition for inorganic N in pea-barley intercrops. Plant Soil 182:25–38. https://doi.org/10.1007/Bf00010992
Jensen ES, Peoples MB, Hauggaard-Nielsen H (2010) Faba bean in cropping systems. Field Crop Res 115:203–216. https://doi.org/10.1016/j.fcr.2009.10.008
Justes E, Mary B, Meynard JM, Machet JM, Thelierhuche L (1994) Determination of a critical nitrogen dilution curve for winter-wheat crops. Ann Bot 74:397–407. https://doi.org/10.1006/anbo.1994.1133
Keating BA, Carberry PS (1993) Resource capture and use in intercropping - solar-radiation. Field Crop Res 34:273–301. https://doi.org/10.1016/0378-4290(93)90118-7
Keating BA, Carberry PS, Hammer GL, Probert ME, Robertson MJ, Holzworth D, Huth NI, Hargreaves JNG, Meinke H, Hochman Z, McLean G, Verburg K, Snow V, Dimes JP, Silburn M, Wang E, Brown S, Bristow KL, Asseng S, Chapman S, McCown RL, Freebairn DM, Smith CJ (2003) An overview of APSIM, a model designed for farming systems simulation. Eur J Agron 18:267–288. https://doi.org/10.1016/S1161-0301(02)00108-9
Kirschbaum MUF (1995) The temperature dependence of soil organic matter decomposition, and the effect of global warming on soil organic C storage. Soil Biol Biochem 27:753–760. https://doi.org/10.1016/0038-0717(94)00242-S
Klimek-Kopyra A, Zajac T, Rebilas K (2013) A mathematical model for the evaluation of cooperation and competition effects in intercrops. Eur J Agron 51:9–17
KNMI (2019) Temperatuur door historische grens van 40°C. https://www.knminl/over-het-knmi/nieuws/temperatuur-door-historische-grens-van-40-c
Knörzer H, Grözinger H, Graeff-Hönniger S, Hartung K, Piepho H, Claupein W (2011a) Integrating a simple shading algorithm into CERES-wheat and CERES-maize with particular regard to a changing microclimate within arelay-intercropping system. Field Crop Res 121:274–298
Knörzer H, Lawes R, Robertson M, Graeff-Hönniger S, Claupein W (2011b) Evaluation and performance of the APSIM crop growth model for German winter wheat, maize and fieldpea varieties within monocropping and intercropping systems. J Agric Sci Technol 1:698–717
Kropff MJ (1989) Quantification of SO2 effects on physiological processes, plant growth and crop reproduction. Department of Theoretical Production Ecology. Wageningen Agricultural University, Wageningen
Kropff MJ (1993) 4. Mechanisms of competition for light. In: Kropff MJ, Van Laar HH (eds) Modelling crop-weed inter actions. BPCC Wheatons Ltd, Exeter
Kätterer T, Reichstein M, Andrén O, Lomander A (1998) Temperature dependence of organic matter decomposition: a critical review using literature data analyzed with different models. Biol Fertil Soils 27:258–262. https://doi.org/10.1007/s003740050430
Letourneau DK, Armbrecht I, Rivera BS, Lerma JM, Carmona EJ, Daza MC, Escobar S, Galindo V, Gutierrez C, Lopez SD, Mejia JL, Rangel AMA, Rangel JH, Rivera L, Saavedra CA, Torres AM, Trujillo AR (2011) Does plant diversity benefit agroecosystems? A synthetic review. Ecol Appl 21:9–21
Li CJ, Hoffland E, Kuyper TW, Yu Y, Zhang CC, Li HG, Zhang FS, van der Werf W (2020) Syndromes of production in intercropping impact yield gains. Nat Plants 6:653–660
Li L, Sun J, Zhang F, Guo T, Bao X, Smith FA, Smith SE (2006) Root distribution and interaction between intercropped species. Oecologia 147:280–290
Li XY, Simunek J, Shi HB, Yan JW, Peng ZY, Gong XW (2017) Spatial distribution of soil water, soil temperature, and plant roots in a drip-irrigated intercropping field with plastic mulch. Eur J Agron 83:47–56. https://doi.org/10.1016/j.eja.2016.10.015
Liebman M, Dyck E (1993) Crop-rotation and intercropping strategies for weed management. Ecol Appl 3:92–122
Liu X, Rahman T, Yang F, Song C, Yong TW, Liu J, Zhang CY, Yang WY (2017) PAR interception and utilization in different maize and soybean intercropping patterns. PLoS One. https://doi.org/10.1371/journal.pone.0169218
Liu YY, Wu LH, Baddeley JA, Watson CA (2011) Models of biological nitrogen fixation of legumes A review. Agronomy for Sustainable Development 31:155–172. https://doi.org/10.1051/agro/2010008
Loreau M (2010) Chapter 2: the maintenance and functional consequences of species diversity. In: Loreau M (ed) From populations to ecosystems: theoretical foundations for a new ecological synthesis (MBP-46). Princeton University Press, Princeton
Malezieux E, Crozat Y, Dupraz C, Laurans M, Makowski D, Ozier-Lafontaine H, Rapidel B, de Tourdonnet S, Valantin-Morison M (2009) Mixing plant species in cropping systems: concepts, tools and models. A review. Agron Sustain Dev 29:43–62. https://doi.org/10.1051/agro:2007057
Martin-Guay MO, Paquette A, Dupras J, Rivest D (2018) The new green revolution: sustainable intensification of agriculture by intercropping. Sci Total Environ 615:767–772. https://doi.org/10.1016/j.scitotenv.2017.10.024
Nelder JA, Mead R (1965) A simplex method for function minimization. Comput J 7:308–313. https://doi.org/10.1093/comjnl/7.4.308
Ozier-Lafontaine H, Lafolie F, Bruckler L, Tournebize R, Mollier A (1998) Modelling competition for water in intercrops: theory and comparison with field experiments. Plant Soil 204:183–201. https://doi.org/10.1023/A:1004399508452
Pronk AA, Goudriaan J, Stilma E, Challa H (2003) A simple method to estimate radiation interception by nursery stock conifers: a case study of eastern white cedar. Njas-Wageningen J Life Sci 51:279–295. https://doi.org/10.1016/S1573-5214(03)80020-9
Raseduzzaman M, Jensen ES (2017) Does intercropping enhance yield stability in arable crop production? Eur J Agron 91:25–33
R Core Team (2018) R: A language and environment for statistical computing. R Foundation for Statistical Computing, Vienna, Austria. https://www.R-project.org/
Ritchie JT, Otter S (1985) CERES-wheat: a user-oriented wheat yield model. AGRISTARS 38:159–175
Rodriguez D, Van Oijen M, Schapendonk AHMC (1999) LINGRA-CC: a sink-source model to simulate the impact of climate change and management on grassland productivity. New Phytol 144:359–368. https://doi.org/10.1046/j.1469-8137.1999.00521.x
Salo TJ, Palosuo T, Kersebaum KC, Nendel C, Angulo C, Ewert F, Bindi M, Calanca P, Klein T, Moriondo M, Ferrise R, Olesen JE, Patil RH, Ruget F, Takac J, Hlavinka P, Trnka M, Rottter RP (2016) Comparing the performance of 11 crop simulation models in predicting yield response to nitrogen fertilization. J Agric Sci 154:1218–1240. https://doi.org/10.1017/S0021859615001124
Shibu ME, Leffelaar PA, van Keulen H, Aggarwal PK (2010) LINTUL3, a simulation model for nitrogen-limited situations: application to rice. Eur J Agron 32:255–271
Sinclair TR, Horie T (1989) Leaf nitrogen, photosynthesis, and crop radiation use efficiency - a review. Crop Sci 29:90–98. https://doi.org/10.2135/cropsci1989.0011183X002900010023x
Streit J, Meinen C, Rauber R (2019) Intercropping effects on root distribution of eight novel winter faba bean genotypes mixed with winter wheat. Field Crop Res 235:1–10. https://doi.org/10.1016/j.fcr.2019.02.014
Stöckle CO, Debaeke P (1997) Modeling crop nitrogen requirements: a critical analysis. Eur J Agron 7:161–169. https://doi.org/10.1016/S1161-0301(97)00038-5
Supit I, Hooijer AA (1994) System description of the Wofost 6.0 crop simulation model implemented in CMGS. EUR 15956 EN edn
Tan M, Gou F, Stomph TJ, Jing W, Wen Y, Zhang L, Qiang C, Van der Werf W (2020) Dynamic process-based modelling of crop growth and competitive water extraction in relay strip intercropping: Model development and application to wheat maize intercropping. Field Crop Res 243
Thomas H, Howarth CJ (2000) Five ways to stay green. J Exp Bot 51:329–337. https://doi.org/10.1093/jexbot/51.suppl_1.329
Tilman D (2020) Benefits of intensive agricultural intercropping. Nat Plants 6:604–605. https://doi.org/10.1038/s41477-020-0677-4
Van der Werf W, Keesman K, Burgess P, Graves A, Pilbeam D, Incoll LD, Metselaar K, Mayus M, Stappers R, van Keulen H, Palma J, Dupraz C (2007) Yield-SAFE: a parameter-sparse, process-based dynamic model for predicting resource capture, growth, and production in agroforestry systems. Ecol Eng 29:419–433. https://doi.org/10.1016/j.ecoleng.2006.09.017
Van Ittersum MK, Rabbinge R (1997) Concepts in production ecology for analysis and quantification of agricultural input-output combinations. Field Crop Res 52:197–208. https://doi.org/10.1016/S0378-4290(97)00037-3
Van Oijen M, Leffelaar PA (2008) Lintul-1: potential crop growth. In: PA Leffelaar (ed) Crop Ecology, Wageningen
Van Oort PAJ, Gou F, Stomph TJ, Van der Werf W (2020) Effects of strip width on yields in relay-strip intercropping: a simulation study. Eur J Agron 112. https://doi.org/10.1016/j.eja.2019.125936
Van Wijk MT, Williams M, Gough L, Hobbie SE, Shaver GR (2003) Luxury consumption of soil nutrients: a possible competitive strategy in above-ground and below-ground biomass allocation and root morphology for slow-growing arctic vegetation? J Ecol 91:664–676
Weih M, Berghuijs HNC, Ghaley BB, Hansen LV, Vico G (2019) DELIVERABLE 3.1 Mechanisms underpinning beneficial plant associations based on APSIM and DAISY. Developed by the EU-H2020 project DIVERSify (‘Designing innovative plant teams for ecosystem resilience and agricultural sustainability’), funded by the European Union’s Horizon 2020 Research and Innovation programme under Grant Agreement Number 727284
Willey RW, Rao MR (1980a) A competitive ratio for quantifying competition between intercrops. Exp Agric 16:117–125. https://doi.org/10.1017/S0014479700010802
Willey RW, Rao MR (1980b) Intercroppings - its importance and research needs. Part 1. Competition and yield advantages. Field Crops Abstracts 32:1–10
Woledge J (1972) Effect of shading on photosynthetic rate and longevity of grass leaves. Ann Bot 36:551. https://doi.org/10.1093/oxfordjournals.aob.a084612
Wolf J (2012) User guide for LINTUL4 and LINTUL4V: simple generic model for simulation of crop growth under potential, water limited and nitrogen limited conditions. Wageningen UR, Wageningen
Xu Z, Li CJ, Zhang CC, Yu Y, van der Werf W, Zhang FS (2020) Intercropping maize and soybean increases efficiency of land and fertilizer nitrogen use; A meta-analysis. Field Crop Res 246. https://doi.org/10.1016/j.fcr.2019.107661
Yahuza I (2011) Wheat/faba bean intercropping system in perspective. J Biodivers Environ Sci 1:70–92
Yu Y (2016) Crop yields in intercropping: meta-analysis and virtual plant modelling. Centre for Crop Systems Analysis. Wageningen University and Research, Wageningen
Yu Y, Stomph TJ, Makowski D, van der Werf W (2015) Temporal niche differentiation increases the land equivalent ratio of annual intercrops: a meta-analysis. Field Crop Res 184:133–144. https://doi.org/10.1016/j.fcr.2015.09.010
Yu Y, Stomph TJ, Makowski D, Zhang LZ, van der Werf W (2016) A meta-analysis of relative crop yields in cereal/legume mixtures suggests options for management. Field Crop Res 198:269–279. https://doi.org/10.1016/j.fcr.2016.08.001
Zhang LX, Hu ZM, Fan JW, Zhou DC, Tang FP (2014) A meta-analysis of the canopy light extinction coefficient in terrestrial ecosystems. Front Earth Sci 8:599–609. https://doi.org/10.1007/s11707-014-0446-7
Ziadi N, Belanger G, Claessens A, Lefebvre L, Cambouris AN, Tremblay N, Nolin MC, Parent LE (2010) Determination of a critical nitrogen dilution curve for spring wheat. Agron J 102:241–250. https://doi.org/10.2134/agronj2009.0266
Ågren GI (1988) Ideal nutrient productivities and mutrient proportions in plant growth. Plant Cell Environ 11:613–620
Ågren GI, Weih M (2020) Multi-dmensional plant element stoichiometry—looking beyond carbon, nitrogen, and phosphorus. Front Plant Sci 11
Acknowledgements
HNCB, MW, and GV received funding from the European Union’s Horizon 2020 Research and Innovation Programme under grant agreement No. 727284. WvdW and TJS received funding from the European Union’s Horizon 2020 Research and Innovation Programme under grant agreement no. 727217, project ReMIX: Redesigning European cropping systems based on species MIXtures, https://www.remix-intercrops.eu. ZW received funding from the China Scholarship Council under grant agreement no. 201708140084. We thank Gou Fang for providing data relative to experiment 2. We thank Gou Fang and Sytse Koopmans (Wageningen UR) for discussions on the radiation interception model that was used in this study. We thank Stefano Manzoni (Stockholm University) for conducting a pre-review of this manuscript. We thank Bei Dong (Wageningen UR) for her support during the data collection.
Funding
Open access funding provided by Swedish University of Agricultural Sciences.
Author information
Authors and Affiliations
Corresponding author
Additional information
Responsible Editor: Richard J. Simpson.
Publisher’s note
Springer Nature remains neutral with regard to jurisdictional claims in published maps and institutional affiliations.
Electronic supplementary material
ESM 1
(DOCX 536 kb)
Rights and permissions
Open Access This article is licensed under a Creative Commons Attribution 4.0 International License, which permits use, sharing, adaptation, distribution and reproduction in any medium or format, as long as you give appropriate credit to the original author(s) and the source, provide a link to the Creative Commons licence, and indicate if changes were made. The images or other third party material in this article are included in the article's Creative Commons licence, unless indicated otherwise in a credit line to the material. If material is not included in the article's Creative Commons licence and your intended use is not permitted by statutory regulation or exceeds the permitted use, you will need to obtain permission directly from the copyright holder. To view a copy of this licence, visit http://creativecommons.org/licenses/by/4.0/.
About this article

Cite this article
Berghuijs, H.N.C., Wang, Z., Stomph, T.J. et al. Identification of species traits enhancing yield in wheat-faba bean intercropping: development and sensitivity analysis of a minimalist mixture model. Plant Soil 455, 203–226 (2020). https://doi.org/10.1007/s11104-020-04668-0
Received:
Accepted:
Published:
Issue Date:
DOI: https://doi.org/10.1007/s11104-020-04668-0