


Introduction
Moore (Reference Moore1970) characterised the Långban deposit in Värmland, Sweden, as “the most remarkable mineral locality on Earth”. Although the validity of this statement is ultimately a matter of taste, Långban is still the most prolific ore deposit based on objective criteria, with 73 valid type species, and presently only challenged by Tsumeb (72) (www.mindat.org). A crucial metal contributing to the diversity at Långban is Pb. There are at least 58 Pb minerals present (of which 52 are oxy-compounds) in total, and 31 type minerals with essential Pb. Previously only one Pb–W mineral has been identified with certainty from here; stolzite crystals occur as a rarity, confined to vugs in hematite–garnet skarn (Boström, Reference Boström1965). Herein, we present another one, langhofite, approved by the International Mineralogical Association (IMA) Commission on New Minerals, Nomenclature and Classification (IMA2019-005, Holtstam et al., Reference Holtstam, Cámara and Karlsson2019). The new mineral is named for H. Jörgen S. Langhof (b. 1965), presently mineral curator at the Swedish Museum of Natural History, who collected the discovery specimen. Mr. Langhof has been devoted to investigations of the Långban mines and their mineral wealth for more than thirty years. He held the position as director of Långban's Mining Museum 1998–2001. The holotype material, including a polished grain mount, is preserved in the type mineral collections of the Department of Geosciences, Swedish Museum of Natural History, Box 50007, SE-104 05 Stockholm, Sweden, under catalogue label GEO-NRM #20030044.
Occurrence
The Långban Fe–Mn–(Ba–As–Pb–Sb–W–Be–B) deposit, in the Filipstad district (59.85°N, 14.26°E, 215 m a.s.l.) was mined, for Fe (hematite–magnetite) ore, Mn (braunite–hausmannite) ore and dolomitic marble, uninterrupted over the period 1711–1972. The carbonate-hosted, syngenetic Långban-type deposits in the Bergslagen ore region of central Sweden primordially formed from hydrothermal–volcanogenic solutions in a shallow-submarine environment at ~1.9 Ga (Boström et al., Reference Boström, Rydell and Joensuu1979; Holtstam and Mansfeld, Reference Holtstam and Mansfeld2001).
Langhofite occurs in the type specimen with baryte and calcite in a small cavity. It is partly overgrown by globular Mn-rich calcite, and tiny opaque specks of sulfides (galena, covellite and chalcocite) occurs on the crystals. Additional microscopic phases present are fluorapatite and mimetite. The host matrix consists of coarse-grained hematite, calcite and green diopside. This specimen was collected on an old (likely accumulated before the year 1900) mine-waste dump close to lake Långban in 2000. A few other samples have been recorded recently, in similar rock matrices.
Magnusson (Reference Magnusson1930) in his comprehensive geological and mineralogical description of the Långban mines divided the evolution of the deposit into four periods. The early ones, named A and B, correspond to main ore- and skarn-forming processes (B representing regional peak metamorphism), whereas later paragenetic episodes, C and D, refer to mineral formation in vugs and fissures, respectively, at essentially progressively lower temperatures. The C period is also associated with the appearance of sulfide minerals in the deposit.
The Fe ores in Långban-type deposits are generally enriched in W (sequestered by scheelite; Holtstam, Reference Holtstam2001) whereas Pb is, in the present case, most likely to have been mobilised from Mn-rich lithologies, where a number of Pb silicate and arsenate minerals occur in the skarns (Nysten et al., Reference Nysten, Holtstam, Jonsson, Holtstam and Langhof1999). Fluid-inclusion studies of mineral assemblages with Pb oxysalts of the D period suggest formation temperatures ≤180°C and nearly atmospheric pressure conditions (Jonsson and Broman, Reference Jonsson and Broman2002). We believe that langhofite has formed well below peak metamorphic conditions at Långban (estimated at >600°C and <3.5 kb; Grew et al., Reference Grew, Yates, Belakovskiy, Rouse, Su and Marquez1994; Christy and Gatedal, Reference Christy and Gatedal2005), but still above the estimated temperature maximum for the D period, i.e. probably in the range 200−400°C. Mineral formation probably took place in an alkaline environment, but not at such extreme high-pH conditions that are inferred to have prevailed in the ‘reduced veins’ characteristic for the late-stage D period at Långban (Boström, Reference Boström2002).
Physical and optical properties
The new mineral occurs in a single aggregate, ca. 10 mm × 5 mm, of several crystals (Fig. 1) on the type specimen. Individual crystals are euhedral, elongated along a, up to 4 mm in greatest dimension, somewhat flattened on {001} and striated lengthwise. Langhofite is white to colourless, with white streak; lustre is adamantine. Fluorescence effects are absent under both long- and short-wave ultraviolet radiation. The mineral is brittle under compression, with uneven, splintery fracture. Cleavage is perfect in two directions, {010} and {100}, producing rhombic cleavage fragments.

Fig. 1. Colour photograph of the langhofite type specimen, GEO-NRM #20030044. Field of view is ca. 1.2 cm × 0.8 cm.
The density of langhofite is undetermined owing to the fragile nature of the crystals and high anticipated value (>4.2 g⋅cm–3). The calculated density, from the unit-cell dimensions and atom content (ideal formula), is 7.95(1) g⋅cm–3. Vickers hardness numbers (VHN25) were obtained using a Shimadzu type-M micro-hardness tester; the average of nine indentation measurements is 157 (range 130–192), which corresponds to 2½–3 on Mohs’ scale.
Optically, langhofite is biaxial (+) and non-pleochroic in transmitted light. Refractive indices were not measured conventionally, because it was found to be higher than available reference liquids (>1.9); a value of 2.20 is predicted from Gladstone–Dale constants (Mandarino, Reference Mandarino1981). Polarised reflectance spectra were measured in air with an AVASPEC-ULS2048×16 spectrometer attached to a Zeiss Axiotron UV-microscope (10×/0.20 Ultrafluar objective), using a halogen lamp (100 W) and a SiC (Zeiss no. 846) standard, with a circular sample measurement field of 120 μm in diameter. The results from the 400–700 nm range (average of 1000 scans, 10 ms integration time) are given in Table 1. Calculated refractive indices from the reflectance data using Fresnel's equation (assuming zero absorption in the crystals) are n 2 = 2.20(2) and n 1 = 2.14(2) at 546 nm.
Table 1. Reflectance values (%) for langhofite.*
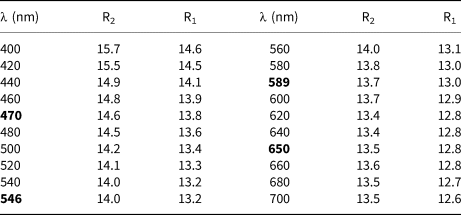
* The reference wavelengths required by the Commission on Ore Mineralogy (COM) are given in bold.
R 2 and R 1 corresponds to maximum and minimum reflectance, respectively, measured in two extinction positions.
Infrared and Raman spectroscopy
A Fourier-transform infrared (FTIR) spectrum (Fig. 2) was collected on powder (~1 mg) mixed with KBr in the range 6000–600 cm–1 at a spectral resolution of 4 cm–1, with a Bruker Vertex 70 spectrometer attached to a Bruker Hyperion 2000 IR-microscope. In the 1000–600 cm–1 range, sharp absorption bands seen at 890, 870, 805 and 700 cm–1 are related to metal–oxygen interactions. A broad band at ~1430 cm–1 is ascribed to a carbonate impurity in the powder absorber.
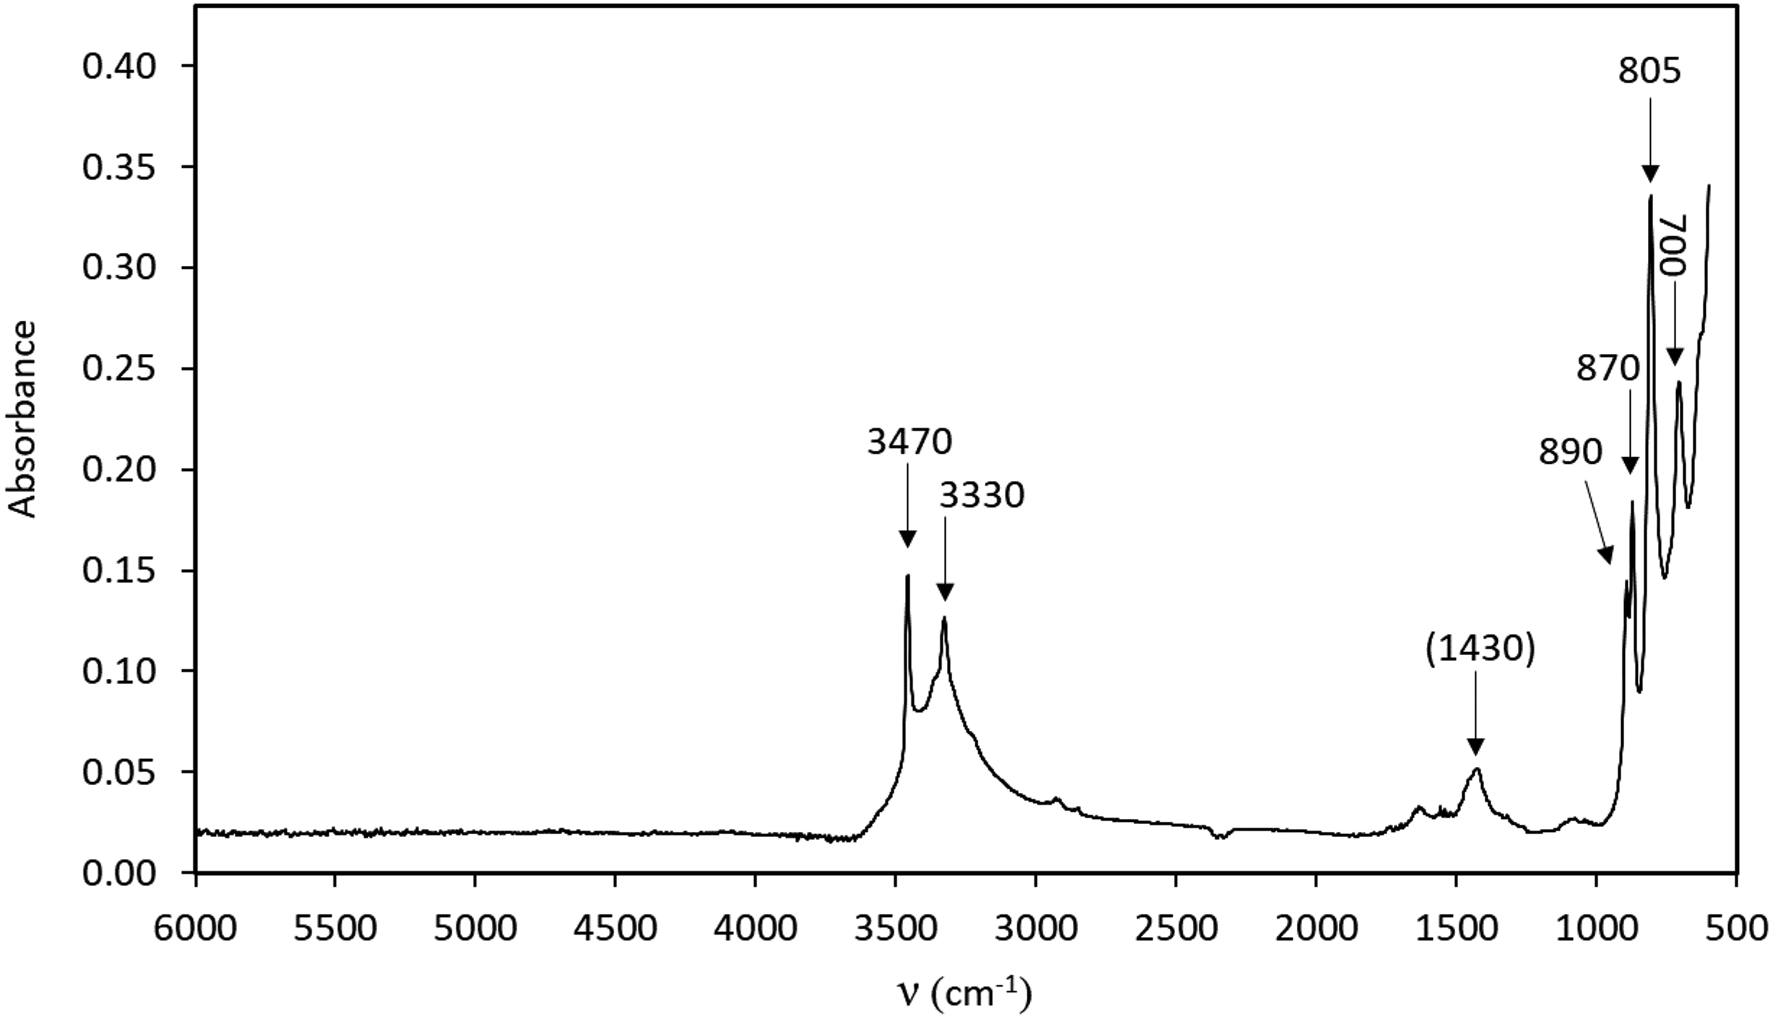
Fig. 2. FTIR spectrum (powder sample with KBr) of langhofite. The broad band at ca. 1430 cm–1 is related to a carbonate impurity.
A crystal fragment of ca. 70 μm thickness attached to a glass plate was measured with the same instrument using polarised light in the range 5000–2000 cm–1 for two vibration directions, approximately along and perpendicular to the elongation direction, of the crystal, respectively (Fig. 3). In the 4000–3000 cm–1 range of both types of spectra (powder and single crystal), two distinct absorption bands are identified at ca. 3470 and 3330 cm–1. Based on structural data (see paragraph below) these are assigned to the O–H stretching modes of two protonated O sites. A band visible in only one of the directions at 4100 cm–1 is probably related to metal–OH motions.
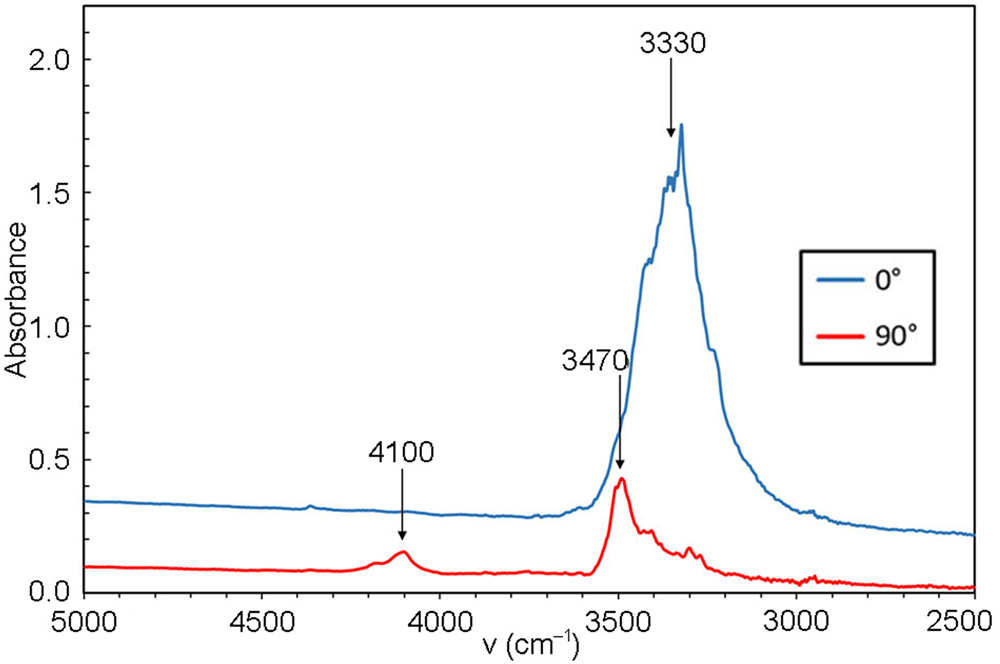
Fig. 3. Polarised FTIR spectra (single crystal in two mutually perpendicular directions, ~70 μm sample thickness).
Micro-Raman measurements were performed at room temperature using a Horiba (Jobin Yvon) LabRam HR Evolution. An unoriented polished crystal was excited with an air-cooled frequency doubled 532 nm Nd-YAG laser with an Olympus 100× objective (numerical aperture = 0.9). Spectra were generated in the range of 4000 to 25 cm–1 utilising a 600 grooves/cm grating. The spectral resolution was in the order of 1 cm–1 and the lateral resolution was ~1 μm. The wavenumber calibration was done using the 520.7 cm–1 Raman band on a polished silicon wafer with a wavenumber accuracy usually better than 0.5 cm–1. The spectrum shown (Fig. 4) was collected through 10 acquisition cycles with single counting times of 30 s in a close to back-scattered geometry. Two distinct peaks, corresponding to the OH bands in the FTIR spectrum, occur at 3459 and 3328 cm–1 (with a third one at 3070 cm–1 and a broad weak band centred at ca. 2900 cm–1). In the 900–350 cm–1 region, distinct Raman bands are seen at 862 (with a shoulder at ~850), 784, 664, 593, 462, 411 and 363 cm–1. The strongest peak at 862 cm–1 is ascribable to the symmetric W–O stretching vibrations of the WO6-octahedra, also found in related raspite (Bastians et al., Reference Bastians, Crump, Griffith and Withnall2004; Yang and Huang, Reference Yang and Huang2012) at 870 cm–1. The corresponding absorption in the IR spectrum of langhofite is at 870 cm–1 and of raspite at 874 cm–1 (Chukanov, Reference Chukanov2014).
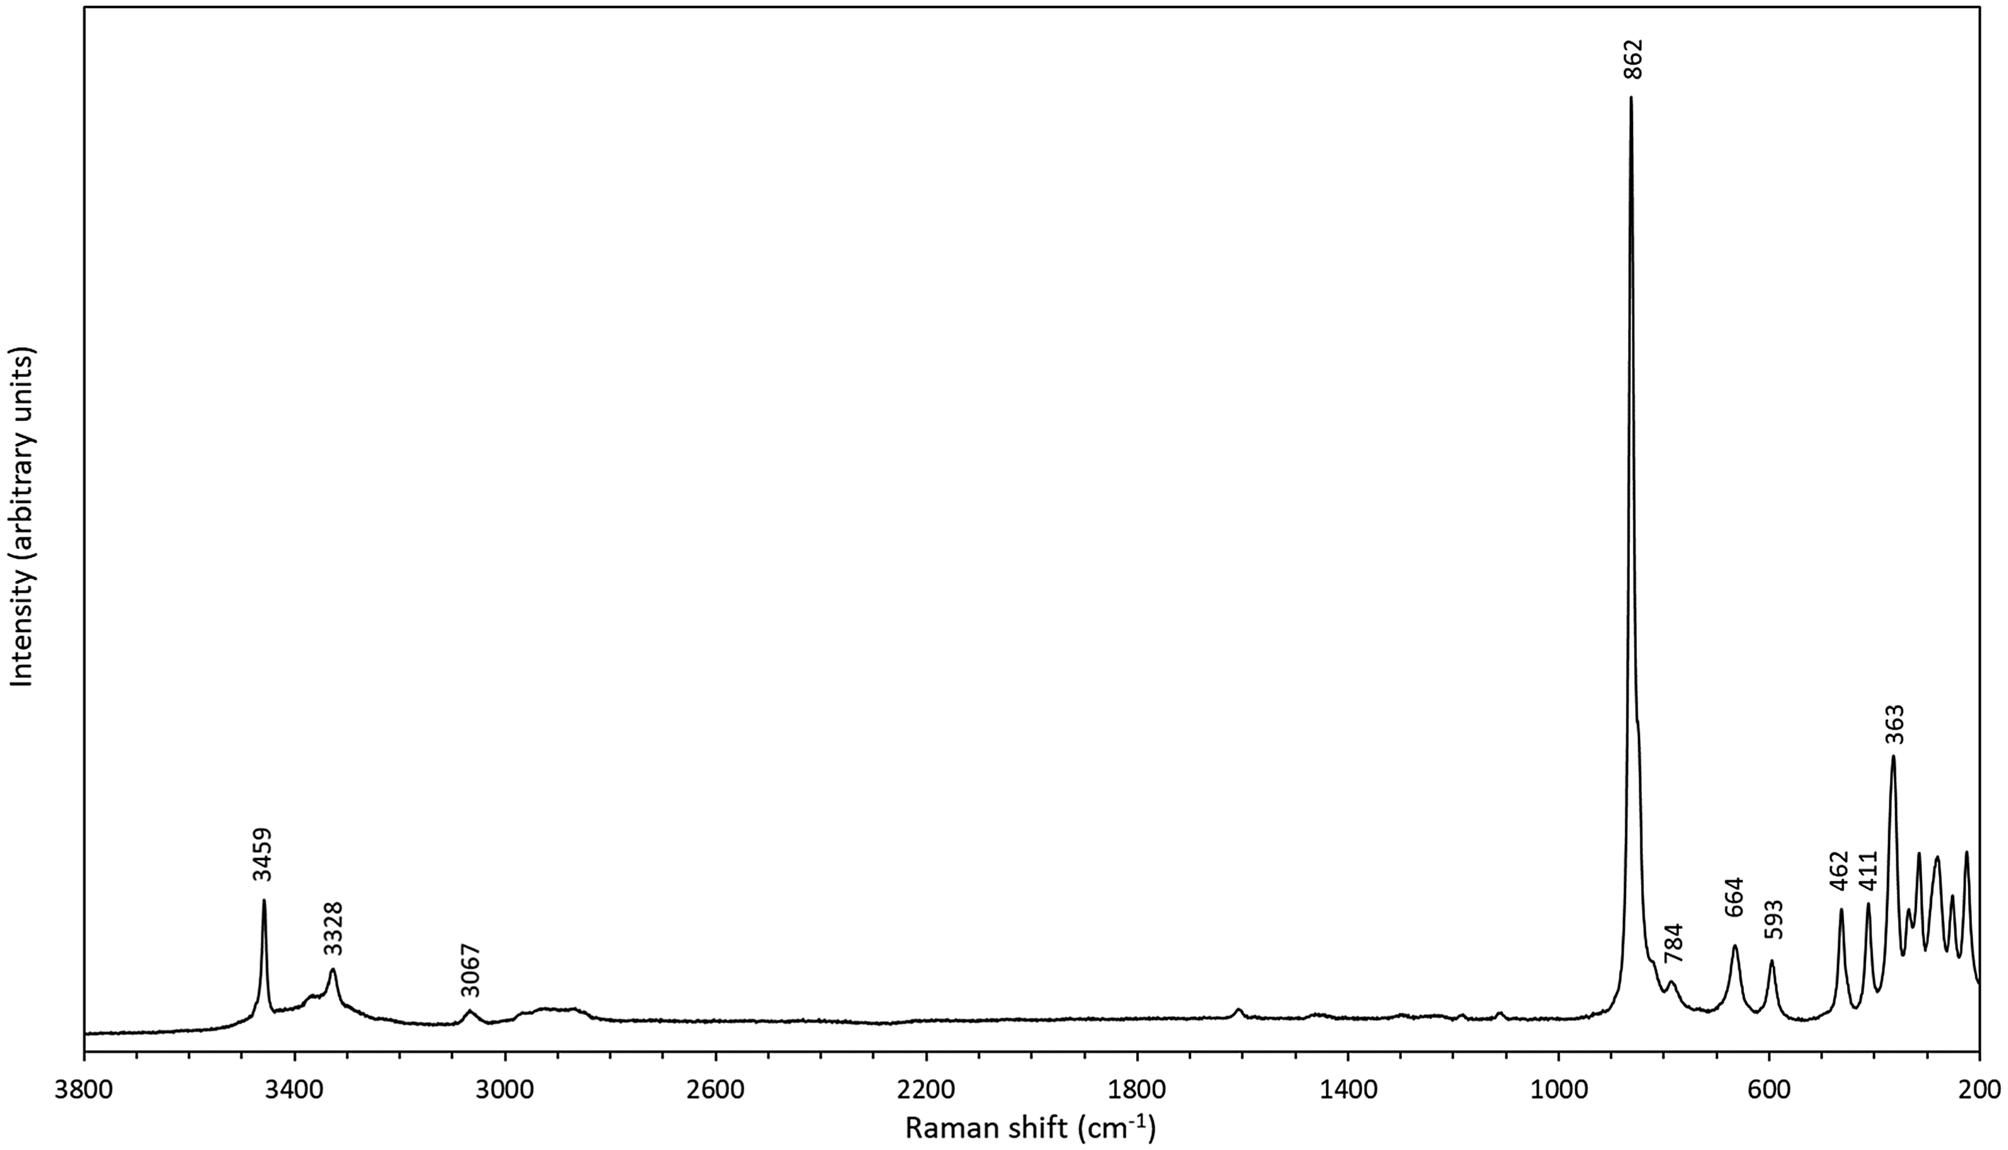
Fig. 4. Raman spectrum of langhofite, random section.
Chemical composition
Preliminary energy-dispersion X-ray (EDS) measurements showed only Pb, W and O in langhofite. A more precise determination of the composition was made from eight point analyses on a polished surface using a JEOL 8200 Super Probe (accelerating voltage 15 kV, sample current 5 nA, beam size 1 μm, counting time 30 s in peak and 10 s on the background positions) in wavelength dispersion (WDS) mode, with the reference materials galena (PbMα) and pure metal (WLα). Mo was analysed for, but found close to or below the detection limit. No other elements were detected in WDS spectrometer scans. H2O was not determined quantitatively, because of a dearth of material. The results (in wt.%) of the analyses, done on the crystal used for the single-crystal study (see below) are: PbO 63.51 (range 62.61–64.52), WO3 32.01 (31.35–32.40), H2Ocalc 2.52, total 98.04. The empirical composition is Pb2.03W0.99O4(OH)2 based on six O atoms per formula unit. The simplified formula is Pb2WO4(OH)2 and the ideal structural formula can be written as Pb2(OH)[WO4(OH)]; both require (in wt.%) PbO 64.11, WO3 33.30, H2O 2.59, total 100.00.
X-ray diffraction data and crystal-structure refinement
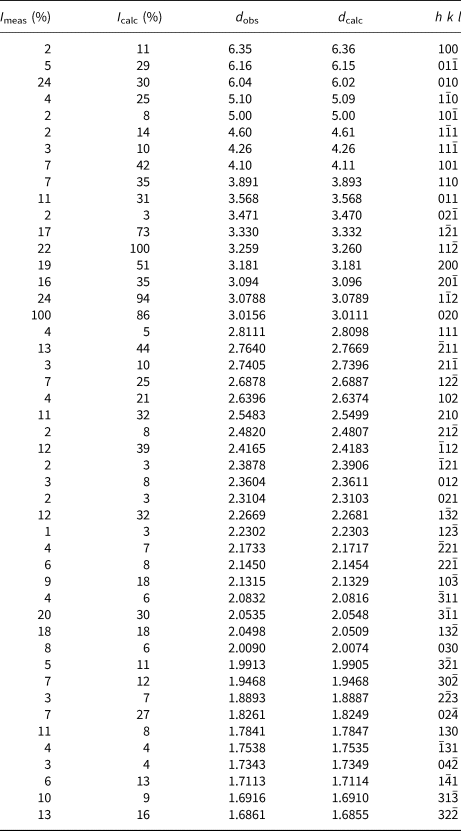
Powder X-ray diffraction data were recorded on a PANalytical X'Pert3 Powder diffractometer equipped with an X'celerator silicon-strip detector and operated at 40 mA and 45 kV (CuKα-radiation, λ = 1.5406 Å). Bragg peak positions were determined with the PANalytical HighScore Plus 4.6 software and corrected against an external Si standard (NBS 640b). Indexed d values and relative peak-heights above background are given in Table 2. The triclinic unit-cell parameters, obtained by least-squares refinement of forty-seven reflections, are a = 6.6118(3) Å, b = 7.0748(4) Å, c = 7.3264(4) Å, α = 118.125(6)°, β = 94.503(5)°, γ = 101.146(5)° and V = 290.79(3) Å3 for Z = 2.
Table 2. X-ray powder diffraction data (d in Å) for langhofite
A single-crystal X-ray study was done on a 146 μm × 90 μm × 10 μm crystal fragment (flat on (010)) using an Rigaku Oxford Diffraction XtaLAB Synergy diffractometer, with a PhotonJet X-ray source operating at 50 kV and 1 mA, with monochromatised MoKα radiation and equipped with a Hybrid Pixel Array detector (HyPix) at 62 mm from the sample position. A combination of 32 ω scans for 6570 images, with step scan 0.5° and exposure time 2.4/8.4 s per frame (depending on θ angle) were used to maximise redundancy and data coverage.
The crystal structure was solved using charge-flipping methods with SUPERFLIP (Palatinus and Cahpuis, Reference Palatinus and Chapuis2007) implemented in JANA2006 (Petříček et al., Reference Petříček, Dušek and Palatinus2014). The experimental data are summarised in Table 3. The structure was refined by least squares minimisation using SHELXL-2018/3 (Sheldrick, Reference Sheldrick2015). At convergence, with a model employing anisotropic displacement parameters, it was possible to locate one of the two protons in the structure, found close to the OH2 anion site. The position of this proton atom (H2) was added to the model and the isotropic displacement value was constrained to 1.2 × the U eq value refined at the OH2 site, following a riding model. The coordinates obtained at the Fourier-difference map were kept fixed as they yield unreasonable values if refined. The geometry of the hydrogen bonding is discussed below. Atomic coordinates, equivalent isotropic displacement parameters and calculated bond valences are given in Table 4. Bond distances are reported in Table 5. Anisotropic displacement parameters are reported in the crystallographic information file that has been deposited with the Principal Editor of Mineralogical Magazine and is available as Supplementary material (see below).
Table 3. Data and experimental details for single-crystal X-ray diffraction study of langhofite.
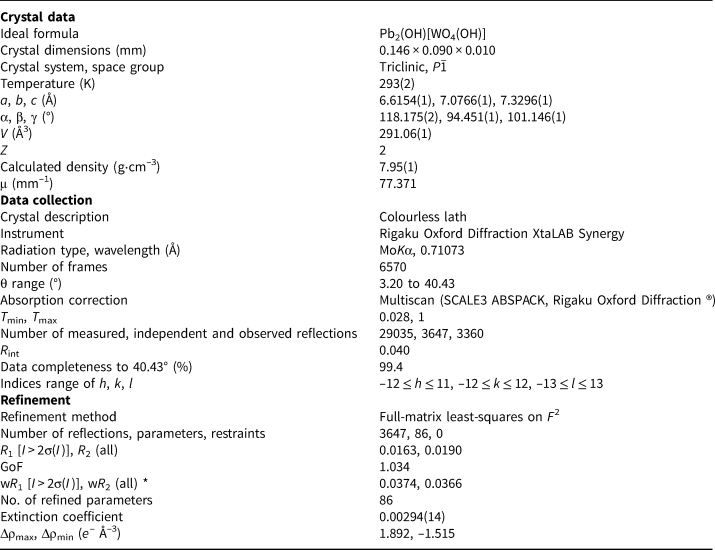
* Weighting scheme: w = 1/[σ2(F o2)+(0.0187P)2], where P=(F o2+2F c2)/3
Table 4. Fractional atomic coordinates, thermal parameters and bond-valence sums (BVS) of langhofite.
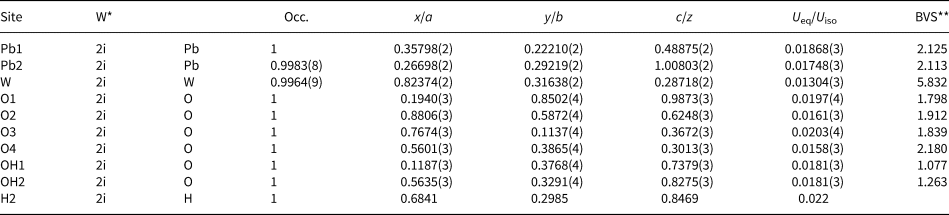
*W = Wyckoff position; ** BVS = Bond-valence sum and bond-valence parameters from Gagné and Hawthorne (Reference Gagnè and Hawthorne2015).
Table 5. Selected bond distances (Å) and angles (°) for langhofite.
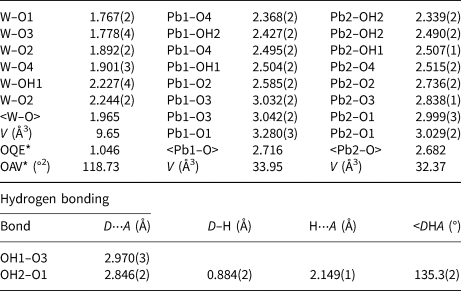
* OQE = Octahedral quadratic elongation and OAV = Octahedral angle variance in the sense of Robinson et al. (Reference Robinson, Gibbs and Ribbe1971).
D = donor O; A = acceptor O.
Description of the crystal structure
The structure of langhofite contains three cation sites: there are two unique Pb positions, Pb1 and Pb2, (4 + 4)-coordinated to O, and one W site. The W site is coordinated to five oxygen atoms and one (OH) group. It is strongly deformed (octahedral angle variance (OAV) = 118.73°2; Robinson et al. Reference Robinson, Gibbs and Ribbe1971), having two very short (<1.78 Å), two intermediate (ca. 1.90 Å) and two long distances (ca. 2.23 Å), of which one is to the (OH) group. The coordination polyhedra of the Pb atoms are significantly deformed, with Pb2+ off-centred toward four anions sites showing shorter distances (Table 5), and three significantly longer (>2.8 Å) distances involving the anion sites participating in the short W–O bonds (O1 and O3) (Fig. 5).

Fig. 5. The coordination environment of the two Pb sites and the W site in the structure of langhofite. The stronger (shorter) bonds are shown in red. Drawn with Vesta 3.0 (Momma and Izumi, Reference Momma and Izumi2011).
Bond balance incidence at cation sites confirm the expected charge for these sites. Bond-valence sums at the anion sites show: (1) two sites with values <1.27 valence units (OH1 and OH2 sites) and thus identified as (OH)-groups; (2) two slightly undersaturated sites (ca. 1.82 valence units for O1 and O3), even if involved in short W–O bonds; (3) one site close to the expected value (O2); and finally, (4) one site (O4) showing a bond valence incidence higher than expected (probably due to the high coordination number, 4, and three short bonding distances to Pb2+ cations).
The crystal structure of langhofite can be described in terms of the stronger bonds. Those are found in the highly distorted WO5(OH)-octahedra, which form [W2O8(OH)2]6– edge-sharing dimers (Fig. 6a). In addition, oxygen atoms at the OH2 site forms three very strong bonds with Pb atoms, thus forming (OH)Pb3 triangles. Two (OH)Pb3 share an edge and thus form a [(OH)2Pb4]6+ dimer (inset in Fig. 6b).
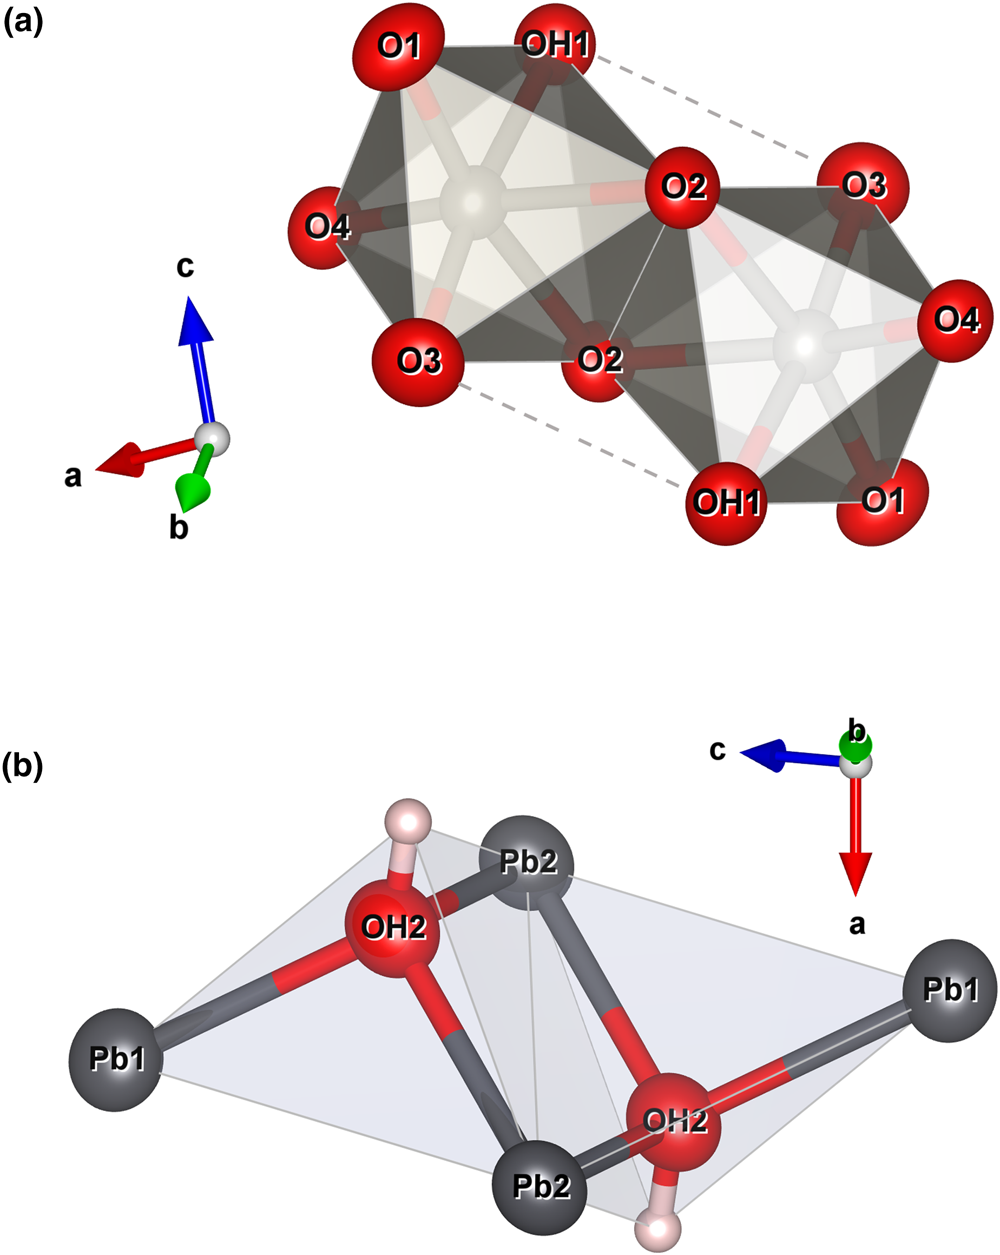
Fig. 6. Polyhedral representation of the [W2O8(OH)2]6– (a) and [(OH)2Pb4]6+ (b) dimers. Drawn with Vesta 3.0 (Momma and Izumi, Reference Momma and Izumi2011).
Both the [W2O8(OH)2]6– and [(OH)2Pb4]6+ units link, forming chains along [101] (Fig. 7a). The chains configure (010) layers when long Pb–O bonds are also considered (Fig. 7b). The (010) layers link along [010] through the longer and weaker Pb–O bonds, thus explaining the observed perfect cleavage on {010} (Fig. 8).
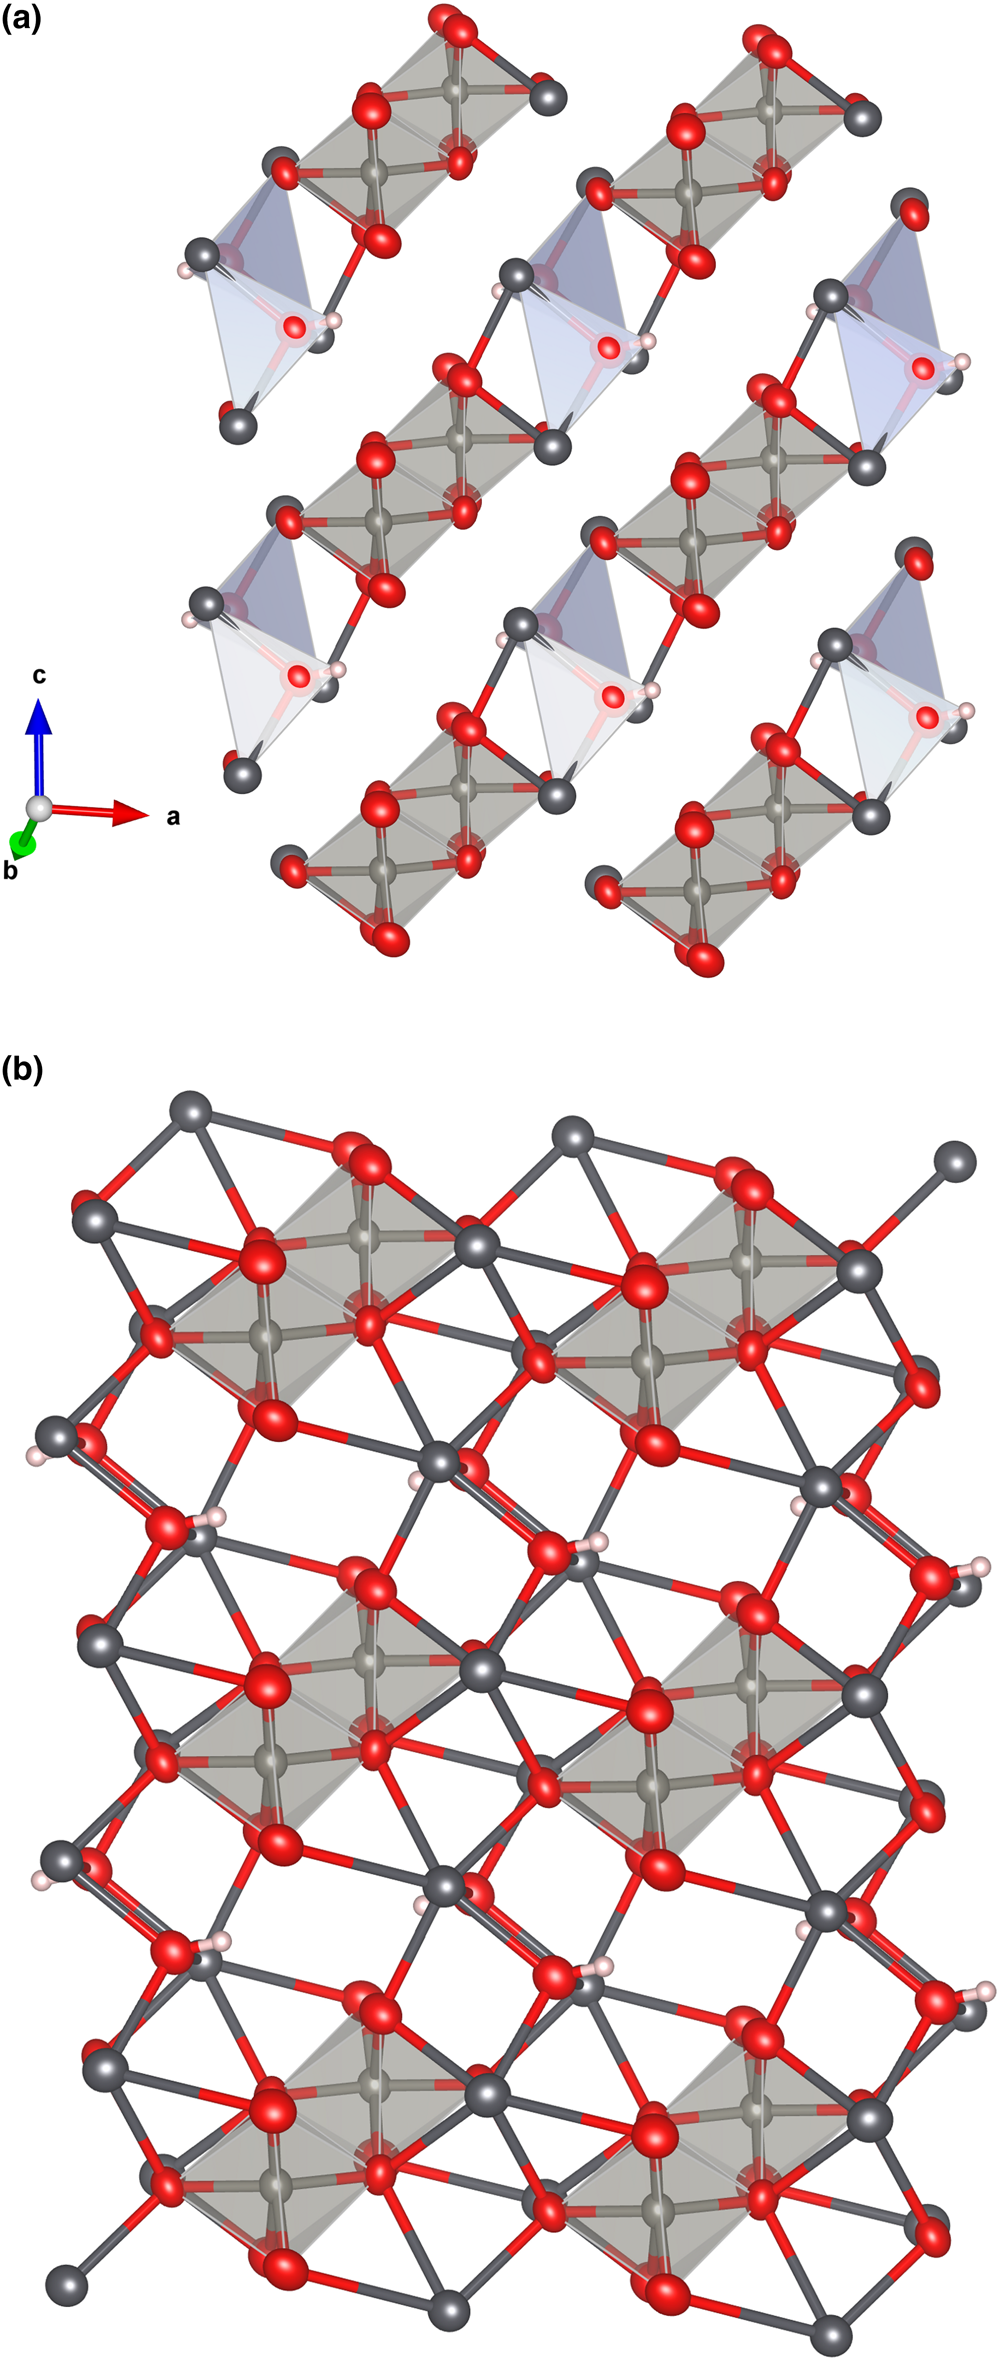
Fig. 7. The [W2O8(OH)2]6– and [(OH)2Pb4]6+ units forming chains along [101] in langhofite (a). The chains configure (010) layers when all the strong Pb–O bonds are considered (b). Drawn with Vesta 3.0 (Momma and Izumi, Reference Momma and Izumi2011).
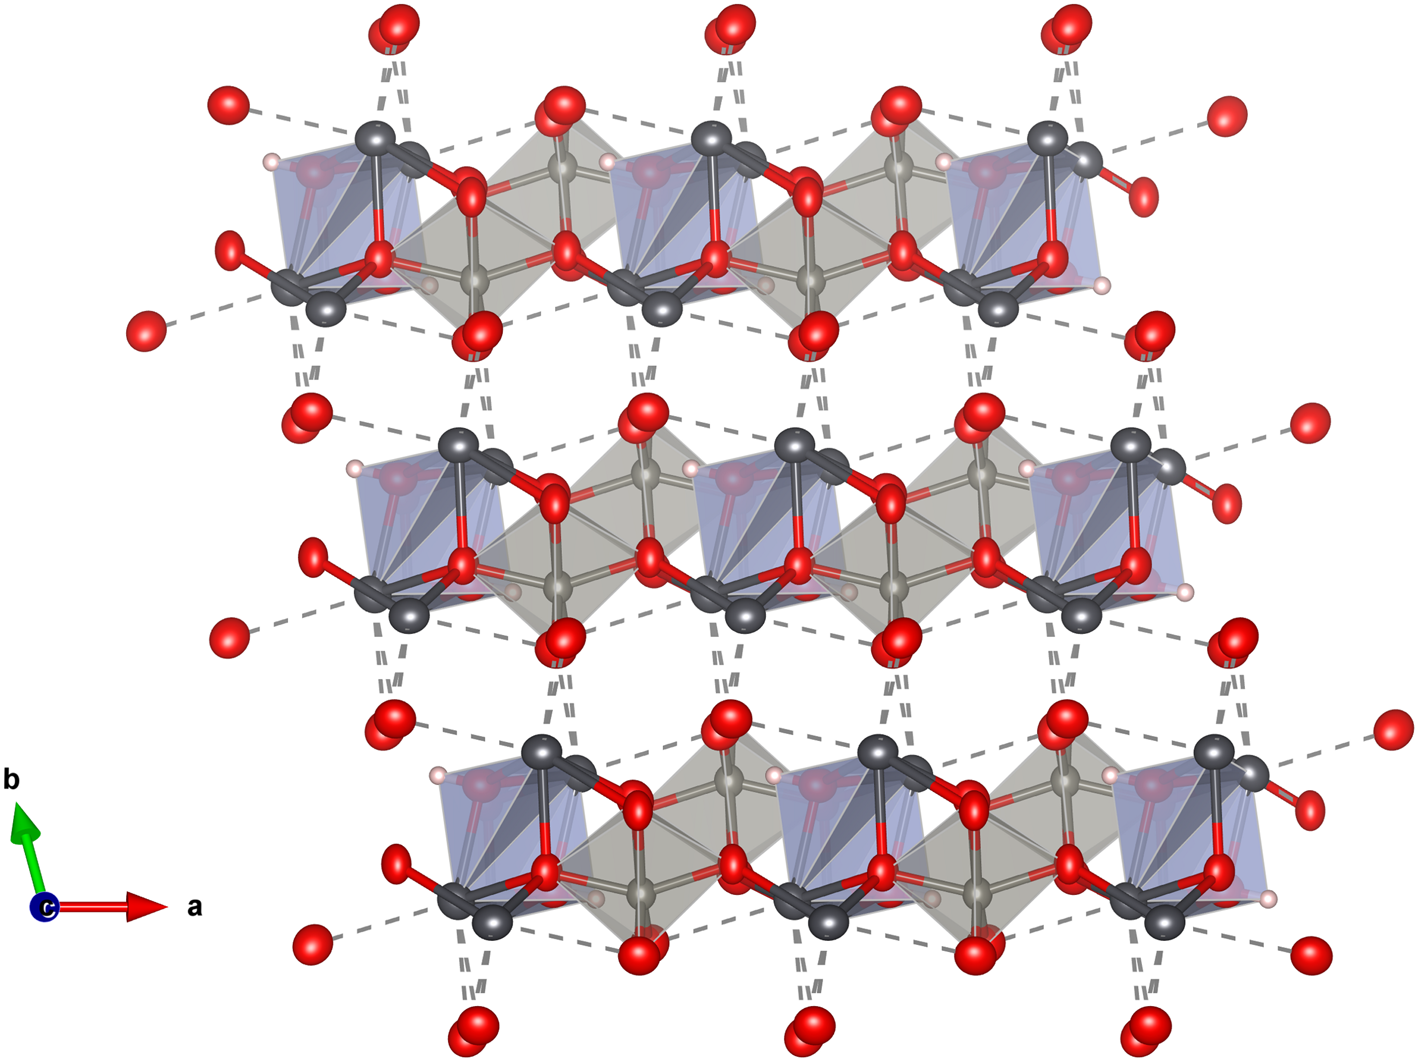
Fig. 8. The layered structure of langhofite: the (010) layers are linked along [010] through the weaker longer Pb–O bonds (shown with dashed lines). Drawn with Vesta 3.0 (Momma and Izumi, Reference Momma and Izumi2011).
Hydrogen bonding
Close to one of the two undersaturated oxygen sites, a residual electron density has been detected at a distance of 0.88 Å, thus corresponding to the plausible location of a proton of an (OH) group. Even if a very thin crystal was used for data collection and a high redundancy of reflections was collected to account for absorption correction, the high absorption coefficient (77.371 mm–1) and the huge scattering contrast between the metal cations and the protons make the localisation of hydrogen atoms difficult. However, considering the O–O distances, it can be observed easily that both OH1 and OH2 have shorter distances (<3 Å) compared to the O1 and O3 anion sites which are slightly undersaturated and thus ready to act as hydrogen bond acceptors. These short distances occur across the cavities alternating with WO5(OH) dimers along c and cross each other, thus explaining the polarisation behaviour observed for FTIR spectra for the bands at 3470 and 3330 cm–1. Using the empirical calibration of Libowitzky (Reference Libowitzky1999), the expected positions, based on the O⋅⋅⋅O distances, for these two bands are 3540 and 3458 cm–1, respectively. This is in reasonable agreement with the observations, considering that the located position of hydrogen at the H2 site is off the O1⋅⋅⋅OH2 line and thus represent a bent H bond. Bent hydrogen bonds are described by Libowitzky (Reference Libowitzky1999) as a possible reason for outliers in relation to the calibration curve. An increase of up to 70 cm–1 would then be due to the bending of the bond, thus correcting the calculated value for O1⋅⋅⋅OH2, in perfect agreement with the value observed in the FTIR spectra for one of the bands. It is expected that the OH1–H2 bond is also bent. There is no structural indication of H2O molecules in langhofite.
Relation with other species
In terms of mineral classification, langhofite fits in the Strunz group 04.FD (oxides-hydroxides with OH, without H2O; chains of edge-sharing octahedra). Of the few other chemically related minerals, belonging to other Strunz groups, stolzite (tetragonal PbWO4; a tungstate) and pinalite (Pb3WO5Cl2, oxyhalide, Grice and Dunn, Reference Grice and Dunn2000) have different anion coordination figures around the W6+ cation (four-fold for stolzite and five-fold for pinalite, respectively).
Considering instead the (OH)Pb3 triangles, these are present in other oxysalts and in some mineral species share vertex forming chains like in penfieldite (Pb2Cl3(OH), Merlino et al., Reference Merlino, Pasero, Perchiazzi and Gianfagna1995) where the chains develop along [001], or sharing edges forming infinite chains like in laurionite (PbCl(OH), Köchlin Reference Köchlin1887; Venetopoulos and Rentzeperis Reference Venetopoulos and Rentzeperis1975) where (OH)Pb3 triangles share edges and form chains along [010]. Sharing of edges by (OH)Pb3 triangles is also observed in Pb oxysalt minerals like in bideauxite (Pb2AgCl3F(OH), Cooper et al., Reference Cooper, Hawthorne, Merlino, Pasero and Perchiazzi1999) or siidraite (Pb2Cu(OH)2I3, Rumsey et al., Reference Rumsey, Welch, Kleppe and Spratt2017), where the triangle clusters form cubane-like [Pb4(OH)4]4+ units. Interestingly, pinalite also has (OH)Pb3 triangles sharing edges between themselves and with WO5 pyramids, configuring layers alternating with Cl atoms.
Concluding remarks
The crystal structure of langhofite, the only known Pb–W–O–H mineral without other cations, is of a novel type in Nature, showing [W2O8(OH)2]6– dimeric anions between a 3D framework of PbO8 polyhedra. Similar structural elements (edge-sharing WO6-octahedra), however, occur in raspite (monoclinic PbWO4; Fujita et al., Reference Fujita, Kawada and Kato1977; Andrade et al., Reference Andrade, Yang, Downs, Jenkins and Fay2014). The WO6 polyhedron is more distorted in langhofite (Table 5) than found for end-member raspite (from the OAV and quadratic elongation of 118.7°2 vs. 104°2 and 1.045 vs. 1.038, respectively; Andrade et al., Reference Andrade, Yang, Downs, Jenkins and Fay2014). The slightly longer average W–O bond in langhofite provides an explanation for the lower W–O stretching frequency observed (with Raman peaks at 863 and 870 cm–1, respectively).
Interestingly, the structure of langhofite is closely related to that of synthetic Pb3WO6 (Wang et al., Reference Wang, Chen, Borrmann, Zhang and Zhao2012). In this structure, an additional lead atom is placed in the cavities containing protons in langhofite, passing from Pb2WO4(OH)2 to Pb3WO6 through the substitution PbH–2. Synthetic Pb3WO6 was grown in hydrothermal experiments at T = 300°C and P = 600–800 bars, thus under similar conditions as inferred for langhofite (i.e. 200–400°C and <3.5 kbar). The protonation of langhofite must be ascribed to a milder alkalinity of the fluids as Pb3WO6 was grown in aqueous solution of NaOH (3.0 mol/l; Wang et al., Reference Wang, Chen, Borrmann, Zhang and Zhao2012). The exchange of Pb by two protons leads to a strain in the structure that goes from triclinic P  $\bar{1}$ to monoclinic P21/n symmetry. This relaxation is also observed in the geometry of the W site that, whereas still showing a short distance [W–O4 = 1.770(8) Å], is certainly less deformed (OAV = 72°2). The W6+–W6+ distance within the [W2O10]8– dimer is 3.341(1) Å, even longer than within the [W2O8(OH)2]6– dimer in langhofite, 3.286(1) Å.
Supplementary material
To view supplementary material for this article, please visit https://doi.org/10.1180/mgm.2020.28
Acknowledgements
This paper is dedicated to the memory of the brilliant Paul B. Moore (1940–2019), who inspired a whole generation of modern Långban researchers. Torbjörn Lorin is thanked for the colour photograph of langhofite. F.C. acknowledges financial support by the grant Ricerca Locale 2019, Università di Milano and from the Italian Ministry of Education (MIUR) through the project “Dipartimenti di Eccellenza 2018–2022”. The reviews by O. Siidra and A.R. Kampf significantly improved the paper.


 Open access