the Creative Commons Attribution 4.0 License.
the Creative Commons Attribution 4.0 License.
 | 11 Aug 2020
Quantifying the buffering of oceanic oxygen isotopes at ancient midocean ridges
To quantify the intensity of oceanic oxygen isotope buffering through hydrothermal alteration of the oceanic crust, a 2D hydrothermal circulation model was coupled with a 2D reactive transport model of oxygen isotopes. The coupled model calculates steady-state distributions of temperature, water flow and oxygen isotopes of solid rock and porewater given the physicochemical conditions of oceanic crust alteration and seawater δ18O. Using the present-day seawater δ18O under plausible modern alteration conditions, the model yields δ18O profiles for solid rock and porewater and fluxes of heat, water and 18O that are consistent with modern observations, confirming the model's validity. The model was then run with different assumed seawater δ18O values to evaluate oxygen isotopic buffering at the midocean ridges. The buffering intensity shown by the model is significantly weaker than previously assumed, and calculated δ18O profiles of oceanic crust are consistently relatively insensitive to seawater δ18O. These results are attributed to the fact that isotope exchange at shallow depths does not reach equilibrium due to the relatively low temperatures, and 18O supply via spreading solid rocks overwhelms that through water flow at deeper depths. Further model simulations under plausible alteration conditions during the Precambrian showed essentially the same results. Therefore, δ18O records of ophiolites that are invariant at different Earth ages can be explained by the relative insensitivity of oceanic rocks to seawater δ18O and do not require constant seawater δ18O through time.
- Article
(8432 KB) - Full-text XML
-
Supplement
(6941 KB) - BibTeX
- EndNote


Hydrothermal alteration of oceanic crust at midocean ridges works as the dominant source and/or sink of several elements and/or isotopes in the ocean (e.g., Wolery and Sleep, 1976; Elderfield and Schultz, 1996). Notably, oxygen isotopes have been considered to be primarily controlled by isotope exchange at midocean ridges. The observation of oceanic crustal δ18O has revealed that oceanic rocks gain and lose 18O through low- and high-temperature hydrothermal alteration at shallow and deeper depths, respectively. The close balance between the addition and removal of the heavy isotope, together with the huge oxygen supply from the mantle, has led to a hypothesis that the water–rock interactions at midocean ridges have buffered oceanic δ18O at the present-day value (0 ‰ relative to standard mean ocean water – SMOW) throughout the Earth's history (e.g., Muehlenbachs and Clayton, 1976; Gregory and Taylor, 1981; Holland, 1984; Muehlenbachs, 1998). Age-invariant δ18O records of ophiolites (ancient oceanic crust) have been argued to support the hypothesis (e.g., Holmden and Muehlenbachs, 1993).
In contrast to ophiolites, sedimentary rocks (e.g., carbonates, cherts, phosphorites and shales) have shown secular δ18O increases with the Earth's age; sedimentary rocks in the Precambrian are depleted in 18O by as much as 10 ‰ compared to modern sediments (e.g., Shemesh et al., 1983; Karhu and Epstein, 1986; Bindeman et al., 2016), and the exception to this has rarely been reported (e.g., Blake et al., 2010). In theory, if constituting minerals of sedimentary rocks were formed in equilibrium with seawater, and if the later diagenetic or metamorphic modification of δ18O was negligible, δ18O records of sedimentary rocks can be utilized to infer surface temperatures of the past, using temperature-dependent isotope fractionation factors and assuming the δ18O value of seawater from which the constituting minerals formed. Indeed, several authors have suggested hot climates in the Precambrian from 18O-depleted sedimentary records assuming the present-day seawater δ18O (e.g., 70±15 ∘C at 3.2–3.5 Ga and 50–60 ∘C through the later Precambrian; Knauth and Lowe, 2003; Knauth, 2005). Such high temperatures are apparently at odds with glacial records observed through the Precambrian (e.g., Catling and Kasting, 2017, Chap. 11). If one excludes hot climates based on the glacial records, one must conclude that sedimentary δ18O records do not reflect seawater δ18O (e.g., instead reflecting diagenetic or metamorphic overprints) and/or that seawater δ18O has changed through time (e.g., Walker and Lohmann, 1989). The latter conclusion has recently been supported by Proterozoic–Phanerozoic marine iron (oxyhydr)oxides, whose δ18O shows a similar secular evolution to those in sedimentary rocks despite its weak temperature dependence (Galili et al., 2019). On the other hand, the secular change in seawater δ18O apparently conflicts with the result derived from ophiolites: an invariant seawater δ18O resulting from strong oceanic δ18O buffering at midocean ridges. Overall, one cannot rely on sedimentary δ18O to reconstruct ancient surface temperatures and discuss associated climate forcings unless δ18O records of sedimentary rocks and ophiolites can be explained at the same time (cf. Godderis and Veizer, 2000; Vérard and Veizer, 2019).
Several hypotheses have been put forward to reconcile apparently conflicting invariant and variant δ18O records of respective ophiolites and sedimentary rocks. Perry et al. (1978) pointed out that oceanic rocks in the Precambrian were more mafic than in the present day and this could have resulted in a more intense low-temperature alteration of oceanic crust, removing more 18O from seawater than today. Walker and Lohmann (1989) argued that the midocean ridges could have been above sea level in shallower Precambrian oceans. Resultant subaerial water–rock interactions at low temperatures could then have removed a large amount of 18O from the Precambrian oceans. Even if midocean ridges were below the sea level, lower pressures on the seafloor in the shallow oceans could have brought less water into the oceanic crust, and water–rock interactions at midocean ridges could have been dominated by those at low temperatures at shallower depths, again resulting in lower oceanic δ18O in the Precambrian (Kasting et al., 2006). The absence of biogenic sediment cover during the Precambrian could also have contributed to more significant low-temperature seafloor alteration and a lower seawater δ18O (e.g., Jaffrés et al., 2007). The above arguments, however, give possible explanations only for low oceanic δ18O during the Precambrian; they do not explain age-invariant ophiolite δ18O records. Wallmann and colleagues have indicated that the invariant δ18O records of ophiolites can be explained by decoupling ancient oceanic crust from the contemporaneous seawater δ18O (e.g., Wallmann, 2001; Jaffrés et al., 2007). However, the simple box models considered by these authors cannot explain whether and/or how this decoupling could have been made possible (Jaffrés et al., 2007).
To resolve the issue, a process-based approach that simulates oxygen isotope behavior during oceanic crust alteration is indispensable. Lécuyer and Allemand (1999) developed an oxygen isotope exchange model, which utilizes prescribed distributions of temperature and water∕rock ratio within oceanic crust and an equation for half-closed systems (e.g., Gregory et al., 1989), and is thus not entirely process based. Using this model, Lécuyer and Allemand (1999) concluded that oceanic δ18O cannot change from the present-day value by more than 2 ‰ due to the strong buffering exhibited by their modeled isotope exchange at midocean ridges. This conclusion contrasts with that of Wallmann (2001), who adopted a box model to argue that the buffering must have been weak and that the oxygen isotopic composition of the ocean has evolved through the Phanerozoic. These conflicting conclusions from different models emphasize that a mechanistic understanding of oxygen isotope behavior during oceanic crust alteration is lacking.
The present study develops a process-based model to simulate oxygen isotope behavior during hydrothermal alteration of oceanic crust and presents its application to the Precambrian. A 2D hydrothermal circulation model presented in the literature is combined with a 2D reactive transport model of oxygen isotopes. The coupled model can thus yield 2D distributions of solid rock and porewater δ18O reflecting alteration conditions, including seawater δ18O and hydrothermal fluid circulation. After confirming the model's validity by comparing the model results that assume the present-day seawater δ18O with modern observations, we examine the intensity of oceanic δ18O buffering by hydrothermal alteration of oceanic crust at midocean ridges by changing seawater δ18O. The buffering quantification is then conducted under different physicochemical conditions, which could have been the case during the Precambrian, to give insights into how oceanic δ18O could have been affected by water–rock interactions at midocean ridges during the Earth's early eons.
2.1 Hydrothermal circulation model
Hydrothermal flow circulating around midocean ridges is simulated in 2D based on conservations of energy, mass and momentum (Steefel and Lasaga, 1994; Cherkaoui et al., 2003; Iyer et al., 2010). Assuming a steady state, the mass conservation of fluid is represented by
where ∇ is the vector differential operator () and q is the mass flux vector (). Conservation of momentum is realized by adopting Darcy's law (e.g., Steefel and Lasaga, 1994):
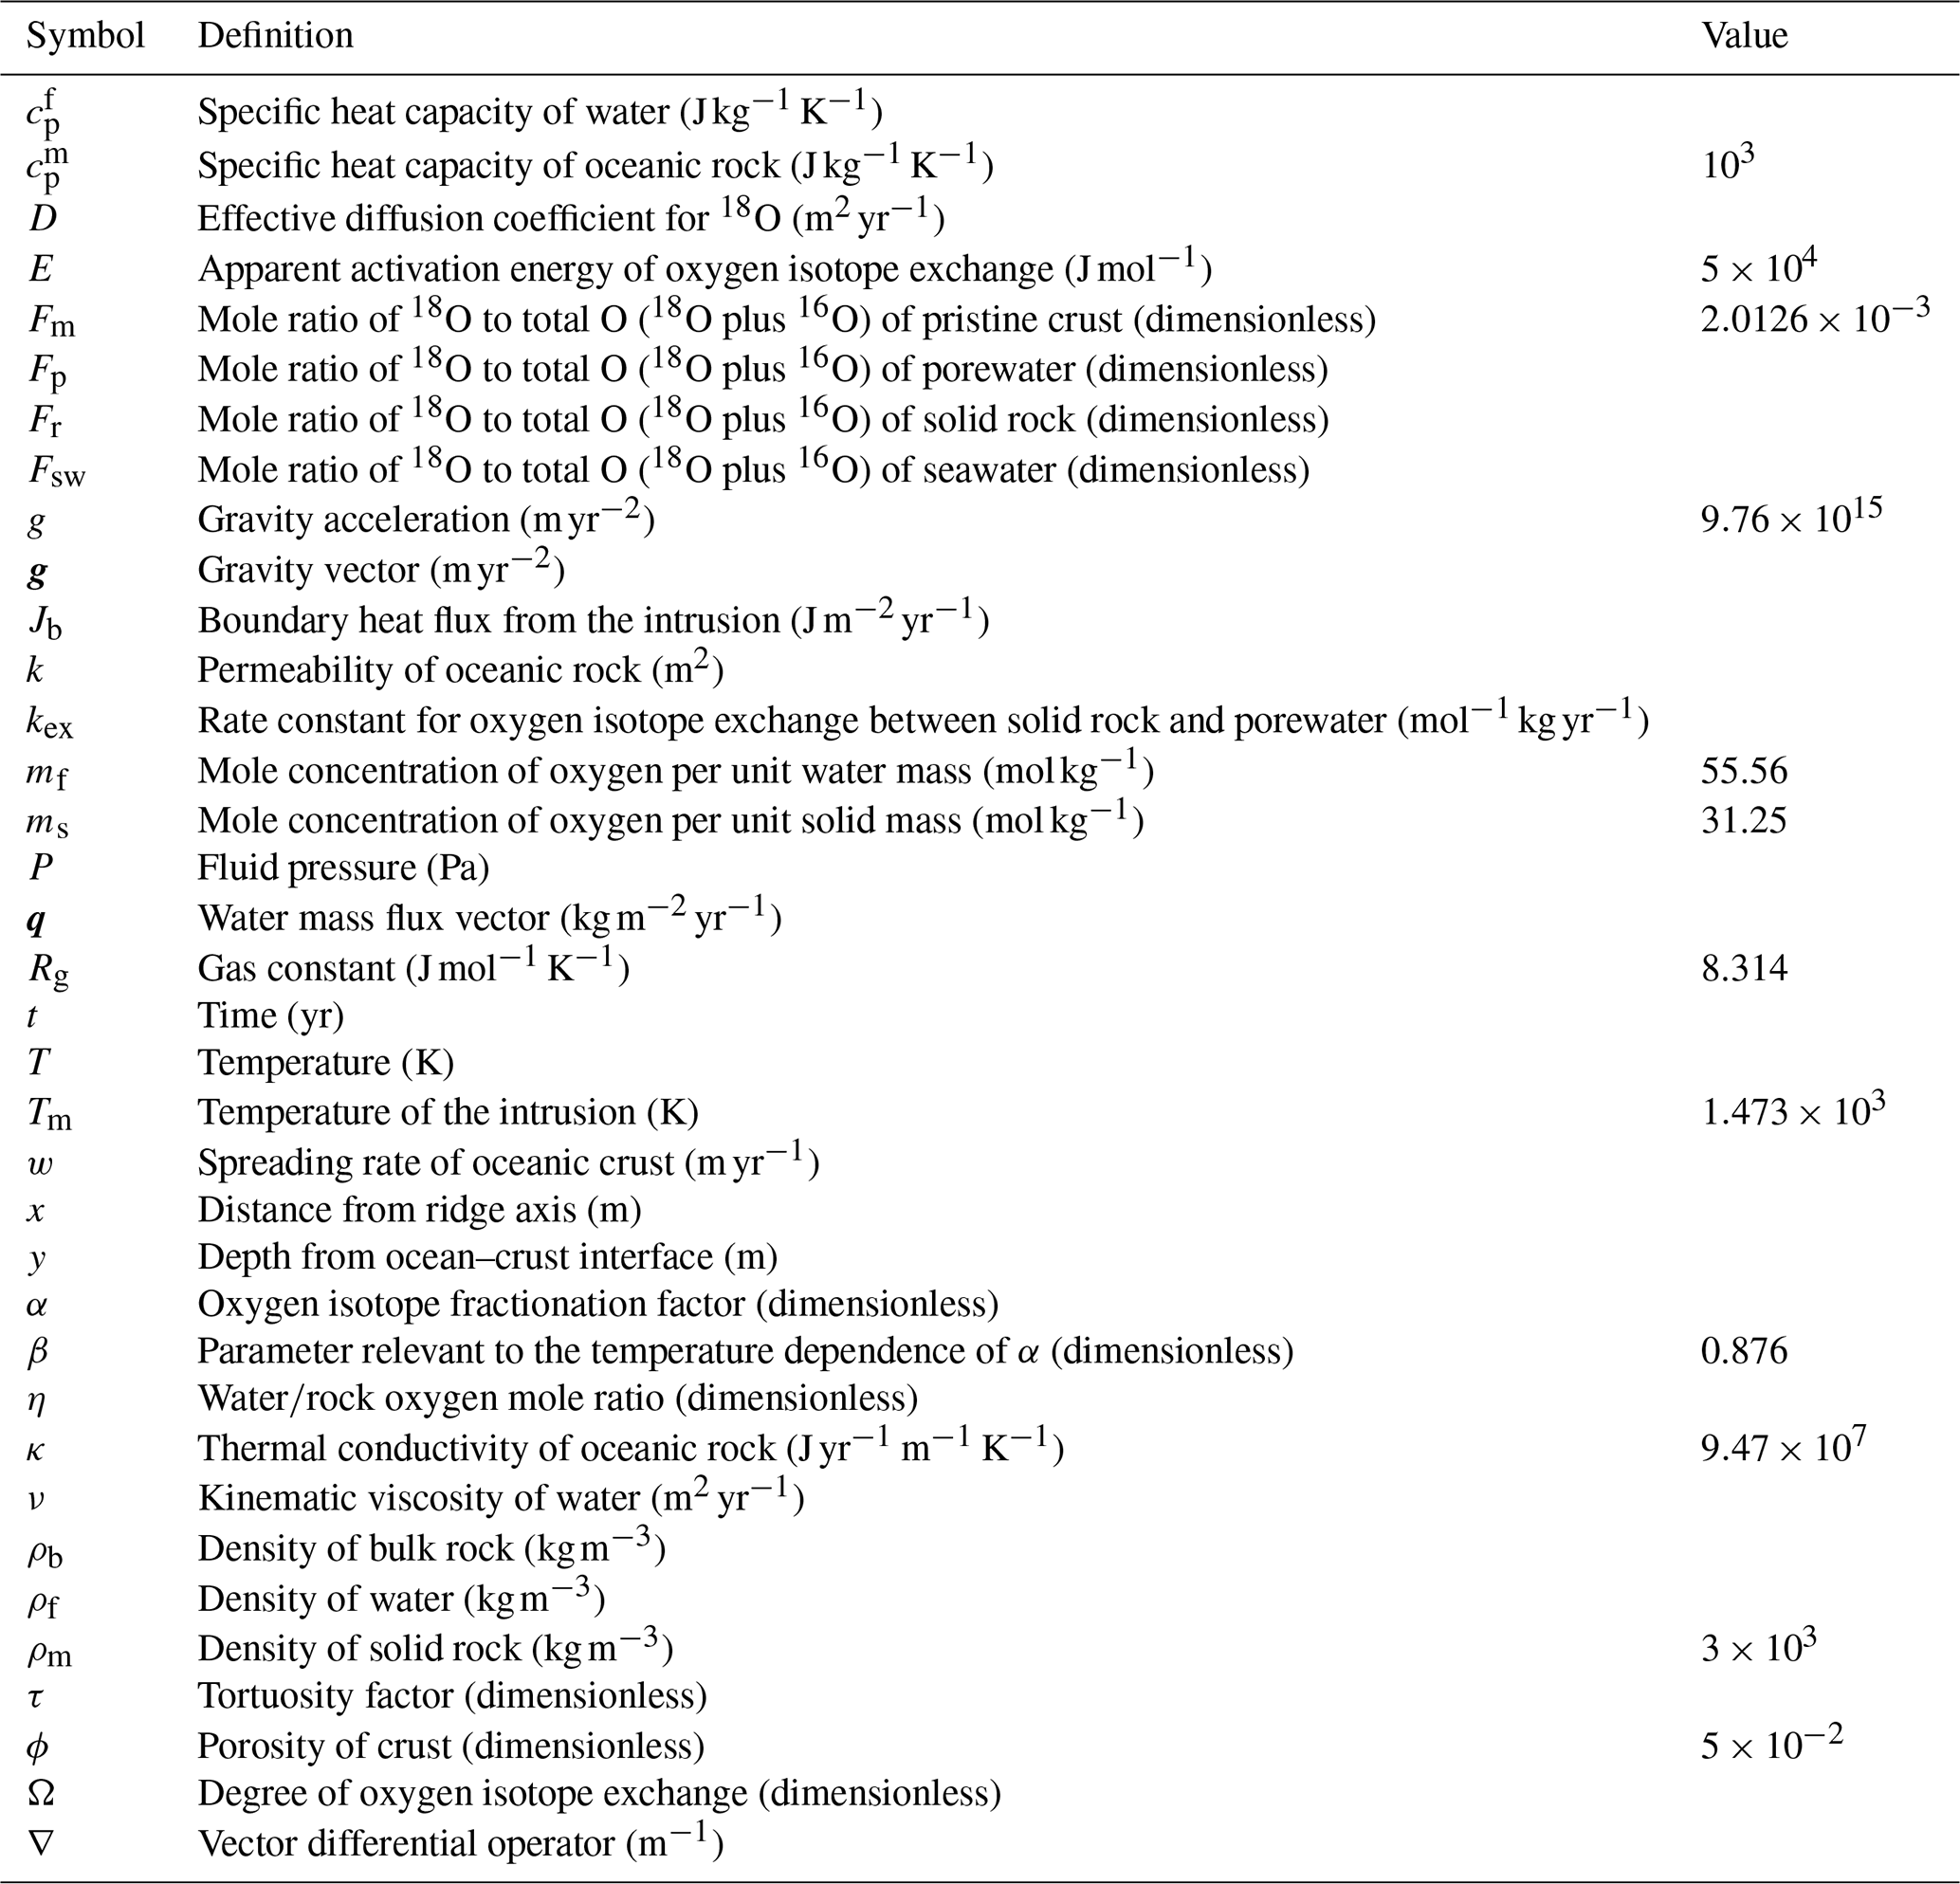
where k is the permeability of oceanic bulk rock (m2), ν is the kinematic viscosity of water (m2 yr−1), P is the fluid pressure (Pa), ρf is the fluid density (kg m−3), and g is the gravity vector given by where g represents the acceleration by gravity (m yr−2; e.g., Steefel and Lasaga, 1994). The energy conservation is represented by the following:
where t is time (yr), ϕ is the porosity, ρm is the density of oceanic rock (kg m−3), and are the specific heat capacity of water and oceanic rock, respectively (), T is the temperature (K), and κ is the thermal conductivity of oceanic rock (). The thermodynamic and transport properties of water (, ρf and ν) are obtained through a FORTRAN90 library STEAM, which is based on the NBS steam table package (Meyer et al., 1983; Haar et al., 1984). As in Iyer et al. (2010), we assume pure water for hydrothermal fluid. The petrophysical parameters, except for the permeability (i.e., κ, ϕ, ρm and ), are assumed to be the same as those in Iyer et al. (2010). We assume that log k exponentially decreases from −11.8 to −16.8 with a length scale of 300 m for an e-fold decrease, which is consistent with observations (Fisher, 1998, see the Supplement). Following Cherkaoui et al. (2003), oceanic rocks below the crust–mantle interface (6 km depth from the ocean–crust interface), and with temperatures above the critical temperature for rock cracking (600 ∘C), are impermeable. As long as the model is consistent with observations, changing the assumptions about permeability does not affect the general conclusions given in the present study (see the Supplement).
The boundary conditions adopted in the present study follow those by Iyer et al. (2010) and/or Cherkaoui et al. (2003). Pressure at the ocean–crust interface is assumed to be constant at 25 MPa, corresponding to the assumption of a 2.5 km water depth. This assumption is modified when we explore the Precambrian hydrothermal circulation in Sect. 3.3. The right and bottom sides of the calculation domain are assumed to be insulating. The ocean above the top boundary is assumed to have a constant temperature of 2 ∘C. The ridge axis on the left-hand boundary is assumed to supply a boundary heat flux Jb (J m−2 yr−1):
where w is the spreading rate (m yr−1) and Tm is the temperature of the intrusion (1200 ∘C). As a standard value, we assume m yr−1 for w, and this assumption is again changed in Sect. 3.3 in which we consider the Precambrian hydrothermal circulation. Free flow is allowed at the top boundary, and the other boundaries are assumed to be impermeable (Iyer et al., 2010). The calculation domain is wide enough (see below) so that making the right-hand boundary permeable with respect to heat and water will change the results only negligibly (cf. Supplement; Cherkaoui et al., 2003). See Table 1 for the definitions and values of the parameters used in the present study.
A finite difference approach is taken to solve Eqs. (1)–(3) for q, P and T using the second-order central differencing scheme for the second-order differential terms and the first-order upwind and forward-differencing schemes for the first-order spatial and temporal differential terms, respectively (e.g., Steefel and Lasaga, 1994). The calculation procedure follows that of Iyer et al. (2010). First, we obtain P by solving Eqs. (1) and (2). Then, q is obtained from the calculated P and Eq. (2). Finally, the calculated q is used in Eq. (3), which is solved to obtain T for the same time step. The calculated P and T are used to update the thermodynamic and transport properties of water for the next calculation step. The above procedure is repeated with a time step of 3×10⁴ years until steady states are reached, which is accomplished within 103 time steps or 3×10⁷ model years (cf. Cherkaoui et al., 2003). Note that only steady states are considered in this study because of the long timescale over which oceanic oxygen isotopic composition can change ( year; e.g., Holland, 1984; Walker and Lohmann, 1989; Wallmann, 2001). The model grid extends as deep as 12 km from the ocean–crust interface, allowing changes in the location of the crust–mantle interface (though not varied in this study); and it extends to a 30 km distance from the ridge axis, wide enough to simulate major changes in oxygen isotopic composition of oceanic crust which have been observed to be completed within less than 10 Myr from the rock formation at midocean ridges (Muehlenbachs, 1979, see the Supplement for more details). The calculation domain (12×30 km2) is divided into a 320×200 irregular grid, with the grid-cell size increasing horizontally from the ridge axis (1.1 to 330 m) and vertically from the ocean–crust interface (0.17 to 82 m; cf. Cathles, 1983; Cherkaoui et al., 2003).
2.2 Reactive transport model of oxygen isotopes
Oxygen isotopes of solid rock are assumed to be transported by the spreading of oceanic rocks, while those of porewater are transported by water flow and molecular diffusion (cf. Norton and Taylor, 1979; Lécuyer and Allemand, 1999). At the same time, isotope exchange reactions transfer 18O between the two phases (e.g., Norton and Taylor, 1979; Lécuyer and Allemand, 1999). Then, from the mass conservation of 18O in the two phases, the time rates of change in the 18O∕total O mole ratios of solid rock and porewater (Fr and Fp, respectively) can be represented by
where ms and mf are the oxygen concentrations of solid rock and porewater, respectively (mol kg−1), ρb is the density of bulk rock given by , kex is the rate constant for oxygen isotope exchange (), α is the oxygen isotope fractionation factor, and D is the effective diffusion coefficient for 18O (m2 yr−1) determined by molecular diffusion and hydrodynamic dispersion. The first and second terms on the right-hand sides of Eqs. (5) and (6) represent oxygen isotope transport and oxygen isotope exchange, respectively. The kinetic expression of oxygen isotope exchange in Eqs. (5) and (6) is formulated based on Cole et al. (1983, 1987) and the rate constant is given by an Arrhenius equation:
where E is the apparent activation energy (5×10⁴ J mol−1) and Rg is the gas constant (8.314 ). The value of 10−8.5 at reference temperature 278 K (5 ∘C) is obtained by reducing the range 10−7.2–10−6.6 at 5 ∘C extrapolated from 10−2.1–10−1.5 at 300 ∘C (Cole et al., 1987) with J mol−1 (cf. Cole et al., 1987) and 103 m2 kg−1 specific surface area of marine basalt (cf. Nielsen and Fisk, 2010) by a factor of 101.3–101.9. The reducing factor (101.3–101.9) accounts for the fact that the reaction rate in the field is generally slower than in the laboratory by a factor of up to 103 (e.g., Wallmann et al., 2008, see the Supplement for details). A similar factor (up to 104) has been adopted by Cathles (1983) for the formulation of oxygen isotope exchange kinetics. Note that the general results and conclusions in the present study are not affected by changes in the reference kex value within a plausible range (see the Supplement). The oxygen isotope fractionation factor for andesite by Zhao and Zheng (2003) is adopted in the present study as follows:
where β=0.876 (Zhao and Zheng, 2003) because Eq. (8) with β=0.876 yields comparable α values to experimental results for basalt by Cole et al. (1987) at 300–500 ∘C, while being applicable over the wider range of temperature considered for the present study (2–1200 ∘C). The effective diffusion coefficient D considers both molecular diffusion and hydrodynamic dispersion; the former is obtained from the modified Stokes–Einstein relation for diffusion by Krynicki et al. (1978) and the isotope effect from Harris and Woolf (1980) and a homogeneous dispersivity of 10 m is assumed for the latter (Frind, 1982; Gelhar et al., 1992) as follows:
The first term on the right-hand side of Eq. (9) represents the molecular diffusion including the tortuosity factor τ=ϕ1.4 (Aachib et al., 2004), while the second term represents the hydrodynamic dispersion. The petrophysical parameters are assumed to be the same as those in the hydrothermal circulation model (Sect. 2.1; Table 1). The thermodynamic and transport properties of water are obtained through the hydrothermal circulation model (Sect. 2.1).
The steady-state values of Fr and Fp are obtained by solving in Eqs. (5) and (6). The intrusion on the left-hand boundary is assumed to have an 18O∕total O mole ratio of fresh crust (Fm) that corresponds to 5.7 ‰ relative to SMOW (e.g., Holmden and Muehlenbachs, 1993), and the ocean above the top boundary is assumed to have a constant 18O∕total O mole ratio of seawater (Fsw). The other boundaries are impermeable for 18O fluxes via water (see Sect. 2.1). A finite difference method is used for equation discretization (first-order upwind and second-order central differencing schemes for the first-order and second-order spatial differential terms, respectively) and Newton's method is adopted to solve the difference equations. The calculation is conducted on the grid described earlier for the hydrothermal circulation model (Sect. 2.1). The 18O mole ratios are all reported in δ notation relative to SMOW, using as the 18O∕16O mole ratio of SMOW (Fry, 2006).
3.1 Application to the present day and model validation
The calculated flow geometry and temperature distribution (Fig. 1; note that Fig. 1c and d are plots of Fig. 1a and b, respectively, on logarithmic scales) are similar to those in previous studies (e.g., Cherkaoui et al., 2003). The 2D model results can be converted to associated mass and heat fluxes, assuming 108 m ridge length (cf. Wolery and Sleep, 1976). The total heat flux from the system is 0.74×10¹² W, which is comparable to the observed cumulative heat flux within 1 Myr (corresponding to 30 km with m yr−1 spreading rate) from the ridge axis, W (Stein and Stein, 1994). The total mass of water exchange is 1.2×10¹³ kg yr−1, falling within the constrained range (3×10¹² to 1.6×10¹⁴ kg yr−1) and close to the recommended value ( kg yr−1) by Elderfield and Schultz (1996), and is also comparable to the prediction from other hydrothermal circulation models (e.g., Norton and Knight, 1977; Fehn et al., 1983; Cherkaoui et al., 2003). The calculated 2D distributions of solid rock and porewater δ18O (Figs. 2a, d, 3a and d; note that Fig. 3 is a plot of Fig. 2 on logarithmic scales) are consistent with observations, especially at 30 km (1 Myr) from the ridge axis (black solid curve in Fig. 4; see Sect. 3.2 for paler curves). Where flow rate and temperature are highest near the ridge axis and close to the ocean–crust interface (at m depths), porewater δ18O is in the range between 0 ‰ and 2 ‰ (Fig. 3d), which is comparable to the observed δ18O ranges for high-temperature hydrothermal fluids, e.g., 0.49 ‰–2.3 ‰, by Jean-Baptiste et al. (1997), and 0.3 ‰–1.4 ‰, by James et al. (2014). Away from the ridge axis, porewater δ18O is equivalent to the seawater value at the ocean–crust interface, but drops down to −4 ‰ to −14 ‰ within ∼200 m depths, which is again not inconsistent with observed porewater δ18O values (down to −8 ‰) at <500 m depths where water exchange is limited (e.g., Lawrence and Gieskes, 1981). Solid rock δ18O at 1 Myr (i.e., 30 km from the ridge axis) is characterized by high (<16 ‰) and low (>3 ‰) values at shallow ( km) and deeper ( km) depths, respectively, which is consistent with observations of modern oceanic crust (e.g., Alt et al., 1986) and ophiolites (e.g., Gregory and Taylor, 1981, crosses in Fig. 4; see Fig. S3 in the Supplement). The 18O fluxes to the ocean from high- and low-temperature alteration are 3.0×10⁹ and mol yr−1, respectively, well balanced, resulting in a net 18O flux of 0.2×10⁹ mol yr−1, which is consistent with the suggestion of zero net flux by Gregory and Taylor (1981). Individual 18O flux values are also comparable to those suggested in the previous studies. As examples, 18O fluxes through high-temperature alteration have been suggested to be 4.5×10⁹ (Holland, 1984), 3.2×10⁹ (Muehlenbachs, 1998) and 2.8×10⁹ mol yr−1 (Wallmann, 2001), while those through low-temperature alteration are (Lawrence and Gieskes, 1981), (Holland, 1984), (Muehlenbachs, 1998) and mol yr−1 (Wallmann, 2001). The consistency between the model calculation and observations described above supports the validity of the model.
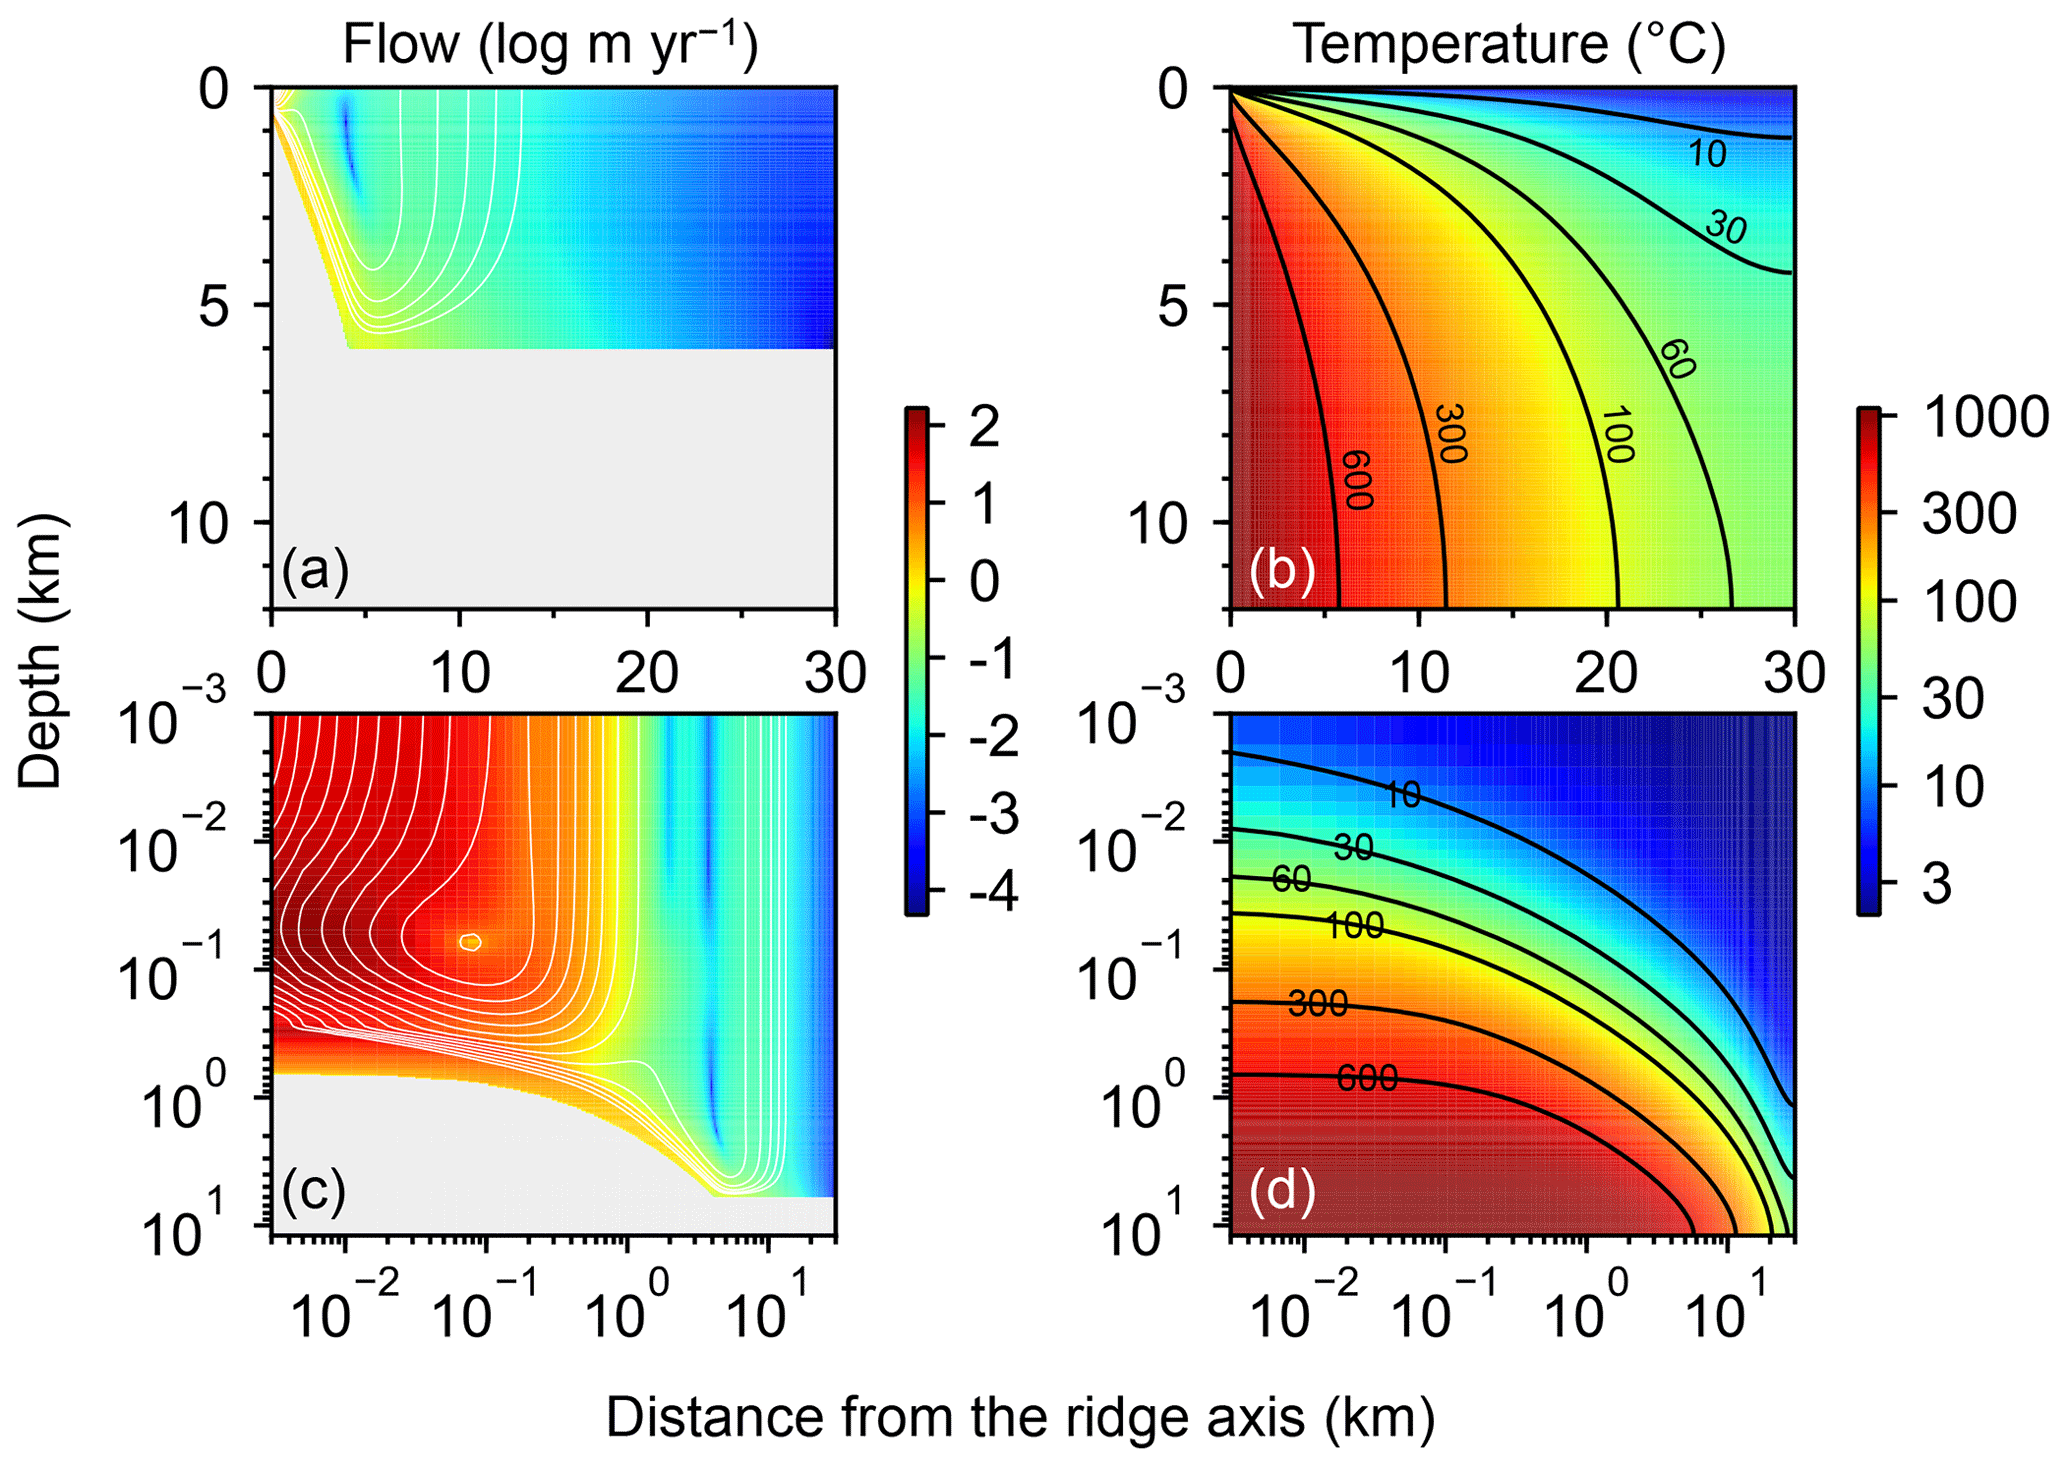
Figure 1Two-dimensional distributions of hydrothermal fluid flow (a and c) and temperature (b and d). Shown in (a) and (c) are logarithms of fluid velocity (m yr−1) together with mass-based stream lines that are depicted with white curves. The same data in (a) and (b) are plotted on logarithmic scales in (c) and (d), respectively. Gray zones in (a) and (c) represent where rocks are impermeable below 6 km depth and/or with temperatures above the rock-cracking threshold (600 ∘C).
3.2 Evaluation of oceanic δ18O buffering capacity
As both the source and sink of oceanic 18O, hydrothermal systems can buffer oceanic δ18O but the strength of the buffering depends on the sensitivity of isotope exchange between oceanic crust and porewater to seawater δ18O (cf. Wallmann, 2001). As an extreme example, if the oxygen isotope fractionation between solid rock and porewater is independent of seawater δ18O, there should not be any feedbacks from the hydrothermal systems on changes in seawater δ18O, i.e., no oceanic δ18O buffering. The previous studies that support the strong oceanic δ18O buffering at midocean ridges assume linear relationships between oxygen isotope fractionation and seawater δ18O (e.g., Gregory and Taylor, 1981; Holland, 1984; Muehlenbachs, 1998). This assumption regarding the sensitivity to seawater δ18O is difficult to confirm through observations of geological records because seawater δ18O is not known. We can examine the response of rocks to seawater δ18O with the present model by adopting different values for seawater δ18O. We can then measure the buffering capacity of the system by plotting net 18O flux against seawater δ18O and calculating the slope value, i.e., , as in, e.g., Muehlenbachs and Clayton (1976). For example, a hydrothermal system with a large negative slope value should exhibit a strong buffering of oceanic δ18O because a slight change in seawater δ18O makes the system introduce a large net 18O flux to the ocean that restores the change in seawater δ18O (e.g., Muehlenbachs and Clayton, 1976; Muehlenbachs, 1998).
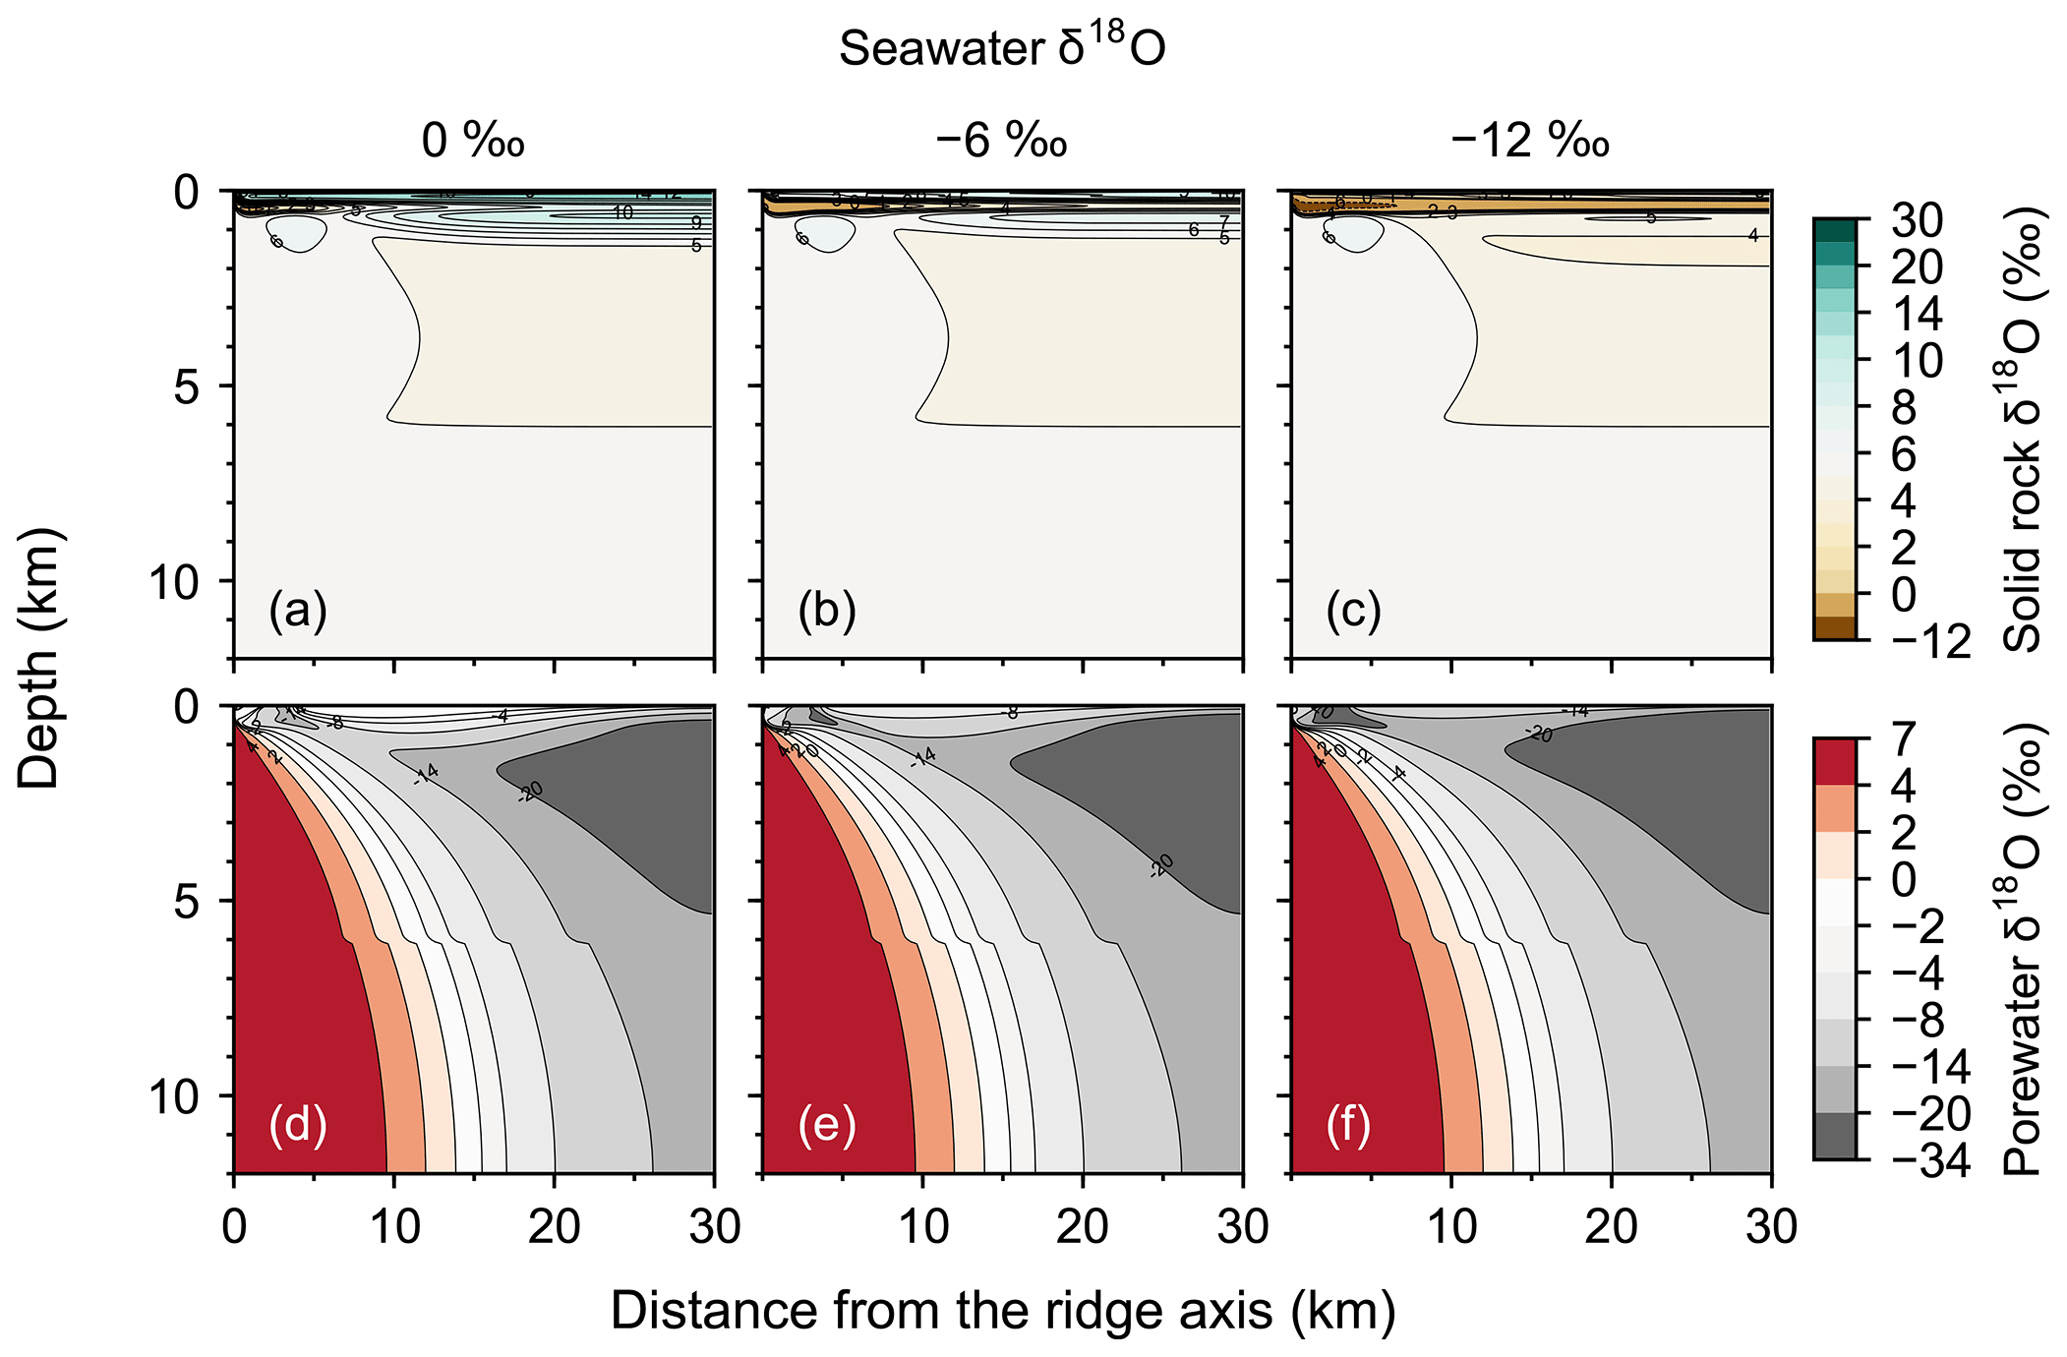
Figure 2Two-dimensional distributions of solid rock and porewater δ18O (a–c and d–f, respectively) at seawater δ18O values of 0 ‰, −6 ‰ and −12 ‰ (a and d, b and e, and c and f, respectively).
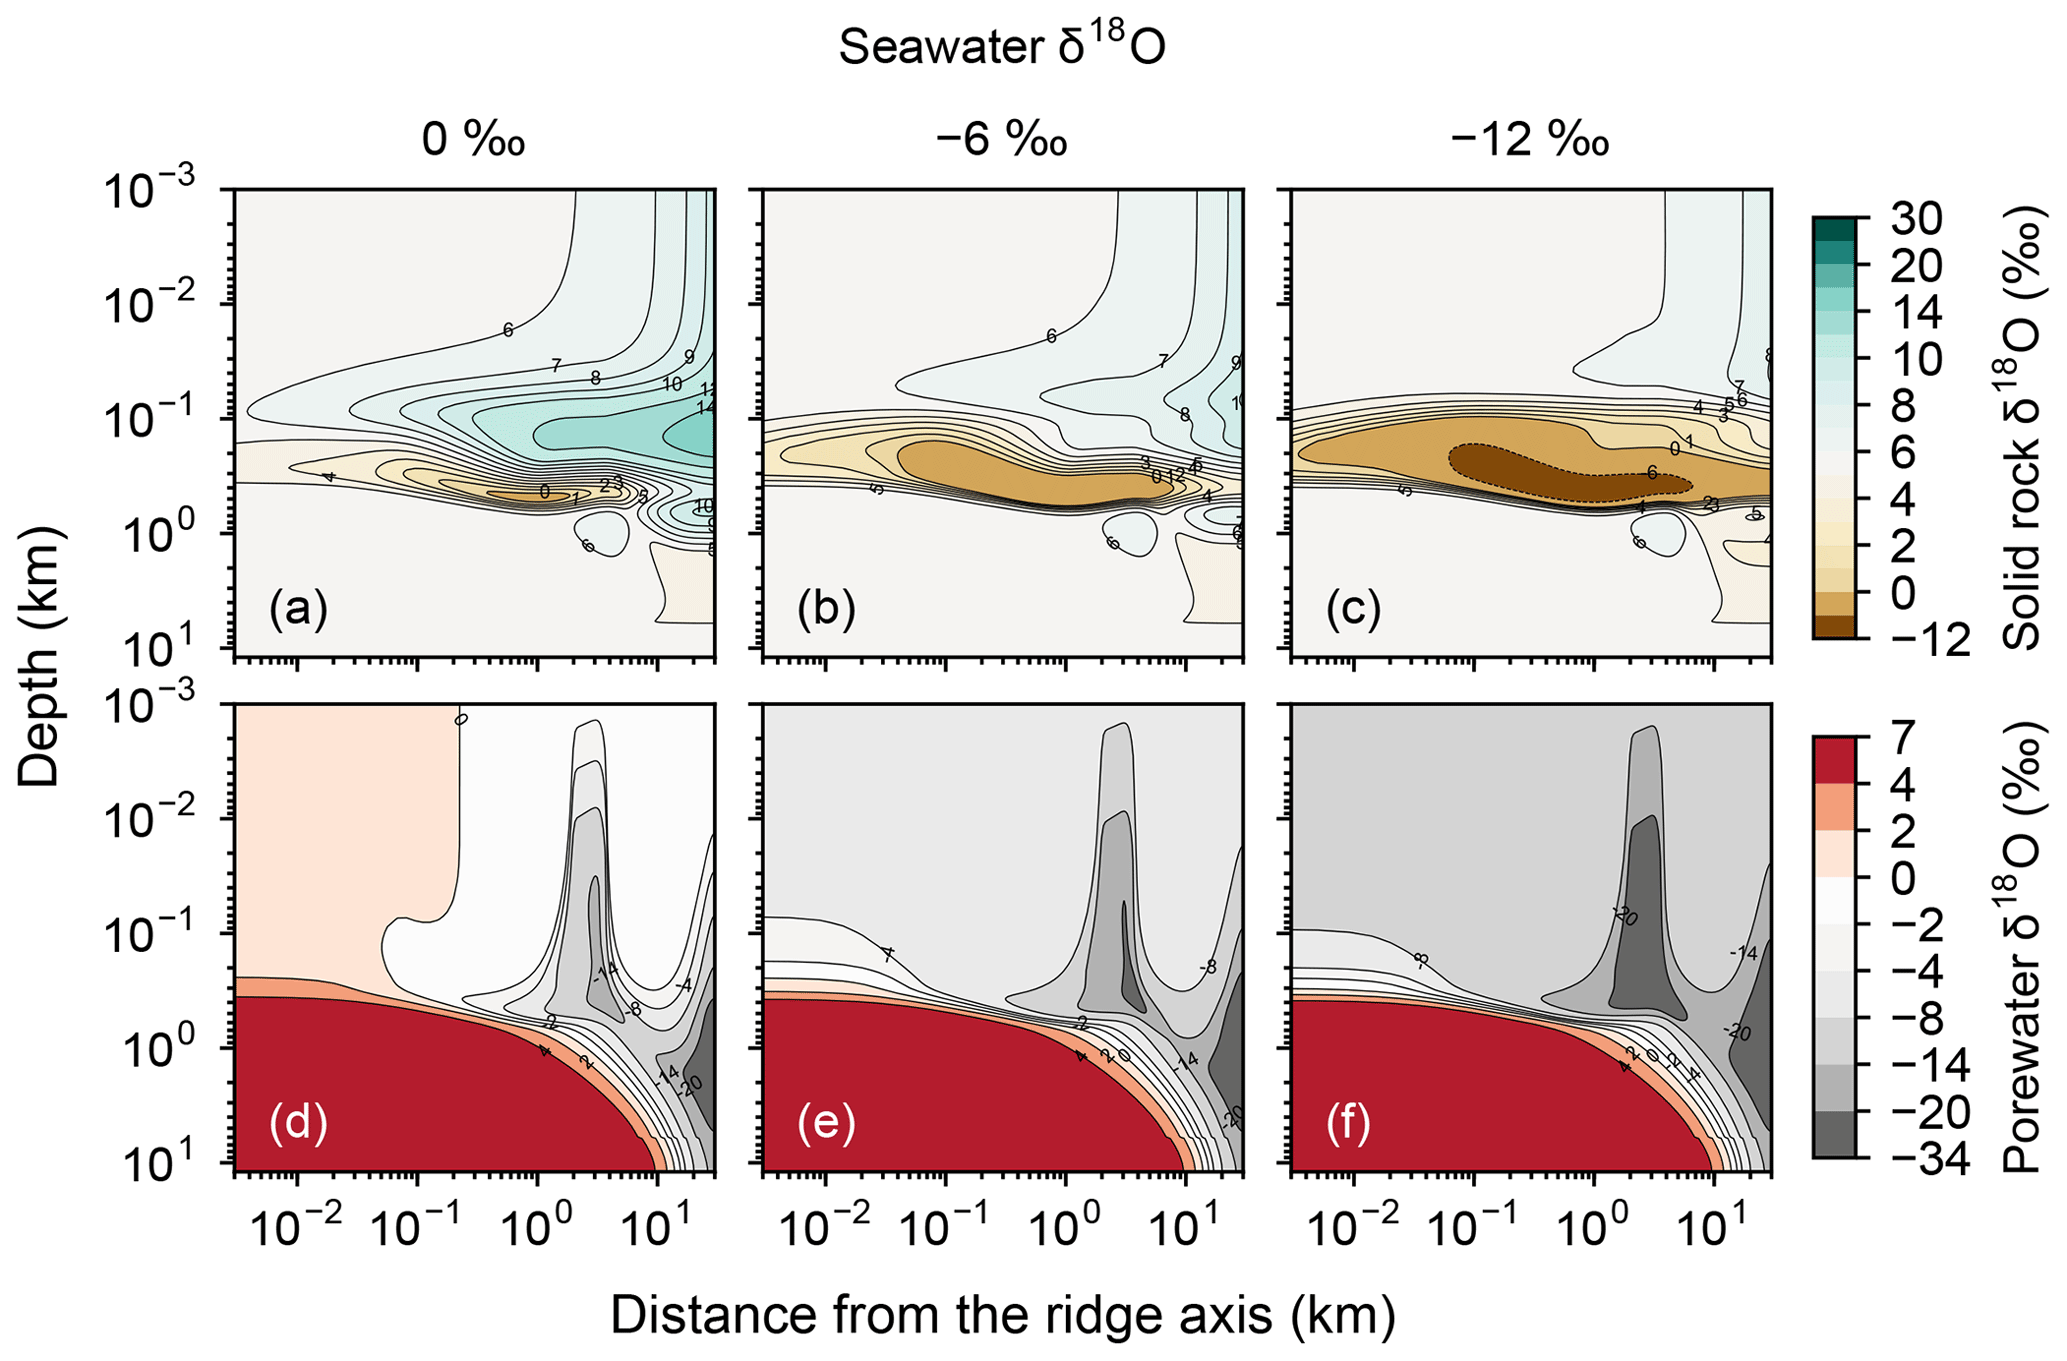
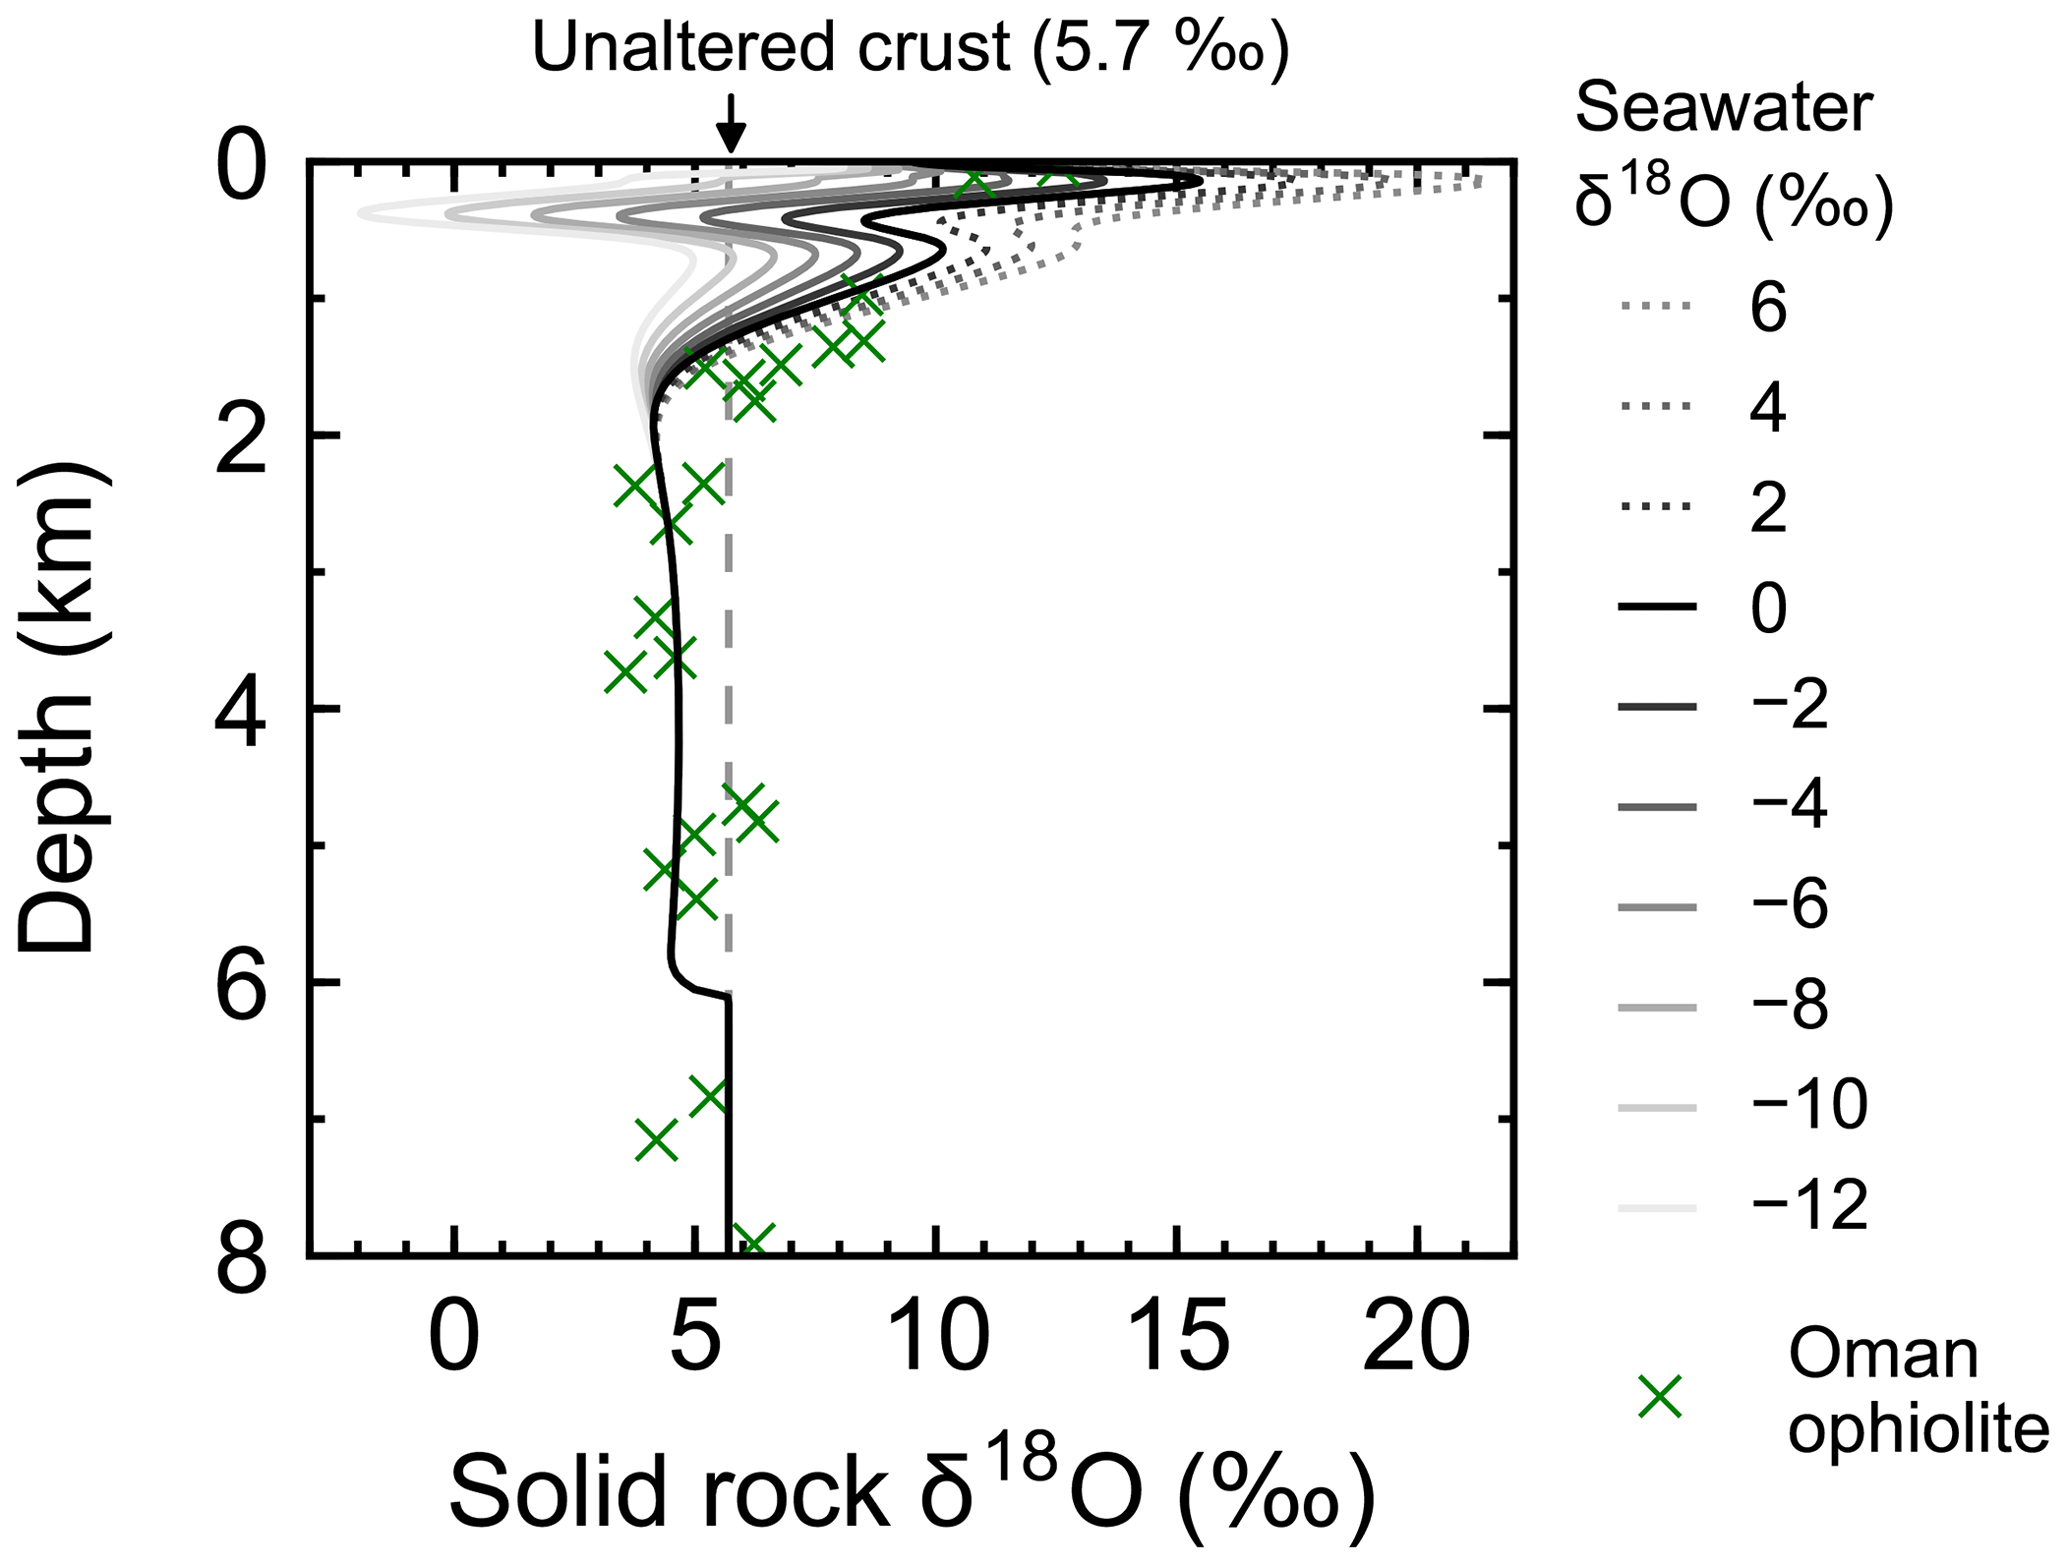
Figure 4Solid rock δ18O as a function of depth at 1 Myr (30 km) from the ridge axis at seawater δ18O values of 6 ‰, 4 ‰, …, −12 ‰. Also plotted are Oman ophiolite data from Gregory and Taylor (1981, crosses) converting their reported depth y′ (km) to (km) to facilitate comparison.
Most features of 2D distributions of solid rock and porewater δ18O are not significantly affected by changing seawater δ18O from 6 ‰ to −12 ‰ (Figs. 2–4). Although the porewaters close to the ocean have δ18O compositions close to those of seawater (e.g., Fig. 3), δ18O signatures of solid rocks are not linearly proportional to seawater δ18O (e.g., Fig. 4). The relative insensitivity at shallow depths ( km; Figs. 2–4) can be explained by the kinetics of oxygen isotope exchange. The distance from the isotope exchange equilibrium can be measured by (Eqs. 5 and 6; Fig. 5b and d; note that Fig. 5c and d are plots of Fig. 5a and b, respectively, on logarithmic scales), and the shallow regions show nonequilibrium states (Ω≠1) because of their relatively low temperatures (Fig. 1b and d). Therefore, despite the approximate isotopic equivalence between porewater and seawater (Figs. 2 and 3), solid rocks do not directly reflect seawater δ18O in their oxygen isotopic compositions. In deeper sections of oceanic crust, on the other hand, solid rocks attain isotope exchange equilibrium with porewater because of the relatively high temperatures and the correspondingly fast rates of isotope exchange (e.g., Fig. 5b and d). These deep regions, however, receive less water exchange than the shallow regions, as can be seen from the distribution of local water∕rock oxygen mole ratio η (; Fig. 5a and c). Accordingly, deep oceanic rocks and porewaters are oxygen isotopically buffered by spreading solid rocks rather than by seawater, and δ18O values of deep porewaters are almost independent of seawater δ18O (Figs. 2d–f and 3d–f). Consequently, despite the isotope exchange equilibrium, deep oceanic rocks are almost completely insensitive to seawater δ18O. The combination of the above two factors (isotope exchange kinetics and 18O supply from spreading solid rocks) explains the insensitivity of midocean ridge systems to seawater δ18O (Figs. 2–4). Note that the kinetics of oxygen isotope exchange and 18O supply from rocks have been invoked to explain the positive and negative δ18O anomalies, respectively, relative to the pristine crustal δ18O value by Cathles (1983), which is not inconsistent with the two factors causing the partial decoupling between oceanic crust and seawater δ18O in the present model.
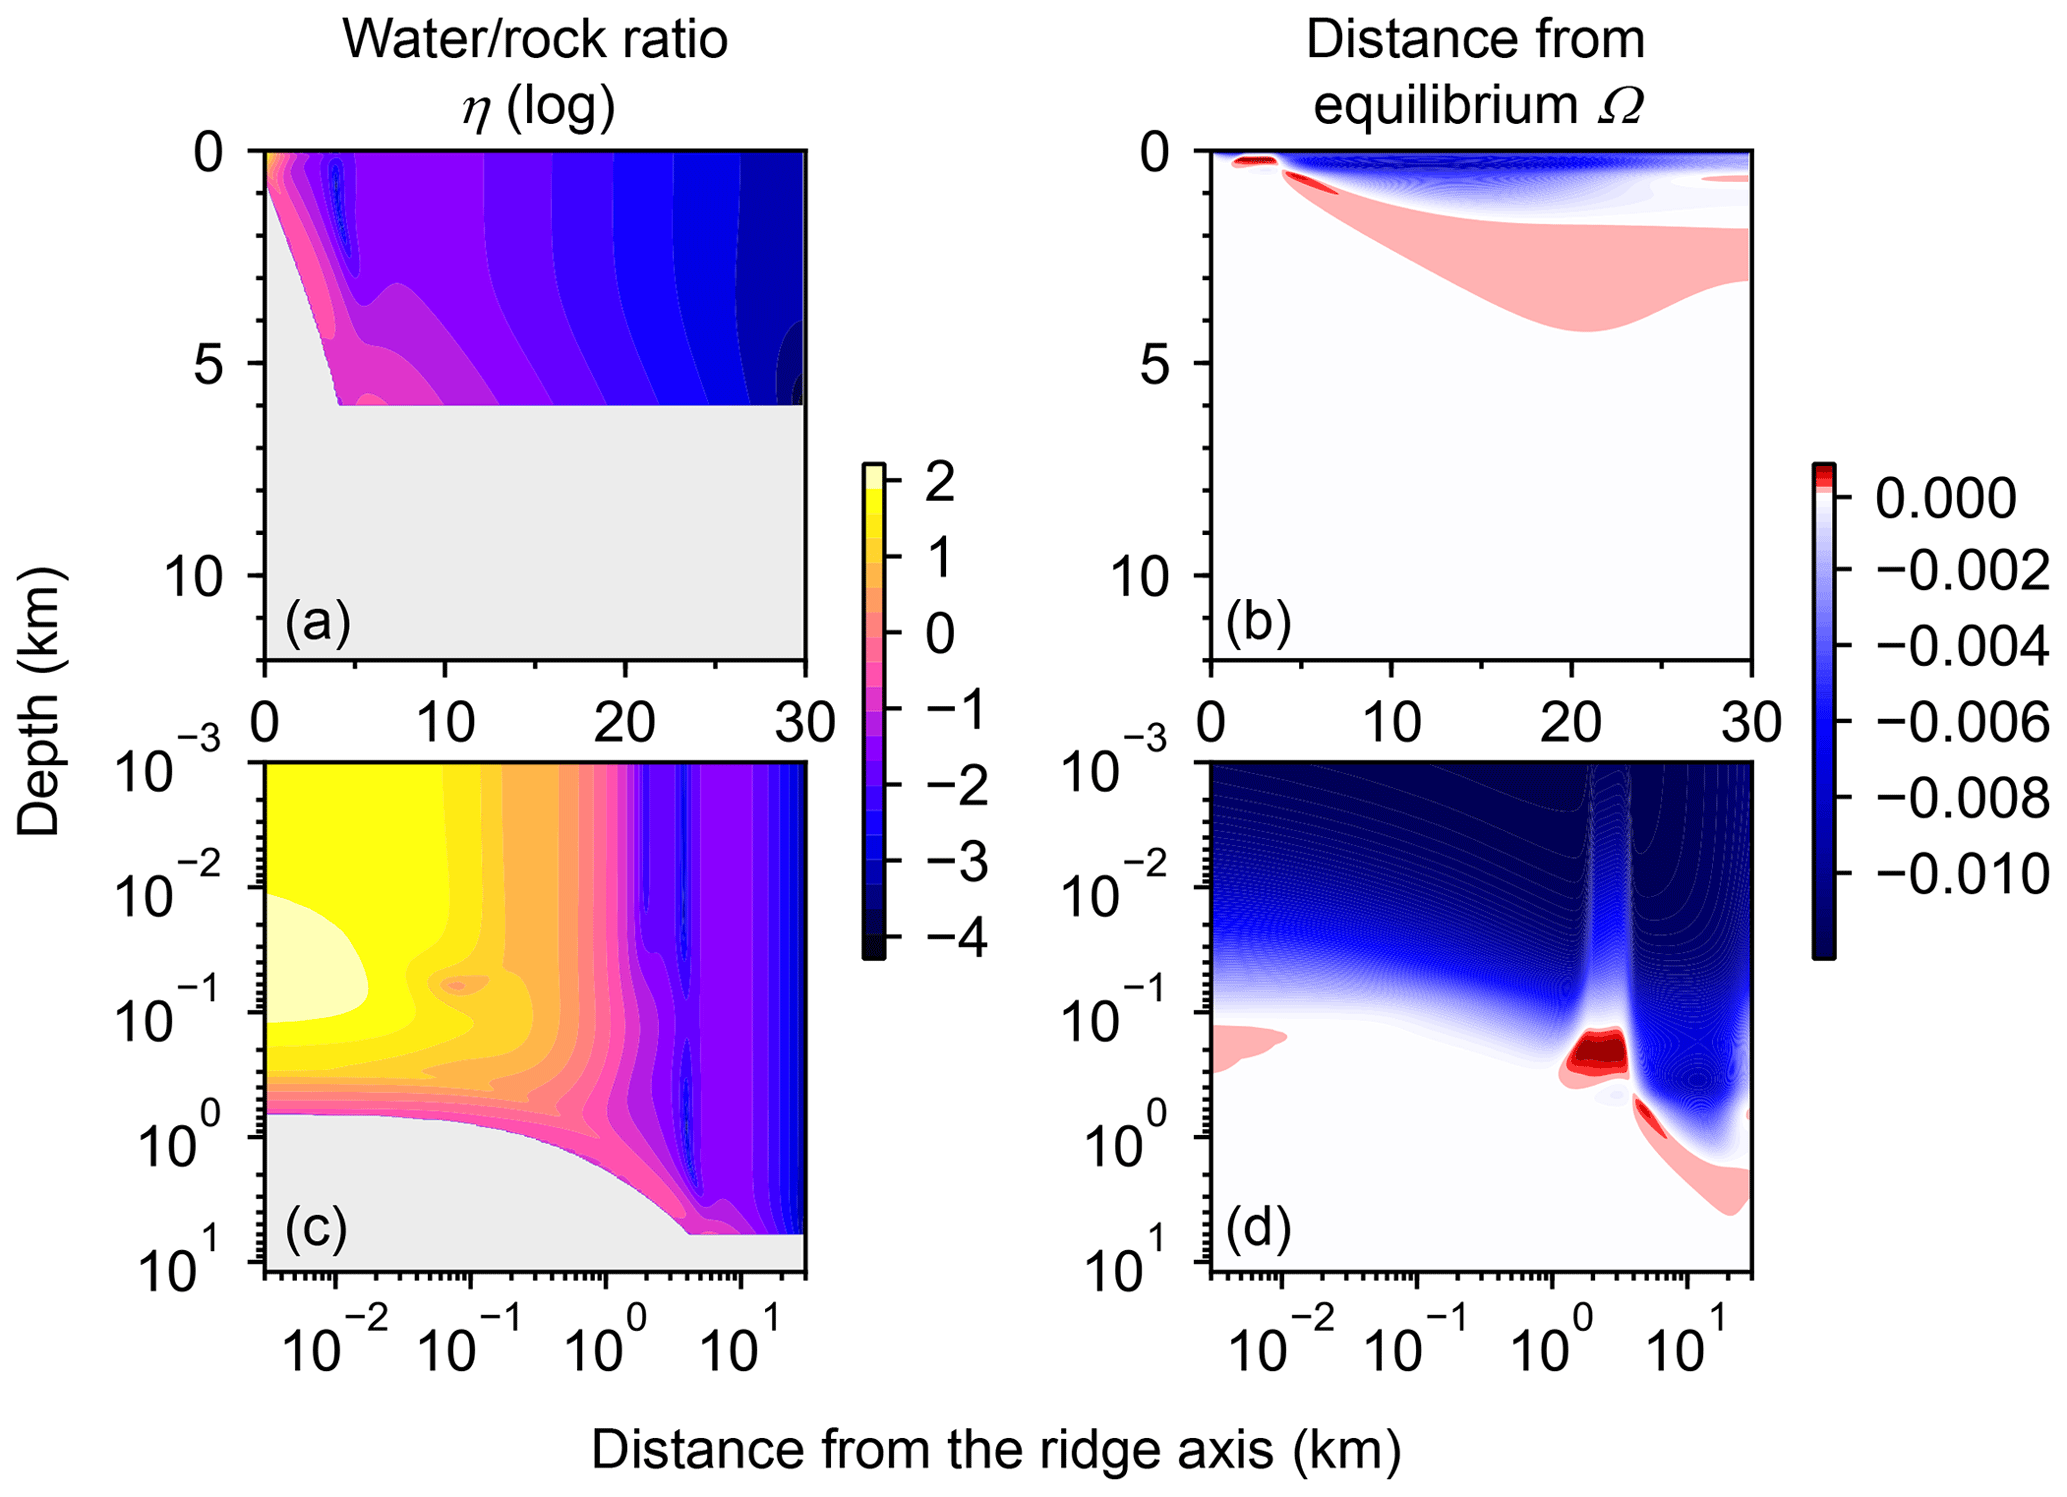
Figure 5Two-dimensional distributions of local water∕rock oxygen mole ratio (a and c) and degree of oxygen isotope exchange at a seawater δ18O value of 0 ‰ (b and d). The same data in (a) and (b) are plotted on logarithmic scales in (c) and (d), respectively. See the caption of Fig. 1 for the explanation of gray zones in (a) and (c).
Consistent with the insensitivity of oceanic rocks to seawater δ18O (Figs. 2–4), the net 18O flux from the midocean ridge systems is a very weak function of seawater δ18O (Fig. 6). Compared to the large buffering capacity suggested in the previous studies, which can be recognized from large negative slopes in Fig. 6, the intensity of oceanic δ18O buffering exhibited by the present model is weak; the magnitude of slope ( ) is smaller than previously assumed by a factor of up to >7. The reason why the previous studies suggested strong buffering is because these studies assume isotope exchange equilibrium between porewaters and oceanic rocks and equivalence between porewater and seawater at the same time. These assumptions are not satisfied simultaneously in midocean ridge systems in general, as can be anticipated from Figs. 2–5. The exception to the previous studies is Wallmann (2001), which shows a relatively small negative slope value (Fig. 6). Note, however, that Wallmann (2001) simulated weak buffering in a different way, i.e., by adopting low and temperature-independent rate constants for oxygen isotope exchange.
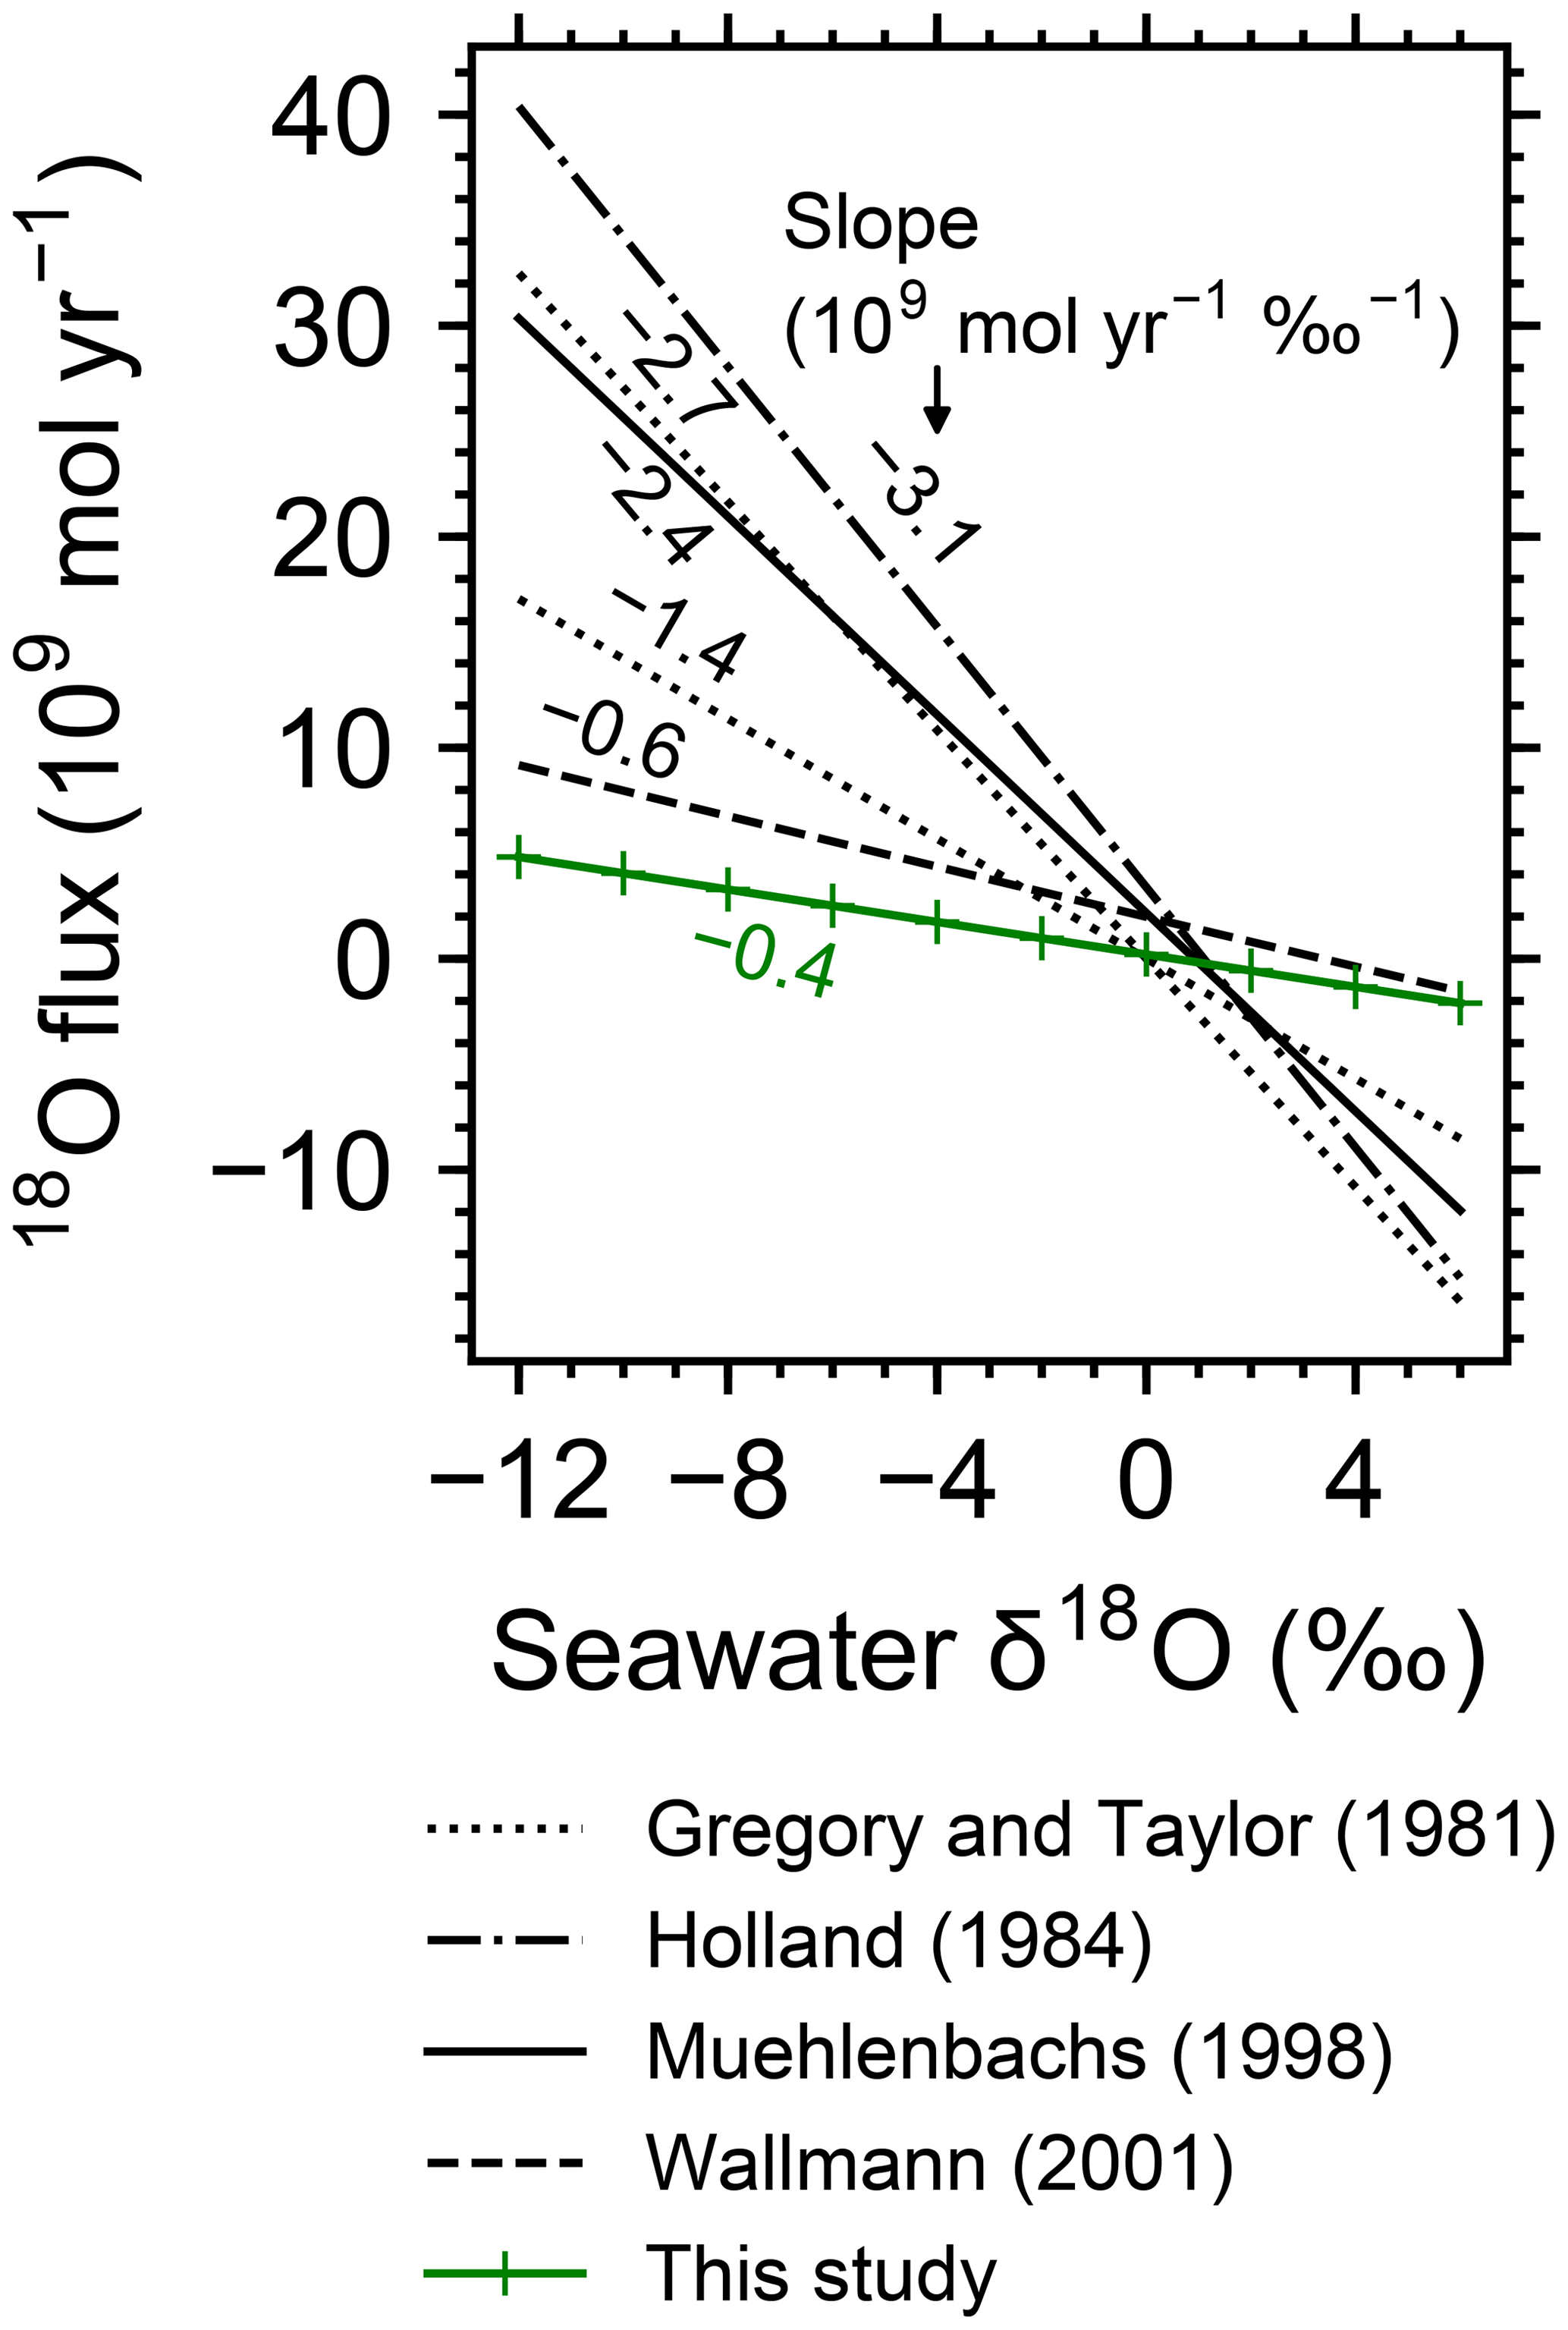
Figure 6Net 18O flux to the ocean from hydrothermal systems as a function of seawater δ18O. Slope values are denoted near the lines from previous studies and the standard simulation in this study.
3.3 Application to the Precambrian
As the tectonics of the Earth likely evolved through time, the midocean ridge systems in the Precambrian could have been quite different from those in the present day. Indeed, differences in ocean volume and the spreading rate of oceanic crust have been discussed (e.g., Kasting et al., 2006; Korenaga et al., 2017). Here, we examine the oceanic δ18O buffering during the Precambrian by utilizing possible ranges of the spreading rate ( to m yr−1) and ocean volume (1–5 km of water depth at the ocean–crust interface) as well as seawater δ18O (−12 ‰ to 6 ‰) suggested in the literature (e.g., Phipps Morgan, 1998; Kasting et al., 2006; Jaffrés et al., 2007; Korenaga et al., 2017; Galili et al., 2019; Johnson and Wing, 2020).
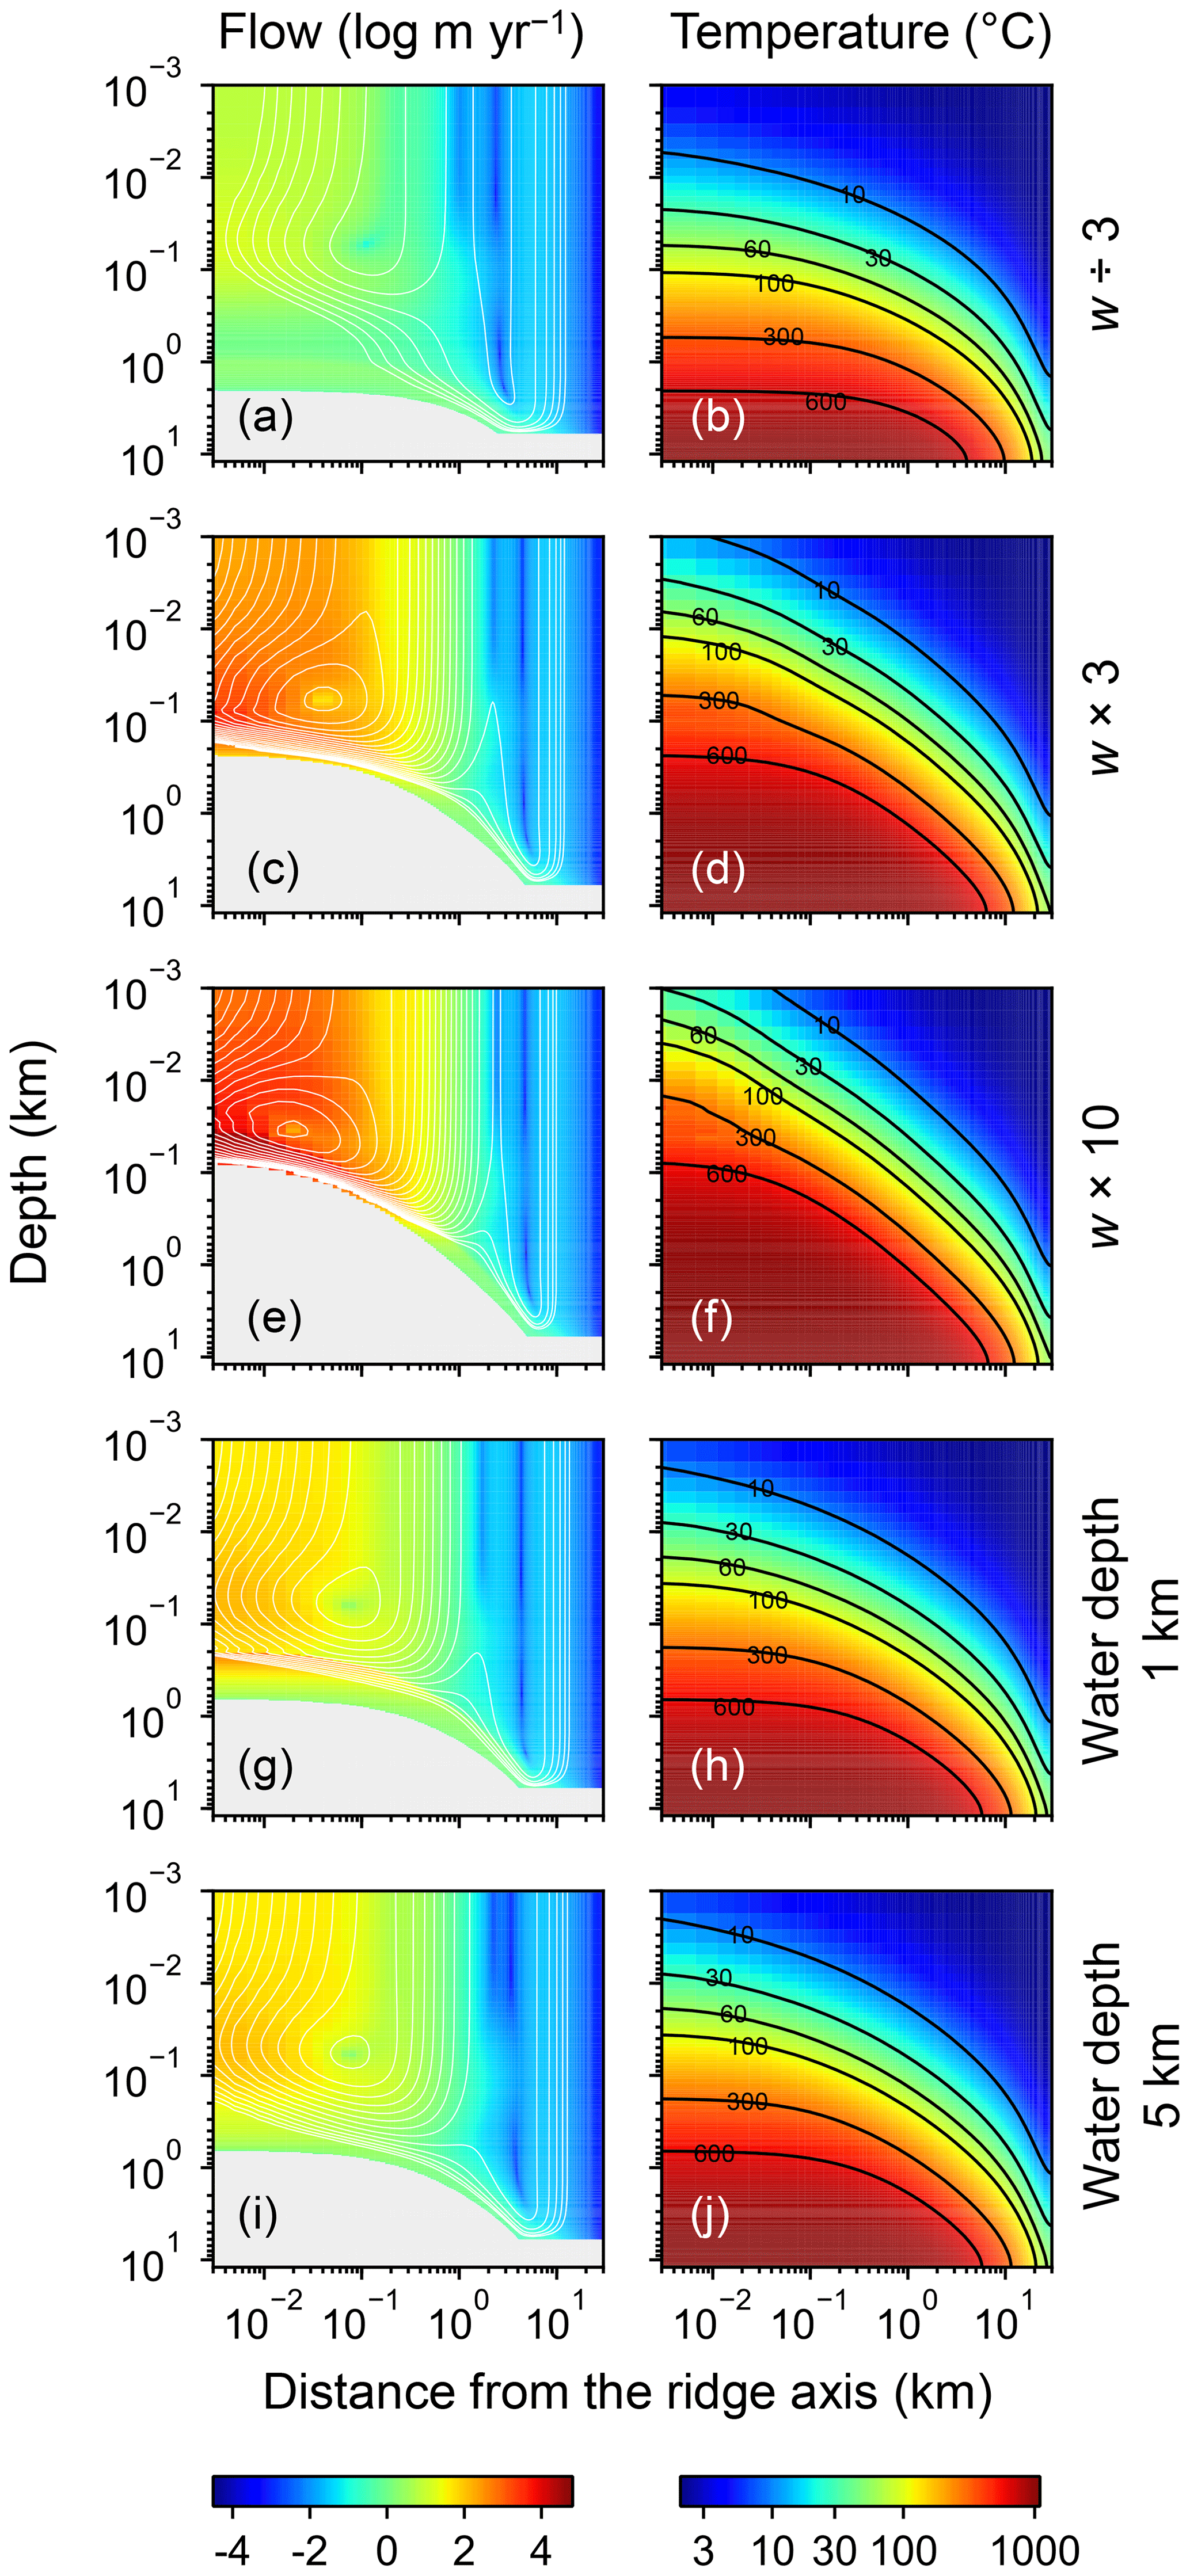
Figure 7Two-dimensional distributions of hydrothermal fluid flow (a, c, e, g, and i) and temperature (b, d, f, h, and j) from simulations with different spreading rates and ocean depths. Logarithms of fluid velocity and mass-based stream lines are depicted in (a, c, e, g, and i). The panels in the first three rows assume different spreading rates ( m yr−1 in a and b, m yr−1 in c and d, and m yr−1 in e and f), while those in the last two rows assume different ocean depths (1 km in g and h; 5 km in i and j). Values of other parameters are the same as those in the standard simulation (e.g., Fig. 1). See the caption of Fig. 1 for the explanation of gray zones in (a, c, e, g, and i).
Increasing the spreading rate results in increases in the heat flux and associated water exchange between the crust and ocean, which is consistent with modern observations (e.g., Baker et al., 1996; Bach and Humphris, 1999): 0.50×10¹², 0.99×10¹² and 1.25×10¹² W of heat flux and 2.4×10¹², 4.9×10¹³ and 8.5×10¹³ kg yr−1 of water exchange at spreading rates of , and m yr−1, respectively (Fig. 7a–f). On the other hand, differences in temperature and water-flow distributions caused by those in ocean depth (1–5 km) are relatively minor (0.74×10¹² W and (1.2–1.3)×1013 kg yr−1; Fig. 7g–j). The distributions of solid rock and porewater δ18O predicted under these different alteration conditions are correspondingly modified but show features common to those shown in the previous sections with the standard parameterization. Porewater δ18O is close to seawater δ18O only along the ocean–crust interface and becomes quite different from seawater δ18O at deep depths (see the Supplement). Solid rock δ18O is relatively insensitive to seawater δ18O in general, showing the relative addition and removal of 18O at shallow and deeper depths, respectively (Fig. 8). The buffering capacity exhibited by models that reflect changes in the spreading rate and ocean depth is different from that in the standard case (Fig. 9) but still weaker than any of those assumed in the previous studies (cf. Fig. 6). Note that in the previous studies, the buffering capacity is assumed to increase linearly with the spreading rate (Gregory and Taylor, 1981; Holland, 1984; Muehlenbachs, 1998; Wallmann, 2001), and thus the slope values in Fig. 9 need be compared with those in the literature (Fig. 6) multiplied by a factor that accounts for changes in the spreading rate. As an example, the slope value of with a spreading rate m yr−1 in Fig. 9 should be compared with (Wallmann, 2001), (Gregory and Taylor, 1981), (Muehlenbachs, 1998), and (Holland, 1984) (cf. Fig. 6). Thus, the buffering with the present model, assuming m yr−1 of spreading rate, is much weaker than assumed in the previous studies. More details of changes in the system behavior are described below.
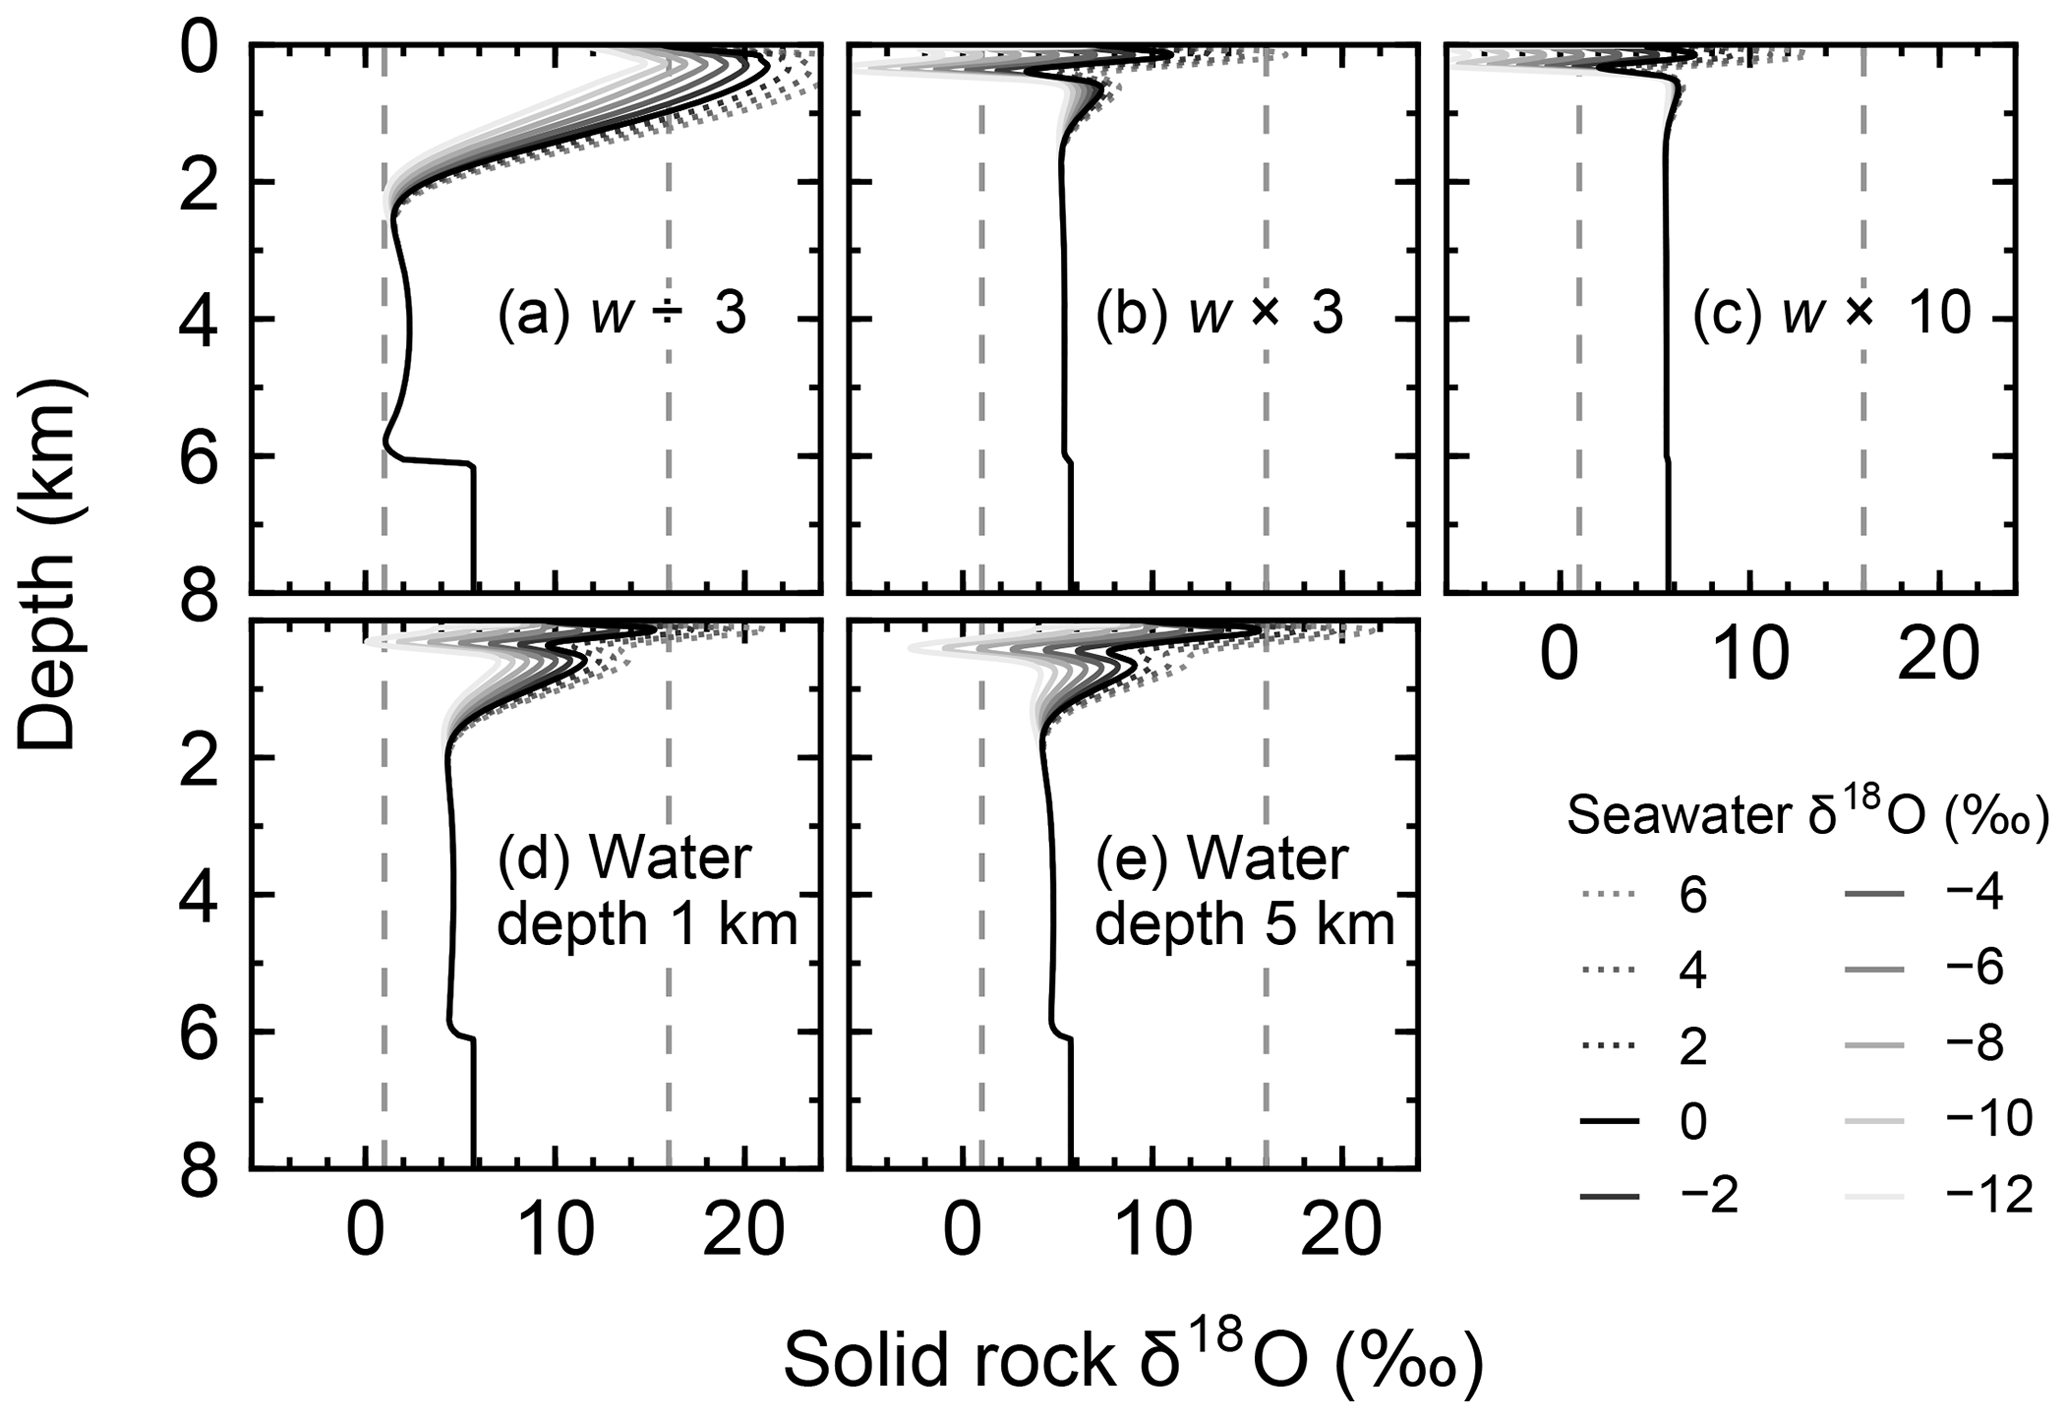
Figure 8Solid rock δ18O as a function of depth at 30 km from the ridge axis at seawater δ18O values of 6, 4, …, −12 ‰ from simulations with different spreading rates and ocean depths. Broken lines denote 1 ‰ and 16 ‰ between which observed δ18O of ophiolites and/or oceanic crust ranges (Gregory and Taylor, 1981; Barrett and Friedrichsen, 1982; Cocker et al., 1982; Elthon et al., 1984; Alt et al., 1986, 1995; Agrinier et al., 1988; Schiffman and Smith, 1988; Vibetti et al., 1989; Lécuyer and Fourcade, 1991; Stakes, 1991; Bickle and Teagle, 1992; Holmden and Muehlenbachs, 1993; Muehlenbachs et al., 2003; Alt and Bach, 2006; Furnes et al., 2007; Gao et al., 2012). Standard parameter values are assumed, except for the parameterization denoted at each panel.
When spreading is slower, seawater penetrates deeper into the crust because of a weaker boundary heat flux (Eq. 4), and thus hydrothermal flows are more homogenized but less intense when compared to those in the standard case (Fig. 7a). Although the changes of crustal δ18O from the pristine δ18O value (5.7 ‰) become larger over the whole crust (Fig. 8a), the sensitivity of solid rock to seawater δ18O remains small (Fig. 8a). The small sensitivity is caused because oxygen isotope exchange at shallow depths of oceanic crust is still kinetically limited despite the elongated time duration for oxygen isotope exchange (3 Myr; cf. Figs. S13 and S16 in the Supplement) and because the deeper section is buffered by spreading rocks rather than circulating seawater, given the simultaneous decreases in the amount of water exchange and the spreading rate. The lower O supply from the mantle combined with the small sensitivity makes the buffering intensity weaker than that with the standard spreading rate (Fig. 9). With the spreading rate high, on the other hand, the hydrothermal penetration depth becomes shallower as a result of enhanced boundary heat flux (Eq. 4) and hydrothermal flows are more intense and more localized close to the ocean and the ridge axis (Fig. 7c and e). Accordingly, 18O depletion from solid rocks near the ridge axis at relatively high temperatures and water∕rock ratios is not recovered even after continued reactions at low temperatures. Nonetheless, the sensitivity of solid rock to seawater δ18O does not significantly differ from that in the other spreading rate cases (Fig. 8b–c) because the kinetics of oxygen isotope exchange and 18O buffering by spreading oceanic rocks remain effective to decouple the shallow and deeper oceanic crust from seawater δ18O, respectively. Note that the time duration for oxygen isotope exchange is reduced with the higher spreading rate (≥0.1 Myr) but can still be long enough to complete major changes in the oxygen isotopic composition of oceanic crust (cf. Fig. S15 in the Supplement). Despite the weak rock sensitivity to seawater δ18O, the larger O supply from the mantle makes the buffering capacity larger than that with the standard spreading rate (Fig. 9). Overall, the system as a whole exhibits nonlinear and reduced sensitivity to changes in the spreading rate as recognized from the relationship between the spreading rate and buffering capacity in Fig. 9 (cf. Gregory and Taylor, 1981; Holland, 1984; Muehlenbachs, 1998; Wallmann, 2001).
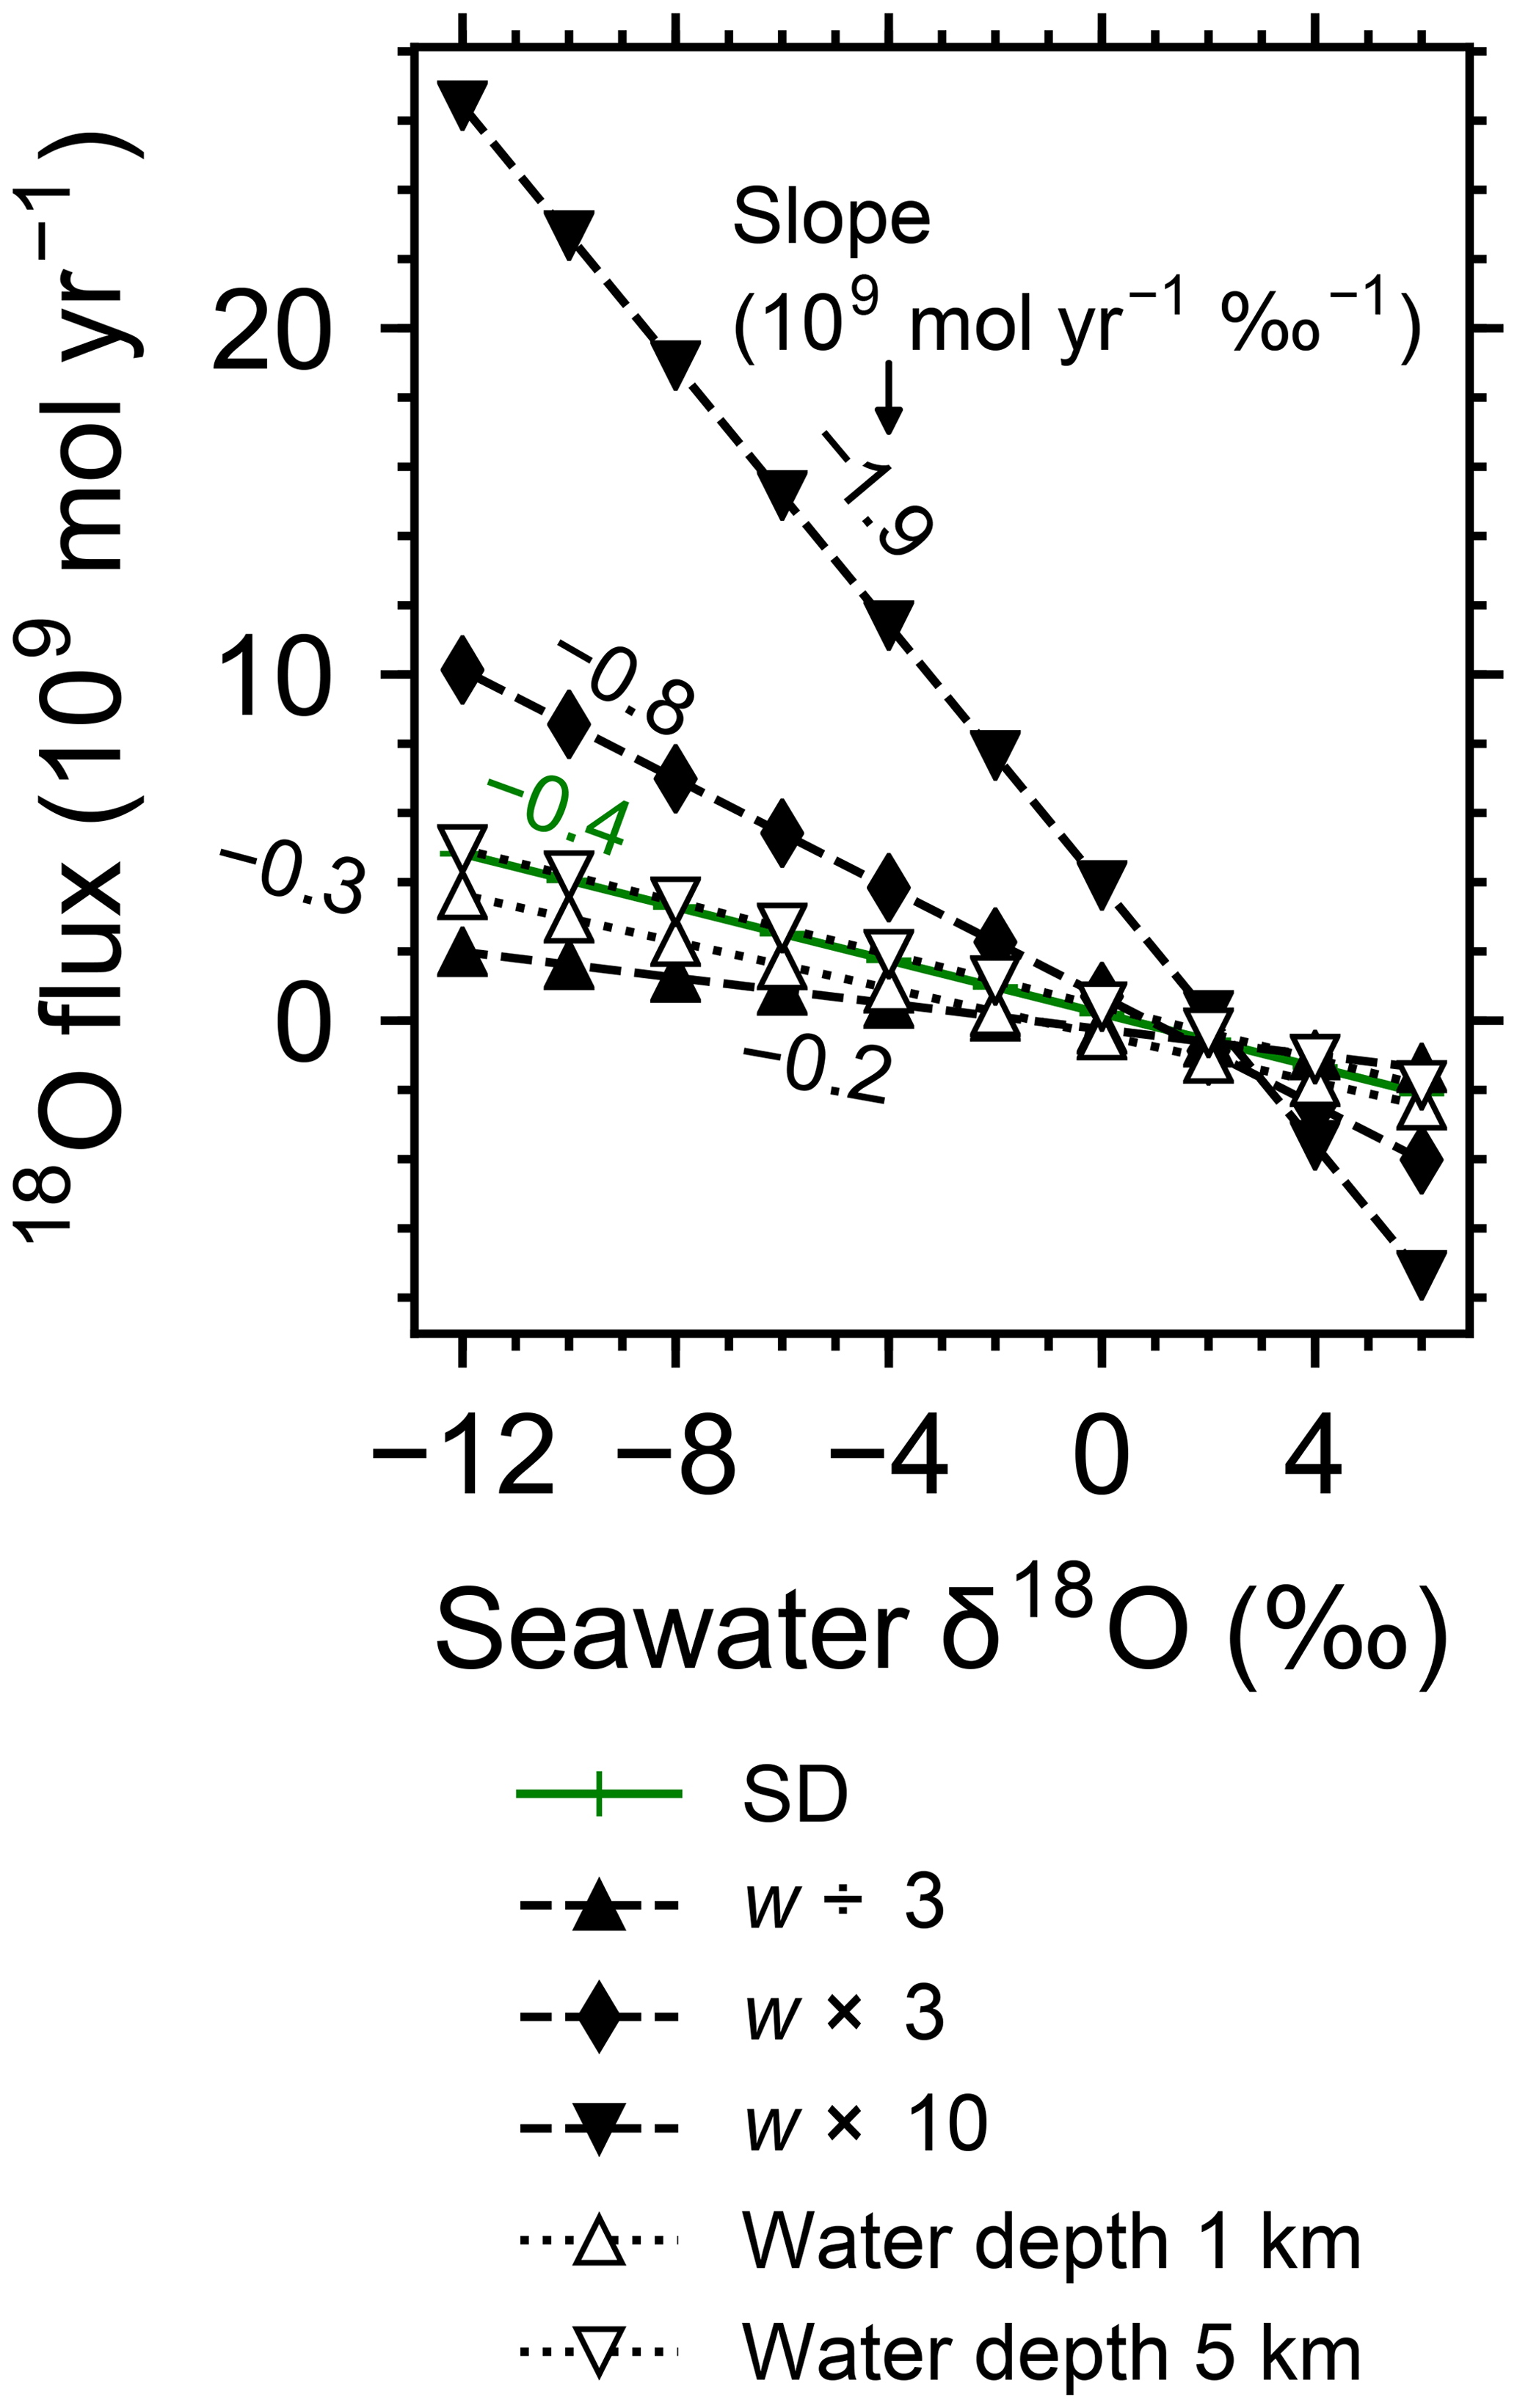
Figure 9Net 18O flux to the ocean from hydrothermal systems as a function of seawater δ18O from simulations with different spreading rates and ocean depths. See the legend for the types of symbol and line for individual simulations. Slope values are denoted near the lines.
When assuming a shallow ocean with the ocean–crust interface at a 1 km water depth, hydrothermal circulation becomes slightly stronger and occurs slightly closer to the ocean (Fig. 7g) (cf. Kasting et al., 2006). In contrast, in a deep ocean with the ocean–crust interface at a 5 km depth from the sea surface, the mixing of water becomes slightly weaker and occurs slightly deeper (Fig. 7i). In both cases, the above changes in the flow geometry and intensity are relatively minor. The resultant oxygen isotope behaviors are thus similar to the standard case (Figs. 4 and 8d–e) and the oceanic δ18O buffering becomes only slightly weaker in the shallow- and deep-ocean cases than in the standard case (Fig. 9). Notably, oxygen isotope exchange through low-temperature hydrothermal alteration is relatively enhanced in the shallow ocean case (Fig. 9), which is not inconsistent with the prediction by Kasting et al. (2006). However, the magnitude of the ocean depth effect is much smaller than anticipated by Kasting et al. (2006), probably because of the settings in the hydrothermal circulation model (Sect. 2.1) in which 2D distributions of permeability and boundary heat flux associated with the spreading rate (Eq. 4) may exert a more significant control over the hydrothermal penetration depth (see Fig. 7 and the Supplement).
4.1 Interpretation of ophiolites
Simulations conducted in the present study suggest that oceanic rocks are not significantly affected by changes in seawater δ18O under any plausible alteration conditions (Figs. 4 and 8). Reported δ18O values of ophiolites and/or oceanic crust range from ∼1 to 16 ‰ (broken lines in Fig. 8). By comparison, the simulated solid rock δ18O values fall within this range for seawater δ18O values , to 0, and ‰ at a spreading rate of , , and m yr−1, respectively (Figs. 4 and 8). Accordingly, we conclude that the constant seawater δ18O at 0 ‰ is neither a necessary nor a sufficient condition for explaining the relatively invariant δ18O records of ophiolites. As ophiolite δ18O profiles can be affected more by alteration conditions (e.g., the spreading rate and permeability; Sect. 3.3 and the Supplement) with the control by seawater δ18O remaining relatively weak, feedbacks between the alteration parameters (e.g., spreading rate and permeability) could be more important in reproducing ophiolite records. Therefore, ophiolites may be interpreted to indicate the insensitivity of oceanic rocks to seawater δ18O, realized by the feedbacks between alteration parameters, and not necessarily a constant seawater δ18O. The weak buffering (Figs. 6 and 9) accompanying the partial decoupling between the oceanic crust and seawater δ18O (e.g., Fig. 8) shows that this interpretation is more plausible than the constant seawater δ18O.
4.2 Controls of δ18O in the Precambrian oceans
Although the buffering of oxygen isotopes through hydrothermal alteration of oceanic rocks is weaker than previously assumed under any alteration conditions (Sect. 3.3), it could have been relatively strong when the spreading rate was m yr−1 (Figs. 6 and 9). Such high spreading rate conditions could have been possible only during the earliest period of Earth's history (>3.5 Ga; Phipps Morgan, 1998) or even impossible according to Korenaga (2006). Excluding this earliest period, the buffering must have been weak despite the uncertainties in alteration conditions (Figs. 6 and 9). The weak buffering must have allowed variations of seawater δ18O through other surficial processes that exchange 18O with seawater, most likely through continental weathering (e.g., Walker and Lohmann, 1989). As surface environments likely have significantly changed through the eons (see the Introduction), 18O fluxes from continental weathering could have correspondingly varied and might have contributed to the oceanic 18O budget more significantly than from hydrothermal alteration of oceanic crust during certain periods in Earth's history.
Previous studies examining oceanic δ18O evolution on geological timescales have utilized box-modeling approaches to account for oxygen isotope exchange from both continental weathering and hydrothermal alteration of oceanic crust (Godderis and Veizer, 2000; Goddéris et al., 2001; Wallmann, 2001; Kasting et al., 2006; Jaffrés et al., 2007). Among them, the studies that assume strong buffering at midocean ridges have had difficulty in modifying oceanic 18O budget through other surficial processes, including continental weathering (Godderis and Veizer, 2000; Goddéris et al., 2001). Other studies that assume weak buffering instead have shown the possibility of significant oceanic δ18O changes through modification of simplified continental weathering parameters with the Earth's age (Wallmann, 2001; Kasting et al., 2006; Jaffrés et al., 2007). Revisiting these previous box model studies with the weak buffering suggested here (e.g., Figs. 6 and 9), and constructing a process-based model for continental weathering to be coupled with the present model, will lead to a better understanding of controls on oceanic δ18O during the Precambrian.
4.3 Comparison with other models
The results in the present study differ significantly from those by Lécuyer and Allemand (1999), who utilized prescribed distributions of temperature and water∕rock ratio along with an isotope fractionation equation for a half-closed system (a system that is open to the water reservoir but not to the rock reservoir; Gregory et al., 1989; see the Introduction). The assumed range for water ∕ rock ratio (≤10) by these authors is comparable to the simulated range in the present study (η≤164; Fig. 5a and c). States of equilibrium and nonequilibrium in the bulk-rock-based formulation of isotopes in the present study correspond to transport- and reaction-limited alteration states, respectively, in the mineral-based isotope formulation in Lécuyer and Allemand (1999); the difference in the formulation of isotopic composition of bulk rock should not cause any significant differences in the oxygen isotope behavior of bulk rock (cf. Bindeman et al., 2019). The temperature dependence of the kinetic constant for oxygen isotope exchange is described with the Arrhenius equation, based on the data sets by Cole and Ohmoto (1986) in Lécuyer and Allemand (1999) and by Cole et al. (1983, 1987) in the present study, and thus there should be little difference in the temperature dependence of isotope exchange kinetics between the two studies. The size difference in the calculation domain cannot explain the difference between the present study and Lécuyer and Allemand (1999), as additional numerical experiments on a wider calculation domain (300 km) with artificially imposing off-axis water exchange (up to 5.3×10¹⁵ kg yr−1) yield essentially the same results as those with the standard calculation domain width (30 km; see the Supplement). Although a thorough comparison cannot be made between the two studies because Lécuyer and Allemand (1999) have not provided detailed model results, it is likely that the isotopic effect of spreading crust has not been explicitly considered by Lécuyer and Allemand (1999). Should this be the case, the sensitivity of oceanic rocks to seawater δ18O and the buffering capacity at midocean ridges could be overestimated by the model of Lécuyer and Allemand (1999). More generally, the models that do not explicitly account for the transport of solid rocks (e.g., Taylor, 1977; Norton and Taylor, 1979; Criss et al., 1987; Gregory et al., 1989; DePaolo, 2006) could overestimate the coupling strength between oceanic crust and seawater δ18O and the oceanic 18O buffering capacity of hydrothermal systems. Application of these models to ophiolites may also underestimate the uncertainty in reconstructed ancient seawater δ18O that is caused by the partial decoupling between oceanic crust and seawater δ18O (see Sect. 4.1 and the Supplement).
The 2D reactive transport model of oxygen isotopes combined with 2D hydrothermal circulation simulations enables us to predict distributions of temperature, water flow and oxygen isotopes of solid rocks and porewaters within oceanic crust based on mass, momentum and energy conservations. The model assuming the present-day seawater δ18O reproduced those distributions consistent with modern observations, supporting the model's validity. The intensity of seawater δ18O buffering at midocean ridges was evaluated by calculating the net 18O flux as a function of seawater δ18O. The buffering intensity predicted by the model is significantly weaker than previously assumed under any plausible alteration conditions during the Precambrian. The weak buffering is realized because isotope exchange equilibrium is not reached in shallow sections of oceanic crust with low temperatures, and because 18O supply via spreading solid rocks exceeds that through hydrothermal circulation in deeper high-temperature sections. Consistent with the weak buffering, oceanic rocks are insensitive to seawater with respect to oxygen isotopes. Thus, ophiolites can alternatively be explained by the insensitivity of oceanic rocks to seawater δ18O that could have evolved through the Precambrian because of the weak buffering at midocean ridges.
The source codes of the model are available at GitHub (https://github.com/kanzakiy/HT-Oiso, last access: 29 June 2020) under the GNU General Public License v3.0. The specific version of the model used in this paper is tagged as “v0.1” and has been assigned a doi: https://doi.org/10.5281/zenodo.3922317 (Kanzaki, 2020). A readme file on the web provides the instructions for executing the simulations.
The supplement related to this article is available online at: https://doi.org/10.5194/se-11-1475-2020-supplement.
The author declares that there is no conflict of interest.
I thank Jim Kasting and Lee Kump for the helpful discussions and Laurence Coogan and an anonymous reviewer for their useful comments on earlier version of the paper. I am grateful to Benjamin Johnson and Itay Halevy for their useful comments and also to Patrice Rey for the editorial handling of the paper.
This paper was edited by Patrice Rey and reviewed by Itay Halevy and Benjamin Johnson.
Aachib, M., Mbonimpa, M., and Aubertin, M.: Measurement and prediction of the oxygen diffusion coefficient in unsaturated media, with applications to soil covers, Water Air Soil Pollut., 156, 163–193, https://doi.org/10.1023/B:WATE.0000036803.84061.e5, 2004. a
Agrinier, P., Javoy, M., and Girardeau, J.: Hydrothermal activity in a peculiar oceanic ridge: oxygen and hydrogen isotope evidence in the Xigaze ophiolite (Tibet, China), Chem. Geol., 71, 313–335, https://doi.org/10.1016/0009-2541(88)90057-5, 1988. a
Alt, J. C. and Bach, W.: Oxygen isotope composition of a section of lower oceanic crust, ODP Hole 735B, Geochem. Geophys. Geosyst., 7, Q12008, https://doi.org/10.1029/2006GC001385, 2006. a
Alt, J. C., Muehlenbachs, K., and Honnorez, J.: An oxygen isotope profile through the upper kilometer of the oceanic crust, DSDP Hole 504B, Earth Planet. Sci. Lett., 80, 217–229, https://doi.org/10.1016/0012-821X(86)90106-8, 1986. a, b
Alt, J. C., Zuleger, E., and Erzinger, J.: Mineralogy and stable isotopic compositions of the hydrothermally altered lower sheeted dike complex, Hole 504B, Leg 140, Proc. ODP Sci. Res., 137/140, 155–166, https://doi.org/10.2973/odp.proc.sr.137140.013.1995, 1995. a
Bach, W. and Humphris, S. E.: Relationship between the Sr and O isotope compositions of hydrothermal fluids and the spreading and magma-supply rates at oceanic spreading centers, Geology, 27, 1067–1070, https://doi.org/10.1130/0091-7613(1999)027<1067:RBTSAO>2.3.CO;2, 1999. a
Baker, E. T., Chen, Y. J., and Morgan, J. P.: The relationship between near-axis hydrothermal cooling and the spreading rate of mid-ocean ridges, Earth Planet. Sci. Lett., 142, 137–145, https://doi.org/10.1016/0012-821X(96)00097-0, 1996. a
Barrett, T. J. and Friedrichsen, H.: Strontium and oxygen isotopic composition of some basalts from Hole 504B, Costa Rica Rift, DSDP Legs 69 and 70, Earth Planet. Sci. Lett., 60, 27–38, https://doi.org/10.1016/0012-821X(82)90017-6, 1982. a
Bickle, M. J. and Teagle, D. A. H.: Strontium alteration in the Troodos ophiolite: implications for fluid fluxes and geochemical transport in mid-ocean ridge hydrothermal systems, Earth Planet. Sci. Lett., 113, 219–237, https://doi.org/10.1016/0012-821X(92)90221-G, 1992. a
Bindeman, I. N., Bekker, A., and Zakharov, D. O.: Oxygen isotope perspective on crustal evolution on early Earth: A record of Precambrian shales with emphasis on Paleoproterozoic glaciations and Great Oxygenation Event, Earth Planet. Sci. Lett., 437, 101–113, https://doi.org/10.1016/j.epsl.2015.12.029, 2016. a
Bindeman, I. N., Bayon, G., and Palandri, J.: Triple oxygen isotope investigation of fine-grained sediments from major world's rivers: Insights into weathering processes and global fluxes into the hydrosphere Earth Planet. Sci. Lett., 528, 115851, https://doi.org/10.1016/j.epsl.2019.115851, 2019. a
Blake, R. E., Chang, S. J., and Lepland, A.: Phosphate oxygen isotopic evidence for a temperate and biologically active Archaean ocean, Nature, 464, 1029–1033, https://doi.org/10.1038/nature08952, 2010. a
Cathles, L. M.: An analysis of the hydrothermal system responsible for massive sulfide deposition in the Hokuroku basin of Japan, in: The Kuroko and Related Volcanogenic Massive Sulfide Deposits, edited by: Ohmoto, H., Skinner, B. J., Society of Economic Geologists, 439–487, https://doi.org/10.5382/Mono.05.27, 1983. a, b, c
Catling, D. C. and Kasting, J. F.: Atmospheric Evolution on Inhabited and Lifeless Worlds, Cambridge University Press, New York, NY, https://doi.org/10.1017/9781139020558, 2017. a
Cherkaoui, A. S. M., Wilcock, W. S. D., Dunn, R. A., and Toomey, D. R.: A numerical model of hydrothermal cooling and crustal accretion at a fast spreading mid-ocean ridge, Geochem. Geophys. Geosyst., 4, 8616, https://doi.org/10.1029/2001GC000215, 2003. a, b, c, d, e, f, g, h
Cocker, J. D., Griffin, B. J., and Muehlenbachs, K.: Oxygen and carbon isotope evidence for seawater-hydrothermal alteration of the Macquarie Island ophiolite, Earth Planet. Sci. Lett., 61, 112–122, https://doi.org/10.1016/0012-821X(82)90043-7, 1982. a
Cole, D. R. and Ohmoto, H.: Kinetics of isotopic exchange at elevated temperatures and pressures, Rev. Mineral., 16, 41–90, 1986. a
Cole, D. R., Ohmoto, H., and Lasaga, A. C.: Isotopic exchange in mineral-fluid systems. I. Theoretical evaluation of oxygen isotopic exchange accompanying surface reactions and diffusion, Geochim. Cosmochim. Acta, 47, 1681–1693, https://doi.org/10.1016/0016-7037(83)90018-2, 1983. a, b
Cole, D. R., Mottl, M. J., and Ohmoto, H.: Isotopic exchange in mineral-fluid systems. II. Oxygen and hydrogen isotopic investigation of the experimental basalt-seawater system, Geochim. Cosmochim. Acta, 51, 1523–1538, https://doi.org/10.1016/0016-7037(87)90334-6, 1987. a, b, c, d, e
Criss, R. E., Gregory, R. T., and Taylor, Jr., H. P.: Kinetic theory of oxygen isotopic exchange between minerals and water, Geochim. Cosmochim. Acta, 51, 1099–1108, https://doi.org/10.1016/0016-7037(87)90203-1, 1987. a
DePaolo, D. J.: Isotopic effects in fracture-dominated reactive fluid-rock systems, Geochim. Cosmochim. Acta, 70, 1077–1096, https://doi.org/10.1016/j.gca.2005.11.022, 2006. a
Elderfield, H. and Schultz, A.: Mid-ocean ridge hydrothermal fluxes and the chemical composition of the ocean, Annu. Rev. Earth Planet. Sci., 24, 191–224, https://doi.org/10.1146/annurev.earth.24.1.191, 1996. a, b
Elthon, D., Lawrence, J. R., Hanson, R. E., and Stern, C.: Modelling of oxygen-isotope data from the Sarmiento ophiolite complex, Chile, Geol. Soc. Spec. Publ., 13, 185–197, https://doi.org/10.1144/GSL.SP.1984.013.01.16, 1984. a
Gelhar, L. W., Welty, C., and Rehfeldt, K. R.: A critical review of data on field-scale dispersion in aquifers, Water Resour. Res., 28, 1955–1974, https://doi.org/10.1029/92WR00607, 1992. a
Fehn, U., Green, K. E., Von Herzen, R. P., and Cathles, L. M.: Numerical models for the hydrothermal field at the Galapagos spreading center, J. Geophys. Res., 88, 1033–1048, https://doi.org/10.1029/JB088iB02p01033, 1983. a
Fisher, A. T.: Permeability within basaltic oceanic crust, Rev. Geophys., 32, 143–182, https://doi.org/10.1029/97RG02916, 1998. a
Frind, E. O.: Simulation of long-term transient density-dependent transport in groundwater, Adv. Water Resour., 5, 73–88, https://doi.org/10.1016/0309-1708(82)90049-5, 1982. a
Fry, B.: Stable Isotope Ecology, Springer Science & Business Media, https://doi.org/10.1007/0-387-33745-8, 2006. a
Furnes, H., de Wit, M., Staudigel, H., Rosing, M., and Muehlenbachs, K.: A vestige of Earth's oldest ophiolite, Science, 315, 1704–1707, https://doi.org/10.1126/science.1139170, 2007. a
Galili, N., Shemesh, A., Yam, R., Brailovsky, I., Sela-Adler, M., Schuster, E. M., Collom, C., Bekker, A., Planavsky, N., Macdonald, F. A., Préat, A., Rudmin, M., Trela, W., Sturesson, U., Heikoop, J. M., Aurell, M., Ramajo, J., and Halevy, I.: The geologic history of seawater oxygen isotopes from marine iron oxides, Science, 365, 469–473, https://doi.org/10.1126/science.aaw9247, 2019. a, b
Gao, Y., Vils, F., Cooper, K. M., Banerjee, N., Harris, M., Hoefs, J., Teagle, D. A. H., Casey, J. F., Elliott, T., Laverne, C., Alt, J. C., and Muehlenbachs, K.: Downhole variation of lithium and oxygen isotopic compositions of oceanic crust at East Pacific Rise, ODP Site 1256, Geochem. Geophy. Geosy., 13, Q10001, https://doi.org/10.1029/2012GC004207, 2012. a
Godderis, Y. and Veizer, J.: Tectonic control of chemical and isotopic composition of ancient oceans: the impact of continental growth, Am. J. Sci., 300, 434–461, https://doi.org/10.2475/ajs.300.5.434, 2000. a, b, c
Goddéris, Y., François, L. M., and Veizer, J.: The early Paleozoic carbon cycle, Earth Planet. Sci. Lett., 190, 181–196, https://doi.org/10.1016/S0012-821X(01)00377-6, 2001. a, b
Gregory, R. T. and Taylor, Jr., H. P.: An oxygen isotope profile in a section of Cretaceous oceanic crust, Samail ophiolite, Oman: evidence for δ18O buffering of the oceans by deep (>5 km) seawater-hydrothermal circulation at mid-ocean-ridges, J. Geophys. Res., 86, 2737–2755, https://doi.org/10.1029/JB086iB04p02737, 1981. a, b, c, d, e, f, g, h, i
Gregory, R. T., Criss, R. E., and Taylor, Jr., H. P.: Oxygen isotope exchange kinetics of mineral pairs in closed and open systems: applications to problems of hydrothermal alteration of igneous rocks and Precambrian iron formations, Chem. Geol., 75, 1–42, https://doi.org/10.1016/0009-2541(89)90019-3, 1989. a, b
Haar, L., Gallagher, J., and Kell, G.: NBS/NRC Steam Tables: Thermodynamic and Transport Properties and Computer Programs for Vapor and Liquid States of Water in SI Units, Hemisphere Publishing Corporation, Washington, 1984. a
Harris, K. R. and Woolf, L. A.: Pressure and temperature dependence of the self diffusion coefficient of water and oxygen-18 water, J. Chem. Soc., Faraday Trans. 1, 76, 377–385, https://doi.org/10.1039/F19807600377, 1980. a
Holland, H. D.: The Chemical Evolution of the Atmosphere and Oceans, Princeton University Press, Princeton, NJ, 1984. a, b, c, d, e, f, g, h
Holmden, C. and Muehlenbachs, K.: The 18O/16O ratio of 2-billion-year-old seawater inferred from ancient oceanic crust, Science, 259, 1733–1736, https://doi.org/10.1126/science.259.5102.1733, 1993. a, b, c
Iyer, K., Rüpke, L. H., and Morgan, J. P.: Feedbacks between mantle hydration and hydrothermal convection at ocean spreading centers, Earth Planet. Sci. Lett., 296, 34–44, https://doi.org/10.1016/j.epsl.2010.04.037, 2010. a, b, c, d, e, f
Jaffrés, J. B. D., Shields, G. A., and Wallmann, K.: The oxygen isotope evolution of seawater: A critical review of a long-standing controversy and an improved geological water cycle model for the past 3.4 billion years, Earth-Sci. Rev., 83, 83–122, https://doi.org/10.1016/j.earscirev.2007.04.002, 2007. a, b, c, d, e, f
James, R. H., Green, D. R. H., Stock, M. J., Alker, B. J., Banerjee, N. R., Cole, C., German, C. R., Huvenne, V. A. I., Powell, A. M., and Connelly, D. P.: Composition of hydrothermal fluids and mineralogy of associated chimney material on the East Scotia Ridge back-arc spreading centre, Geochim. Cosmochim. Acta, 139, 47–71, https://doi.org/10.1016/j.gca.2014.04.024, 2014. a
Jean-Baptiste, P., Charlou, J. L., and Stievenard, M.: Oxygen isotope study of mid-ocean ridge hydrothermal fluids: Implication for the oxygen-18 budget of the oceans, Geochim. Cosmochim. Acta, 61, 2669–2677, https://doi.org/10.1016/S0016-7037(97)00090-2, 1997. a
Johnson, B. W. and Wing, B. A.: Limited Archaean continental emergence reflected in an early Archaean 18O-enriched ocean, Nat. Geosci., 13, 243–248, https://doi.org/10.1038/s41561-020-0538-9, 2020. a
Kanzaki, Y.: kanzakiy/HT-Oiso: HT+O-iso_v0.1 (Version v0.1), Zenodo, https://doi.org/10.5281/zenodo.3922317, last access: 29 June 2020. a
Karhu, J. and Epstein, S.: The implication of the oxygen isotope records in coexisting cherts and phosphates, Geochim. Cosmochim. Acta, 50, 1745–1756, https://doi.org/10.1016/0016-7037(86)90136-5, 1986. a
Kasting, J. F., Howard, M. T., Wallmann, K., Veizer, J., Shields, G., and Jaffrés, J.: Paleoclimates, ocean depth, and the oxygen isotopic composition of seawater, Earth Planet. Sci. Lett., 252, 82–93, https://doi.org/10.1016/j.epsl.2006.09.029, 2006. a, b, c, d, e, f, g, h
Knauth, L. P.: Temperature and salinity history of the Precambrian ocean: implications for the course of microbial evolution, in: Geobiology: Objectives, Concepts, Perspectives, edited by: Noffke, N., 53–69, https://doi.org/10.1016/B978-0-444-52019-7.50007-3, 2005. a
Knauth, L. P. and Lowe, D. R.: High Archean climatic temperature inferred from oxygen isotope geochemistry of cherts in the 3.5 Ga Swaziland Supergroup, South Africa, Geol. Soc. Am. Bull., 115, 566–580, https://doi.org/10.1130/0016-7606(2003)115<0566:HACTIF>2.0.CO;2, 2003. a
Korenaga, J.: Global water cycle and the coevolution of the Earth's interior and surface environment, in: Archean Geodynamics and Environments, edited by: Benn, K., Mareschal, J.-C., Condie, K. C., 7–32, https://doi.org/10.1029/164GM03, 2006. a
Korenaga, J., Planavsky, N. J., and Evans, D. A. D.: Archean geodynamics and the thermal evolution of Earth, Phil. Trans. R. Soc. A, 375, 20150393, https://doi.org/10.1098/rsta.2015.0393, 2017. a, b
Krynicki, K., Green, C. D., and Sawyer, D. W.: Pressure and temperature dependence of self-diffusion in water, Faraday Discuss. Chem. Soc., 66, 199–208, https://doi.org/10.1039/DC9786600199, 1978. a
Lawrence, J. R. and Gieskes, J. M.: Constraints on water transport and alteration in the oceanic crust from the isotopic composition of porewater, J. Geophys. Res., 86, 7924–7934, https://doi.org/10.1029/JB086iB09p07924, 1981. a, b
Lécuyer, C. and Allemand, P.: Modelling of the oxygen isotope evolution of seawater: Implication for the climate interpretation of the δ18O of marine sediments, Geochim. Cosmochim. Acta, 63, 351–361, https://doi.org/10.1016/S0016-7037(98)00277-4, 1999. a, b, c, d, e, f, g, h, i, j, k
Lécuyer, C. and Fourcade, S.: Oxygen isotope evidence for multi-stage hydrothermal alteration at a fossil slow-spreading center: the Silurian Trinity ophiolite (California, U.S.A.), Chem. Geol., 87, 231–246, https://doi.org/10.1016/0168-9622(91)90023-P, 1991. a
Meyer, C. A., McClintock, R. B., Silvestri, G. J., and Spencer, R. C.: AME Steam Tables: Thermodynamic and Transport Properties of Steam, 5th Edition, American Society of Mechanical Engineers, 1983. a
Muehlenbachs, K.: The alteration and aging of the basaltic layer of the seafloor: Oxygen isotope evidence from DSDP/IPOD Legs 51, 52, and 53, Int. Repts. DSDP, 51, 1159–1167, 1979. a
Muehlenbachs, K.: The oxygen isotopic composition of the oceans, sediments and the seafloor, Chem. Geol., 145, 263–273, https://doi.org/10.1016/S0009-2541(97)00147-2, 1998. a, b, c, d, e, f, g, h
Muehlenbachs, K. and Clayton, R. N.: Oxygen isotope composition of the oceanic crust and its bearing on seawater, J. Geophys. Res., 81, 4365–4369, https://doi.org/10.1029/JB081i023p04365, 1976. a, b, c
Muehlenbachs, K., Furnes, H., Fonneland, H. C., and Hellevang, B.: Ophiolites as faithful records of the oxygen isotope ratio of ancient seawater: the Solund–Stavfjord Ophiolite Complex as a Late Ordovician example, Geol. Soc. Spec. Publ., 218, 401–414, https://doi.org/10.1144/GSL.SP.2003.218.01.20, 2003. a
Nielsen, M. E. and Fisk, M. R.: Surface area measurements of marine basalts: Implications for the subseafloor microbial biomass, Geophys. Res. Lett., 37, LI5604, https://doi.org/10.1029/2010GL044074, 2010. a
Norton, D. and Knight, J.: Transport phenomena in hydrothermal systems: cooling plutons, Am. J. Sci., 277, 937–981, https://doi.org/10.2475/ajs.277.8.937, 1977. a
Norton, D. and Taylor, Jr., H. P.: Quantitative simulation of the hydrothermal systems of crystallizing magmas on the basis of transport theory and oxygen isotope data: An analysis of the Skaergaard intrusion, J. Petrol., 20, 421–486, https://doi.org/10.1093/petrology/20.3.421, 1979. a, b, c
Perry, Jr., E. C., Ahmad, S. N., and Swulius, T. M.: The oxygen isotope composition of 3,800 m.y. old metamorphosed chert and iron formation from Isukasia, West Greenland, J. Geol., 86, 223–239, https://doi.org/10.1086/649676, 1978. a
Phipps Morgan, J.: Thermal and rare gas evolution of the mantle, Chem. Geol., 145, 431–445, https://doi.org/10.1016/S0009-2541(97)00153-8, 1998. a, b
Schiffman, P. and Smith, B. M.: Petrology and oxygen isotope geochemistry of a fossil seawater hydrothermal system within the Solea graben, northern Troodos ophiolite, Cyprus, J. Geophys. Res., 93, 4612–4624, https://doi.org/10.1029/JB093iB05p04612, 1988. a
Shemesh, A., Kolodny, Y., and Luz, B.: Oxygen isotope variations in phosphate of biogenic apatites, II. Phosphorite rocks, Earth Planet. Sci. Lett., 64, 405–416, https://doi.org/10.1016/0012-821X(83)90101-2, 1983. a
Stakes, D. S.: Oxygen and hydrogen isotope compositions of oceanic plutonic rocks: High-temperature deformation and metamorphism of oceanic layer 3, in: Stable Isotope Geochemistry: A Tribute to Samuel Epstein, edited by: Taylor, H. P., O'Neil, J. R., Kaplan, I. R., The Geochemical Society, 77–90, 1991. a
Steefel, C. I. and Lasaga, A. C.: A coupled model for transport of multiple chemical species and kinetic precipitation/dissolution reactions with application to reactive flow in single phase hydrothermal systems, Am. J. Sci., 294, 529–592, https://doi.org/10.2475/ajs.294.5.529, 1994. a, b, c, d
Stein, C. A. and Stein, S.: Constraints on hydrothermal heat flux through the oceanic lithosphere from global heat flow, J. Geophys. Res., 99, 3081–3095, https://doi.org/10.1029/93JB02222, 1994. a
Taylor, Jr., H. P.: Water∕rock interactions and the origin of H2O in granitic batholiths, J. Geol. Soc. London, 133, 509–558, https://doi.org/10.1144/gsjgs.133.6.0509, 1977. a
Vérard, C. and Veizer, J.: On plate tectonics and ocean temperatures, Geology, 47, 881–885, https://doi.org/10.1130/G46376.1, 2019. a
Vibetti, N. J., Kerrich, R., and Fyfe, W. S.: Oxygen and carbon isotope studies of hydrothermal alteration in the Troodos ophiolite complex, Cyprus, Geol. Surv. Canada Spec. Pap., 88-9, 221–228, 1989. a
Walker, J. C. G. and Lohmann, K. C.: Why the oxygen isotopic composition of sea water changes with time, Geophys. Res. Lett., 16, 323–326, https://doi.org/10.1029/GL016i004p00323, 1989. a, b, c, d
Wallmann, K.: The geological water cycle and the evolution of marine δ18O values, Geochim. Cosmochim. Acta, 65, 2469–2485, https://doi.org/10.1016/S0016-7037(01)00603-2, 2001. a, b, c, d, e, f, g, h, i, j, k, l, m
Wallmann, K., Aloisi, G., Haeckel, M., Tishchenko, P., Pavlova, G., Greinert, J., Kutterolf, S., and Eisenhauer, A.: Silicate weathering in anoxic marine sediments, Geochim. Cosmochim. Acta, 72, 3067–3090, https://doi.org/10.1016/j.gca.2008.03.026, 2008. a
Wolery, T. J. and Sleep, N. H.: Hydrothermal circulation and geochemical flux at mid-ocean ridges, J. Geol., 84, 249–275, https://doi.org/10.1086/628195, 1976. a, b
Zhao, Z.-F. and Zheng, Y.-F.: Calculation of oxygen isotope fractionation in magmatic rocks, Chem. Geol., 193, 59–80, https://doi.org/10.1016/S0009-2541(02)00226-7, 2003. a, b