the Creative Commons Attribution 4.0 License.
the Creative Commons Attribution 4.0 License.
 | 24 Jun 2020
Mapping undercover: integrated geoscientific interpretation and 3D modelling of a Proterozoic basin
Mark D. Lindsay
Sandra Occhipinti
Crystal Laflamme
Alan Aitken
Lara Ramos
Gravity and 3D modelling combined with geochemical analysis examine the subsurface within and below the poorly exposed Palaeoproterozoic Yerrida Basin in central Western Australia. Understanding the structure of a region is important as key features indicating past geodynamic processes and tectonic activity can be revealed. However, in stable, post-depositional tectonic settings only the younger sedimentary units tend to be widely exposed, rendering direct observation of basement and intrusive rocks impossible. Geophysical imaging and modelling can reveal the structure of a region undercover. High-magnitude density anomalies around the basin cannot be reconciled with current geological knowledge in the case presented here. The gravity anomalies infer an abundance of buried and high-density material not indicated by the surface geology. A hypothetical causative source for the high-magnitude gravity anomalies is mafic rocks that were intruded and extruded during basin rifting. The simplest and plausible stratigraphic attribution of these interpreted mafic rocks is to the Killara Formation within the Mooloogool Group. However, geochemistry reveals that the Killara Formation is not the only host to mafic rocks within the region. The mafic rocks present in the Juderina Formation are largely ignored in descriptions of Yerrida Basin magmatism, and results indicate that they may be far more substantial than once thought. Sulfur isotopic data indicate no Archean signature to these mafic rocks, a somewhat surprising result given the basement to the basin is the Archean Yilgarn Craton. We propose the source of mafic rocks is vents located to the north along the Goodin Fault or under the Bryah sub-basin and Padbury Basin. The conclusion is that the formation of the Yerrida Basin involves a geodynamic history more complex than previously thought. This result highlights the value in geophysics and geochemistry in revealing the complexity of the earlier geodynamic evolution of the basin that may be indiscernible from surface geology but may have high importance for the tectonic development of the region and its mineral resources.
- Article
(16827 KB) - Full-text XML
- BibTeX
- EndNote


The Yerrida Basin is a region comprised of Palaeoproterozoic rocks located in the Capricorn region, central Western Australia. A series of sedimentation events and unconformities combined with a history of mafic magmatism and the presence of Archean greenstone belts and an inlier have produced complex geology that cannot be resolved from field studies alone. Thus, there is an opportunity to examine the covered geology of the Yerrida Basin with a range of geophysical techniques. This opportunity exists because multiple geophysical data are required to delineate anomalies that can be interpreted to be structure, rock bodies or both. That no individual physical field adequately reflects all the elements required to construct a meaningful model stems from the ambiguity of geophysical data (Nettleton, 1942; Fullagar et al., 2004). Different lithologies often share very similar characteristics for a single petrophysical attribute (igneous, metamorphic and sedimentary examples with magnetic susceptibility; see Grant, 1985, and Clark, 1997; for density examples see Manger, 1963). Differentiation between geological units is typically made with less ambiguity using multiple petrophysical attributes. For example, Perrouty et al. (2012) and Lindsay et al. (2016) use magnetic susceptibility and density measurements for both structural interpretation and forward modelling to differentiate geological units. This scenario is not unique, and typically any geological investigation using geophysics requires at least two physical fields to reveal architectural elements with less ambiguity to the interpreter (Aitken and Betts, 2009; Blewett et al., 2010; Dufréchou et al., 2014; Lindsay et al., 2016; Perrouty et al., 2012). These examples show how increased interpretation confidence is provided by identifying co-located anomalies present in multiple datasets. The reasoning is that if an anomaly is present in multiple datasets, it is less likely that (i) the anomaly has not been introduced as an artefact during data processing or collection and (ii) it is significant enough that it influences each of the represented physical fields to produce a detectable anomaly.
An alternative and less sceptical viewpoint is to use multiple datasets to detect anomalies because some geology only has a detectable response in specific physical fields or with a particular orientation. For example, gravity and magnetic data were used by Lindsay et al. (2017) and Kohanpour et al. (2018) to delineate structure from a region in east Kimberley, northern Western Australia, where magnetic data provided nearer-surface imaging of the crust, and gravity imaged the deeper structure. Brethes et al. (2018) use magnetic and electromagnetic data with field observations to perform an interpretation of the Jameson Land Basin, Greenland, where at the smaller scale of their study, electromagnetic data imaged the surface and near-surface geology effectively, and magnetic data imaged the deeper structure. Blaikie et al. (2014) use detailed gravity and magnetic surveys to compare the structure of maars and diatremes in the Newer Volcanics Province (NVP; Victoria, Australia) and infer their eruptive histories.
Geological constraints are required to support geophysical interpretation and modelling. The inclusion of field- or core-collected data is arguably the best way to reduce geophysical and petrophysical ambiguity (Betts et al., 2003; Brethes et al., 2018; Perrouty et al., 2012). Husson et al. (2018) use geological measurements and interpretations in the form of a petrophysically attributed 3D geological model to constrain gravity inversion and locate karstified regions in the Languedoc area, southern France. Such regions, covered by large areas of regolith, transported cover or basin sedimentary rocks, make opportunities to make relevant observations of the target rare. Thus, a necessary reliance on petrophysical constraint ensues when geophysical interpretation and modelling become the only convenient methods to examine geological structure.
This paper describes how different datasets were used to identify various parts of basin architecture through structural interpretation, geophysical forward modelling, 3D structural modelling, geophysical inversion and whole rock geochemistry. The initial hypotheses about basin structure were generated primarily from the integrated interpretation of geological, gravity and magnetic datasets. Geophysical modelling was used to expand the understanding of architecture into three dimensions. Geochemistry was used to determine whether the interpreted mafic bodies were likely to be the Killara Formation basalts or different bodies that may be associated with the Juderina Formation. The results were used to determine whether and where in the Yerrida Basin volcanic-hosted massive sulfide (VMS) mineralization might be prospective.
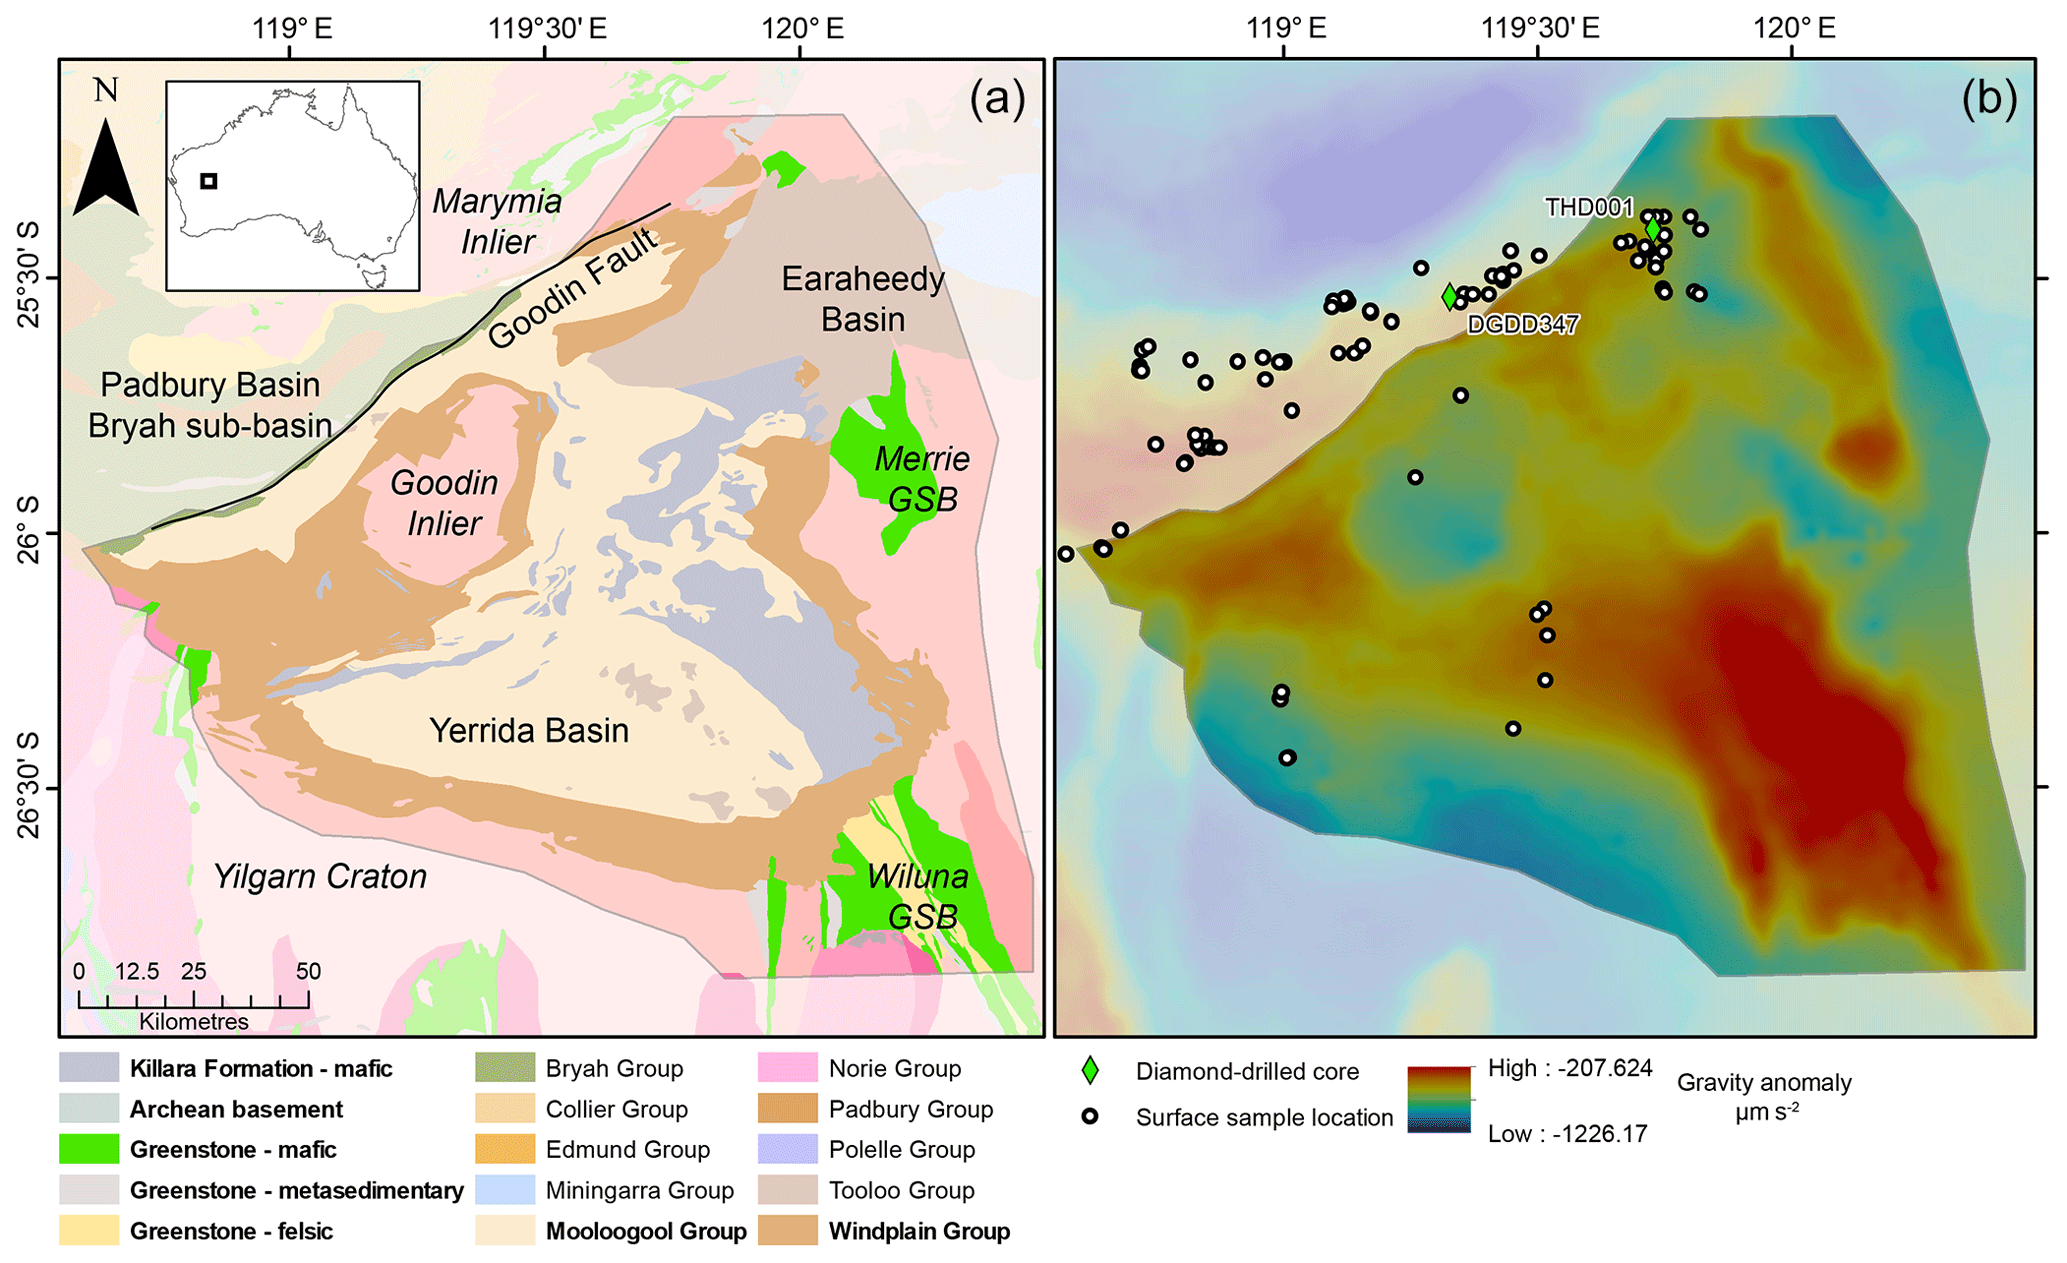
Figure 1(a) Location and geology of the Yerrida Basin, Capricorn Orogen. (b) Bouguer gravity image of the Yerrida Basin shown with sampling locations for petrophysical and geochemical data. Points represent surface sample locations; diamonds represent the location of diamond-drilled core collars with name. Significant regions are labelled with Archean rocks shown with italic font. GSB signifies the greenstone belt. The legend lists group-level stratigraphic units, and those shown in bold are described in Fig. 2. The shaded region indicates those outside the study area.
The Palaeoproterozoic Yerrida Basin is located on the northern margin of the Archean Yilgarn Craton within the southern part of the Capricorn Orogen (Fig. 1) and extends approximately 150 km from north to south and 180 km from east to west. Other Palaeoproterozoic basins are located at the margins of the Yerrida Basin: the Bryah sub-basin and Padbury Basin (north and west) and the Earaheedy Basin (east). The Bryah sub-basin was recently found to be a sub-basin of the Yerrida Basin by Occhipinti et al. (2017). Archean rocks also bound the basin with the northern extent of the Wiluna Greenstone Belt to the south-east and the Yilgarn Craton granite-gneiss to the east. The Archean Goodin Inlier sits within the Yerrida Basin. The Archean Marymia Inlier is located to the north and separated from the Yerrida Basin by part of the Bryah Basin.
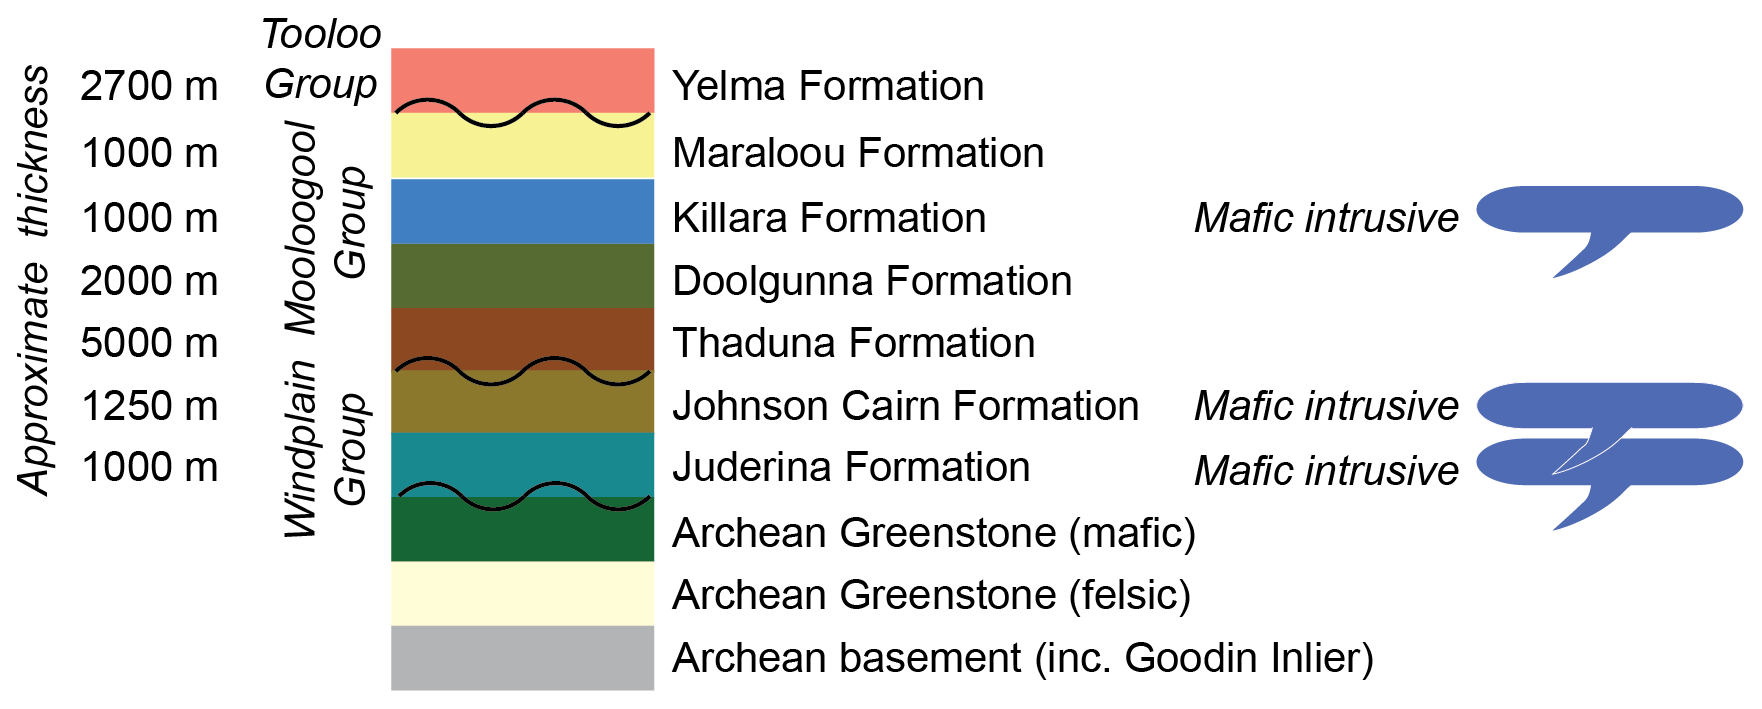
Figure 2Stratigraphy and input for the Yerrida Basin 3D model modified from Occhipinti et al. (2017). The position of unconformities is indicated with a wavy line, and approximate thicknesses are given. The position of the mafic intrusives is shown to indicate the possible stratigraphic position being tested by geophysical modelling. Unit colours correspond to those used in the 3D model (see 3D Model in Sect. 4.6 and Fig. 10).
The stratigraphy of the Yerrida Basin, summarized in Fig. 2 and by Occhipinti et al. (2017), is comprised of an underlying Archean basement of granite–greenstone rocks typical of the Yilgarn Craton. The Wiluna Greenstone Belt is located at the south-eastern edge of and is unconformably overlain by the Yerrida Basin. The Merrie Greenstone Belt is located at the eastern edge of the basin and is unconformably overlain by Yerrida Basin and Earaheedy Basin rocks. The Goodin Inlier is an elliptical, roughly 30 km×45 km fragment of Archean granitic basement unconformably overlain by the Windplain Group, the basal units of the Yerrida Basin. Goodin Inlier rocks are heavily weathered, predominantly monzogranites and mostly undeformed except at the south-western margin. Easterly to south-easterly trending mafic dykes intrude the Goodin Inlier and are marked in places by sericitized feldspars produced by contact metamorphism (Adamides, 1998). The Marymia Inlier, also an Archean fragment, is located to the north and north-east of the Yerrida Basin and was likely reworked during the Palaeoproterozoic (Bagas, 1999). Sedimentation patterns and the development of the Yerrida Basin were likely influenced by both the Goodin and Marymia inliers and uplift early in basin development (Pirajno et al., 1998).
The development of the Yerrida Basin began with the deposition of the Windplain Group at ca. 2200 Ma, followed by the Mooloogool and Bryah groups from 2180 to 1996 Ma (Occhipinti et al., 2017; Pirajno and Occhipinti, 2000). The rocks of the Windplain Group are representative of a shallow coastal and possible epicontinental setting (Occhipinti et al., 2017), while the rocks of the Bryah and Mooloogool groups were deposited in relatively higher-energy and possible rift environments (Occhipinti et al., 2017; Pirajno and Adamides, 2000). Periods of magmatism are recorded primarily by the basaltic volcanic and intrusive rocks of the Killara and Narracoota formations (Mooloogool and Bryah groups, respectively), though other mafic intrusive and extrusive rocks are observed in other formations (Juderina and Karalundi formations; Occhipinti et al., 2017) and as dykes (2200–2014 Ma) (Mueller, 2011; Occhipinti et al., 2017). The geodynamic evolution of the Yerrida Basin is interpreted as a pull-apart basin opening consistent with a trailing-edge marginal sag basin (Pirajno and Occhipinti, 2000), progressing to a rift in the north (Bryah sub-basin) (Occhipinti et al., 2017; Olierook et al., 2018). Continued extension resulted in the intrusion and extrusion of the Killara Formation tholeiitic basalts (Occhipinti et al., 1997). Basin development ceased with the deposition of the Maraloou Formation (Mooloogool Group) shales and siltstones in a lacustrine environment (Pirajno and Adamides, 2000; Pirajno and Occhipinti, 2000; Occhipinti et al., 2017). The Mooloogool Group is unconformably overlain by the Yelma Formation (Tooloo Group) and is the basal unit of the Earaheedy Basin (Occhipinti et al., 2017).
Mineralization potential
The Yerrida Basin is host to epigenetic lead-carbonate and oxide mineralization at the unconformable contact between the carbonate and sandstone rocks of the Juderina Formation and the overlying Yelma Formation (Pirajno and Occhipinti, 2000). The position of this unconformity in the southern part of the basin is likely due to it being exposed while sedimentation occurred further north. The potential for epithermal copper exists in the Thaduna Formation due to the presence of the Thaduna copper mine (Pirajno and Adamides, 2000). Volcanic-hosted massive sulfide (VMS) mineralization is exhibited by the DeGrussa Cu–Au–Ag deposit (12 Mt of 4.7 % Cu and 1.8 g t−1 Au) and is associated with mafic volcanism at 2045 Ma (Hawke et al., 2015). While mineralization is hosted in the Karalundi Formation of the Bryah Group, the synchronous deposition of the Juderina and Johnson Cairn formations (Occhipinti et al., 2017) has generated interest in the Yerrida Basin for VHMS mineralization, especially along the north-western margin and Goodin Fault, given they likely influenced the formation of the basin.
3.1 Rock properties
Rock properties measured from samples collected from the study area provide an important constraint for any structural interpretation or modelling of geophysical data (Fig. 1). Samples were collected from outcrop and carefully assessed to be free of weathering and alteration; however, it is noted that there is a higher risk of sample contamination from surface outcrop than from drill core. Magnetic susceptibility and density properties help to guide the reasonable discrimination of rock types from magnetic and gravity datasets during interpretation. The rock property data collected from the study area guided the classification of geological units in the structural interpretation and provided the basis of the susceptibility and density values used in forward modelling.
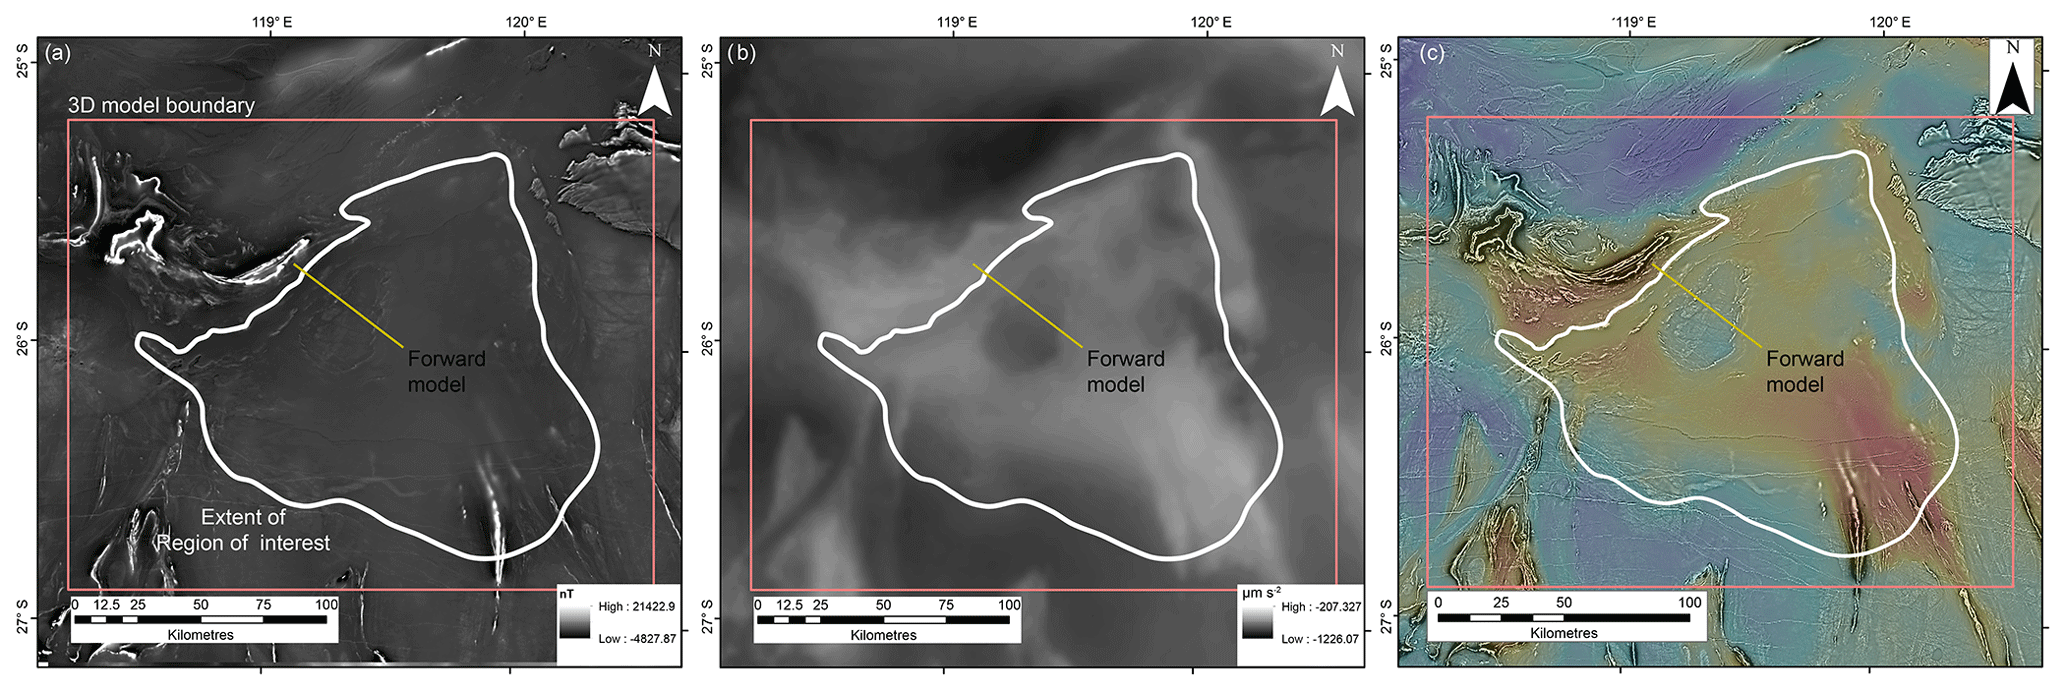
Figure 3Geophysical grids and forward model location trace (as indicated). (a) Magnetic anomaly, (b) Bouguer gravity anomaly and (c) blended image of Bouguer anomaly (colour) and 1VD of the dRTP magnetic data (greyscale).
3.2 Potential field data
Magnetic data (Fig. 3a) were obtained from the Geological Survey of Western Australia (GSWA) in grid form with an 80 m cell size that had been differentially reduced to the pole (dRTP) (Brett, 2017a). The resulting dRTP grid is a mosaic of government-funded aeromagnetic surveys with line-spacing between 200 and 400 m. Flight heights were between 80 and 90 m depending on the individual survey. Various transforms and filters were applied to the dRTP grid to subdue or enhance particular features and included tilt, vertical and horizontal derivatives, analytic signal, upward continuation, and dynamic range compression (DRC; see Kovesi et al., 2012, for details).
Bouguer gravity data (Fig. 3b) were obtained from the Australian National Gravity Database maintained by Geoscience Australia and have been corrected for terrain and spherical-cap effects (Brett, 2017b). Older data from the eastern part of the Capricorn Orogen preserve topographic effects as only the most recently acquired surveys are terrain-corrected. Most gravity data have a station spacing of between 2 and 4 km; however, in areas of more sparse coverage spacing can be up to 11 km. A grid was interpolated using a minimum curvature algorithm (Briggs, 1974) and used for interpretation and modelling. The gravity grid and variations were produced with a cell size of 1 km to provide the necessary detail and coverage.
3.3 Structural interpretation
Integrated geological interpretation was conducted using primarily geological, gravity, magnetic and digital elevation model data. It was expected that aeromagnetic data would be effective in interpreting the upper crust to determine the smaller-scale structural architecture as demonstrated by Aitken and Betts (2008), Betts et al. (2007), Gunn (1997), and Lindsay et al. (2017). However, magnetic data were not as useful in comparison to these cited studies for the following three reasons: (1) the basin sedimentary rocks do not display enough magnetic susceptibility contrast to allow discrimination of structure; (2) the basin architecture is mostly flat-lying, and thus most rock boundaries (and thus potential locations of high petrophysical contrast) were parallel to the plane of view used during interpretation; and (3) magnetic regolith and stream sediments obscure the underlying structure. Typical signal processing filters proved the most useful for magnetic data in different areas on the basin: upward continuation (to remove shorter wavelength and near-surface responses), the first vertical derivative (1VD), automatic gain control (AGC), tilt derivative (TDR) and dynamic range compression (DRC) processing of Kovesi (2012). The combination of magnetic data with gravity proved the most helpful, with blended grids facilitating better imaging of structure, where two grids are overlain and one is made semi-transparent. In particular, the combination of Bouguer gravity data and the 1VD of the magnetic dRTP was used to provide additional insight into regions where the magnetic susceptibility contrast was low (Almalki et al., 2015; Fairhead, 1976; Hildenbrand et al., 2000) (Fig. 3c).
Field-based geological information was obtained from WAROX, the Geological Survey of Western Australia's rock observation database (Geological Survey of Western Australia et al., 2017), and used to locate some structures, but it was principally employed to understand the geometry and orientation of the interpreted structures. WAROX data were invaluable for generating a 3D understanding.
3.4 2D joint magnetic and gravity forward modelling
The map interpretation was supported by 2D geophysical forward modelling along a cross section located in the north-western part of the Yerrida Basin (Fig. 3a and b) to provide a platform for hypothesis testing and thus an understanding of the basin architecture at depth. The section transects the north-western edge of the Yerrida Basin, the Goodin Inlier and part of the central part of the basin. The structure and geology of the surface and upper crust were constrained predominantly by geological observations taken from WAROX and GSWA 1:100 000 (Doolgunna, Mooloogool, Thaduna) and 1:250 000 (Glengarry, Peak Hill) scale maps (Appendix 1) and our own fieldwork. The petrophysical model generated by forward modelling was constrained with density and magnetic susceptibility data that supported the subsequent geological interpretation. Forward calculation of the geophysical response was undertaken using the GM-SYS application in the Geosoft Oasis montaj® (https://www.geosoft.com/products/oasis-montaj, last access: 12 April 2020) software following the methods of Talwani et al. (1959).
3.5 3D modelling and geophysical inversion of gravity
3D modelling was performed using Intrepid Geophysics GeoModeller© (Calcagno et al., 2008). The purpose of producing a model was two-fold: (1) to better understand the 3D architecture of the basin and (2) to test the modelled architecture against the observed regional geophysical response across the entire basin. Geophysical modelling techniques were both 3D forward modelling (Talwani and Heirtzler, 1964; Talwani et al., 1959) and geophysical inversion (Guillen et al., 2008). GeoModeller software allows the stratigraphy to be defined as a topological constraint with interpreted deformation structure assigned to each stratigraphic unit so that deformation timing can be established and only geological units of equivalent age or older are affected. As with all 3D modelling packages, some upscaling of data needs to be performed (Lindsay et al., 2012) so only the larger and more significant structures were included. This is because of limitations in the algorithms these packages use in reproducing complex geometries typically encountered in the natural world (Jessell et al., 2014). Stratigraphy was treated similarly, and the modelled units were limited to formations. Likewise, the 3D modelling algorithm provided by GeoModeller does not allow for joint modelling of more complex geological relationships, such as equivalent facies or intercalated formations (for example, the Doolgunna and Thaduna formations) (de Kemp et al., 2017). Simplifications are thus required for all formations being represented as discrete units while still belonging to the same group. The stratigraphic input data are summarized in Fig. 2.
Geophysical inversion was performed using the total litho-inversion method of Guillen et al. (2008), a stochastic process which obtains a 3D probabilistic description of geological objects while constrained by the available data: geological boundaries (our interpretation), petrophysics (density) and the observed geophysical field (the gravity grid). A range of model geometries and rock property values is tested and returns a model and a probability distribution over model space, which addresses issues surrounding deterministic inversion methods of non-uniqueness and attempts to identify the best or most probable model (Tarantola, 2006). The input to inversion is the geological model with petrophysical properties assigned to each formation. Inversion can result in some violations of model topology, where implausible stratigraphic relationships are recovered as they provide a less costly mathematical solution. This method allows the application of constraints to ensure that model topology (i.e. the stratigraphy; Fig. 2) was not violated and that recovered lithologies remain in the correct stratigraphic order.
3.6 Geochemistry
Ultramafic and mafic rock samples obtained from the Yerrida Basin were analysed for major and trace element geochemistry at the commercial Australian Laboratory Services (ALS) laboratory, Perth. Further details (data tables and methods) are provided in the supplementary materials of Olierook et al. (2018).
Table 1Petrophysical statistics calculated from rock sample measurements.
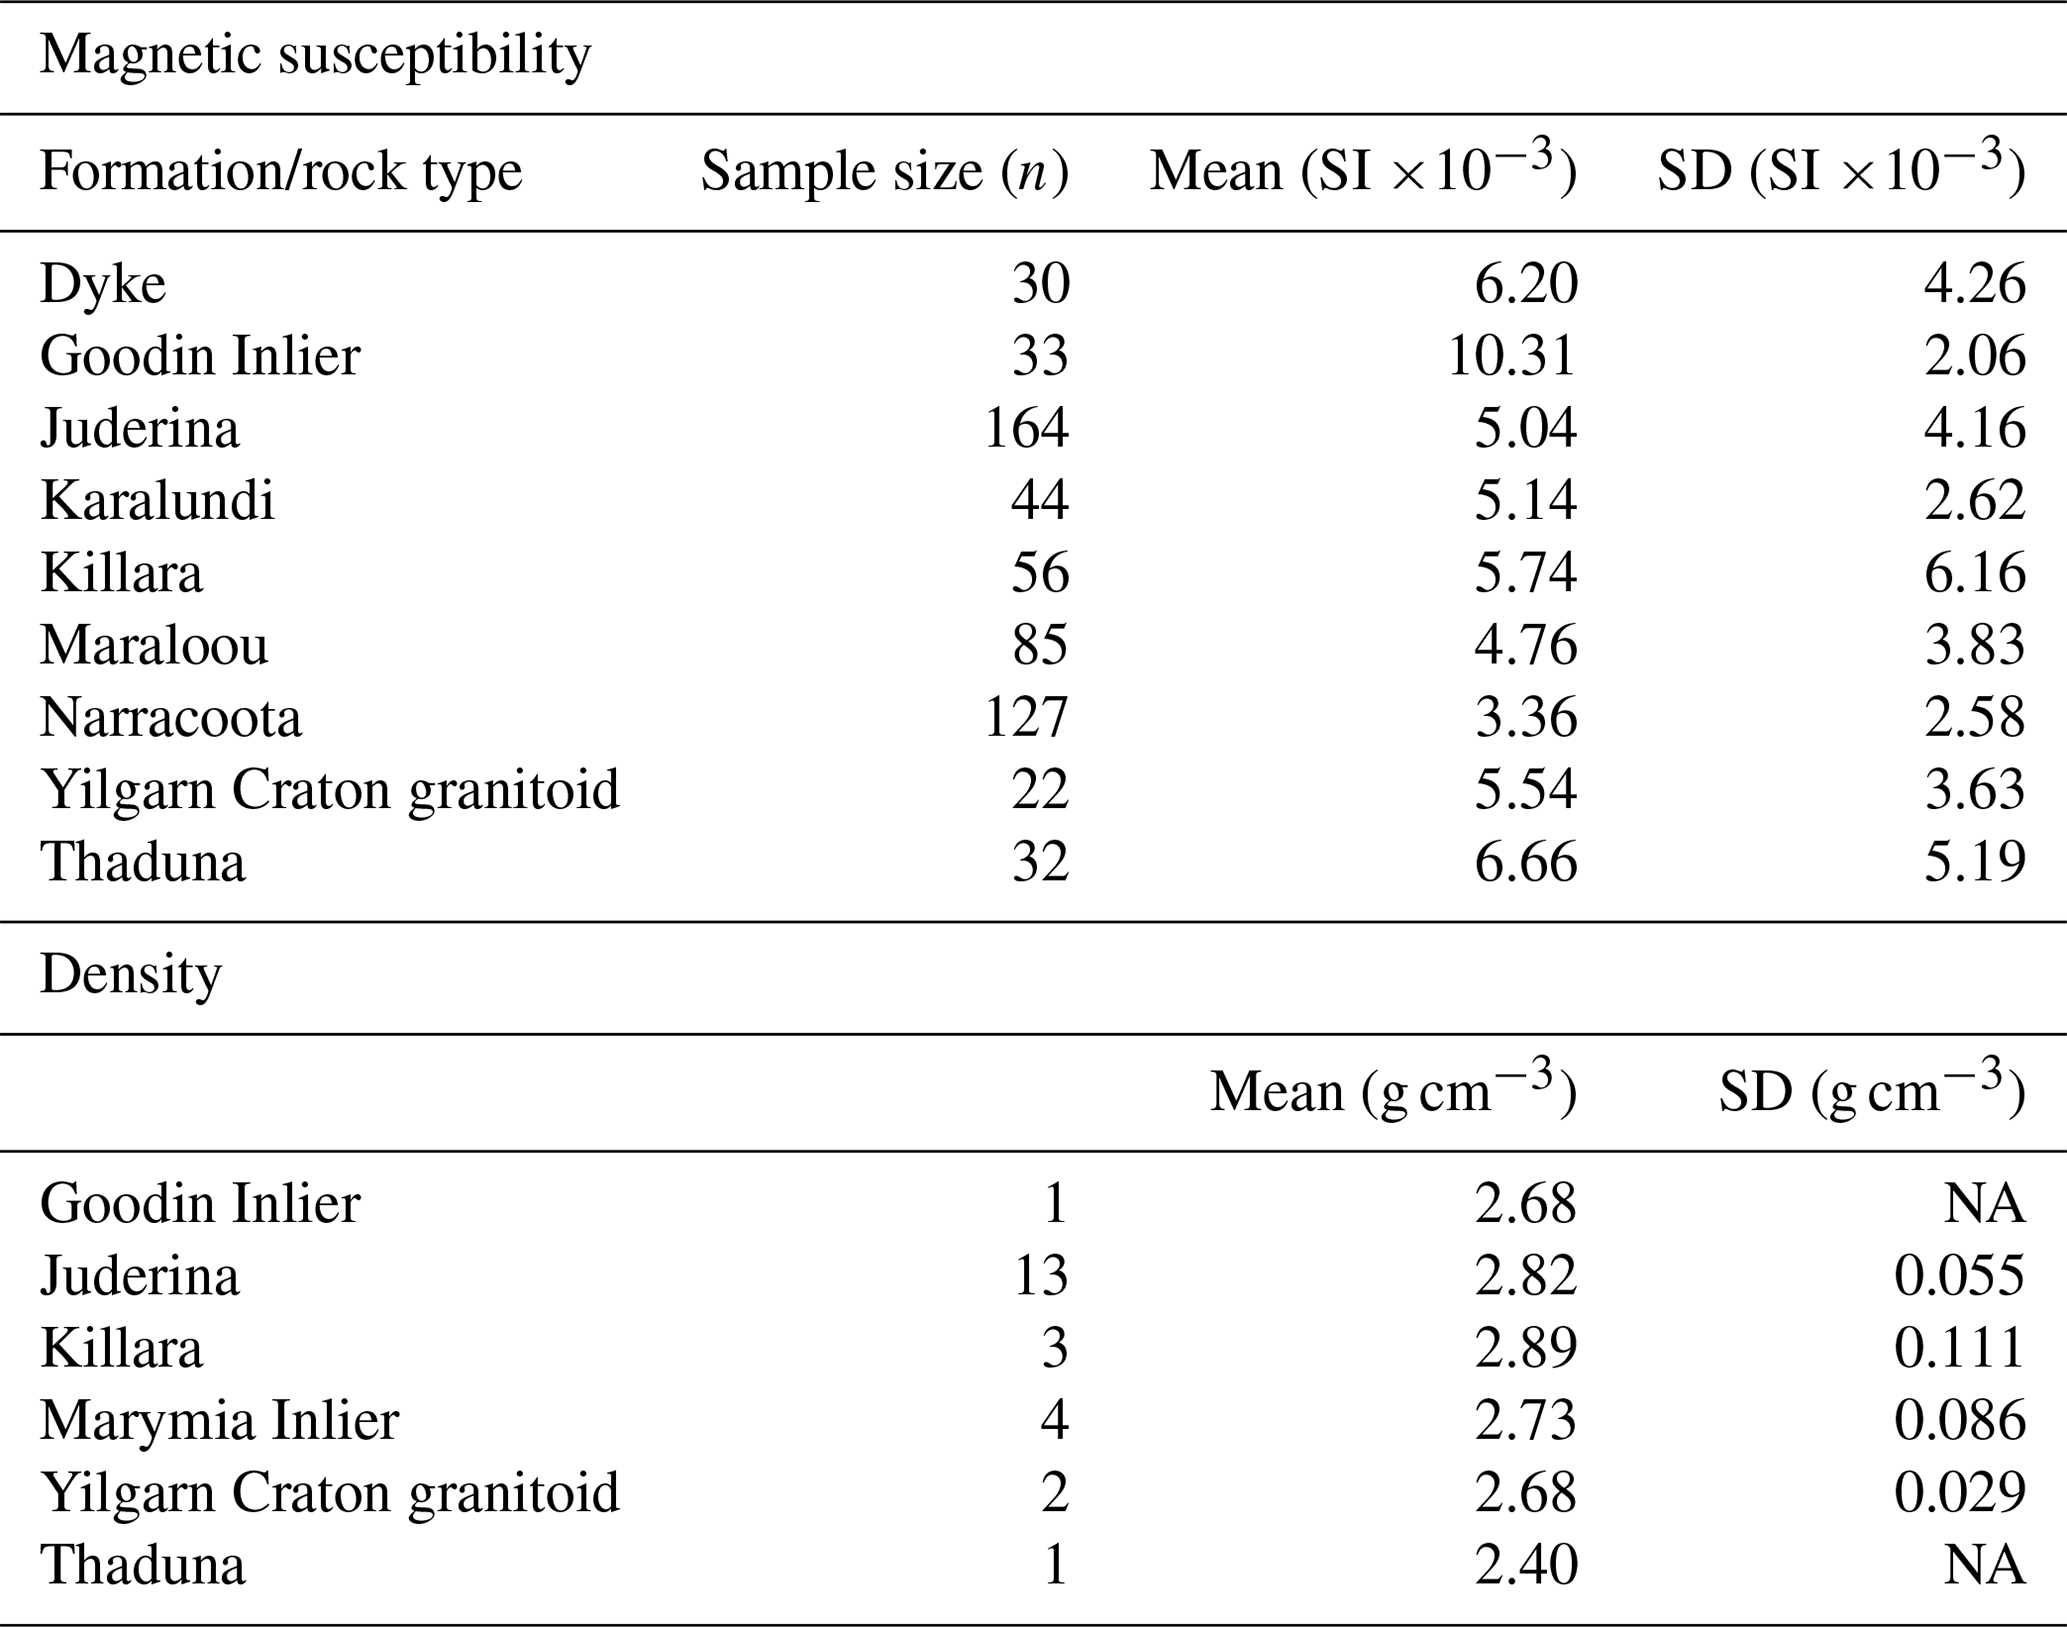
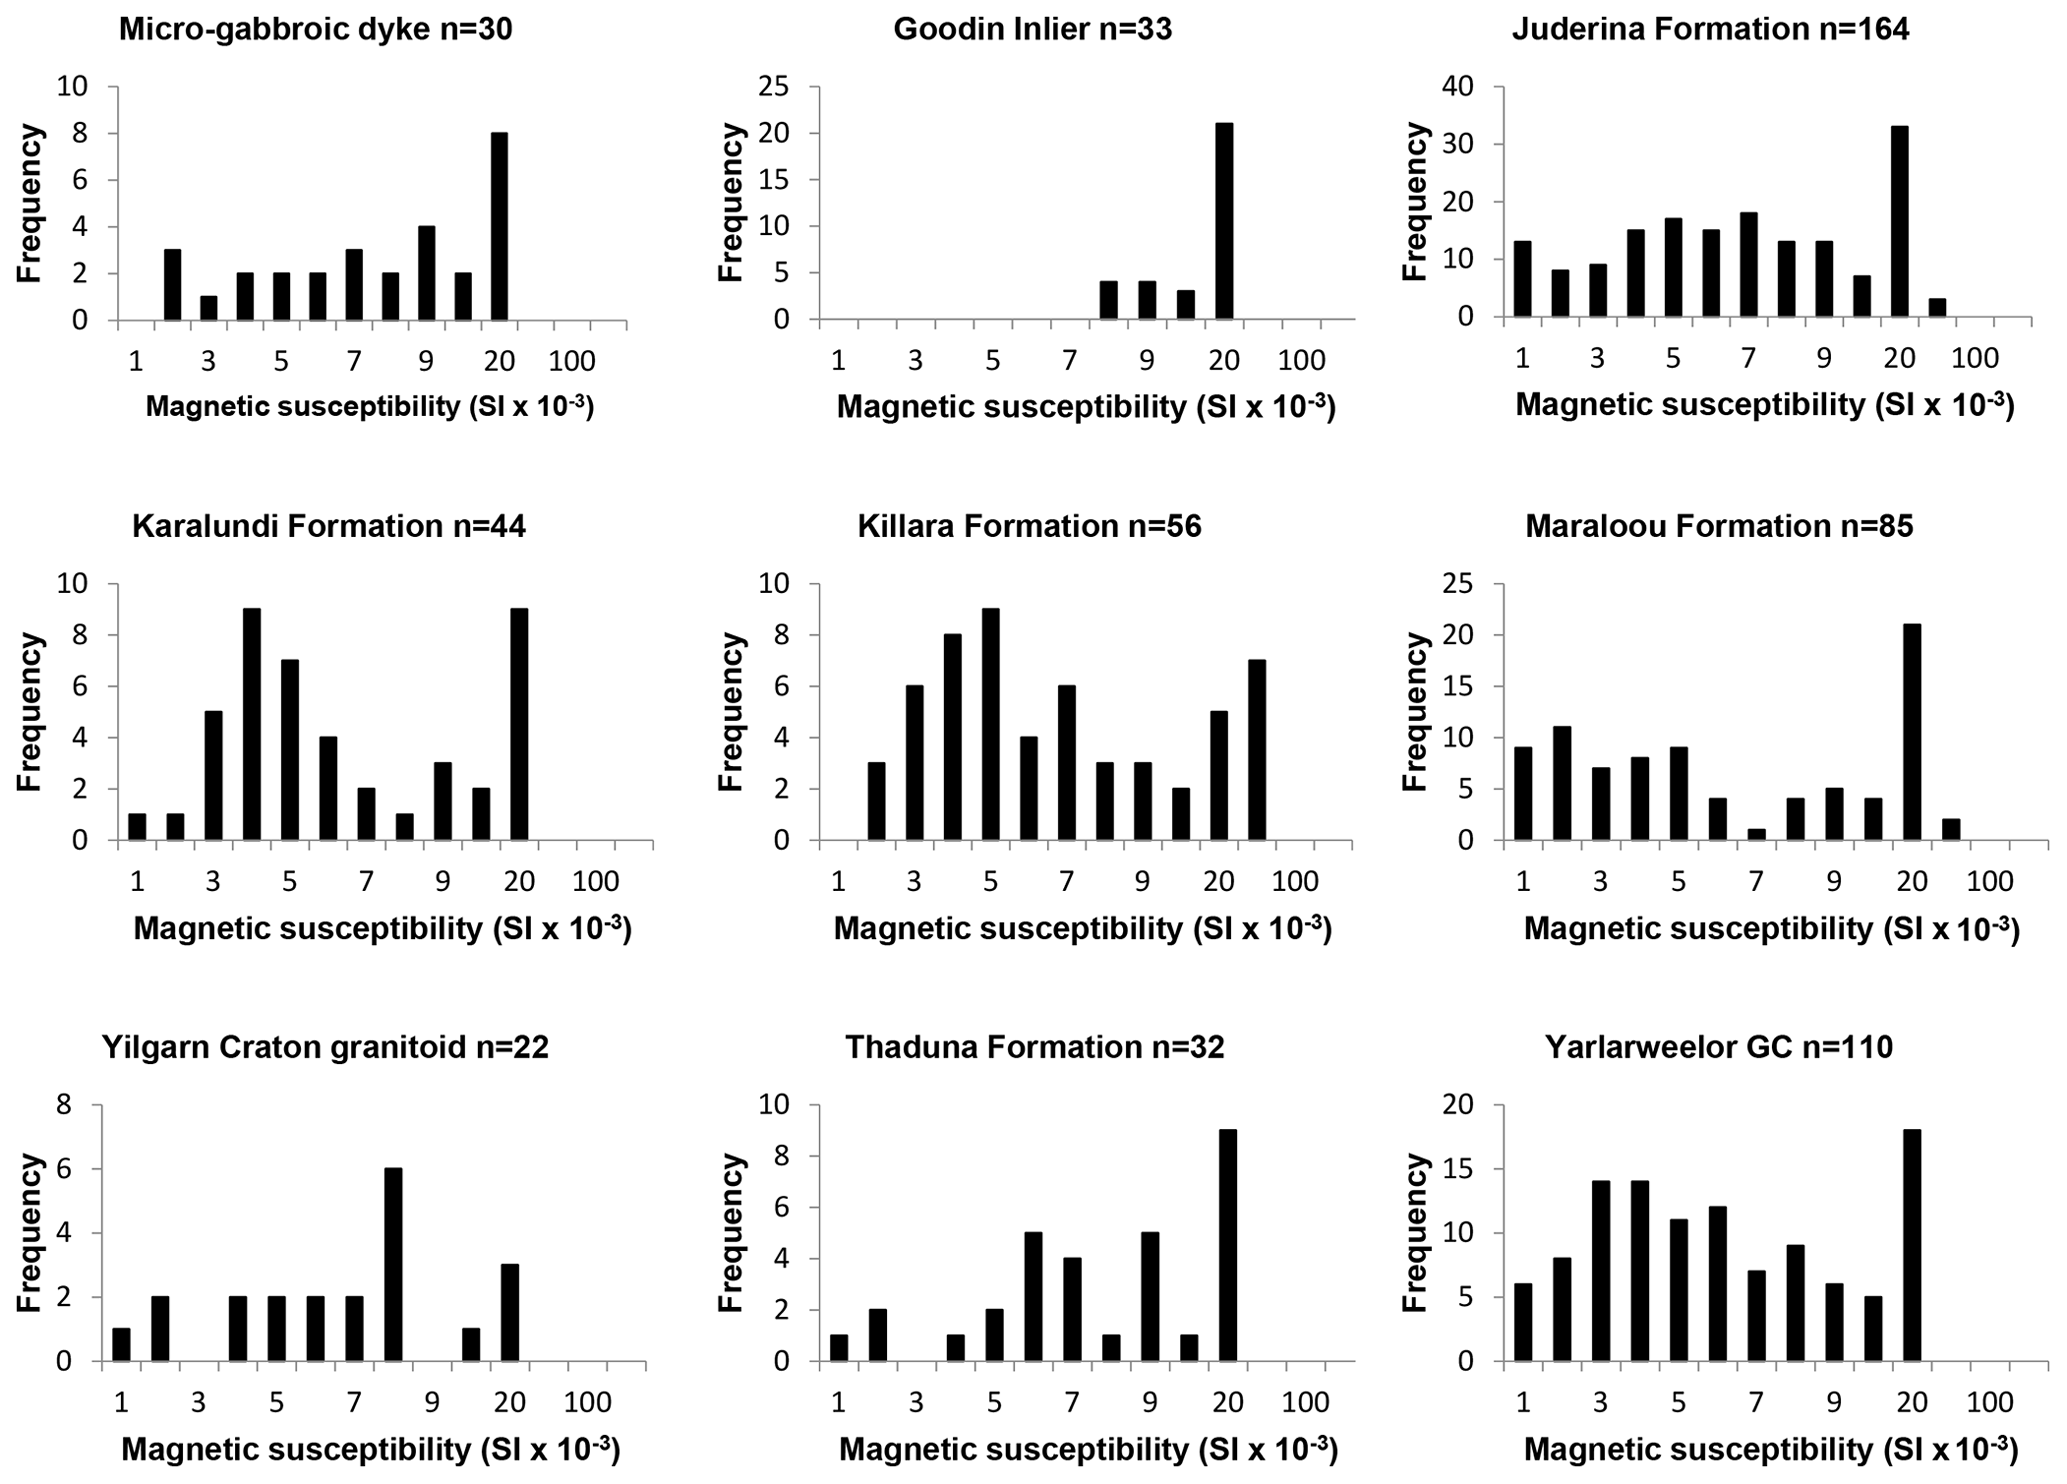
Figure 4Histogram representations of measured magnetic susceptibility from Yerrida Basin rocks.
4.1 Petrophysics
Table 1 shows the measured values of both magnetic susceptibility (in SI units) and density (g cm−3) from rocks representative of the Yerrida Basin stratigraphy and the input for forward and inverse geophysical modelling. Sample locations are shown in Fig. 1. The magnetic susceptibility values show very little variation between rock units. This, combined with the magnitude of error that envelops the range of susceptibility values across the measured rock unit, means that accurately differentiating geological bodies with magnetic data in this location is unlikely. Density petrophysics do show greater variability between rock units with less error, meaning that gravity data may be more useful than magnetic data in differentiating geological bodies during forward modelling even with data at a lower resolution. Figure 4 shows the histogram representation of magnetic susceptibility for each unit, and Fig. 5 shows the same for density.
Not all geological rock units used in the geophysical and 3D models have measurements obtained from field-collected samples. Generic values taken the corresponding lithology of Telford et al. (1990) were used when otherwise unavailable.
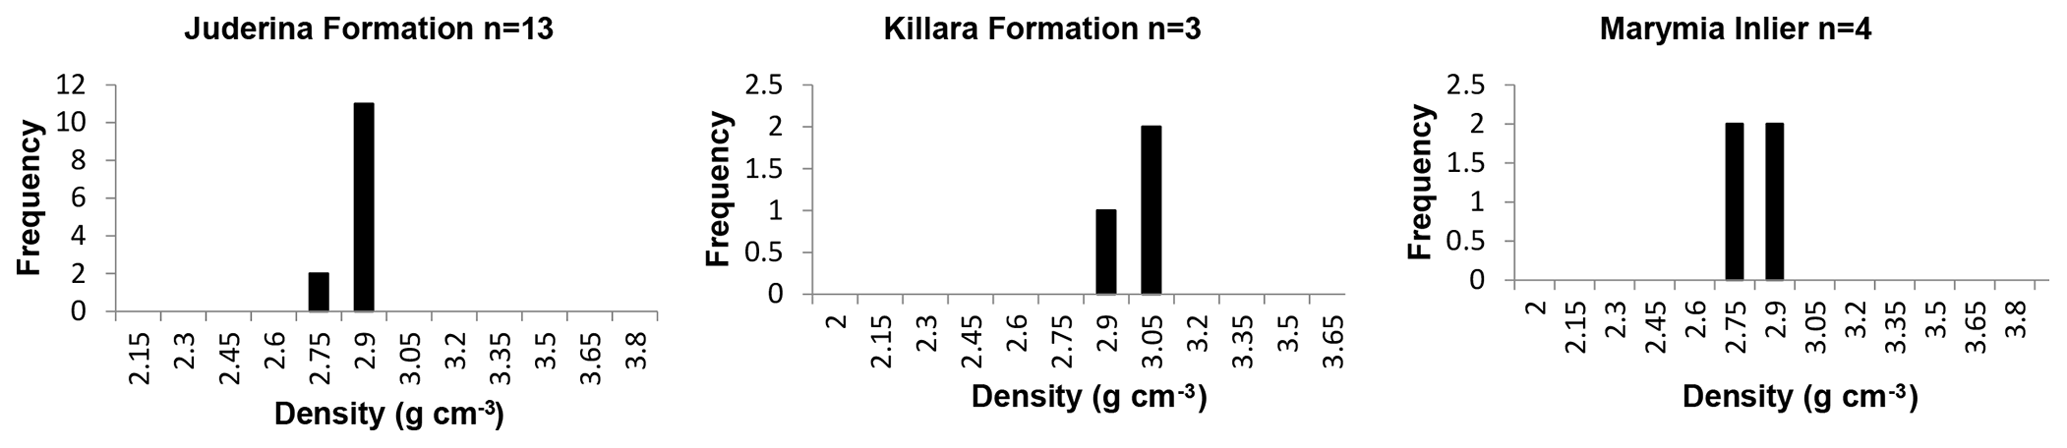
Figure 5Histogram representations of measured Archimedes bulk density of Yerrida Basin rocks.
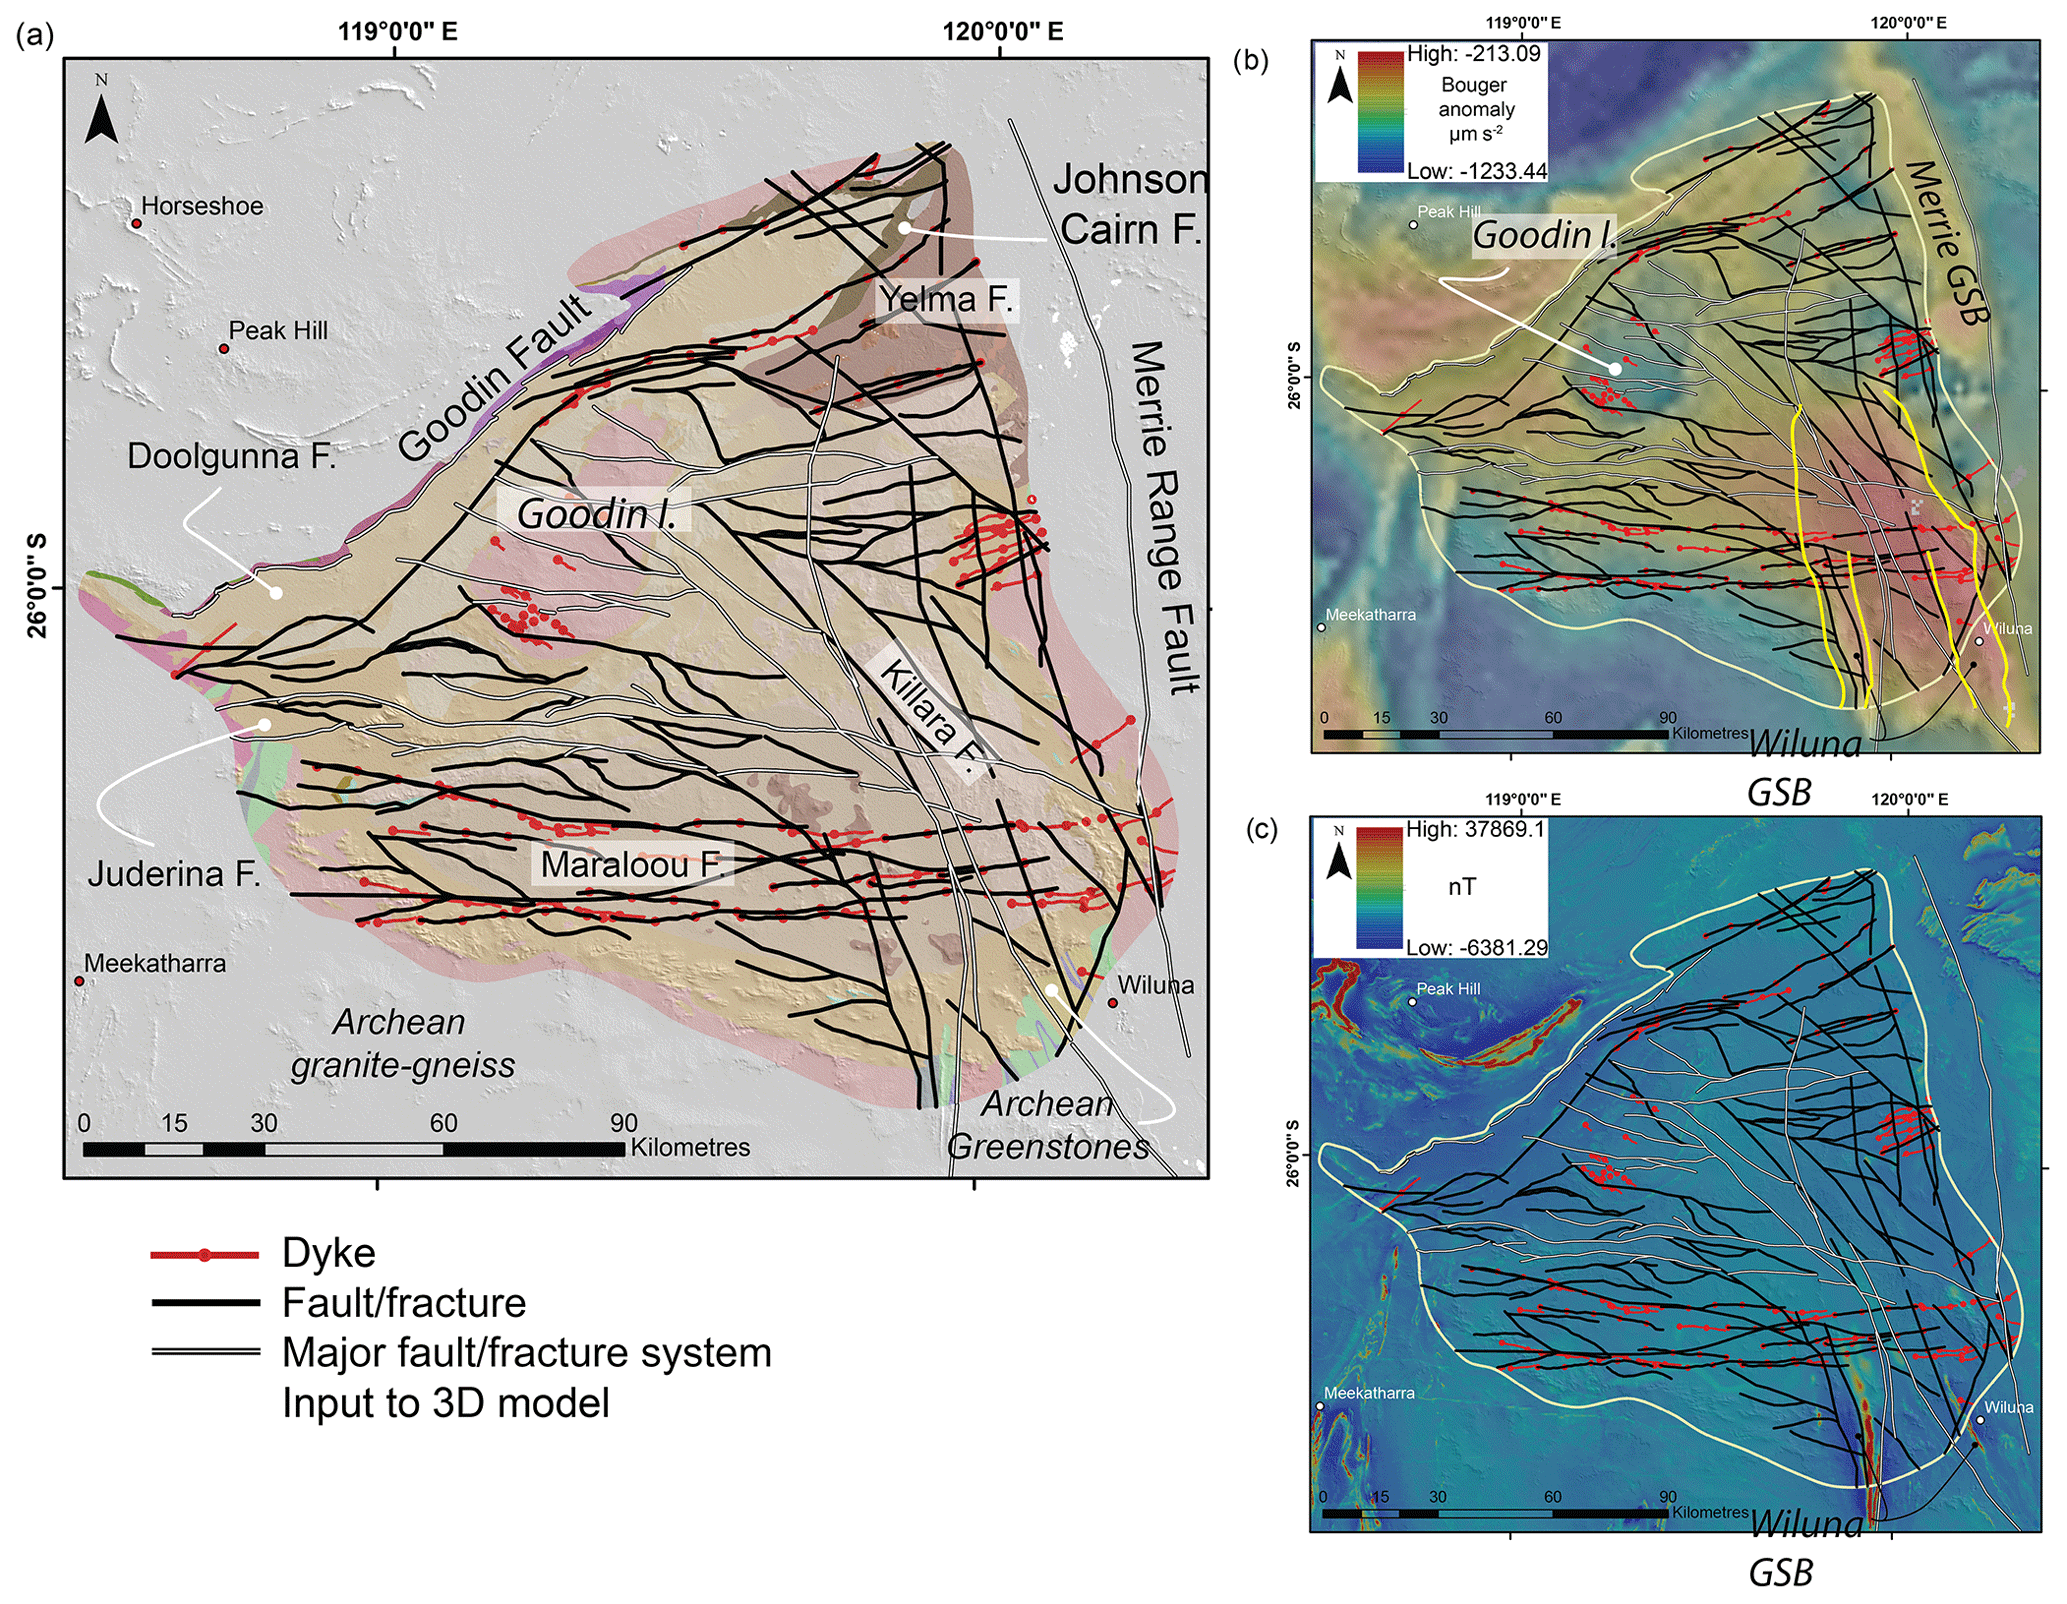
Figure 6Simplified structural geophysical interpretation of the southern Yerrida Basin. (a) Integrated interpretation of structure and rock units with the highlighted major fault systems as input to the 3D model (see 3D Model in Sect. 4.6). (b) Interpreted structure shown with gravity data (blended image; Bouguer anomaly shown in colour with 1VD of the Bouguer anomaly in greyscale). (c) Interpreted structure shown with blended magnetic data (blended image; dRTP shown in colour with 1VD of the dRTP shown in greyscale). GSB signifies greenstone belt.
4.2 Structural interpretation
The structural interpretation (Fig. 6a) was started by using gravity data to develop a basin-scale structural framework. Some obvious features are the greenstone belts (Wiluna in the south and Merrie in the east), characterized by a high-magnitude gravity anomaly (Fig. 6b), and strong and linear magnetic anomalies trending to the north-north-west, as shown in the dRTP–1VD blended magnetic image (Fig. 6c). The Goodin Inlier (Fig. 6a) is particularly obvious due to its low gravity signature in contrast to the moderate signature surrounding it (Fig. 6b). The higher-magnitude, moderate gravity signature also appears to be quite extensive and is observed, in some places, to extend to the extents of the basin (Fig. 3b, white line). This suggests the moderate-magnitude anomaly is in response to Yerrida Basin rocks rather than the lower-magnitude response basement, as exemplified by the Goodin Inlier. The Wiluna Greenstone Belt is interpreted as extending under the southern edge of the Yerrida Basin (interpreted boundaries indicated by the yellow line in Fig. 6b) as its characteristic signature extends almost as far north as latitude 26∘ S and dominates the gravity response of the south-eastern corner of the basin.
More detailed structural interpretation at 1:100 000 scale relied upon existing GSWA geological maps, WAROX (GSWA field observation database), magnetic data, orthophotos, digital elevation models, and Landsat 8 and ASTER data provided as CSIRO Geoscience products (Cudahy et al., 2008). Gravity data were used where the resolution allowed the structure to be interpreted.
In both parts of the interpretation, magnetic data proved to be less useful here than other data. The magnetic grids show very little contrast in the Yerrida Basin rocks (Fig. 6c), and this is supported by the magnetic susceptibility results shown in Fig. 4. Some of the interpreted faults are supported by field mapping, the geological maps, the DEM and our own field validation (Fig. 1, note site locations).
The interpretation (Fig. 6a) shows an overall E–W or WNW–ESE orientation of the structure in the west and centre of the basin. The structure in the eastern and southern part of the basin shows an orientation of mainly NNW–SSE, similar to the orientation of the underlying Archean greenstone belt, and suggests inherited structure from the basement into the basin. The lithological interpretation differs little from existing 1:100 000 and 1:250 000 GSWA maps and shows that the Juderina Formation forms the base to much, if not all, of the basin.
The most intriguing part of the interpretation relates to the Mooloogool Group rocks, which are interpreted as being located in the central, western, eastern and northern parts of the basin, with the youngest rocks of the Maraloou Formation being the southernmost. The tholeiitic basalts of the Killara Formation are most extensive in the east with some outcrop in the central, northern and western parts. This was unexpected, and thus interesting, as basaltic rocks are usually the densest rocks in a field area and contribute to stronger gravity anomalies. The initial interpretation of the gravity data showed a moderate-magnitude anomaly to be extensive everywhere in the basin (Fig. 6b), which was initially assumed as Killara Formation due to the presence of higher-density mafic rocks relative to the lower-density sedimentary rocks. Thus, the initial interpretation of the Killara Formation shown in Fig. 6a may not adequately represent its true extent. If the higher-magnitude gravity anomaly observed throughout the Yerrida Basin is caused by the Killara Formation, then the extent of this formation may be far more extensive. The next sections describe how forward modelling and inversion attempt to falsify the hypothesis that the Killara Formation is far more extensive than initially thought.
4.3 Forward modelling
Petrophysically constrained forward modelling of geophysical data was conducted to test the hypothesis that the Killara Formation is more extensive undercover than was shown through interpretation. Three stages of forward modelling were conducted: (1) a 3D conceptual study to validate our primary assumptions, (2) 2D sectional modelling of geophysical data with geological constraints and (3) forward modelling of a 3D geological model.
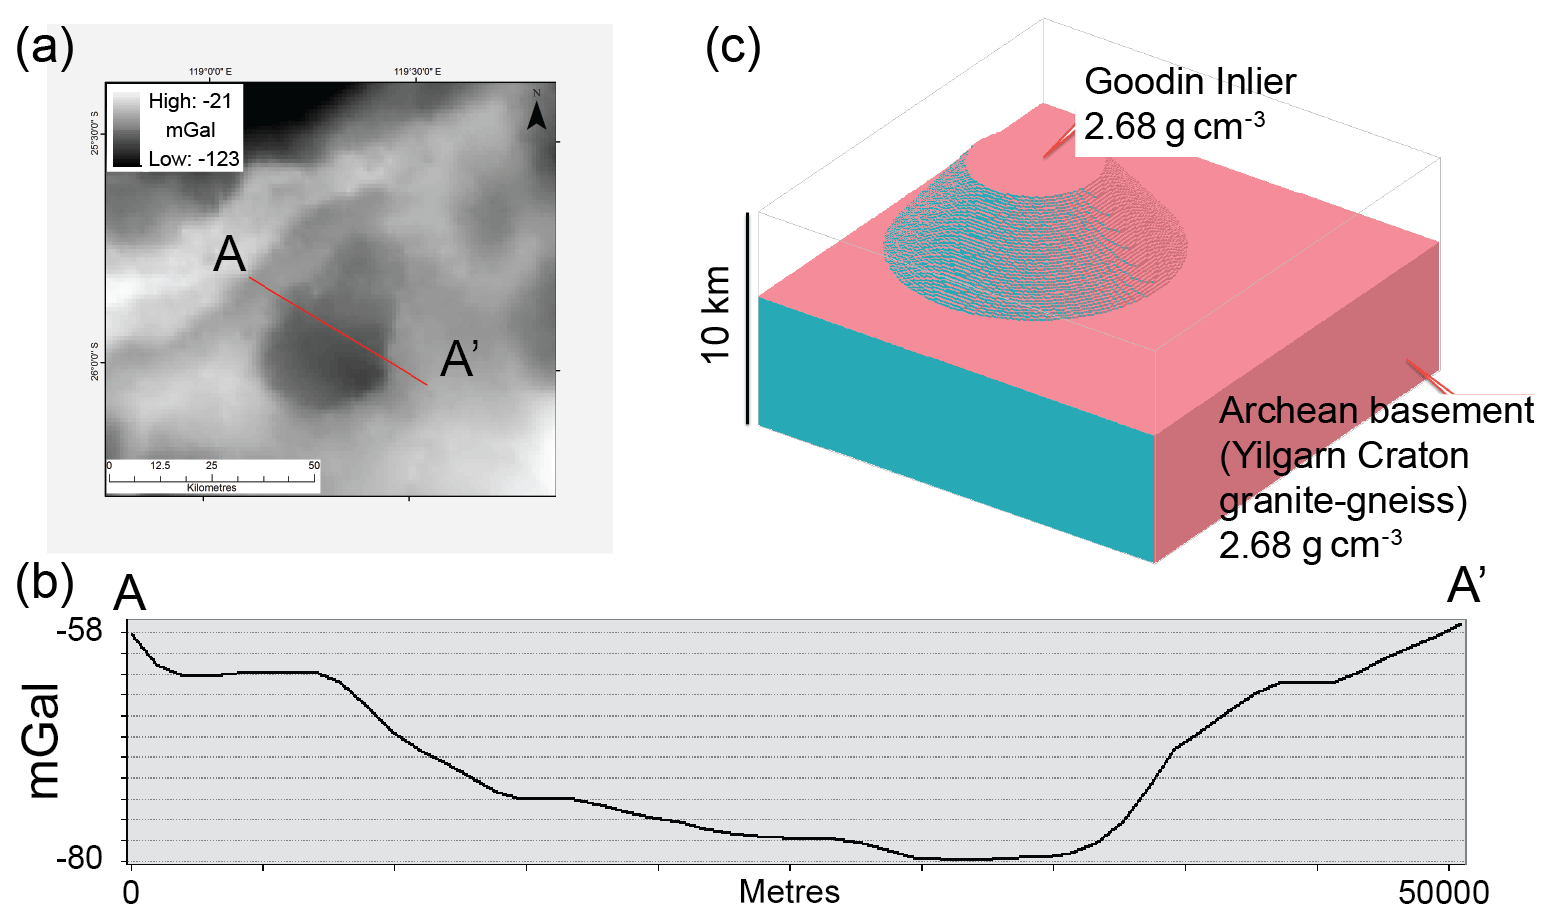
Figure 7Initial conceptual model using “Noddy”: (a) the observed gravity response from a part of the Yerrida Basin, showing the location of the profile in part (b); (b) curve representing the gravity response of the Goodin Inlier taken from the observed gravity; and (c) initial conceptual 3D model of the Goodin Inlier. The Yerrida Basin sedimentary rocks are modelled but are not shown here for better visualization of basement geometry.
4.4 Conceptual modelling: Noddy
“Noddy” is a kinematic modelling package that allows the input of geological events and stratigraphy to generate a 3D model of the resulting architecture (Jessell, 1981; Jessell and Valenta, 1996). A useful feature of Noddy is being able to generate the potential field forward response of the model. By assigning petrophysical values to each stratigraphic layer in the model, a representative grid of the model can be generated (the calculated response) and compared to that provided by the geophysical survey (the observed response; Fig. 7a and b). Figure 7c shows the basement configuration of the conceptual model with the assigned petrophysical attributes. The Yerrida Basin (not shown in Fig. 7c) is thus assumed to have an Archean basement, with the exposed Goodin Inlier forming a dome.
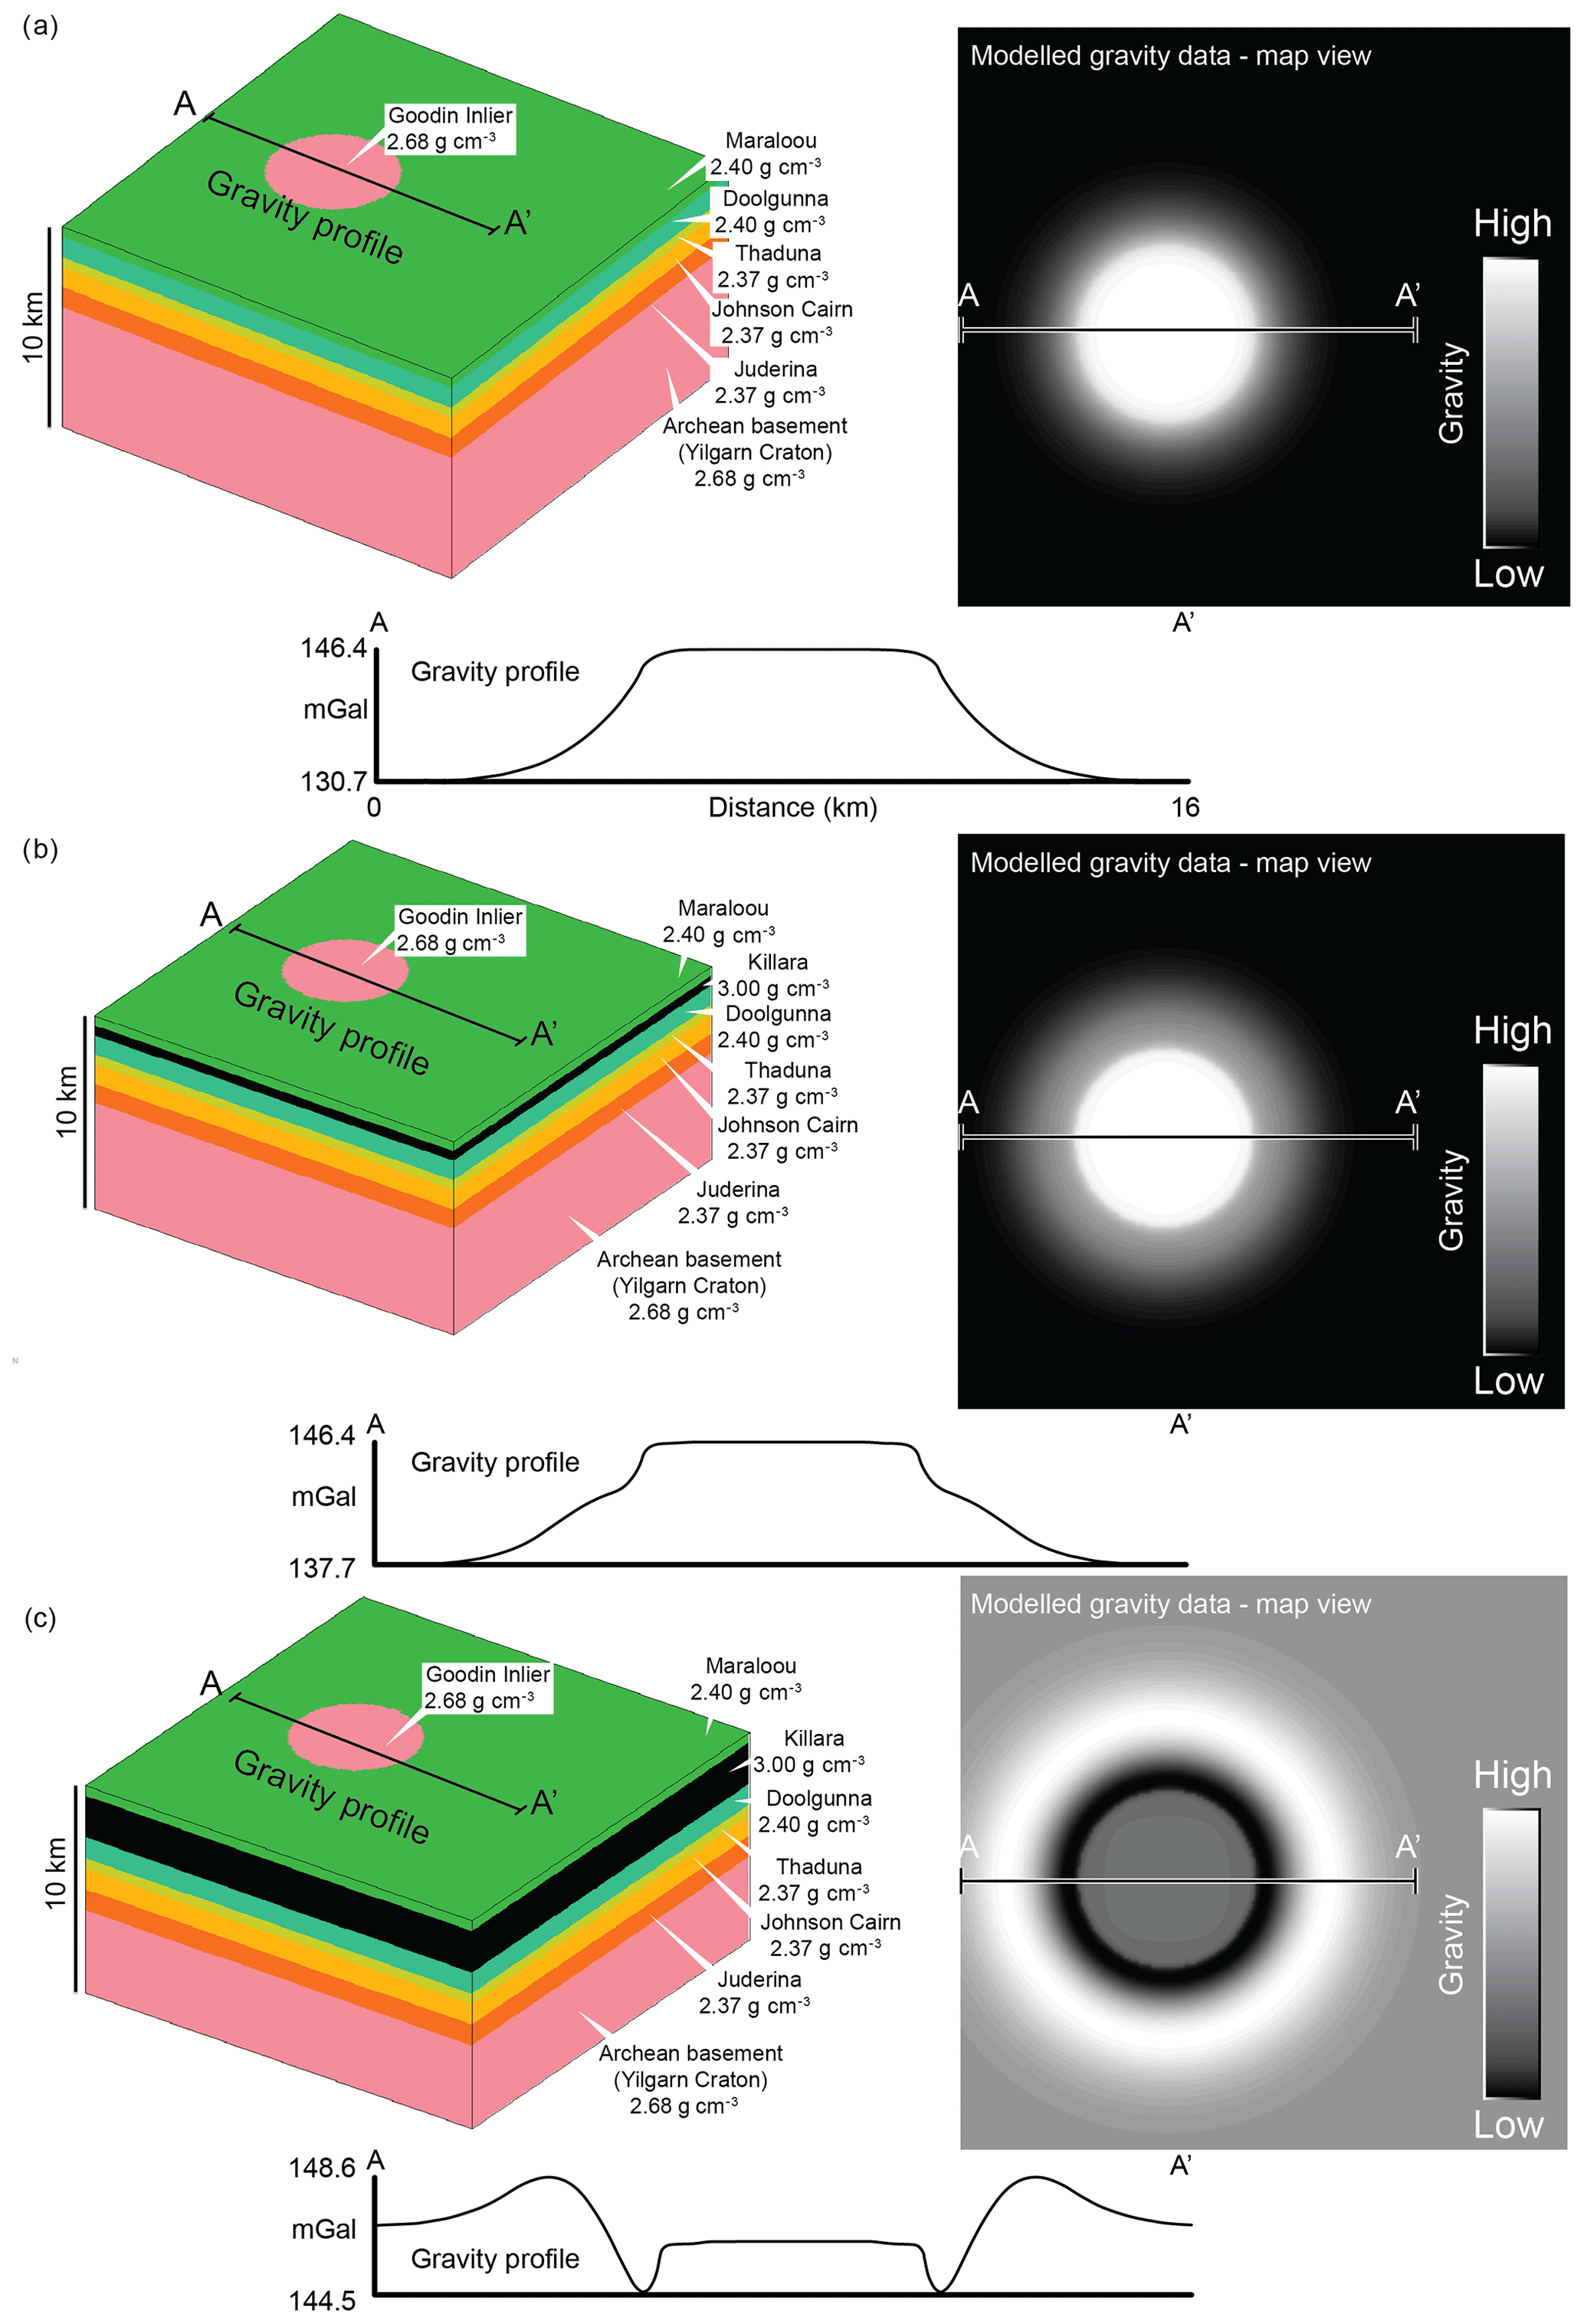
Figure 8Conceptual forward modelling results obtained from Noddy for (a) no Killara Formation, (b) 500 m of Killara Formation and (c) 2000 m of Killara Formation.
Three geological scenarios were explored (Fig. 8). The first simulates that no Killara Formation is present in order to explore what the geophysical response would be if there were very little or no high-density material in the basin (Fig. 8a). The second simulates a 500 m thick layer of high-density material representing the Killara Formation in stratigraphic position (Fig. 2) between the Maraloou and Doolgunna formations (Fig. 8b). The third simulates 2000 m of high-density material (Killara Formation) in stratigraphic position (Fig. 8c). The resulting gravity grids are shown in greyscale with the corresponding model and profiles (A–A') sampled from the gravity grids.
Having no dense material in the basin (Fig. 8a) clearly does not recreate the observed gravity response as the Goodin Inlier produces a gravity high rather than the low shown in the observed response (Fig. 7b). Adding 500 m of dense material (Fig. 8b) produces a marginally closer fit to the observed response, but the Goodin Inlier still produces a gravity high though with a lower difference (8.7 mGal) than in the previous example (15.7 mGal). Adding 2000 m of dense material does produce a response that shows the Goodin Inlier producing a gravity low, which is somewhat similar to the observed response. However, this calls for the Killara Formation to be consistently 2000 m thick, which is twice as much as the 1000 m formation thickness estimated from previous work (Pirajno and Adamides, 2000).
The results from conceptual modelling with Noddy support the hypothesis that a significant amount of dense material in the basin can produce the gravity response seen in the observed data. However, the reality is almost certainly more complex than a single, horizontal and lithologically homogenous layer. The dense material is likely to be a combination of widespread Killara Formation and sills or possibly intrusions produced through related magmatism.
4.5 Testing intrusive scenarios with 2D geophysical forward modelling
Geosoft® GM-SYS is a forward modelling platform that allows the easy exploration of geologically complex scenarios (Talwani and Heirtzler, 1964; Talwani et al., 1959). A profile was selected that extended from the northern edge of the basin to the south-east, across the Goodin Fault and the Goodin Inlier and into the centre of the basin (Fig. 3), which is in a similar location to the profiles produced in Noddy (Fig. 7a). The same hypothesis is being tested: whether the dense material, possibly the Killara Formation and its intrusive components, can account for the gravitational response in this region. However, this form of forward modelling allows for more complex geometries to be tested manually.
A selection of plausible models were generated in accordance with the geological history of the region. Two main questions were asked. Firstly, how sensitive is the gravity response to the dip direction of the Goodin Fault? This was tested by changing the dip direction from the north-west to the sub-vertical and to the south-east. The dip direction of the Goodin Fault has implications for basin development, with the direction inferring which side of the fault forms the half-graben shoulder during sedimentation. Secondly, what configuration of high-density bodies are required? Two scenarios were examined. One was that the high-density bodies were assumed to be extrusive mafic lavas associated with the Killara Formation and thus with no intrusive component. The other was that multiple superposed bodies were possible, thus assuming both intrusive and extrusive modes of magmatism.
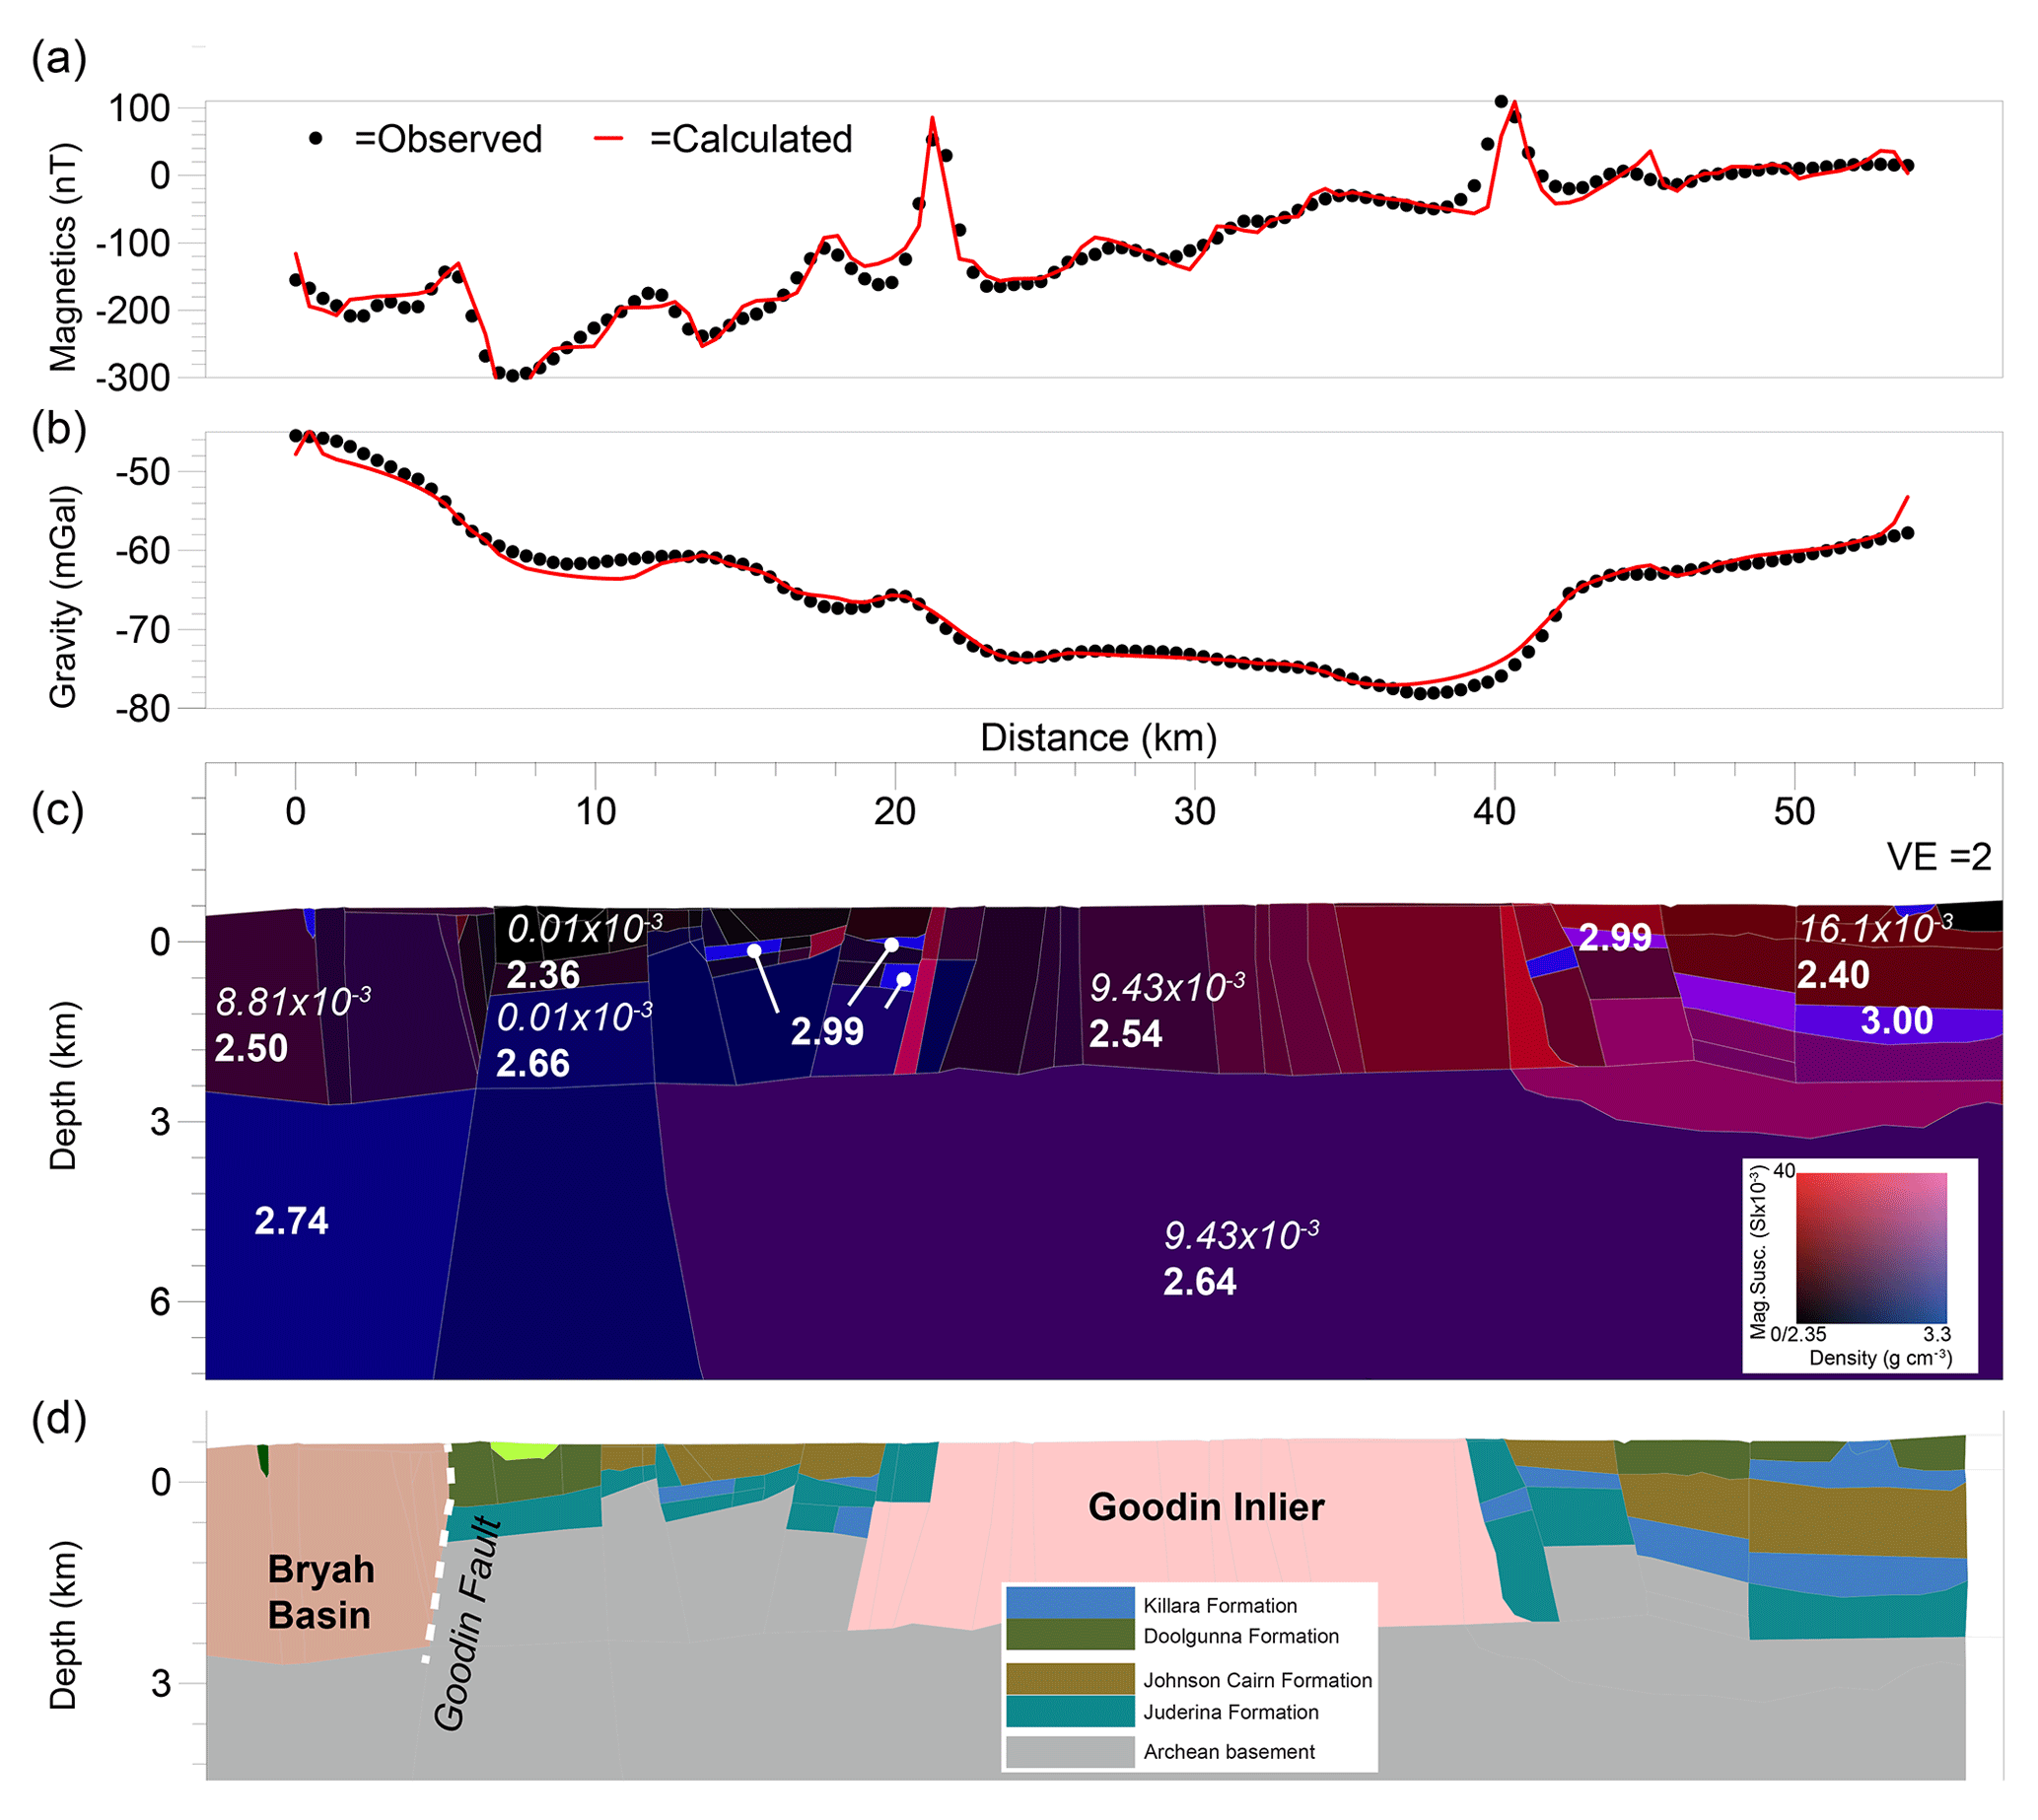
Figure 9Section-based forward modelling of the Yerrida Basin and Goodin Inlier (location of profile shown in Fig. 2). (a) and (b) show the degree of fit between the observed (points) and calculated (lines) geophysical responses for magnetic (a) and gravity (b) data. The middle panel (c) shows the petrophysical model that was used to model the calculated geophysical response. Indicative petrophysical values are shown (bold – density, g cm−3; italics – susceptibility, SI) to help guide the visualization of the colour scale shown on the right. The bottom panel (d) shows the geological interpretation made from the petrophysical model. Boundaries shown on the surface of the model are sourced from field observations and interpretations (see Table A1).
Five scenarios were generated from these assumptions. Figure 9 shows the model that is most consistent with the geological interpretation (Fig. 6), geological observation (Table A1) and the potential field geophysical data (Fig. 3). Figure 9a and b show both the magnetic and gravity (respectively) observed responses (dots) and calculated responses (lines). The calculated response is produced from the petrophysical model (Fig. 9c), where petrophysical values are assigned according to values measured from the field. The geological section was constructed using geological observations taken from GSWA maps and WAROX (Appendix 1) and interpreted using the petrophysical model so that existing structural relationships are maintained and general geological reasoning is not violated.
The model fits well with both the magnetic and gravity data. Geological interpretation (Fig. 9d) of the petrophysical model (Fig. 9c) shows that the Killara Formation can be modelled as a set of faulted sills and is broadly consistent with the conceptual modelling results shown in the previous section. Importantly, the 2D section forward modelling shows that these sills need only be 1000 m thick. The combination of modelling results supports the hypothesis that the Killara Formation may be the source of the moderately high gravity anomaly throughout the Yerrida Basin. This interpretation of sills and intrusions is thus still consistent with that of Pirajno and Adamides (2000) and their thickness estimates.
At the north-western end of the section (left-hand side of Fig. 9d), the boundary between the Yerrida Basin rocks (Doolgunna and Juderina formations) and the Bryah Basin rocks (Karalundi Formation) has a distinctive signature, especially in the magnetic data (Fig. 9a). The geological model shows a very steep dip to the north-west (or left-hand side of the section) and a possible downward throw as indicated by the footwall Yilgarn Craton modelled on the Yerrida Basin side of the boundary. The Goodin Fault has been suggested to be at this location, and this model shows it to be a normal, north-west dipping fault consistent with the interpretation of Occhipinti et al. (2017). This is in contrast to the north-west dipping thrust structure reported by Pirajno and Adamides (2000). The analysis presented here is certainly not conclusive, and the presence of the Goodin Fault is still under question as are its characteristics.
4.6 3D model
The hypothesis that mafic rocks attributed to the Killara Formation are the causative source of the gravity anomaly throughout the basin now appears plausible. Hypothesis testing on simple models and on a section through part of the Goodin Inlier provides some support, but whether this relationship is consistent for the entire basin also needs to be tested. Modelling was expanded to include the entire basin in 3D to achieve these aims.
A 3D model was constructed using GeoModeller, an implicit modelling platform that allows models to be constrained by known stratigraphy, fault relationships and geological observations (Calcagno et al., 2008). GeoModeller also offers geophysical modelling tools, including forward modelling and inversion (Guillen et al., 2008), which operate directly on the 3D geological model.
Data input to the model was gathered from the stratigraphy (Fig. 2) and structural interpretation (Figs. 6a, 9d). However, only the larger faults were retained for 3D modelling as the smaller, more insignificant faults degrade the performance of the modelling engine without providing a commensurate increase in geological understanding to this study. Each geological unit constructed in the 3D model has petrophysical values (Figs. 4, 5) assigned to allow a forward response to be calculated.
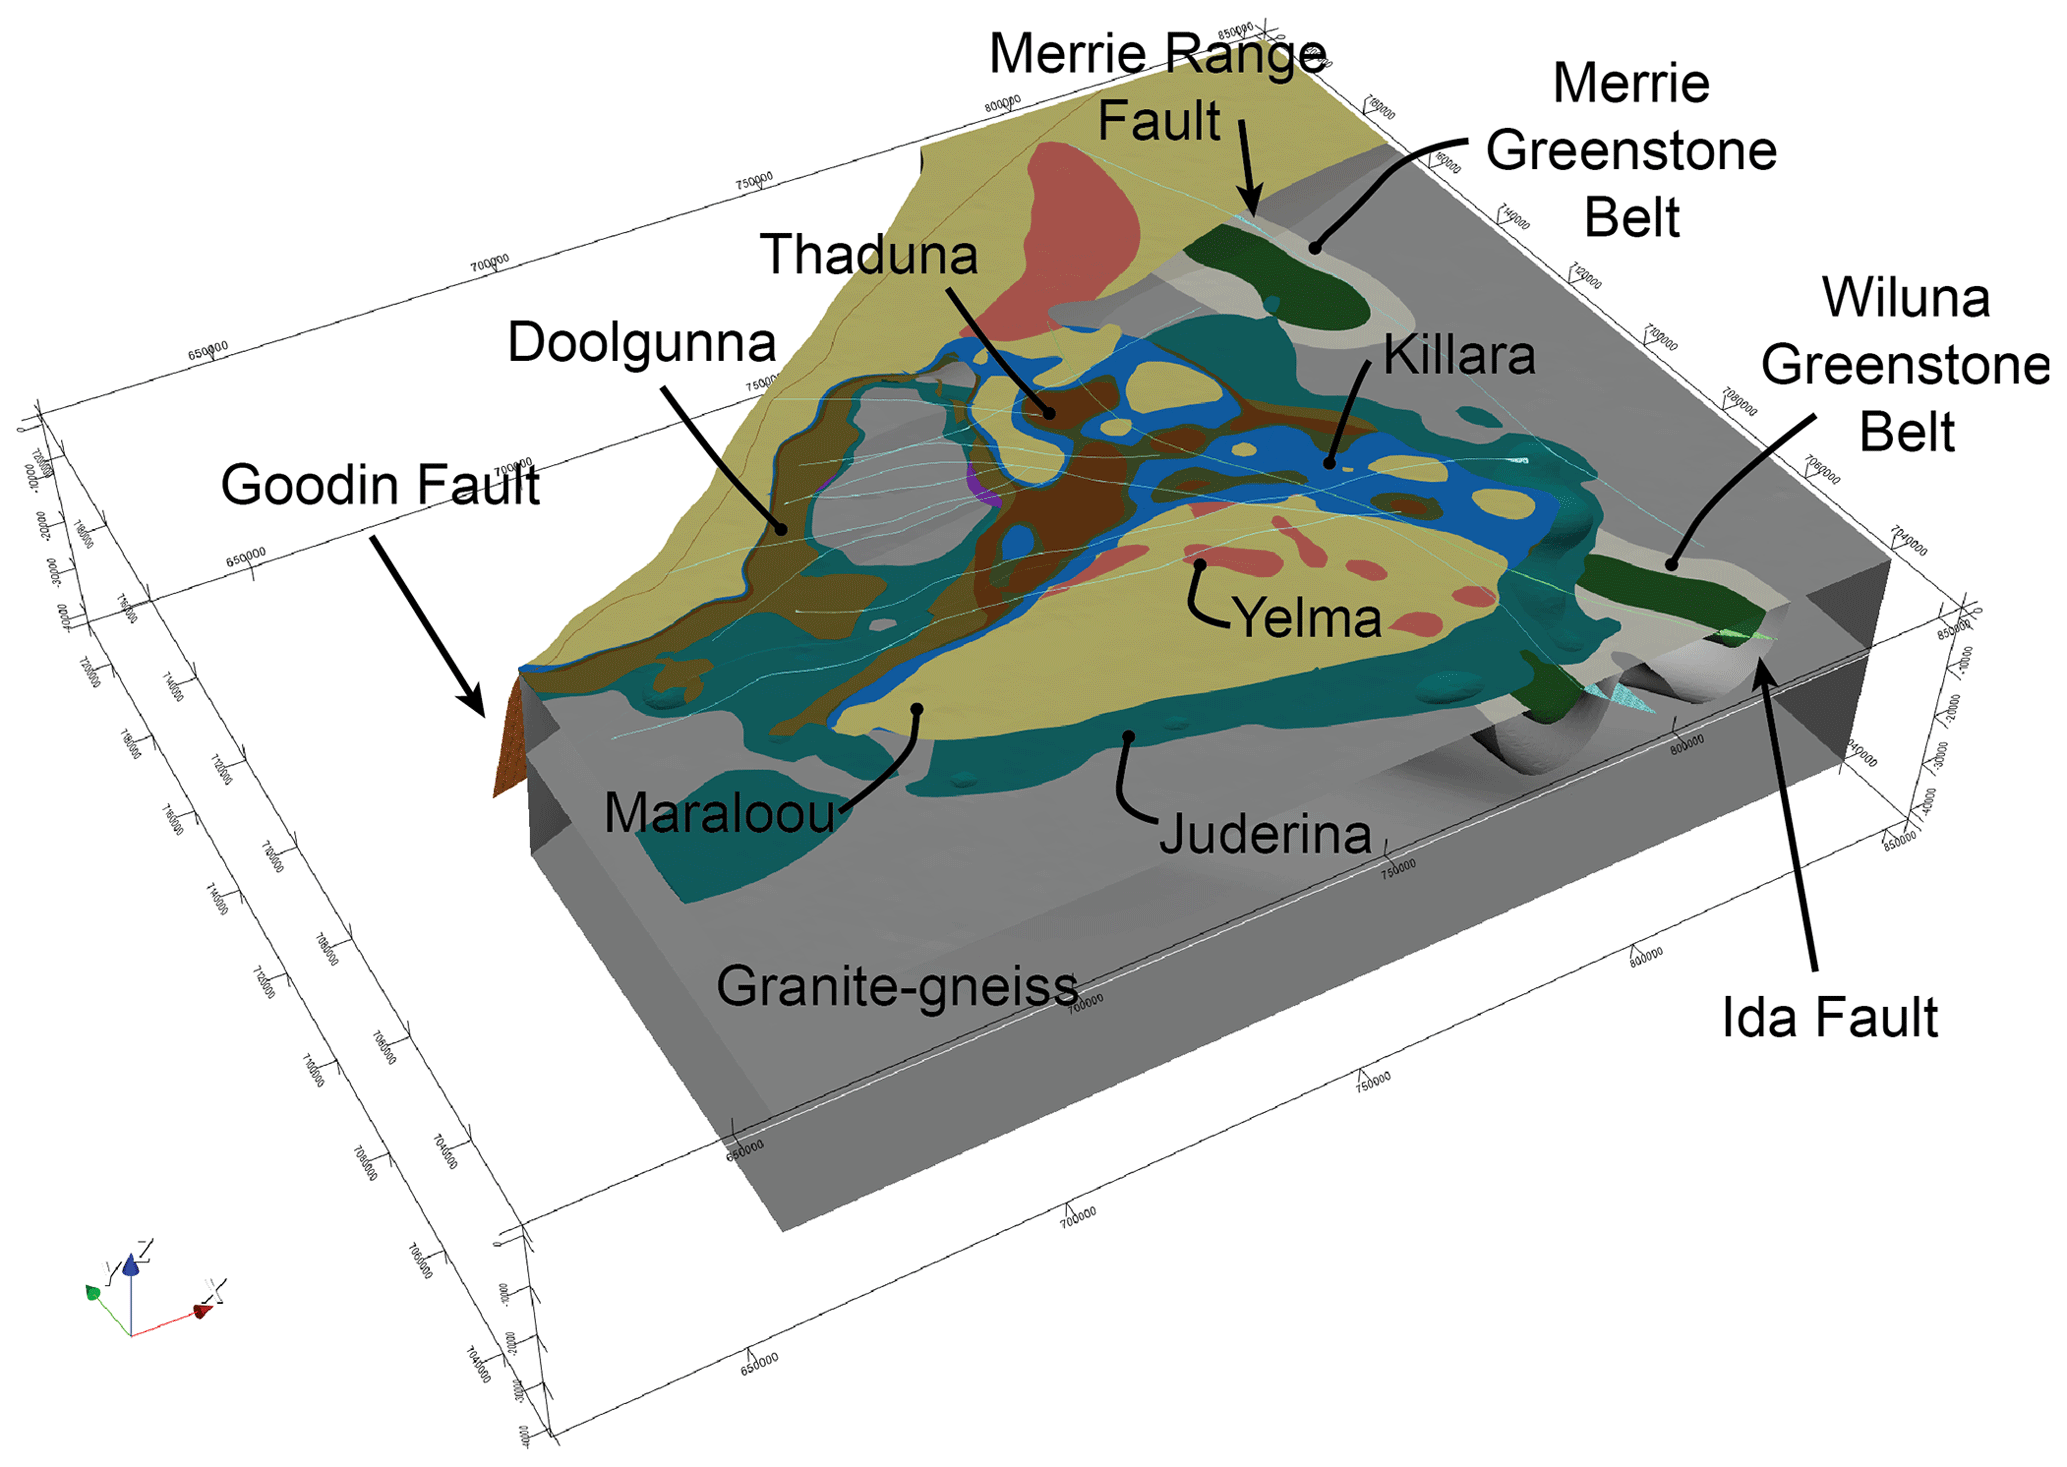
Figure 103D model constructed to constrain geophysical inversion (oblique view from SW). Check marks on the x axis are at 50 km intervals, y axis at 20 km intervals and z axis at 10 km.
The 3D model contains what were considered important components to produce a representative geophysical response: the Goodin Inlier; Archean basement; Yerrida Basin sedimentary and magmatic rocks; the Wiluna and Merrie greenstone belts; and various faults, including the north-north-westward extension of the Ida Fault (Fig. 10).
The Bryah–Padbury Basin, located in the north-western corner of the model, is not included in the model. This region is complex both geologically and geophysically in its own right, deserving of a dedicated study, and thus not the focus of this work. Likewise, the structure of the surrounding Archean greenstones is complex and is addressed by Giraud et al. (2019, 2020) in a comprehensive analysis using sophisticated inversion techniques constrained by uncertainty estimation.
4.7 3D forward modelling and inversion
3D forward modelling was performed to investigate the density structure of the Yerrida Basin. Initial attempts at modelling the gravity response produced similar results to those shown in the conceptual stage (Fig. 8b and b). Including the Killara Formation as a thin unit showed that this had almost no effect in producing the necessary gravitational anomaly (Fig. 8b). Learning from this result guided the construction of the 3D geological model to include a more substantial component to the Killara Formation. The modelled intrusive bodies were thick (= > 1000 m) and extensive but were still not sufficient to replicate the observed signal. Evidentally an additional source of high-density material needed to be considered.
4.8 Juderina Formation and a substantial mafic component
Drill cores from a range of diamond-drilled boreholes (THD1, DGDD347, DGDD020, DGDD278, DGDD279, DGDD281, DGDD319, DGDD320, DGDD404, DGDD406 and THDD 226) reveal that the Juderina Formation also contains mafic sills either as finer-grained basaltic or micro-gabbroic rocks at depth. This observation is particular to the Juderina Formation and not the overlying Johnson Cairn, Thaduna, Doolgunna and Maraloou formations. Reasoning suggests that the mafic component of the Juderina Formation was intruded during or soon after the deposition of the clastic and carbonate components of the formation and was thus restricted to just this formation. Another option is that the mafic component of the Juderina Formation is related to the intrusive parts of the Killara, Karalundi and Narracoota formations; however, if this was true, formations underlying the extrusive Killara Formation component (Johnson Cairn, Thaduna and Doolgunna formations) should also contain some proportion of mafic intrusive rocks, which (to our knowledge) they do not. Thus, adding higher-density bodies proximal to or within the Juderina Formation is a reasonable means to reproduce the anomalous gravity signature.
Geophysical inversion provides a means to test the hypothesis that higher-density rocks can explain the anomalous density signature. An incremental approach was taken, similar to that with the simplified conceptual models (Fig. 8), to ensure that multiple scenarios were considered while simultaneously performing sensitivity analyses. The following scenarios were tested.
-
Scenario 1. No additional high-density intrusions are modelled; only the modelled Killara Formation rocks are high density (> 3.0 g cm−3).
-
Scenario 2. There is a moderate increase in the volume of high-density intrusions in locations suggested by the section-based forward model (Fig. 9).
-
Scenario 3. There is a large increase in the volume of high-density intrusions, as guided by Scenario 2 and the location of high-density anomalies in the observed gravity data (Fig. 3b).
Inversion was conducted by discretizing the geological model into cells of (x, y and depth axes, respectively). The maximum number of iterations was set to 1 million, but convergence was reached before this limit was exceeded. The success of the inversion was judged on global statistics (root mean square – RMS – misfit) and locally by investigating how inversion produced the necessary density structure to reproduce the observed gravity field at specific locations.
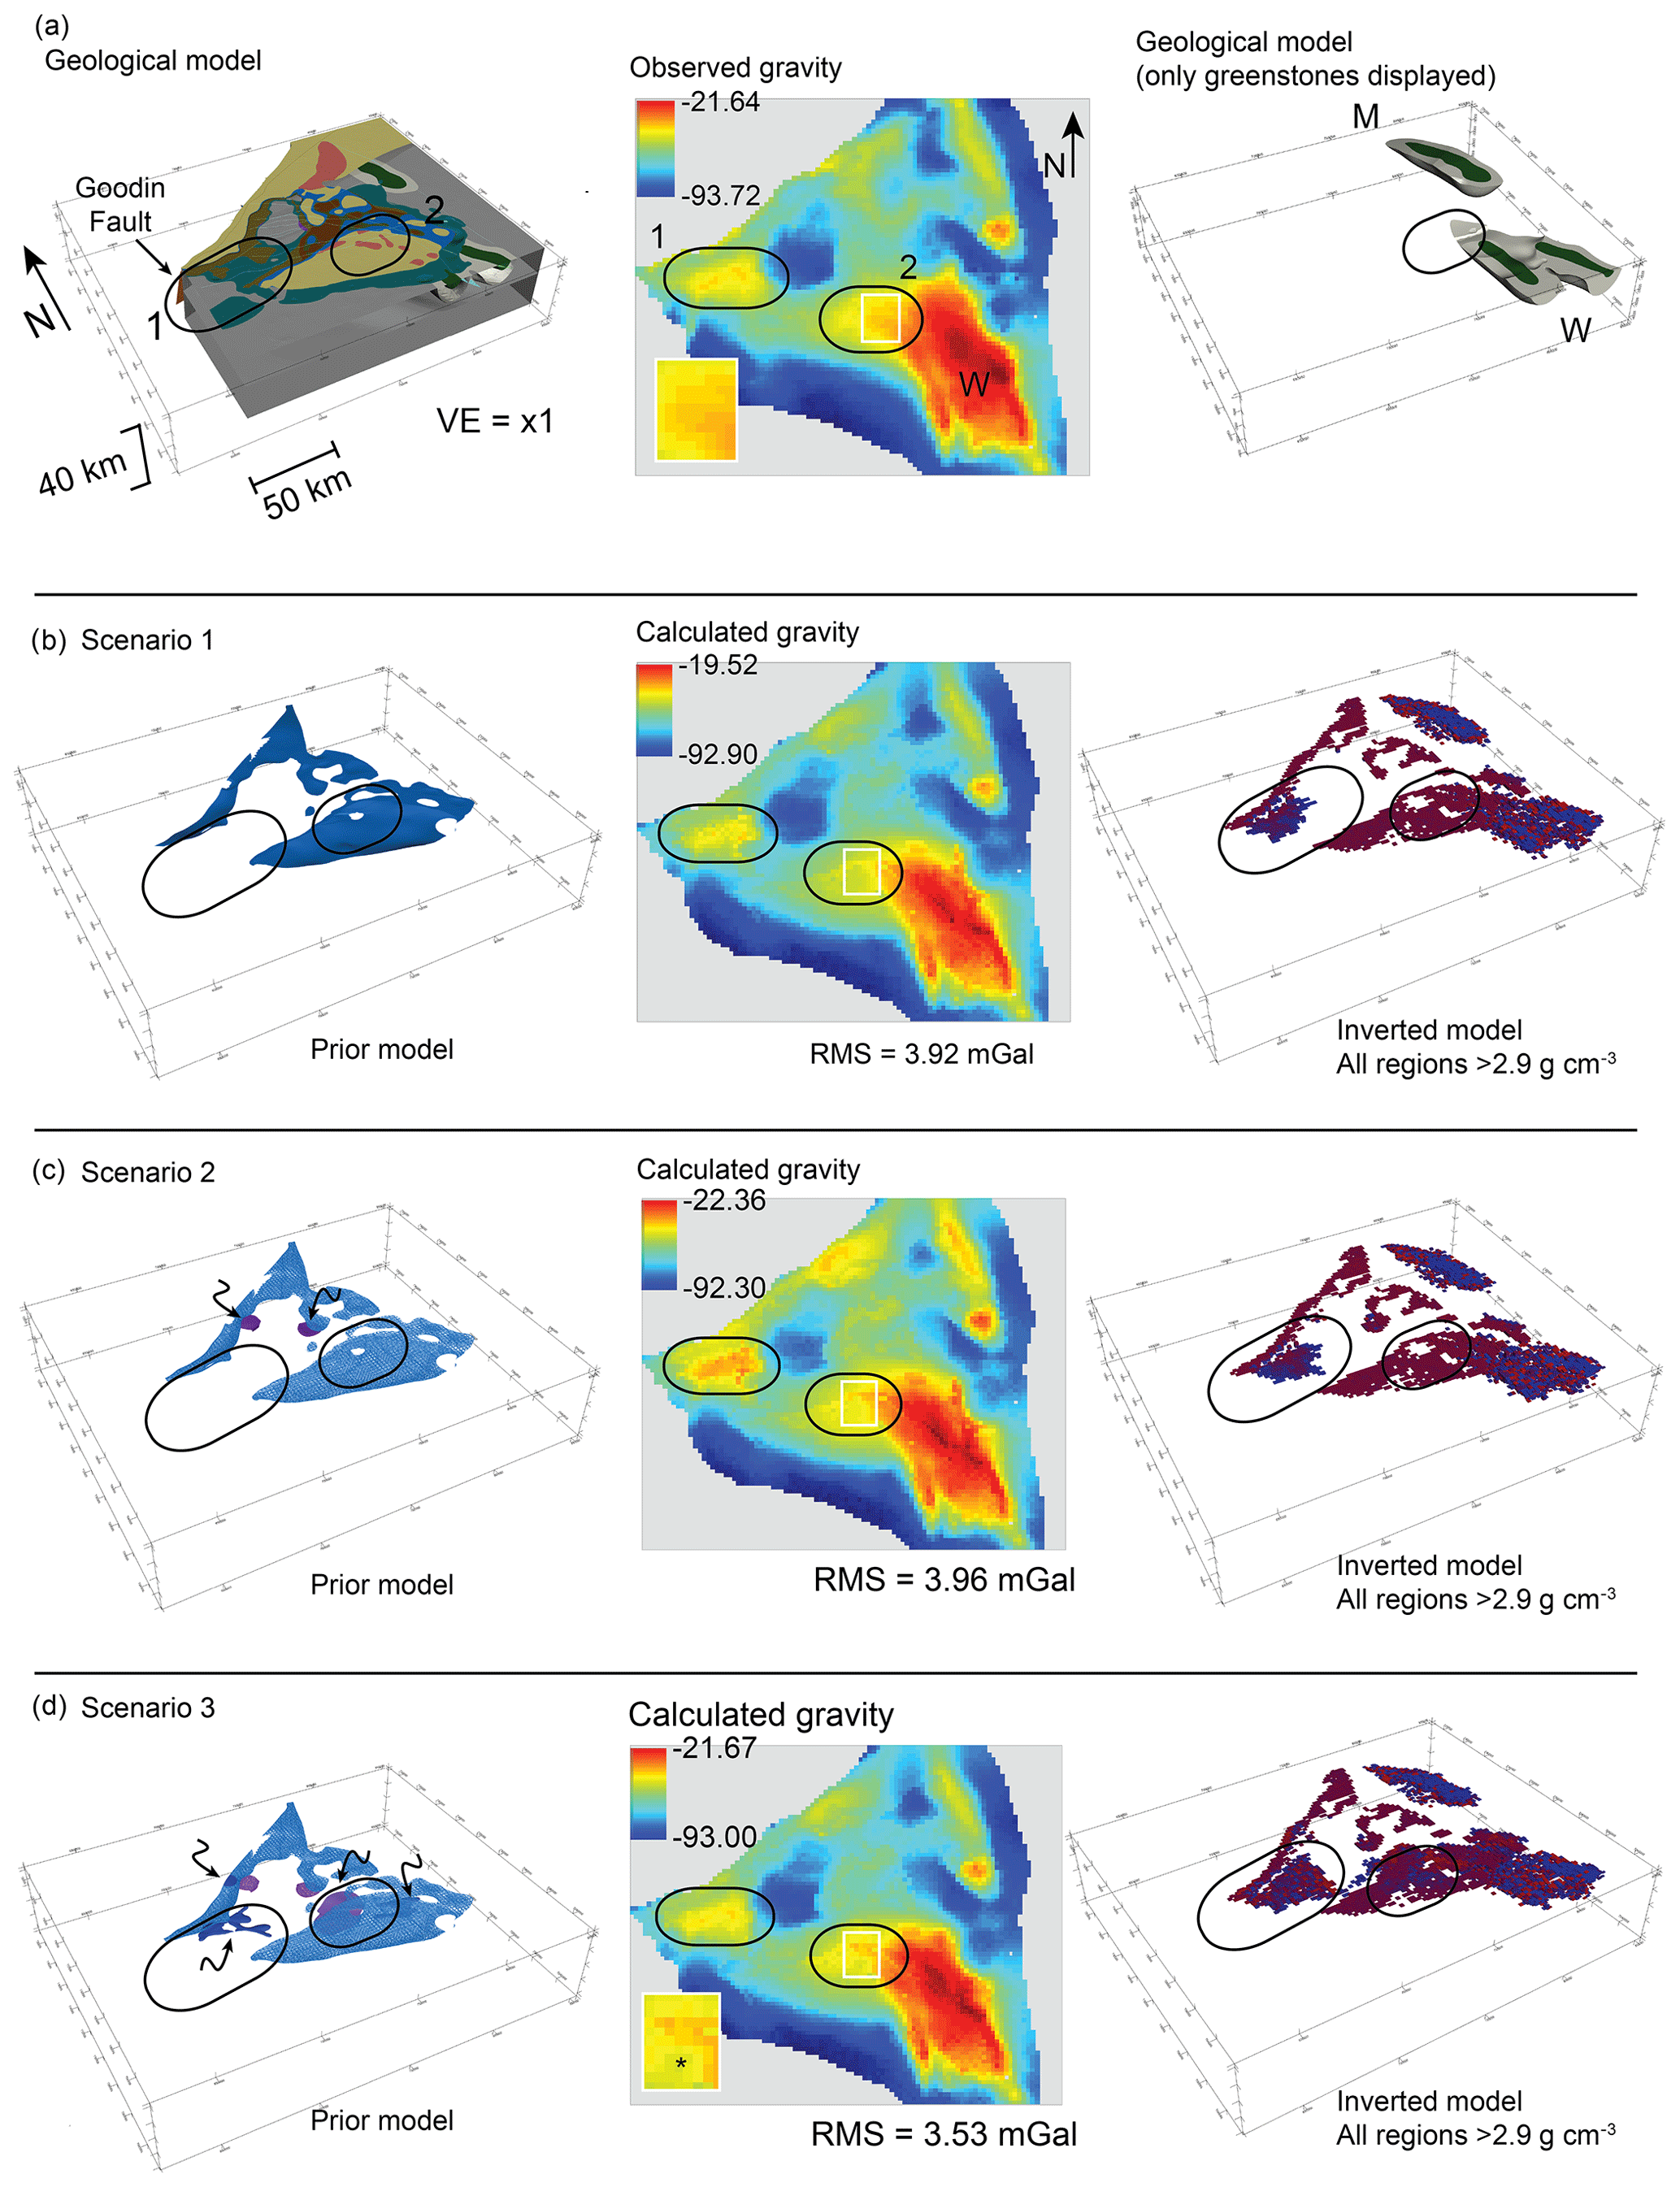
Figure 11Geological models and mafic intrusive scenarios subjected to inversion modelling. (a) 3D geological model (left), observed gravity response (centre) and location of greenstone belts (right). (b–d) Results from scenarios 1 to 3, respectively: (left) position of mafic intrusions, calculated gravity response from inversion (centre) and distribution of locations determined by the inversion to be > 2.9 g cm−3 (right). Scenarios 2 and 3 incrementally introduce mafic bodies to the prior model (c and d, left-hand panes) as indicated by the arrows. Colours in the gravity response indicate low (blue), moderate (yellow) and high (red).
Each inversion was executed to allow the contacts of the Juderina Formation, intrusive bodies and the Archean greenstone units to move if required by the inversion. All other units remained fixed, and their contacts were unable to move. Regions hosting high-density rock bodies were added to the model in plausible locations according to where the gravity response is stronger (e.g. Fig. 11c and d). These constraints reflect our knowledge of which rock units contain high-density rocks and whether changing the geometry or petrophysical properties of these particular rocks can explain the density structure of the Yerrida Basin.
All scenarios were modelled via inversion successfully. There was an RMS misfit of approximately 4 mGal from an initial misfit of over 20 mGal, with the final misfit values (Fig. 11) and convergence curves being almost identical. While a successful inversion and the corresponding reduction of the RMS misfit by 80 % are satisfactory, the almost identical convergence curves and final RMS values alone are inadequate indicators of geological plausibility. Deeper geological analysis of the resulting model is needed. Figure 11a shows the geological model on the left, the observed gravity data in the centre and the prior model extents of the Wiluna and Merrie greenstone belts (W and M, respectively) on the right. The left-hand panes of Fig. 11b–d show the prior geological model used for input (scenarios 1, 2 and 3, respectively). Only the included mafic intrusions are displayed for easier visualization. The centre panes of Fig. 11b–d show the gravity response calculated from the inverted model. The right-hand panes of Fig. 11b–d show the 3D inverted model filtered to only display cells with a minimum density threshold of 2.9 g cm−3. This density value was chosen so that only high-density – and thus most likely only mafic – rocks are visible over those that may be dolomitized (Telford et al., 1990). Consideration of dolomitization as an additional high-density material is presented in the discussion.
The centre panes of Fig. 11 have circles that indicate two locations that were investigated in more detail: Region 1 in the west and Region 2 in the centre of the Yerrida Basin.
Region 1. The observed gravity data show a high-magnitude anomaly in Region 1. The right-hand panes in Fig. 11b–d show that the inversion requires dense material > 2.9 g cm−3 to be placed in the circled locations to account for the anomaly in the observed data (Fig. 11a, centre pane). Scenarios 1 and 2 do not have mafic bodies modelled in this location (see left-hand panes) so the model requires rocks within the Juderina Formation with densities > 2.9 g cm−3 to better reproduce the observed response. Subsequently, Scenario 3 includes a mafic body in this location, possibly also hosted by the Juderina Formation (Fig. 11d, left pane), and the inversion includes higher-density material in this location as well but more laterally extensive than in scenarios 1 and 2.
Region 2. The observed gravity data show a higher-magnitude gravity anomaly in this location (Fig. 11a, centre pane). To the east, the deeper presence of the northern extension of the mafic component of the Wiluna Greenstone Belt (WGB) is interpreted as being the causative body of the higher-magnitude gravity response (W; Fig. 11a, centre pane). The western edge of this region also displays a high-magnitude anomaly, though of lesser magnitude than the WGB (Fig. 11a–d, white box). Scenarios 1 and 2 show that this part of the model is not adequately resolved through inversion. Scenario 3 shows some improvement in the region outlined by the white box, though not enough to explain the southerly portion of the anomaly. A zoomed comparison is shown in the inset of the centre pane of Fig. 11a (observed field) and Fig. 11d (inverted model calculated gravity response). An asterisk in Fig. 11d (centre pane) indicates where additional higher-density material is needed for a better fit to the observed field.
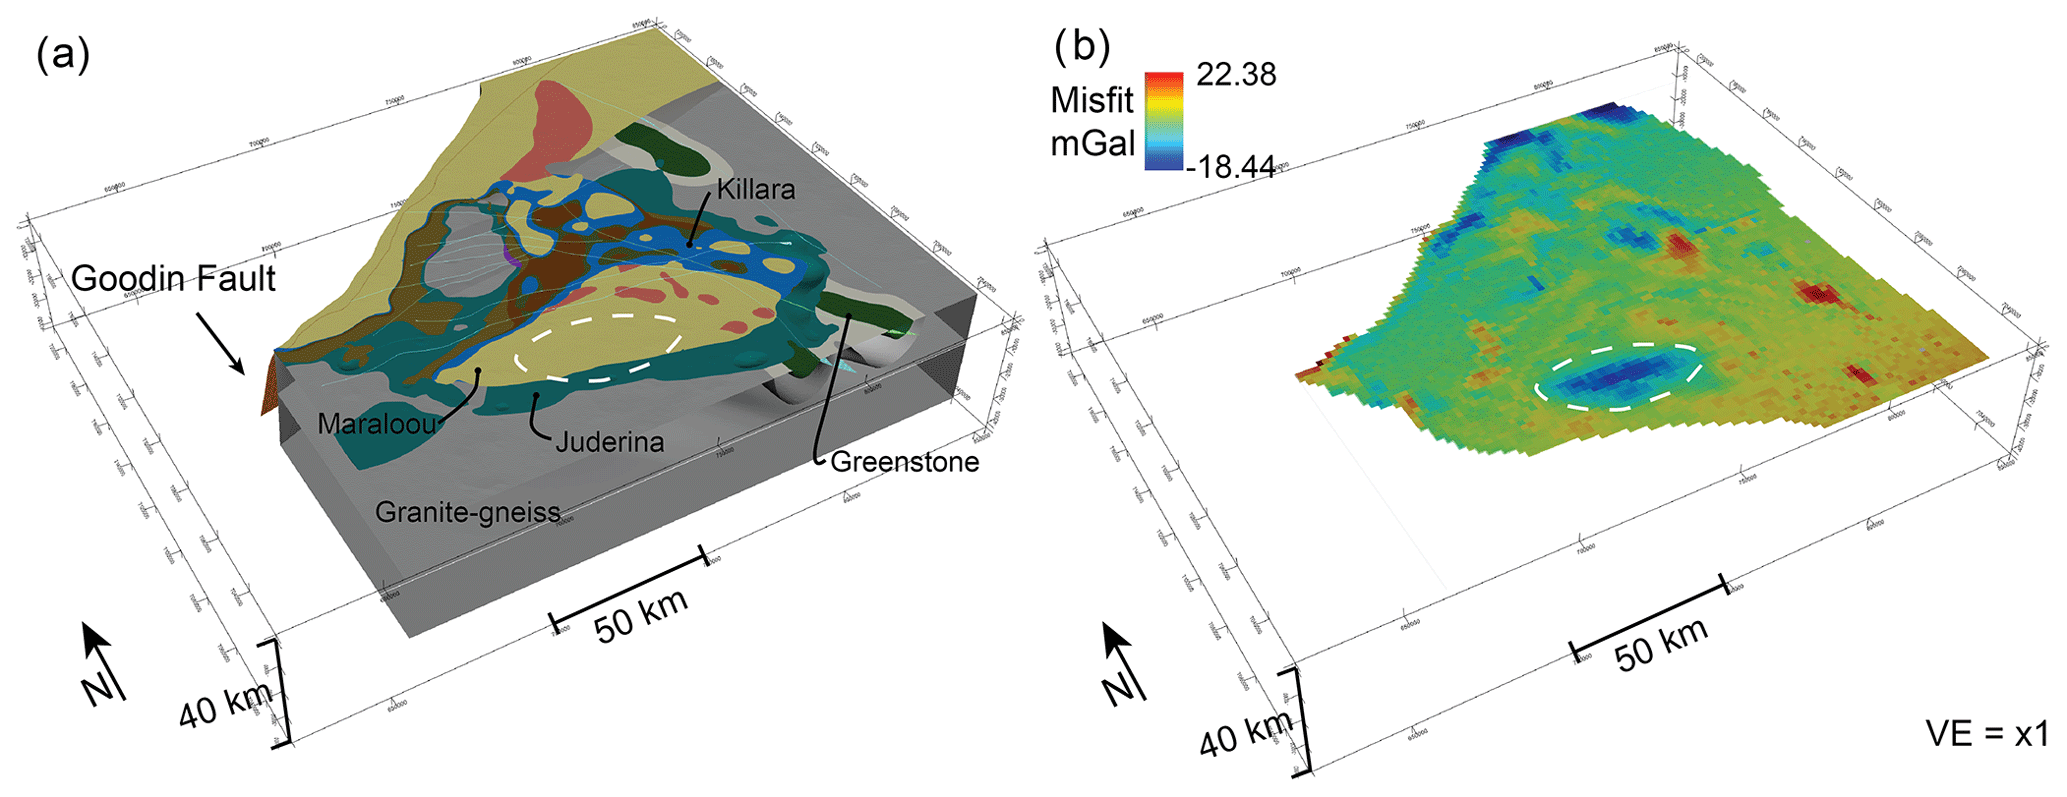
Figure 12Assessing the plausibility of the Yerrida Basin model with geological knowledge and geophysical inversion. (a) The 3D model representing Scenario 3 and (b) the remaining misfit between the inverted geological model and geophysical data. Misfit values after regional trend effects were removed using a linear solver. Red represents density which exceeds that required by observed gravity, and blue represents density lower than that required by observed gravity. Note the large region of the misfit outlined by the dashed white line that indicates the position of where a portion of high-density material needs to be added to reduce the misfit. The cause of this misfit is considered to be in response to the modelled sedimentary basin rocks being too thick and not hosting the required volume of mafic material.
Scenario 3 was judged as the basin structure that best reproduces the gravity signature of the Yerrida Basin. Of course, some issues remain with the model as shown in Fig. 12 and presented in the discussion.
The process of collating, interpreting and modelling geoscientific data leads to a greater understanding of the capabilities of the available data. The greatest amount of knowledge is typically gained by the geoscientist performing these exercises; however, whether this knowledge can then be effectively communicated so that others can benefit is challenging (Quigley et al., 2019). The discussion that follows attempts to do this by first presenting a range of outcomes that were considered useful. Some of these outcomes are not successful in the traditional sense but nonetheless are worthwhile to report, in particular which datasets were useful for different purposes, where limitations exist and what aspects of the range of modelling procedures nonetheless provided useful insight. The second part of the discussion is a synthesis of what was learned about the structure of the Yerrida Basin and the potential for mineralization.
5.1 Alternatives for higher-density material
The central aim was to determine if the characteristic density signature of the Yerrida Basin was due to extensive mafic rocks at depth or some other geological reason, such as diagenetic or near-surface alteration. Such non-magmatic processes that are plausible in the Yerrida Basin region are shown by the presence of dolomite. The dolomitization of carbonate rocks forms dolostone when calcite ions are replaced by magnesium ions. Calcite (mean density =2.71 g cm−3) is less dense than dolomite (mean density =2.84 g cm−3); thus, dolomitization is expected to increase the density of a rock. The magnitude of density increase depends on the carbonate proportion of the original rock (with lower proportions resulting in less carbonate to dolomitize and thus a smaller density increase) combined with the degree that dolomitization has occurred.
3D geophysical inversion was employed to explore both these scenarios, and the recovered density distribution leads us to what is more plausible. Region 1 required a significant increase in density when compared to the prior geological model to account for the density anomalies seen in the observed gravity data (Fig. 11b–d, centre panes). The Juderina Formation forms a significant unit in this area, both in outcrop and at depth, and is likely to contain dolomitic rocks. The carbonate portion of the Juderina Formation includes the relatively minor Bubble Well member and is not considered large enough (Occhipinti et al., 2017) to account for the gravity anomaly. In addition, the magnitude of densities required to produce the required anomaly (> 2.9 g cm−3) is higher than is realistic for dolostone, even if the rock was made entirely of dolomite. Thus, an extensive mafic component in the subsurface is a more likely source of the gravity anomaly in this location (Fig. 12a). Modelling in Region 2 (Fig. 11b–d, centre panes; Fig. 12b) also supports this reasoning with an additional large, high-density (> 2.9 g cm−3) body required to account for the observed gravity data. Here, the Juderina Formation is not as extensive as in Region 1, and the position of the recovered density anomaly implies a closer spatial association with the Killara Formation at depth (Fig. 11d).
5.2 Density distribution and geological implications
The distribution of mafic units in the Yerrida Basin was determined through geological modelling combined with petrophysically constrained gravity inversion. The distribution of these mafic units is shown in Fig. 13, along with the previously assumed extents of the mapped and interpreted Killara Formation for comparison. The Juderina Formation likely hosts the additional mafic units. We acknowledge that other formations may also host mafic rocks; however, the observations to support this hypothesis have not been made. Figure 13 also displays regions 1 and 2 from Fig. 11 and two new regions: Region 3, defined by the misfit area (Fig. 12b), and Region 4, which will be discussed later in this section. The grey regions indicate our current knowledge of the extent of the Killara Formation as shown in GSWA maps and geophysical interpretation and can be assumed to only represent outcrop or near-surface (< 50 m depth below the surface) rocks. The coloured cells are outputs from the final inversion voxet and represent the predicted extents of mafic material at the surface and at depth. Cell colour indicates different high-density bodies added incrementally to the prior geological model in scenarios 2 and 3 and have no other significance. The plan view shows a significant increase in the extent of mafic material from our current understanding. Region 4 is an extensive body of mafic material trending to the north-east modelled as the Killara Formation.
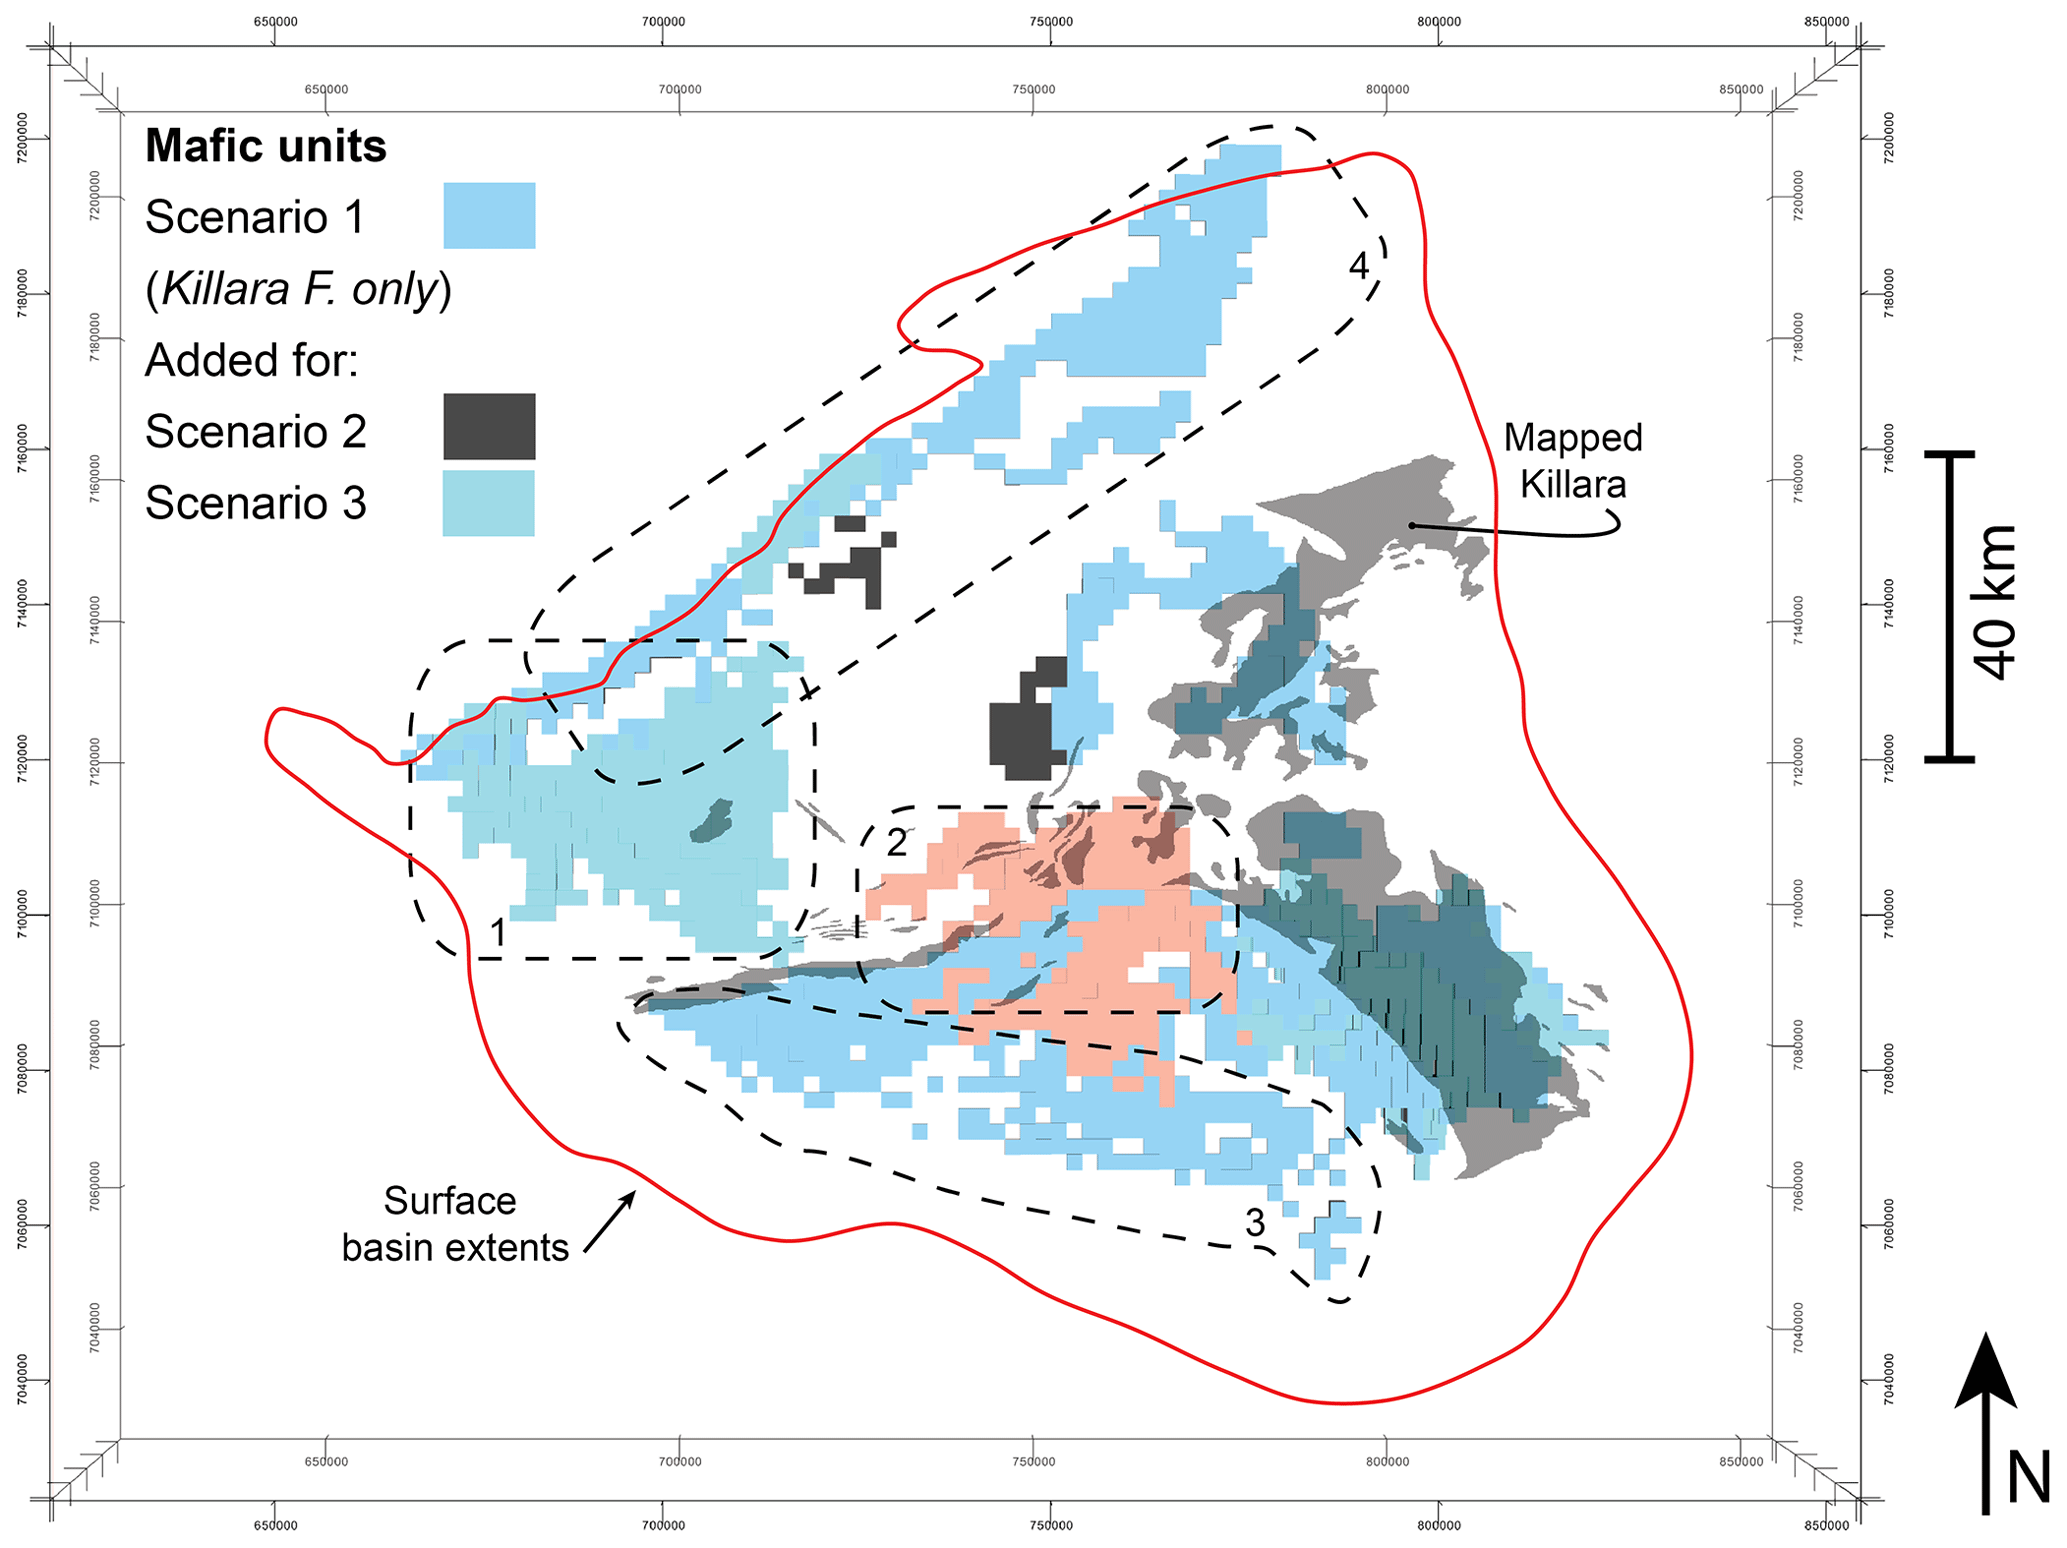
Figure 13Comparison of mafic units at depth with mapped Killara Formation. Mafic units are colour coded to help differentiate bodies added during scenarios 2 and 3. Check marks on the x axis are at 50 km intervals, y axis at 20 km intervals, and z axis at 10 km.
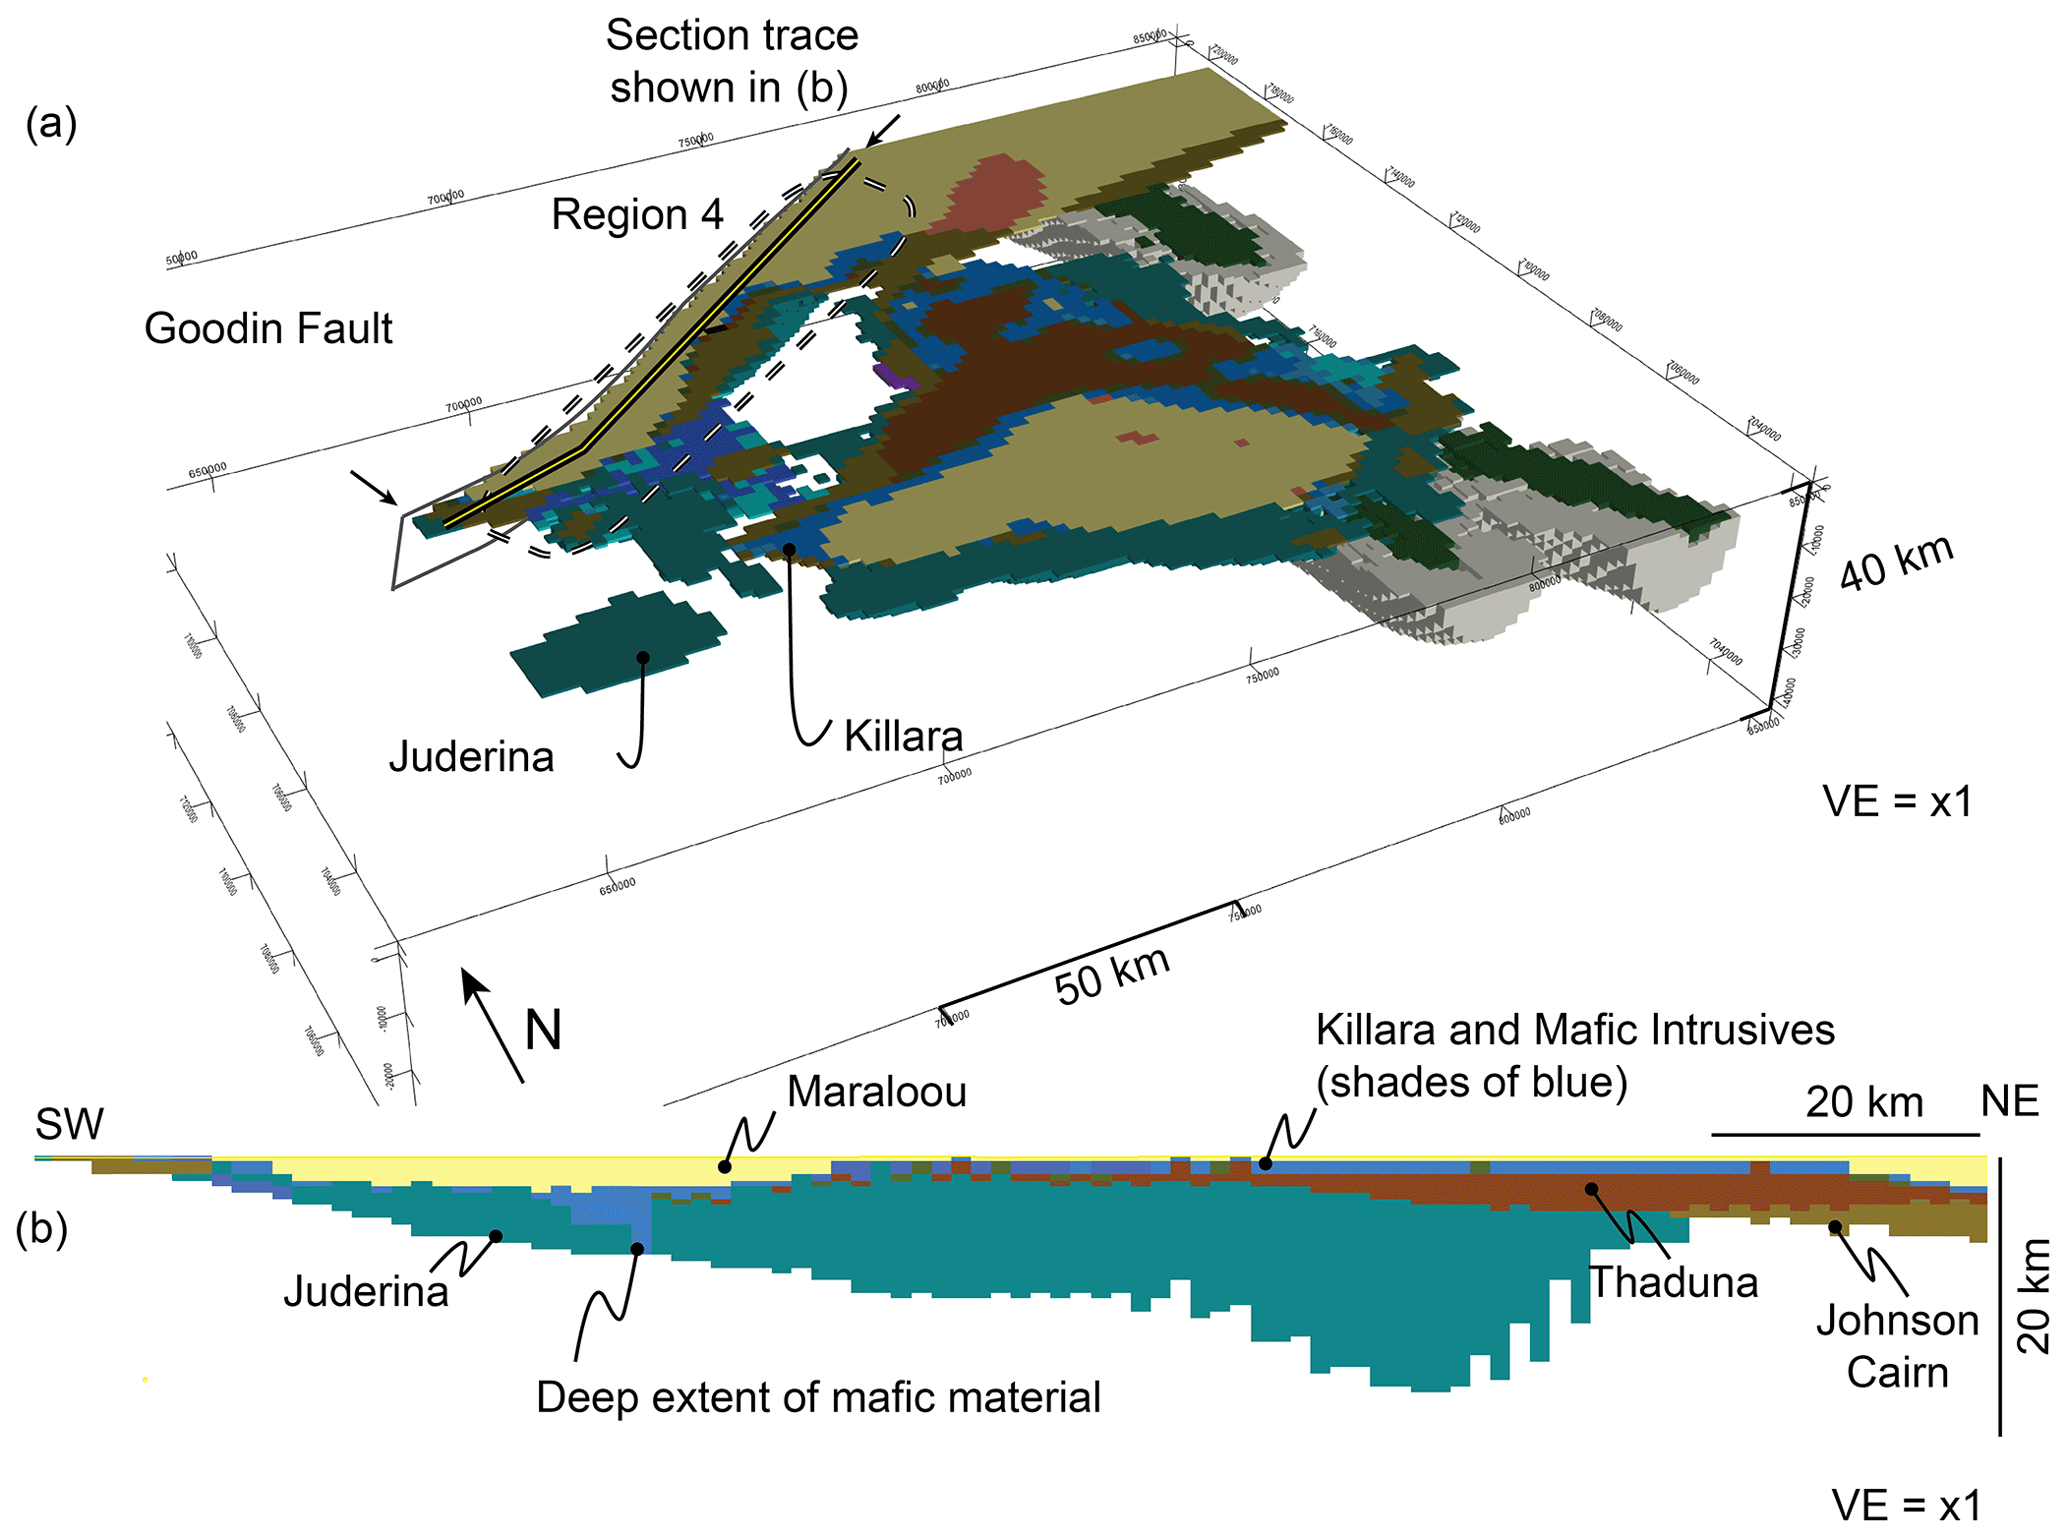
Figure 143D model and distribution of high-density (> 2.9 g cm−3) mafic material around Region 4. (a) Isometric view of the inverted model from above and the south-west. The dashed line indicates Region 4, and the solid yellow and black line shows the location of the section. (b) Section view of Region 4 viewed from the south-east displaying the depth of the Juderina Formation and the deep extent of mafic material near the north-west extent of the Yerrida Basin.
Figure 14a displays the inverted model of the Yerrida Basin viewed from the south-west with only basin rocks and Archean greenstones displayed for ease of visualization. Of note is the depth extent of both the Juderina Formation and mafic material in Region 4. The section view (Fig. 14b) shows the basin rocks and proposed mafic material. The mafic units are colour coded to differentiate those that were added incrementally during scenario testing. The different colours are not intended to indicate that any particular unit is unique in stratigraphic position or composition.
Most of the higher-density mafic material is located close to the surface (Fig. 14b); however, some has been determined to extend deeper in the south-west part (Fig. 14b). This interpretation is consistent with the gravity modelling and interpretation of Hackney (2004), who suggests the Yerrida Basin deepens and extends under the Bryah–Padbury Basin to the north. Here the higher-density material could be part of the Killara Formation or a substantial part of the mafic component of the Juderina Formation. Figure 14b also shows the Juderina Formation to be thick (> 10 km and up to 20 km off-section) with deeper parts to the north-east. A thickness of 20 km is implausible given the thickness estimates of Pirajno and Adamides (2000). The incorrect estimate is likely due to a combination of artefacts resulting from inversion and the presence of thick (∼7 km) and dense Narracoota Formation rocks (Pirajno et al., 1998) hosted in the hanging wall of the Goodin Fault to the north-west interfering with the reconciliation of the calculated gravity response to the observed gravity response. Nonetheless, it indicates that a thicker portion of the Yerrida Basin probably exists here, and it is just that the thickness is difficult to determine geophysically without guidance in the form of detailed sedimentological analysis.
5.3 Distinguishing mafic rocks using chemical composition
Geophysical inversion has been useful in revising the extent of mafic rocks in the Yerrida Basin. What geophysics cannot do with our current dataset is determine whether the interpreted mafic rocks all belong to the Killara Formation or whether the mafic rocks have different compositions and thus reveal a more complex stratigraphy. The major and trace chemical composition of whole rock samples has been obtained from drill core (THD001, DGDD347 and the GSWA WACHEM geochemistry database), surface samples (University of Western Australia field work and WACHEM) with analysis and compilation by Olierook et al. (2018) to help us achieve this aim.
DGDD347 is close to the northern boundary of the Yerrida Basin (Fig. 1) and samples rocks from both the Bryah and Yerrida basins. Thus, we were able to use these samples to establish whether any of the mafic rocks sampled in the Juderina Formation are sills or dykes related to the Narracoota Formation. Figure 15a shows the geochemical distribution of mafic rocks sampled from the Yerrida and Bryah–Padbury basins on a basaltic Th∕Yb versus Nb∕Yb diagram (Pearce, 2014). This type of diagram is used to recognize sources of magma to provide insight into the tectonic setting that generated them, with higher Th∕Yb representing lavas modified by subduction-related processes and those with higher Nb∕Yb showing increasing levels of crustal contamination. While possible, interpreting such settings from these results is speculative, and more detailed stratigraphic and volcanological work would be required for a definitive answer. Nonetheless, the diagram proves useful in discriminating between different types of mafic rocks in the region that may have formed at different times and/or in different tectonic settings.
Samples from drill hole DGDD347 (DG) and THD001 (THD) are clustered toward the higher end of both ratios. Most of the DG and THD samples are close to, but not within, the mid-ocean ridge basalt–ocean island basalt (MORB–OIB) array. Importantly, the DG and THD samples are distinctive in their tight clustering and position with respect to the Narracoota and Killara formation samples (Olierook et al., 2018), meaning they are different geochemically and were thus likely generated in a different setting. This interpretation is supported by Fig. 15b which displays the TiO2∕Yb ratio on the y axis as a proxy for deep melting (Pearce, 2008). Here, the DG and THD samples are distinguishable from the Killara and Narracoota formations based on both the TiO2∕Yb and Nb∕Yb ratios. DG and THD can also be separated into their own classifications. The DG samples fall within the alkali classification, while the THD samples are mostly classified as tholeiitic basalts. The DG and THD samples have a deep melting signature, whereas most of the Killara and Narracoota samples have a shallow melting signature.
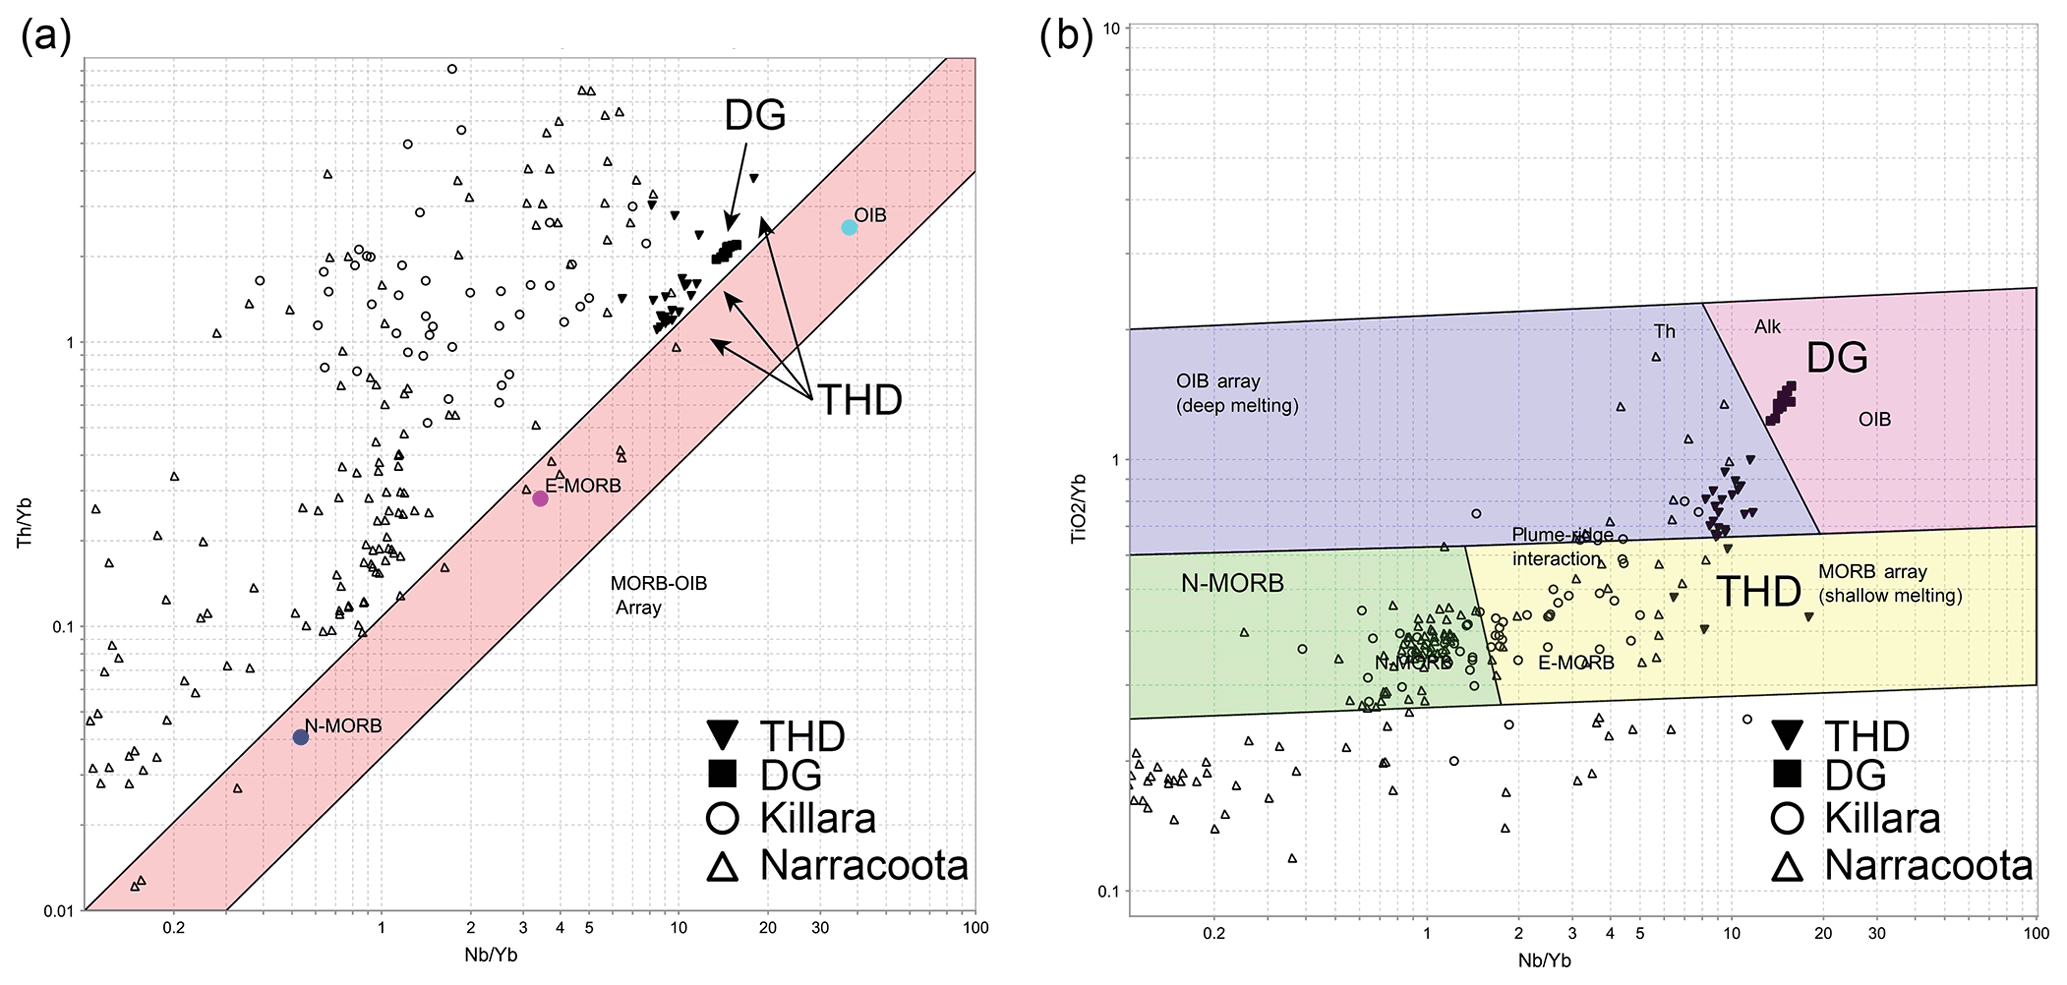
Figure 15(a) Discriminant basalt Th∕Yb versus Nb∕Yb diagram of mafic geochemistry from the Yerrida Basin and (b) discriminant Nb∕Yb and TiO2∕Yb diagram. Data compiled from Olierook et al. (2018), DGDD347, and THD 001.
The overall non-arc melting signature of Fig. 15b is similar to the interpretation of Olierook et al. (2018) that mafic magmatism in the southern Capricorn region was interpreted as being generated in an intracontinental rift setting. Our results show that the while the larger tectonic setting may not have changed, the magmatic history of the southern Capricorn is likely more protracted, complex and punctuated by periods of mafic magmatism with a changing source (Occhipinti et al., 2017, 1997; Pirajno and Occhipinti, 2000).
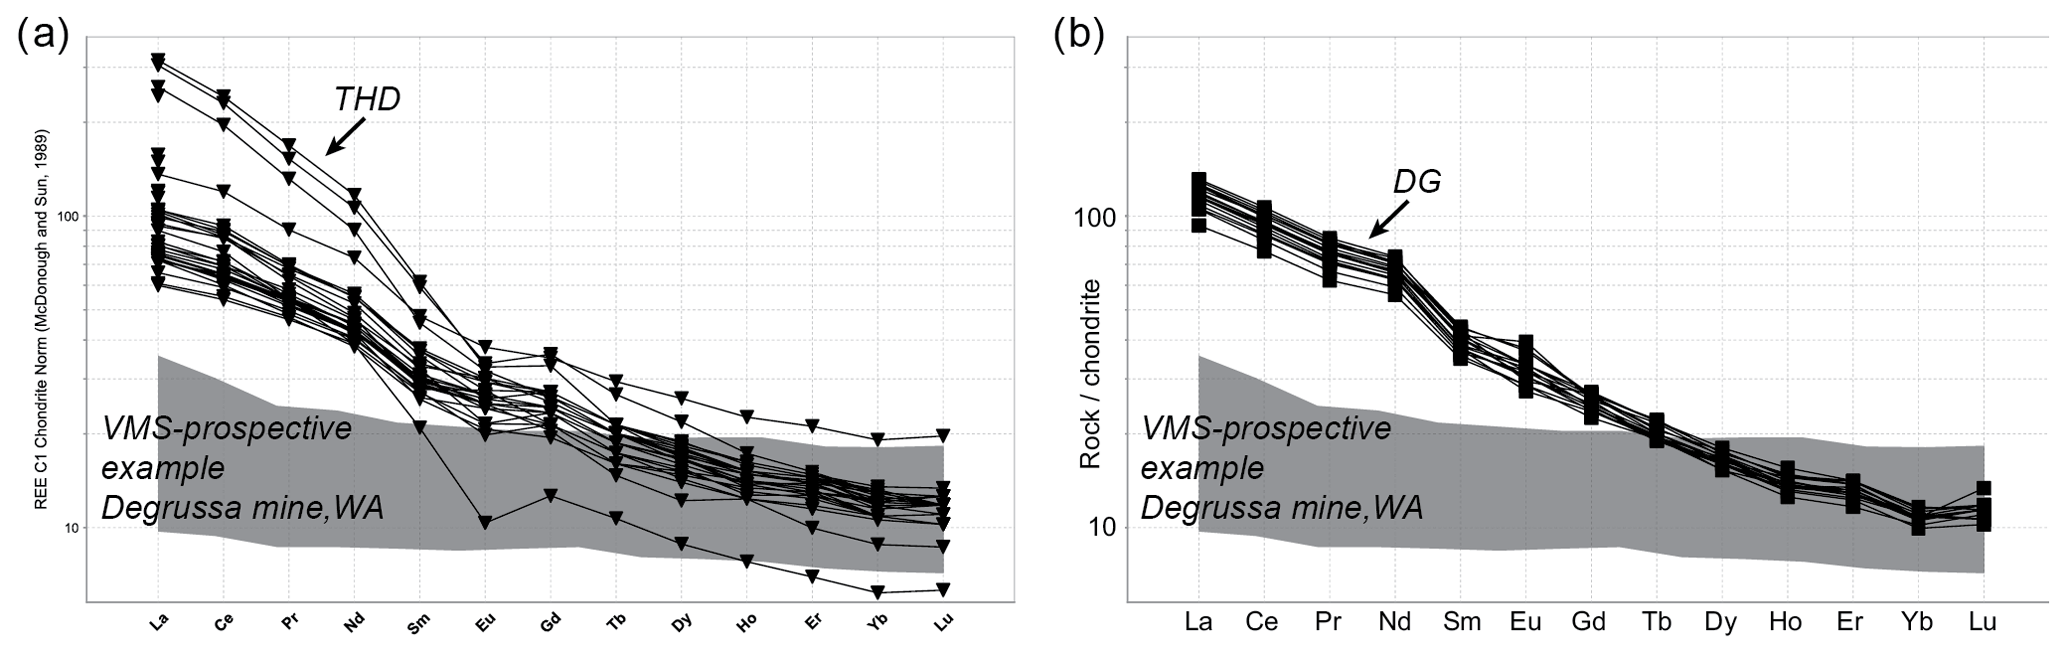
Figure 16REE spider diagrams for mafic rocks sampled from (a) THD001 and (b) DGDD347. Note that the inclined profiles for each indicated a non-prospective environment for VMS mineralization. The shaded portion indicates a VMS-prospective example taken from basaltic and micro-gabbroic rocks sampled from the Degrussa mine (Hawke, 2016).
5.4 Yerrida Basin mineralization
Geochemistry can provide insight into the prospectivity of mafic rocks for VMS mineralization. Flat REE profiles are typical for VMS prospectivity (Hawke, 2016; Hawke et al., 2015); however, both spider diagrams for THD (Fig. 16a) and DG (Fig. 16b) show inclined – and thus VMS-non-prospective – REE profiles. These observations are also made by Mueller (2011) for drill hole THD001. An example of a flat REE pattern from basaltic and micro-gabbroic rocks sampled from the Degrussa mine are shown in grey for reference (Hawke, 2016).
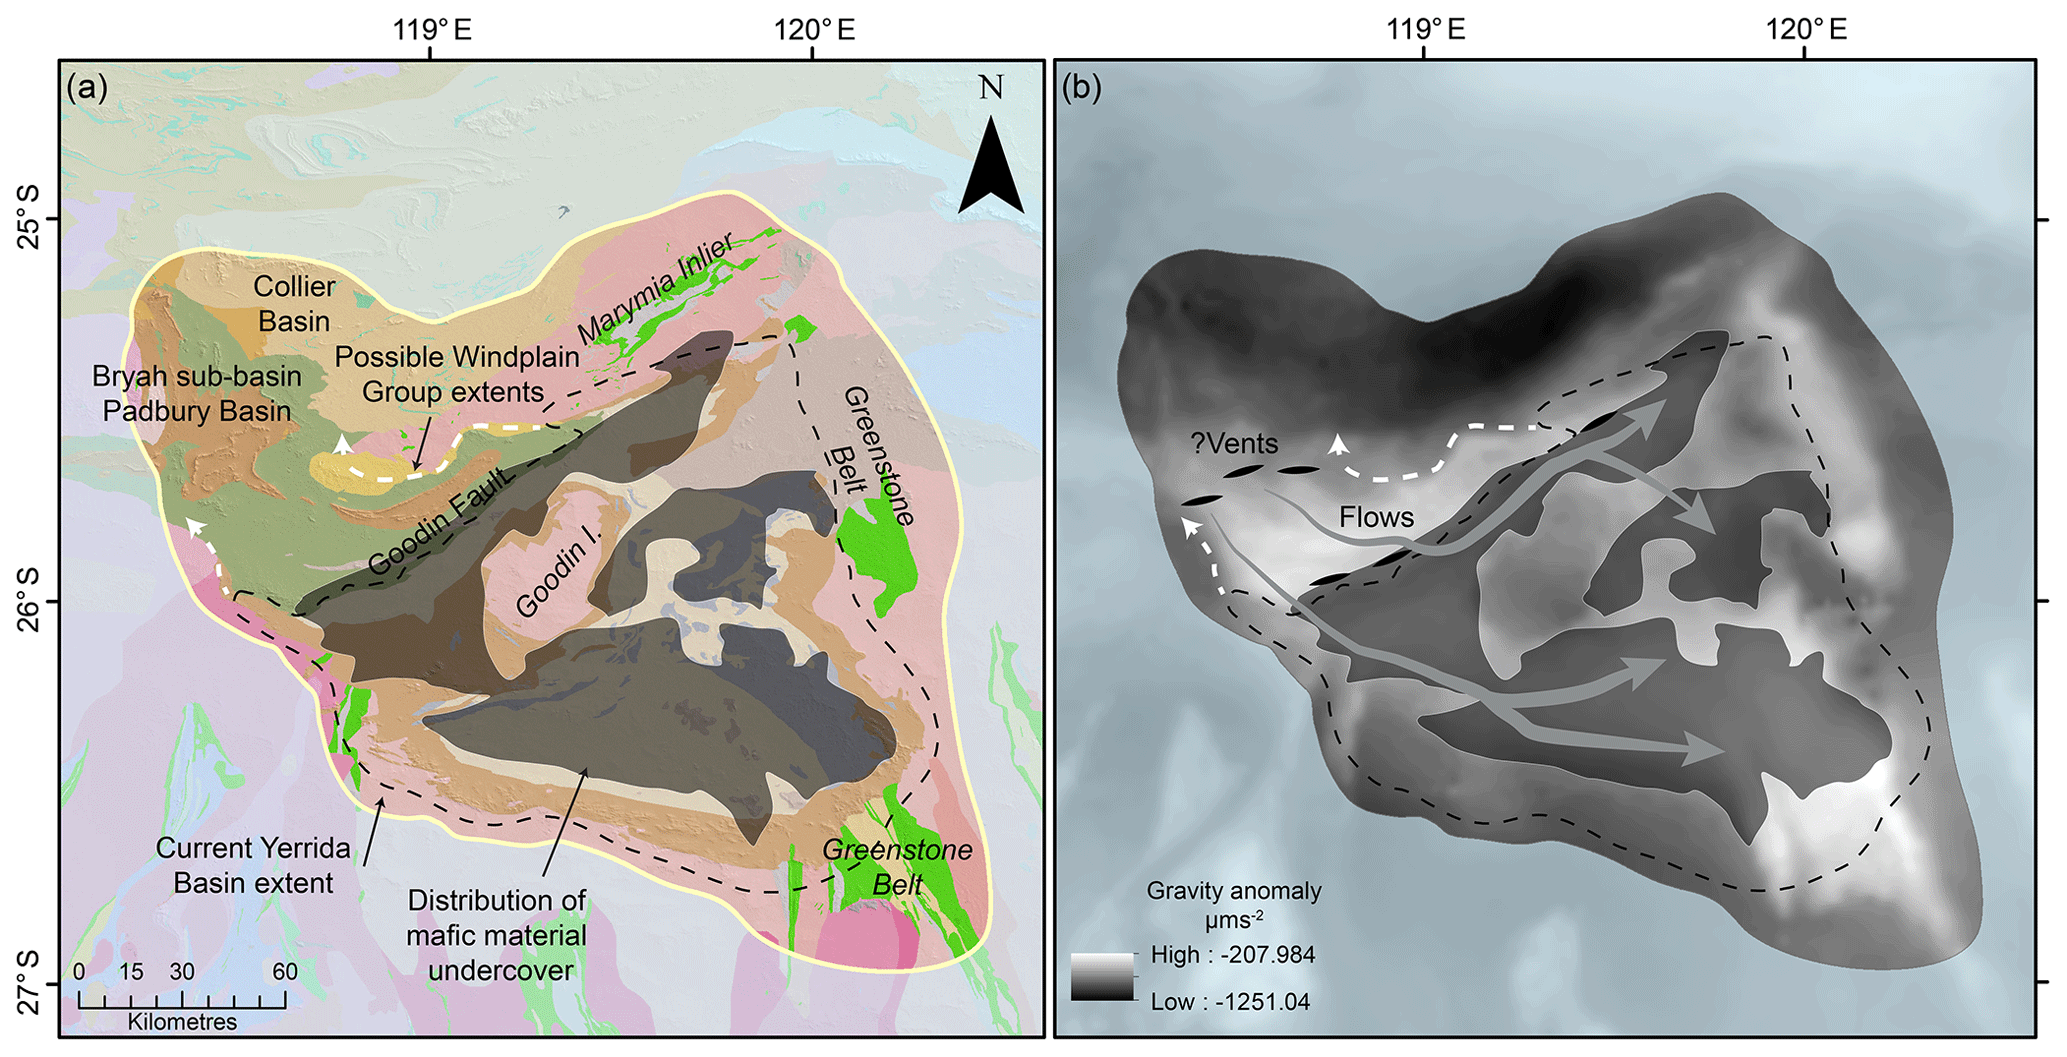
Figure 17Proposed source of magmatism for the mafic component of the Yerrida Basin. The lack of an Archean signature in the mafic rocks suggests that conduits for magmatism do not include the Yilgarn Craton rocks that underlie the Yerrida Basin, but they are likely sourced from the north-west or along the current position of the Goodin Fault. (a) Major components of the southern Capricorn region are shown with Archean regions listed in italics. Shaded regions show the position of mafic material determined via geophysical inversion. (b) Vent locations and flow or sill intrusion paths are proposed and shown over the Bouguer gravity anomaly.
5.5 Basin development
The location of the thicker mafic and sedimentary portion of the basin is juxtaposed against the Goodin Fault. The thicker part of the Yerrida Basin may then represent a deepening of the basin toward the north-west, which occurred during lithospheric extension and rifting in ca. 2200–ca. 2000 Ma (Occhipinti et al., 2017; Pirajno and Adamides, 2000; Pirajno and Occhipinti, 2000). The mafic component of rifting may have manifested in two forms. Extensive magmatism contemporaneous with the deposition of (1) the Juderina Formation or (2) the Killara Formation during the development of the Mooloogool Group.
A period of extensive mafic volcanism at ca. 2045 Ma saw mafic rocks of the Narracoota Formation intrude and overlie the Karalundi Formation in the Bryah sub-basin located to the north and north-west of our study area (Hawke et al., 2015). Occhipinti et al. (2017) suggest that the Killara and Narracoota formations are manifestations of magmatism during rifting in different basin depocentres that temporally overlap. This is supported by Pirajno and Adamides (2000), who interpret the Killara Formation as basalts extruded in a continental setting with geochemical affinities similar to the hyaloclastites of the Narracoota Formation. Gravity modelling performed and interpreted by Pirajno and Occhpinti (1995, 1998) finds that the Narracoota Formation thickens up to 7 km north-west of the Goodin Fault. If the high-density material modelled here is part of the Killara Formation, then the thickening of the mafic Narracoota Formation toward the south and the thickening of the Killara Formation toward the north-west support the suggestion of Occhipinti et al. (2017) that the current position of the Goodin Fault may represent a rift axis and volcanic vent for this period of magmatism.
Regions 1, 2 and 3 identified from the modelled high-density material are thick and may represent vent sites of the accumulation of mafic material (Fig. 11b and d). Region 1 is primarily hosted within the Juderina Formation, and the high-density region recovered from inversion may represent the mafic component of that formation. Regions 2 and 3 have been modelled to be hosted within the Mooloogool Group rocks due to the prevalence of these formations in these areas and are thus more plausibly associated with the Killara Formation. Regions 1 and 2 may represent vent sites for mafic magmatism due to the proposed relative abundance of mafic material however this hypothesis, as will be shown, is less plausible when considered with sulfur isotopic data.
Multiple sulfur isotopic analyses (LaFlamme et al., 2020, 2018) show that the non-Killara and non-Yerrida Basin mafic volcanic rocks have a slight negative Δ33S signature, typical of Palaeoproterozoic basins (Johnston et al., 2006). It suggests that these magmas have not interacted with the Archean basement during volcanism. Given the proximity of the Archean basement to these rocks, this is somewhat enigmatic and further suggests that magmas were sourced from the deeper parts of the basin. This source region is likely to the north and north-west of the Yerrida Basin, where the Archean basement (i.e. Yilgarn Craton) is likely absent, or along the Goodin Fault (Fig. 17). Yerrida Basin magmatism was likely contemporaneous with that related to the Narracoota Formation (Pirajno and Occhipinti, 2000) albeit via different vents (Occhipinti et al., 2017).
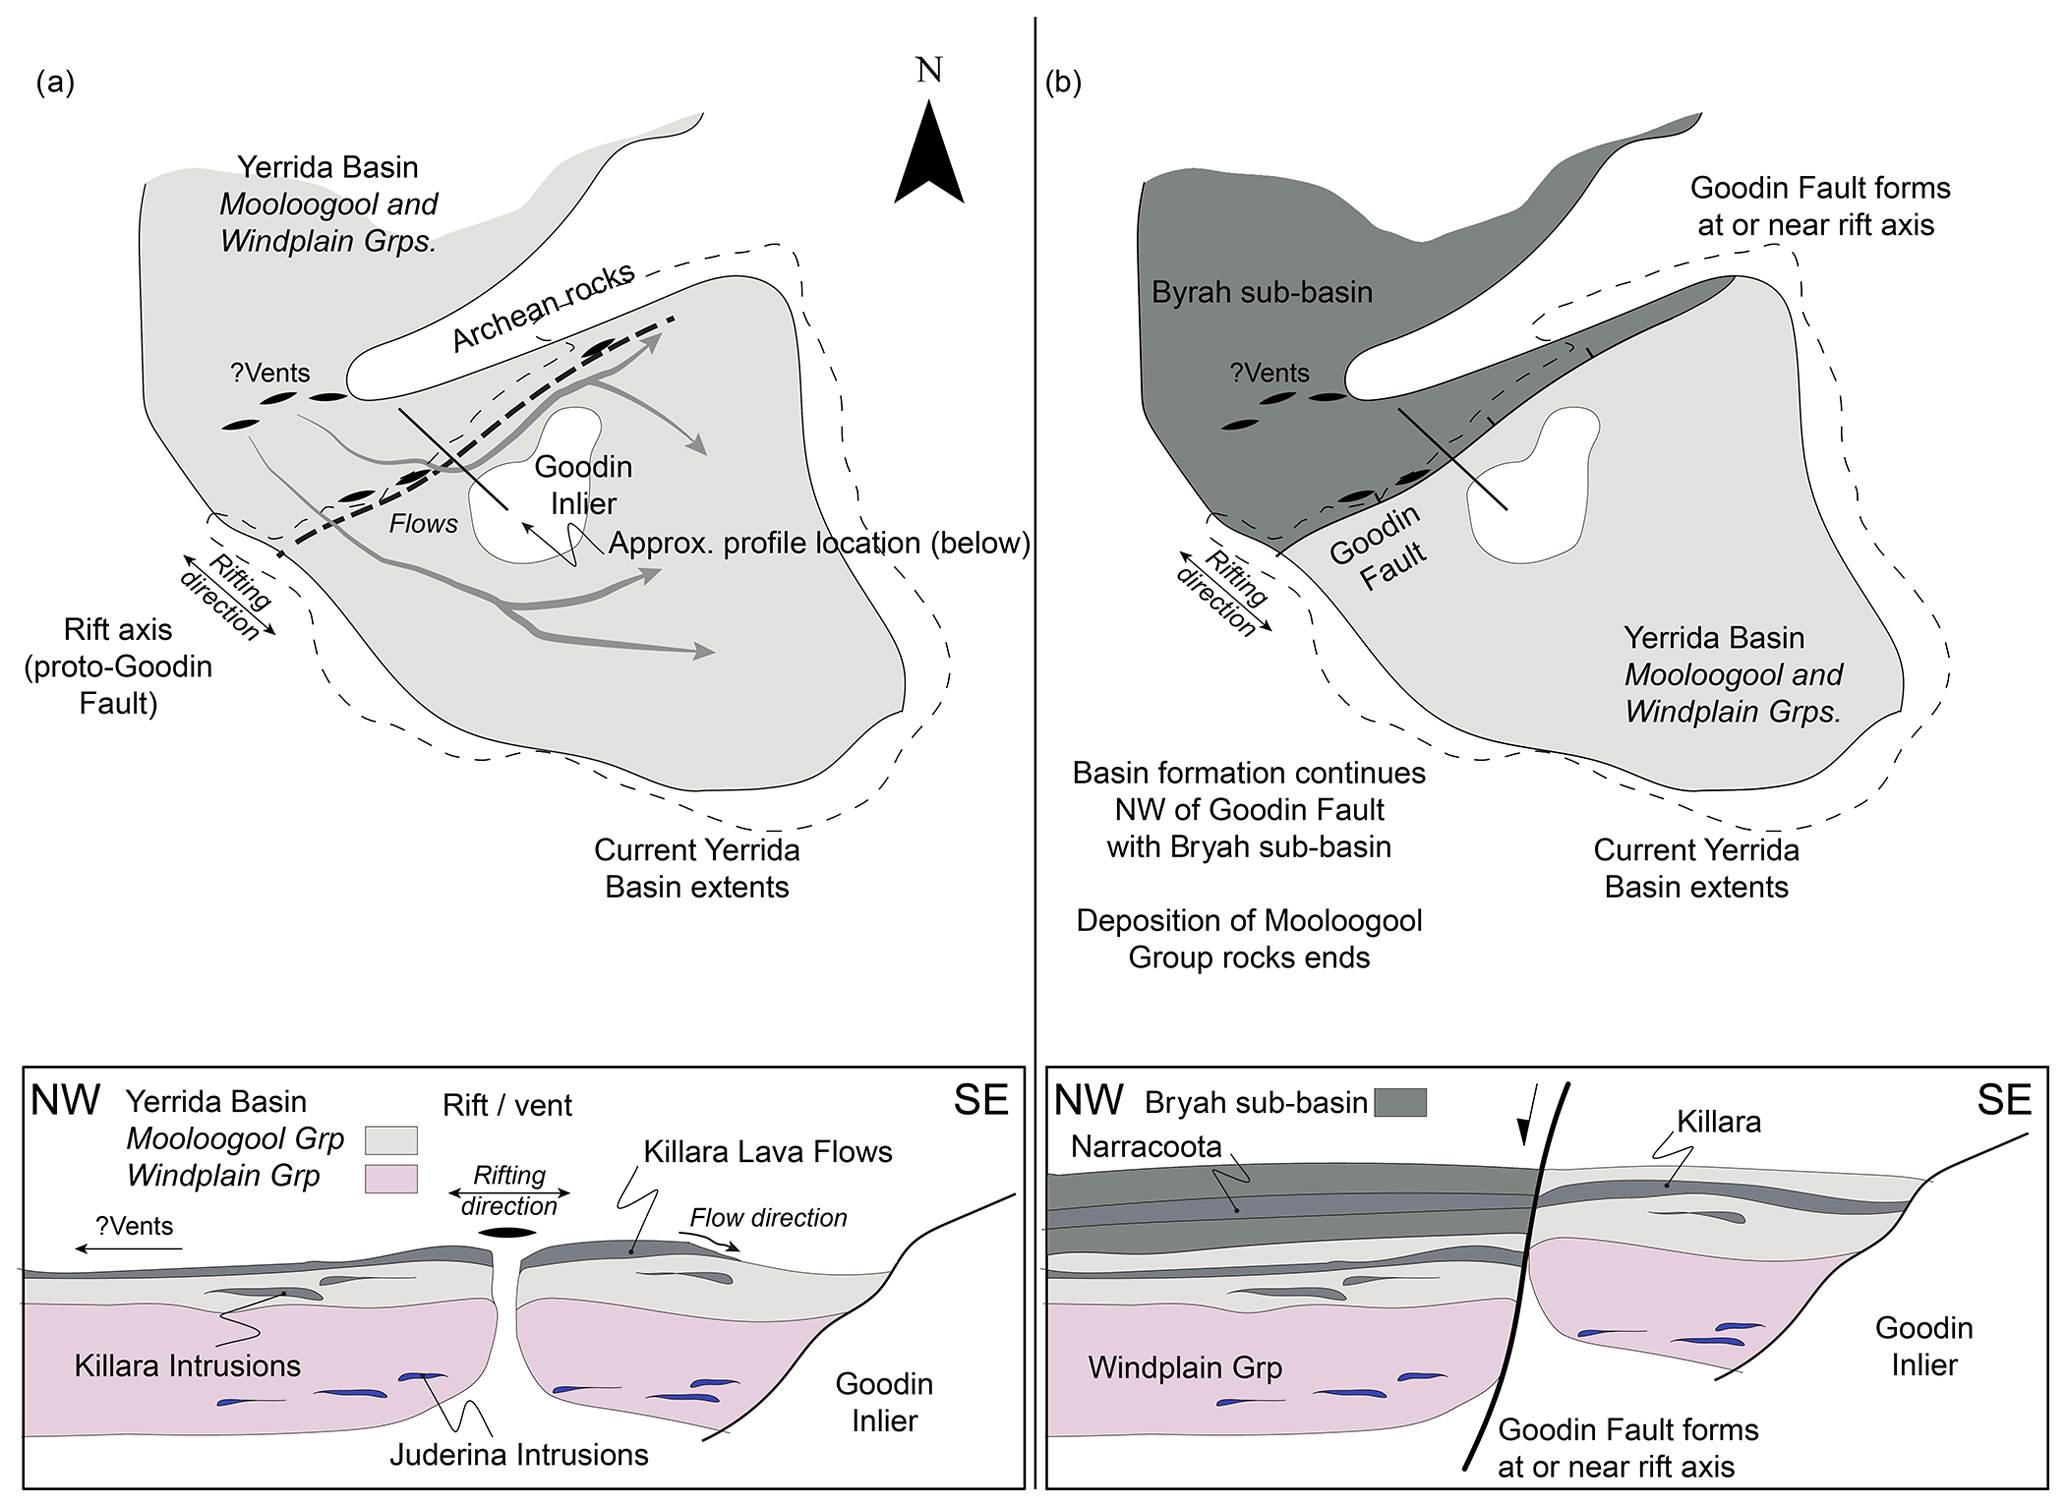
Figure 18Schematic model for the early development (ca. 2200 to ca. 2000 Ma) of the Yerrida Basin showing map (top) and section views (below). (a) Early deposition of Windplain and Mooloogool group rocks under extension. A rift, which later becomes the Goodin Fault, is a hypothesized source of magmatism along with vents located to the north-west of the rift axis. This magmatism produces intrusions to the Juderina Formation. Flat palaeotopography allows the formation of intrusions and lava flows across, around and on either side of the rift. The Killara Formation plausibly originates from these vents; however, sulfur isotope data are required to provide support for this hypothesis. (b) Continued extension results in normal faulting at or near the rift axis and the emergence of the Goodin Fault. Deposition of the Bryah sub-basin is initiated to the north-west of the Goodin Fault. Magmatism continues at the vents in the north-west, producing the Narracoota Formation. The presence of the normal fault forms a barrier to Narracoota Formation lava flows flowing to the south-east and to the deposition of Bryah sub-basin rocks in the south-east.
Figure 17b shows the proposed locations of vents for non-Killara magmatism, broadly estimated based on the gravity anomaly and being away from Archean rocks. Higher-magnitude gravity anomalies are typically associated with locations proximal to vents due to the greater amounts of high-density material, while the vents themselves exhibit a lower-magnitude anomaly due to the lack of high-density material around the crater (Blaikie et al., 2014, 2012). The gravity signature is unlikely to reveal short wavelengths that would indicate this geometry at the scale of this study due to both data resolution and burial of these vents under the Padbury Basin; thus, vent location is likely to be in areas of higher overall gravity anomaly. These vents are also a plausible source for the mafic intrusive and extrusive Killara Formation; however isotopic data are required to support this interpretation. Pirajno and Occhipinti (2000) and Occhipinti et al. (2017) provide the reader with further explanation of the volcanology of the Killara Formation.
Transport of magmas would likely have occurred along major structures (e.g. the Goodin Fault) or as sills along rock unit contacts. These near-surface magmatic pathways would have transported material around the Archean Goodin and Marymia inliers. Given the supposition that sill intrusion is restricted to the Juderina Formation, it is suggested that the Juderina Formation also extends to the north-west beyond the current extents of the Yerrida Basin (Figs. 17 and 18). This reasoning supports the interpretation of Occhipinti et al. (2017) that the Yerrida Basin underlies the present day location of the Bryah sub-basin and Padbury Basin.
The position of vents near the Goodin Fault or in the present day Bryah sub-basin presents an interesting question of how magmatic rocks traversed the potential barrier that the Goodin Fault may have represented and were deposited in the present day Yerrida Basin region. We propose that development of the Goodin Fault played an important role in the early architecture of the Yerrida Basin. Figure 18a shows how magmatism and the deposition of Windplain and Mooloogool rocks occurred on either side of the present day location of the Goodin Fault under regional extension. The Goodin Fault is considered to have been formed from a rift that was generated from early tectonic extension (Occhipinti et al., 2017). This proto-Goodin Fault would not have produced significant palaeotopography, and lava flows and intrusions generated from the proposed vent locations were then able to extend to the current Yerrida Basin extents in the south-east as shown in Fig. 18a. Continued extension and normal faulting formed the Goodin Fault in roughly its present day location (Fig. 18b). The partitioning of the early Yerrida Basin occurred – and the deposition of Bryah sub-basin rocks is located – north-west of the Goodin Fault. Magmatism continued through vents in the north-west (Fig. 18c), but any lava flows would have been restricted to regions north-west of the Goodin Fault.
5.6 Application to other regions
The approach described in this paper is applicable to other rift–basin regions located on the margins of cratons that host cryptic geophysical anomalies. The Volta Basin is such an example where rifts have been interpreted from gravity and magnetic data and density anomalies, suggesting infill from mafic volcanic rocks (Reichelt, 1971; Álvaro and Vizcaïno, 2012); however, their 3D distribution and the plausibility of the interpretation are not well understood (Jessell et al., 2016). Likewise, the structure of South American cratonic basins remains cryptic (Braitenberg et al., 2007), though recent studies modelling gravity data have shown progress in gaining geological understanding in these regions (Sanchez-Rojas and Palma, 2014).
This comprehensive study of the Yerrida Basin, southern Capricorn Orogen, demonstrates how mapping undercover can be conducted. A set of geophysical and 3D modelling techniques demonstrate hypothesis development and testingẆe show how the integration of geophysical, geological and geochemical datasets can achieve a better understanding of basin architecture and magmatic history.
A widespread gravity anomaly spatially associated with sedimentary basin rocks was investigated to infer that a considerable high-density component was required that was incompatible with the known exposure of high-density rocks and stratigraphy. The hypothesis that the higher-density anomaly may be linked to mafic rock bodies was investigated using a set of forward modelling and inversion techniques. First, a conceptual 3D model around the Goodin Inlier was constructed in a kinematic modelling package to evaluate whether a higher-density component was required to recreate the observed gravity response. 3D forward modelling showed that a layer of mafic material up to 2000 m thick is required to produce a similar response to the observed response. These results were encouraging but deemed too simple to adequately test the more complex architecture the gravity data represented.
2D section forward modelling was then used to investigate a transect across the Goodin Inlier to test whether intrusions associated with the Killara Formation (such as dykes and sills) were plausible candidates to produce the necessary gravity response. This was confirmed as plausible, and a basin-scale 3D model was constructed as a prior model for inversion to test where other high-density bodies were located throughout the rest of the basin. Gravity inversions were conducted in a systematic procedure that progressively added mafic bodies to understand the sensitivity of the misfit to the observed gravity and increased volume of higher-density bodies. Thus, our results show that the mafic composition of the Yerrida Basin is likely to be significantly larger than is shown on current maps and represented by the published stratigraphy.
Geochemistry was used to analyse whether mafic units logged in the Juderina Formation from drill cores were the intrusive part of the Killara Formation, which they are not. Geochemistry also showed that these rocks are not prospective for VMS-style mineralization. A different set of localized mafic bodies was revealed, suggesting substantial mafic activity associated with the Juderina Formation that does not contain an Archean signature. The proximity of the Archean basement suggests that the sources of magmatism were at the northern edges of the basin, either under the Bryah sub-basin and Padbury Basin or along large structures such as the Goodin Fault.
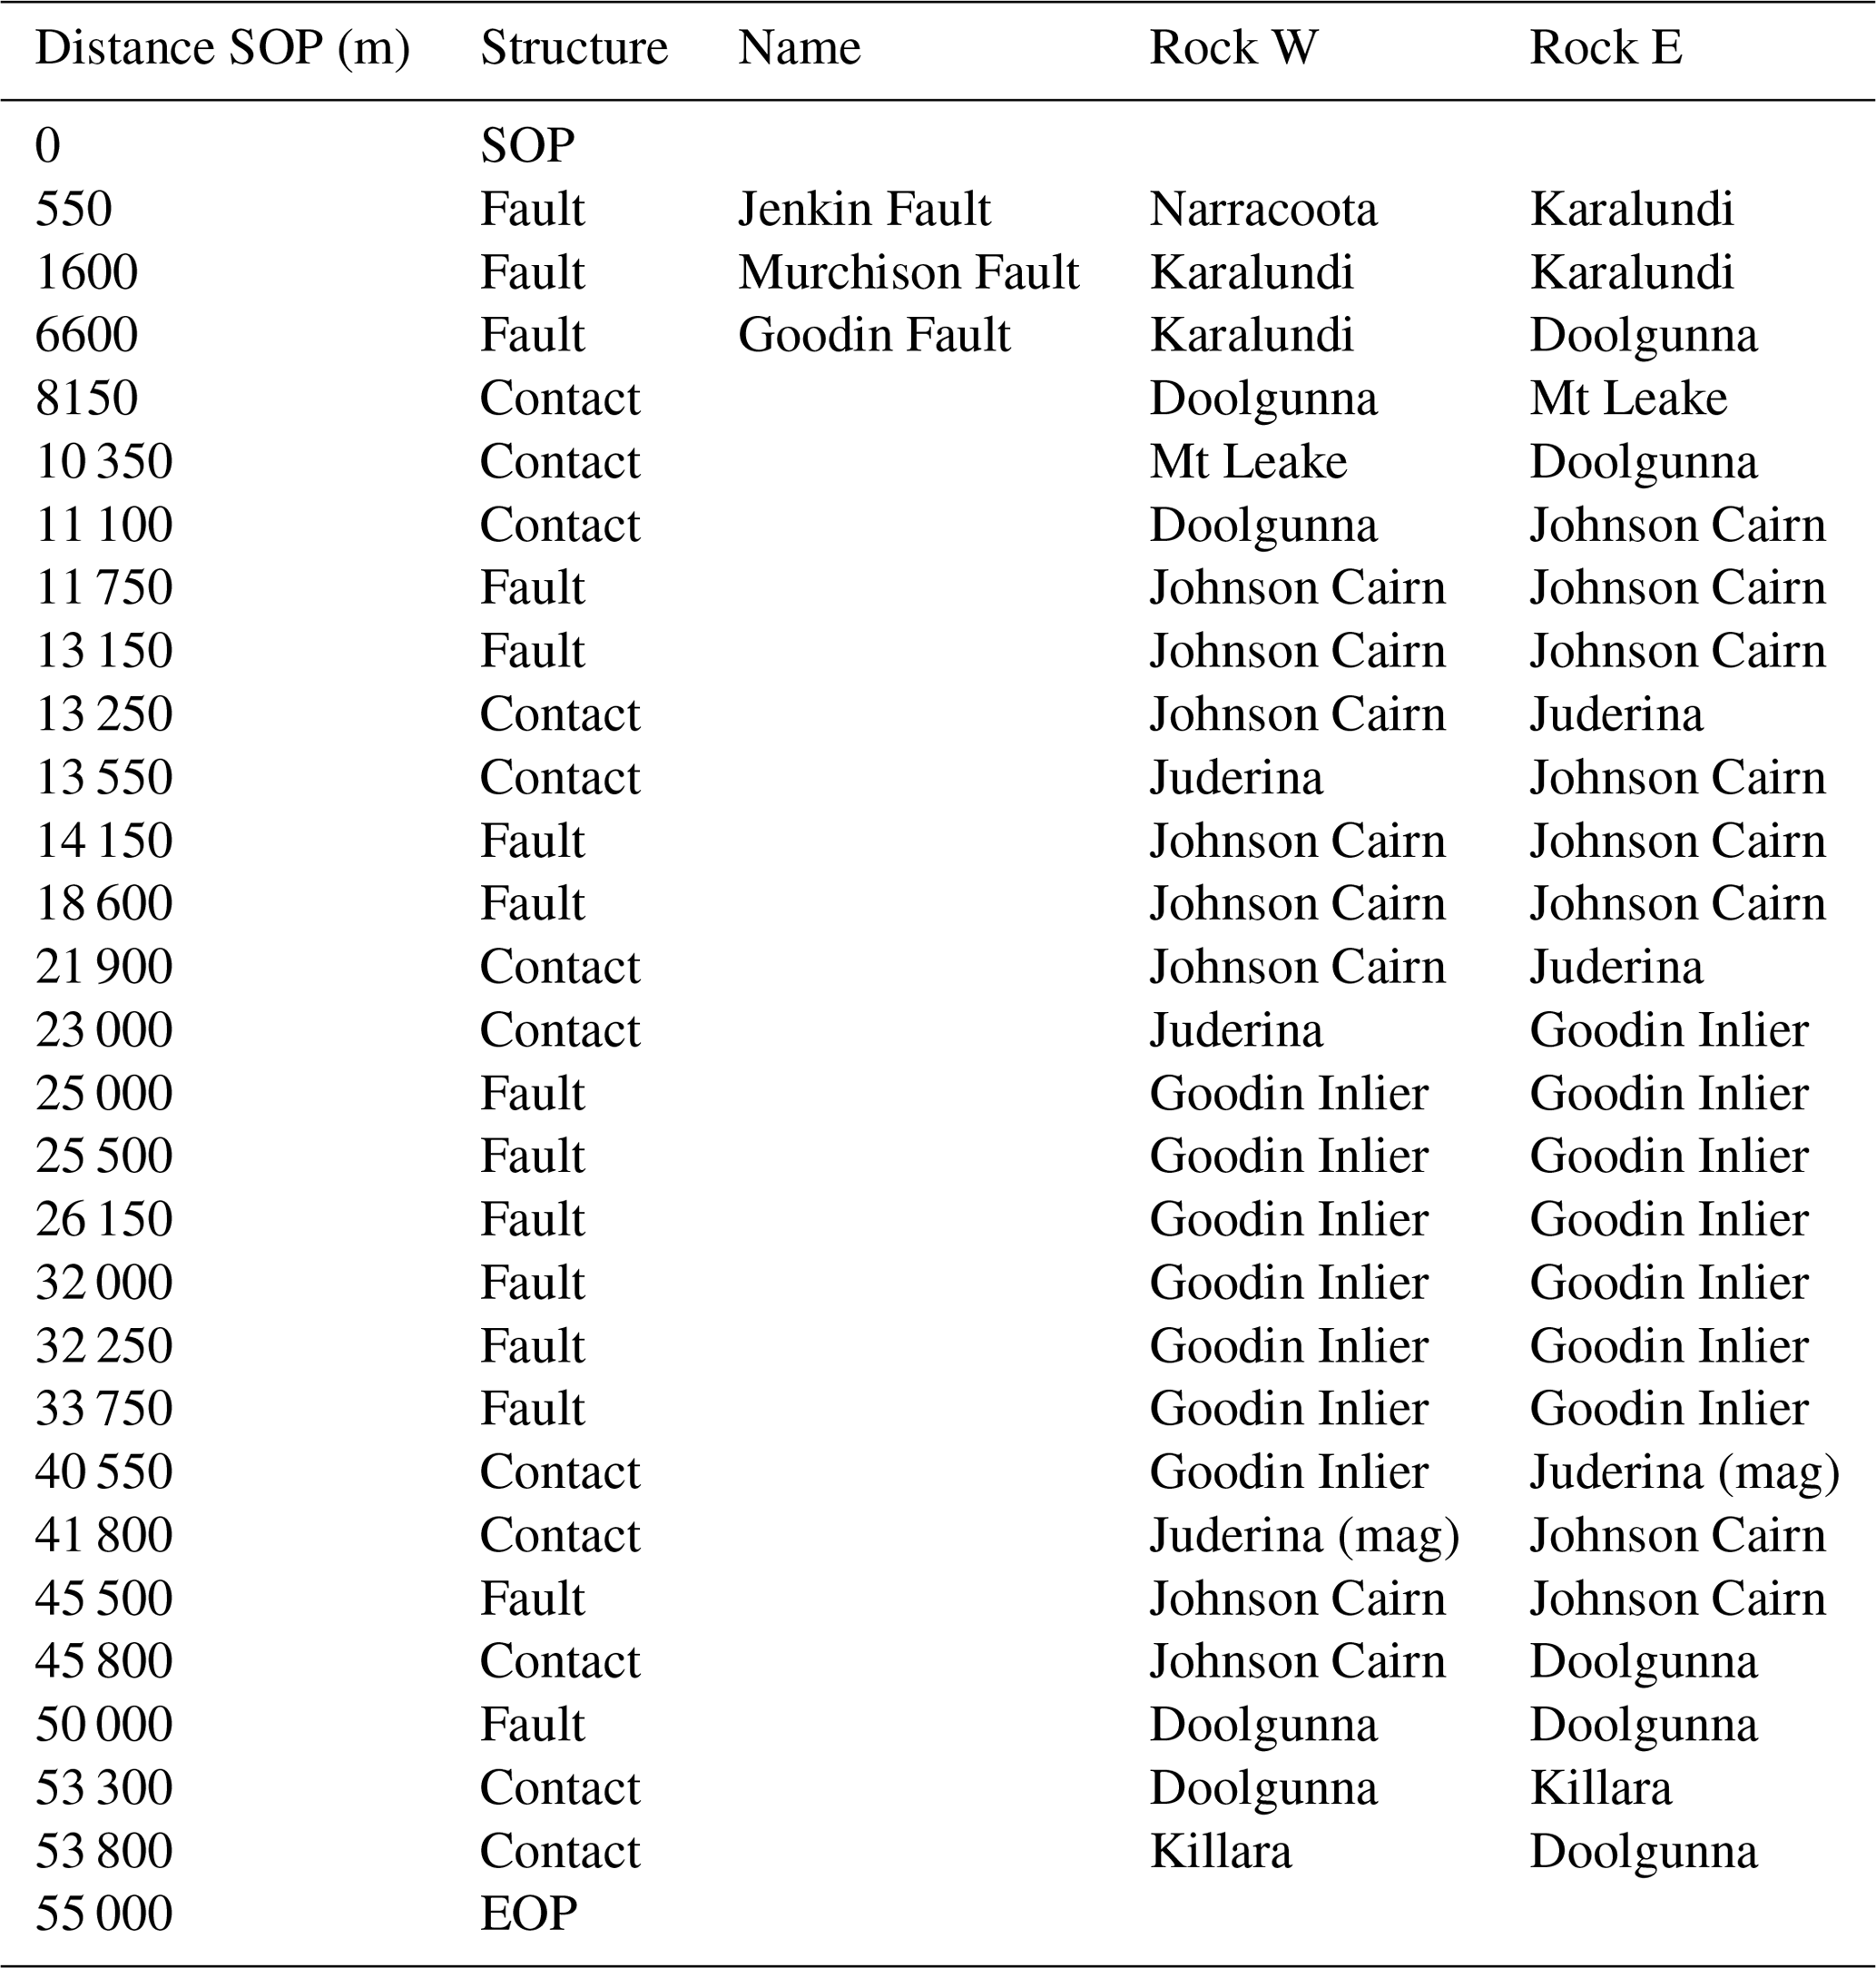
Table A1Geological data that aided construction of the forward model shown in Fig. 9. SOP represents start of profile, and EOP represents end of profile.
The Yerrida Basin model is supplied in GeoModeller format and is available from https://doi.org/10.5281/zenodo.3245772 (Lindsay, 2019a). Noddy software, models and their gravity forward response are provided in native format from https://doi.org/10.5281/zenodo.3245788 (Lindsay, 2019b). A download for the Windows installation of Noddy is available from http://tectonique.net/noddy/ (last access: 12 April 2020) (Jessell, 1981; Jessell and Valenta, 1996).
ML performed the data compilation, modelling, analyses, interpretation and paper preparation. SO contributed to the analyses, geological background and interpretation. CL contributed to the geochemical data compilation, analyses and interpretation. AA assisted with the geophysical data compilation, preparation and interpretation. LR performed petrophysical analyses and data compilation. All authors contributed to the drafting and revision of the paper.
The authors declare that they have no conflict of interest.
We thank Paul Hilliard (Sandfire Resources) for his invitation to the DeGrussa mine, valuable discussions and the supply of geochemical data. We thank Camilla Sørensen and Tim Munday (CSIRO) for their assistance with the geophysical interpretation and analysis. The petrophysical analysis was performed in the UWA petrophysics lab with thanks to Cam Adams. We gratefully thank the pastoralists and station owners for guiding us to rock outcrops and tracks and for supporting student field work with their hospitality and kindness. We thank Li Zhen Cheng (l'Université du Québec en Abitibi-Témiscamingue), Mark McLean (The University of Melbourne), one anonymous reviewer and topical editor Irene Bianchi (University of Vienna) for their insightful and constructive reviews. Funding for this work was from a Western Australian government Exploration Incentive Scheme and Minerals Research Institute of Western Australia (MRIWA) grant awarded to UWA from the Geological Survey of Western Australia and the “Distal Footprints of Giant Ore Systems: UNCOVER Australia”, supported by the CSIRO Science & Industry Endowment Fund (SIEF). Lara Ramos was supported by a PhD scholarship from CNPq, Brazil.
This research has been supported by the Geological Survey of Western Australia (Exploration Incentive Scheme), the Science and Industry Endowment Fund (Distal Footprints of Giant Ore Systems: UNCOVER Australia), and the Australian Research Council (grant no. DE190100431).
This paper was edited by Irene Bianchi and reviewed by Li Zhen Cheng, Mark McLean, and one anonymous referee.
Adamides, N. G.: Geology of the Doolgunna 1:100 000 sheet: Western Australia Geological Survey, 1:100 000 Geological Series Explanatory Notes, 1998.
Aitken, A. R. A. and Betts, P. G.: High-resolution aeromagnetic data over central Australia assist Grenville-era (1300 Ma–1100 Ma) Rodinia reconstructions, Geophys. Res. Lett., 35, L01306, https://doi.org/10.1029/2007GL031563, 2008.
Aitken, A. R. A. and Betts, P. G.: Multi-scale integrated structural and aeromagnetic analysis to guide tectonic models: An example from the eastern Musgrave Province, Central Australia, Tectonophysics, 476, 418–435, 2009.
Almalki, K. A., Ailleres, L., Betts, P. G., and Bantan, R. A.: Evidence for and relationship between recent distributed extension and halokinesis in the Farasan Islands, southern Red Sea, Saudi Arabia, Arab. J. Geosci., 8, 8753–8766, https://doi.org/10.1007/s12517-015-1792-9, 2015.
Álvaro, J. J. and Vizcaïno, D.: Proterozoic microbial reef complexes and associated hydrothermal mineralizations in the Banfora Cliffs, Burkina Faso, Sediment. Geol., 263–264, 144–156, 2012.
Bagas, L.: Early tectonic history of the Marymia Inlier and correlation with the Archaean Yilgarn Craton, Western Australia, Aust. J. Earth Sci., 46, 115–125, https://doi.org/10.1046/j.1440-0952.1999.00691.x, 1999.
Betts, P., Williams, H., Stewart, J., and Ailleres, L.: Kinematic analysis of aeromagnetic data: Looking at geophysical data in a structural context, Gondwana Res., 11, 582–583, 2007.
Betts, P. G., Valenta, R. K., and Finlay, J.: Evolution of the Mount Woods Inlier, northern Gawler Craton, Southern Australia: an integrated structural and aeromagnetic analysis, Tectonophysics, 366, 83–111, 2003.
Blaikie, T. N., Ailleres, L., Cas, R. A. F., and Betts, P. G.: Three-dimensional potential field modelling of a multi-vent maar-diatreme – The Lake Coragulac maar, Newer Volcanics Province, south-eastern Australia, J. Volcanol. Geoth. Res., 235–236, 70–83, https://doi.org/10.1016/j.jvolgeores.2012.05.002, 2012.
Blaikie, T. N., Ailleres, L., Betts, P. G., and Cas, R. A. F.: A geophysical comparison of the diatremes of simple and complex maar volcanoes, Newer Volcanics Province, south-eastern Australia, J. Volcanol. Geoth. Res., 276, 64–81, https://doi.org/10.1016/j.jvolgeores.2014.03.001, 2014.
Blewett, R. S., Czarnota, K., and Henson, P. A.: Structural-event framework for the eastern Yilgarn Craton, Western Australia, and its implications for orogenic gold, Precambrian Res., 183, 203–229, 10.1016/j.precamres.2010.04.004, 2010.
Braitenberg, C., Wienecke, S., Ebbing, J., Born, W., and Redfield, T.: Joint gravity and isostatic analysis for basement studies – a novel tool (extended abstracts), in: EGM 2007 International Workshop, Innovation in EM, Grav and Mag Methods: A New Perspective for Exploration, Villa Orlandi, Capri, Italy, 15–18 April, available at: http://www2.ogs.trieste.it/egm2007/ (last access: 12 April 2020), 2007.
Brethes, A., Guarnieri, P., Rasmussen, T. M., and Bauer, T. E.: Interpretation of aeromagnetic data in the Jameson Land Basin, central East Greenland: Structures and related mineralized systems, Tectonophysics, 724–725, 116–136, https://doi.org/10.1016/j.tecto.2018.01.008, 2018.
Brett, J. W.: 80 m magnetic RTP merged grid of Western Australia 2017, Geological Survey of Western Australia, Perth, 2017a.
Brett, J. W.: Bouguer gravity merged grid of Western Australia 2017, Geological Survey of Western Australia, 2017b.
Briggs, I. C.: Machine contouring using minimum curvature, Geophysics, 39, 39–48, 1974.
Calcagno, P., Chilès, J. P., Courrioux, G., and Guillen, A.: Geological modelling from field data and geological knowledge: Part I. Modelling method coupling 3D potential-field interpolation and geological rules, Phys. Earth Planet. In., 171, 147–157, 2008.
Clark, D. A.: Magnetic petrophysics and magnetic petrology: aids to geological interpretation of magnetic surveys, ASGO Journal of Australian Geology and Geophysics, 17, 83–103, 1997.
Cudahy, T. J., Jones, M., Thomas, M., Laukamp, C., Caccetta, M., Hewson, R., Rogdger, A., and Verrall, M.: Next generation mineral mapping: Queensland Airborne Hymap and Satellite ASTER Surveys 2006–2008, CSIRO report P2007/364, 161 pp., 2008.
de Kemp, E., Jessell, M., Ailleres, L., Schetselaar, E., Hillier, M., Lindsay, M. D., and Brodaric, B.: Earth model construction in challenging geologic terrain: Designing workflows and algorithms that makes sense, Exploration 17: Sixth Decennial International Conference on Mineral Exploration, Toronto, 21–25 October 2017.
Dufréchou, G., Harris, L. B., and Corriveau, L.: Tectonic reactivation of transverse basement structures in the Grenville orogen of SW Quebec, Canada: Insights from gravity and aeromagnetic data, Precambrian Res., 241, 61–84, https://doi.org/10.1016/j.precamres.2013.11.014, 2014.
Fairhead, J. D.: The structure of the lithosphere beneath the Eastern rift, East Africa, deduced from gravity studies, Tectonophysics, 30, 269–298, https://doi.org/10.1016/0040-1951(76)90190-6, 1976.
Fullagar, P. K., Pears, G., Hutton, D., and Thompson, A.: 3D gravity and aeromagnetic inversion for MVT lead-zinc exploration at Pillara, Western Australia, Explor. Geophys., 35, 142–146, https://doi.org/10.1071/EG04142, 2004.
Geological Survey of Western Australia, Peng, J., and White, S. R.: Compilation of WAROX data, Geological Survey of Western Australia, East Perth, Western Australia, Department of Mines and Petroleum, 2017.
Giraud, J., Lindsay, M., Ogarko, V., Jessell, M., Martin, R., and Pakyuz-Charrier, E.: Integration of geoscientific uncertainty into geophysical inversion by means of local gradient regularization, Solid Earth, 10, 193–210, https://doi.org/10.5194/se-10-193-2019, 2019.
Giraud, J., Lindsay, M., Jessell, M., and Ogarko, V.: Towards plausible lithological classification from geophysical inversion: honouring geological principles in subsurface imaging, Solid Earth, 11, 419–436, https://doi.org/10.5194/se-11-419-2020, 2020.
Grant, F. S.: Aeromagnetics, geology and ore environments, I. Magnetite in igneous, sedimentary and metamorphic rocks: An overview, Geoexploration, 23, 303–333, https://doi.org/10.1016/0016-7142(85)90001-8, 1985.
Guillen, A., Calcagno, P., Courrioux, G., Joly, A., and Ledru, P.: Geological modelling from field data and geological knowledge: Part II. Modelling validation using gravity and magnetic data inversion, Phys. Earth Planet. In., 171, 158–169, 2008.
Gunn, P. J.: Quantitative methods for interpreting aeromagnetic data: a subjective review, AGSO Journal of Australian Geology and Geophysics, 17, 105–114, 1997.
Hackney, R.: Gravity anomalies, crustal structure and isostasy associated with the Proterozoic Capricorn Orogen, Western Australia, Precambrian Res., 128, 219–236, https://doi.org/10.1016/j.precamres.2003.09.012, 2004.
Hawke, M. L.: The Geological Evolution of the DeGrussa volcanic-hosted massive sulfide deposit and the Eastern Capricorn Orogen, Western Australia, PhD, Centre for Ore Deposit and Earth Sciences, School of Physical Sciences, The University of Tasmania, Hobart, Tasmania, 434 pp., 2016.
Hawke, M. L., Meffre, S., Stein, H., Hilliard, P., Large, R., and Gemmell, J. B.: Geochronology of the DeGrussa volcanic-hosted massive sulphide deposit and associated mineralisation of the Yerrida, Bryah and Padbury Basins, Western Australia, Precambrian Res., 267, 250–284, https://doi.org/10.1016/j.precamres.2015.06.011, 2015.
Hildenbrand, T. G., Berger, B., Jachens, R. C., and Ludington, S.: Regional Crustal Structures and Their Relationship to the Distribution of Ore Deposits in the Western United States, Based on Magnetic and Gravity Data, Econ. Geol., 95, 1583–1603, https://doi.org/10.2113/95.8.1583, 2000.
Husson, E., Guillen, A., Séranne, M., Courrioux, G., and Couëffé, R.: 3D Geological modelling and gravity inversion of a structurally complex carbonate area: application for karstified massif localization, Basin Res., 30, 766–782, https://doi.org/10.1111/bre.12279, 2018.
Jessell, M.: Noddy – an interactive map creation package, MSc, University of London, 52 pp., 1981 (data available at: http://tectonique.net/noddy/, last access: 12 April 2020).
Jessell, M., Aillères, L., de Kemp, E., Lindsay, M., Wellmann, F., Hillier, M., Laurent, G., Carmichael, T., and Martin, R.: Next Generation Three-Dimensional Geologic Modeling and Inversion, Society of Economic Geologists: Special Publication 18, 261–272, 2014.
Jessell, M. W. and Valenta, R. K.: Structural geophysics: Integrated structural and geophysical modelling, in: Computer Methods in the Geosciences, edited by: Declan, G. D. P., Pergamon, 303–324, 1996 (data available at: http://tectonique.net/noddy/, last access: 12 April 2020).
Jessell, M. W., Begg, G. C., and Miller, M. S.: The geophysical signatures of the West African Craton, Precambrian Res., 274, 3–24, https://doi.org/10.1016/j.precamres.2015.08.010, 2016.
Johnston, D. T., Poulton, S. W., Fralick, P. W., Wing, B., Canfield, D. E., and Farquhar, J.: Evolution of the oceanic sulfur cycle at the end of the Paleoproterozoic, Geochim. Cosmochim. Ac., 70, 5723–5739, 2006.
Kohanpour, F., Lindsay, M. D., Occhipinti, S., and Gorczyk, W.: Structural controls on proterozoic nickel and gold mineral systems identified from geodynamic modelling and geophysical interpretation, east Kimberley, Western Australia, Ore Geol. Rev., 95, 552–568, https://doi.org/10.1016/j.oregeorev.2018.03.010, 2018.
Kovesi, P.: Phase Preserving Tone Mapping of Non-Photographic High Dynamic Range Images, 2012 International Conference on Digital Image Computing Techniques and Applications (DICTA), Fremantle, Western Australia, 3–5 December 2012, 1–8, 2012.
LaFlamme, C., Fiorentini, M. L., Lindsay, M. D., and Bui, T. H.: Atmospheric sulfur is recycled to the crystalline continental crust during supercontinent formation, Nat. Commun., 9, 4380, https://doi.org/10.1038/s41467-018-06691-3, 2018.
LaFlamme, C., Fiorentini, M., and Beaudoin, B. C.: Insight into the seawater sulfate reservoir at 2.0 Ga from the Paleoproterozoic Degrussa Cu-Au volcanogenic massive sulfide deposit, Geochim. Cosmochim. Ac., in review, 2020.
Lindsay, M.: Yerrida Basin 3D geological model and gravity inversion results, Zenodo, https://doi.org/10.5281/zenodo.3245772, 2019a.
Lindsay, M.: Yerrida Basin 3D “Noddy” geological and forward models, Zenodo, https://doi.org/10.5281/zenodo.3245788, 2019b.
Lindsay, M. D., Aillères, L., Jessell, M. W., de Kemp, E. A., and Betts, P. G.: Locating and quantifying geological uncertainty in three-dimensional models: Analysis of the Gippsland Basin, southeastern Australia, Tectonophysics, 546–547, 10–27, https://doi.org/10.1016/j.tecto.2012.04.007, 2012.
Lindsay, M. D., Occhipinti, S., Aitken, A. R. A., Metelka, V., Hollis, J., and Tyler, I.: Proterozoic accretionary tectonics in the east Kimberley region, Australia, Precambrian Res., 278, 265–282, https://doi.org/10.1016/j.precamres.2016.03.019, 2016.
Lindsay, M. D., Spratt, J., Occhipinti, S. A., Aitken, A. R. A., Dentith, M. C., Hollis, J. A., and Tyler, I. M.: Identifying mineral prospectivity using 3D magnetotelluric, potential field and geological data in the east Kimberley, Australia, Geological Society, London, Special Publications, 453, 247–268, https://doi.org/10.1144/sp453.8, 2017.
Manger, G. E.: Porosity and bulk density of sedimentary rocks: Contributions to geochemistry, Geological Survey Bulletin, 1144-E, E1–E55, 1963.
Mueller, D. H. A.: Final report on drilling of THD001: a 1017.8 m vertical core hole on E52/1673: GSWA reference C144/2005, Sipa Exploration NL, 2011.
Nettleton, L. L.: Gravity and magnetic calculations, Geophysics, 7, 293–310, 1942.
Occhipinti, S., Hocking, R., Lindsay, M., Aitken, A., Copp, I., Jones, J., Sheppard, S., Pirajno, F., and Metelka, V.: Paleoproterozoic basin development on the northern Yilgarn Craton, Western Australia, Precambrian Res., 300, 121–140, https://doi.org/10.1016/j.precamres.2017.08.003, 2017.
Occhipinti, S. A., Grey, K., Pirajno, F., Adamides, N. G., Bagas, L., Dawes, P., and Le Blanc-Smith, G.: Stratigraphic revision of Palaeoproterozoic rocks of the Yerrida, Bryah and Padbury Basins (formerley Glengarry Basin), Geological Survey of Western Australia Record 1997/3, 1997.
Olierook, H. K. H., Sheppard, S., Johnson, S. P., Occhipinti, S. A., Reddy, S. M., Clark, C., Fletcher, I. R., Rasmussen, B., Zi, J.-W., Pirajno, F., LaFlamme, C., Do, T., Ware, B., Blandthorn, E., Lindsay, M., Lu, Y.-J., Crossley, R. J., and Erickson, T. M.: Extensional episodes in the Paleoproterozoic Capricorn Orogen, Western Australia, revealed by petrogenesis and geochronology of mafic–ultramafic rocks, Precambrian Res., 306, 22–40, https://doi.org/10.1016/j.precamres.2017.12.015, 2018.
Pearce, J. A.: Geochemical fingerprinting of oceanic basalts with applications to ophiolite classification and the search for Archean oceanic crust, Lithos, 100, 14–48, https://doi.org/10.1016/j.lithos.2007.06.016, 2008.
Pearce, J. A.: Immobile Element Fingerprinting of Ophiolites, Elements, 10, 101–108, https://doi.org/10.2113/gselements.10.2.101, 2014.
Perrouty, S., Aillères, L., Jessell, M. W., Baratoux, L., Bourassa, Y., and Crawford, B.: Revised Eburnean geodynamic evolution of the gold-rich southern Ashanti Belt, Ghana, with new field and geophysical evidence of pre-Tarkwaian deformations, Precambrian Res., 204–205, 12–39, 2012.
Pirajno, F. and Adamides, N. G.: Geology and minerlization of the Palaeoproterozoic Yerrida Basin, Western Australia, Western Australia Geological Survey, Report 60, 2000.
Pirajno, F. and Occhpinti, S. A.: Bryah, Western Australia, Sheet 2646: 1:100 000 Geological Series, Western Australia Geological Survey, 1995.
Pirajno, F. and Occhipinti, S. A.: Geology of the Bryah 1:100 00 sheet, Geological Survey of Western Australia, 1998.
Pirajno, F. and Occhipinti, S. A.: Three Palaeoproterozoic basins-Yerrida, Bryah and Padbury-Capricorn Orogen, Western Australia, Aust. J. Earth Sci., 47, 675–688, https://doi.org/10.1046/j.1440-0952.2000.00800.x, 2000.
Pirajno, F., Occhipinti, S. A., and Swager, C. P.: Geology and tectonic evolution of the Palaeoproterozoic Bryah, Padbury and Yerrida basins (formerly Glengarry Basin), Western Australia: implications for the history of the south-central Capricorn Orogen, Precambrian Res., 90, 119–140, https://doi.org/10.1016/S0301-9268(98)00045-X, 1998.
Quigley, M. C., Bennetts, L. G., Durance, P., Kuhnert, P. M., Lindsay, M. D., Pembleton, K. G., Roberts, M. E., and White, C. J.: The provision and utility of science and uncertainty to decision-makers: earth science case studies, Environment Systems and Decisions, 39, 307–348, https://doi.org/10.1007/s10669-019-09728-0, 2019.
Reichelt, R.: Géologie du Gourma (Afrique occidentale), un seuil et un bassin du Précambrien supérieur, Mém. BRGM, no 53, 1971.
Sanchez-Rojas, J. and Palma, M.: Crustal density structure in northwestern South America derived from analysis and 3-D modeling of gravity and seismicity data, Tectonophysics, 634, 97–115, https://doi.org/10.1016/j.tecto.2014.07.026, 2014.
Talwani, M., Worzel, J. I., and Landisman, M.: Rapid gravity computations for twodimensional bodies with application to the Mendicino submarine fracture zone, J. Geophys. Res., 64, 49–59, 1959.
Talwani, M. and Heirtzler, J. R.: Computation of magnetic anomalies caused by two-dimensional bodies of arbitrary shape, in: Computers in the Mineral Industries, edited by: Parks, G. A., School of Earth Sciences, Stanford University, 464–480, 1964.
Tarantola, A.: Popper, Bayes and the inverse problem, Nat. Phys., 2, 492–494, 2006.
Telford, W. M., Geldart, L. P., and Sheriff, R. E.: Applied Geophysics, 2nd ed., Cambridge University Press, Cambridge, UK, 1990.