
Abstract
For high-dimensional datasets in which clusters are formed by both distance and density structures (DDS), many clustering algorithms fail to identify these clusters correctly. This is demonstrated for 32 clustering algorithms using a suite of datasets which deliberately pose complex DDS challenges for clustering. In order to improve the structure finding and clustering in high-dimensional DDS datasets, projection-based clustering (PBC) is introduced. The coexistence of projection and clustering allows to explore DDS through a topographic map. This enables to estimate, first, if any cluster tendency exists and, second, the estimation of the number of clusters. A comparison showed that PBC is always able to find the correct cluster structure, while the performance of the best of the 32 clustering algorithms varies depending on the dataset.
1 Introduction
Many data mining methods rely on some concept of the similarity between pieces of information encoded in the data of interest. The corresponding methods can be either data-driven or need-driven. The latter, also called constraint clustering (Tung et al. 2001), aims at organizing the data to meet particular application requirements (Ge et al. 2007, p. 320) characterizing the similarity. Here, the focus is placed on data-driven methods, in which objects are similar within clusters and dissimilar between clusters restricted to a metric (most often Euclidean dissimilarity). Consequently, the term cluster analysis is used. Cluster analysis is seen here as a step in the knowledge discovery process.
No generally accepted definition of clusters exists in the literature (Bonner 1964; Hennig 2015, p. 705). Additionally, Kleinberg showed for a set of three simple properties (scale-invariance, consistency, and richness) that there is no clustering function satisfying all three (Kleinberg 2003). However, the property richness implies that all partitions should be achievable. By concentrating on distance- and density-based structures and omitting constraint clustering, this work restricts clusters in a way that the goal is to acquire new knowledge about the data. As a consequence, instead of all partitions, only the accurate partition should be achievable which contradicts the axiom of richness. Then, the purpose of clustering methods is to identify homogeneous groups of objects (cf. Arabie et al. 1996, p. 8) defining cluster structures. In this case, many clustering algorithms implicitly assume different structures of clusters (Duda et al. 2001, pp. 537, 542, 551; Everitt et al. 2001, pp. 61, 177; Handl et al. 2005; Theodoridis and Koutroumbas 2009, pp. 896, 896; Ultsch and Lötsch 2017). The two main types are based either on distances (compact structures) or densities (connected structures) and can be defined with the help of graph theory (Thrun 2018). Two-dimensional or 3D datasets can be predefined accordingly (Thrun and Ultsch 2020a). The question arises on how to discover the true structure of the underlying data and how to choose the right clustering method for the task.
One approach is to use projections as conventional methods of dimensionality reduction for information visualization in order to transform high-dimensional data into low-dimensional space (Venna et al. 2010). If the output space is restricted in the projection method to two dimensions, the result is a scatter plot. The goal of this scatter plot is a visualization of distance- and density-based structures. As stated by the Johnson–Lindenstrauss lemma (Johnson and Lindenstrauss 1984; Dasgupta and Gupta 2003), the 2D similarities in the scatter plot cannot coercively represent high-dimensional distances. For example, similar data points can be mapped onto far-separated points, or a pair of closely neighboring positions represents a pair of distant data points. These two types of error have been identified in the literature in Ultsch and Herrmann (2005), for the case of a Euclidean graph; in Venna et al. (2010), for the case of a KNN graph of binary neighborhoods; and in Aupetit (2007), for the case of a Delaunay graph. Nonetheless, scatter plots generated by a projection method remain the state-of-the-art approach in cluster analysis to visualize data structures (e.g., Mirkin 2005; Ritter 2014; Hennig 2015). The colors of the projected points can be set by the labels of the clustering.
To approach this problem, the authors propose a design for cluster analysis through the visualization technique of a topographic map (Thrun et al. 2016) which visualizes both error types and is able to show the distance- and density-based structures. This visualization method builds on a projection method. The proposed approach here is the application of automatic clustering on this topographic map.
2 Common Projection Methods as an Approach for Dimensionality Reduction
Dimensionality reduction techniques reduce the dimensions of the input space to facilitate the exploration of structures in high-dimensional data. Two general dimensionality reduction approaches exist: manifold learning and projection. Manifold learning methods attempt to find a subspace in which the high-dimensional distances can be preserved. These subspaces may have a dimensionality of greater than two. However, only 2D or 3D representations of high-dimensional data are easily graspable for to the human observer. Venna et al. (2010) argued that “manifold learning methods are not necessarily good for […] visualization […] since they have been designed to find a manifold, not compress it into a lower dimensionality” (p. 452), and it has been shown by van der Maaten et al. (2009) that they do not outperform classical principal component analysis (PCA) for real-world tasks. Therefore, the focus lies on common projection methods. A projection is used as a method for visualizing high-dimensional data in a 2D space such that the distance- and density-based structures of the data are captured.
In general, projection methods can be categorized as linear and nonlinear. Linear methods perform orthonormal rotations of the data’s coordinate system. Linear projections for planar projections choose the two directions, which are optimal concerning a predefined criterion. Typical examples of these linear projections are PCA (variance criterion) (Pearson 1901; Hotelling 1933), independent component analysis (ICA; non-normality criterion) (Comon 1992), and projection pursuit (PP; user-defined criterion). Since all linear projections are orthonormal rotations of the data coordinates, clusters that are linear nonseperable entanglements, such as the Chainlink data (Ultsch and Vetter 1995) or overlapping convex hulls (see Table 1), cannot be separated. With this type of projections, it is unavoidable that at some locations remote data are erroneously superimposed in the output space.
2.1 Combining Dimensionality Reduction with Clustering
When it is suspected that some of the variables do not contribute much to the clustering structure or when the number of features is high, usually, a preliminary principal component or factor analysis is applied (De Soete and Carroll 1994). Afterward, the clustering is performed by k-means using the first few components, which is called Tandem Clustering (De Soete and Carroll 1994).
However, the first few principal components usually do not define a subspace that is most informative about the cluster structure in data (Chang 1983; Arabie and Hubert 1994) if the task of clustering is defined as the grouping of similar objects. De Soete and Carroll (1994) proposed the reduced k-means (RKM) approach, which simultaneously searches for clustering and a dimensionality reduction of features based on the component analysis. The notion that RKM may fail to recover the clustering structure if the data contains much variance in direction orthogonal to the subspace of data led to the proposal of factorial k-means (FKM) (Vichi and Kiers 2001; Timmerman et al. 2010).
To the knowledge of the authors, the idea of combining projection methods other than PCA with clustering was first proposed by Bock (1987) but was never applied to empirical data. Steinley et al. (2012) approached the challenge of higher dimensionality by using a measure of clusterability in combination with projection pursuit. The maximum clusterability was defined as the ratio of the variance of a variable to its range (Steinley et al. 2012), and the dimensionality reduction (DR) approach was independent of the clustering algorithm employed (Steinley et al. 2012). As an alternative, Hofmeyr et al. proposed to combine projection pursuit with the maximum clusterability index of Zhang (2001) followed by clustering by an optimal hyperplane (Hofmeyr and Pavlidis 2015). Further projection pursuit clustering approaches are listed in Hofmeyr and Pavlidis (2019).
Another way of approaching the challenges of higher dimensionality is subspace clustering. This type of clustering algorithms have the goal to find one or more subspaces (Agrawal et al. 1998) with the assumption that sufficient dimensionality reduction is dimensionality reduction without loss of information (Niu et al. 2011). Hence, subspace clustering aims at finding a linear subspace such that the subspace contains as much predictive information regarding the output variable as the original space (Niu et al. 2011). Thus, the dimensionality of subspaces is usually higher than two but lower than the input space.
In contrast, projection-based clustering (PBC) uses methods that project data explicitly into two dimensions disregarding the subspaces. PBC only tries to preserve (“relevant”) neighborhoods. It differentiates from manifold learning methods because such methods usually project into a subspace of higher than two (c.f. Venna et al. 2010; Thrun 2018). This means that projection methods try to lose information, which they disregard as not relevant. In order to accomplish this, most often, projection methods use nonlinear combinations of dimensions through an annealing scheme and neighborhoods in order to entangle complex clusters like two intertwined chains (Demartines and Hérault 1995; Ultsch 1995; Venna et al. 2010; Thrun 2018). For PBC introduced in the next section, only nonlinear projections will be used. Examples of nonlinear projection methods are multidimensional scaling (Torgerson 1952), curvilinear component analysis (CCA) [Demartines/Hérault], the t-distributed stochastic neighbor embedding (t-SNE) (Hinton and Roweis 2002), neighborhood retrieval visualizer (NeRV) (Venna et al. 2010), and polar swarm (Pswarm) (Thrun and Ultsch 2020b).
2.2 Projection-Based Clustering
Three steps are necessary for PBC. First, a nonlinear projection method has to be chosen to generate projected points of high-dimensional data points. Second, the generalized U*-matrix has to be applied to the projected points by using a simplified emergent self-organizing map (ESOM) algorithm which is an unsupervised neural network (Thrun 2018). The result is a topographic map (Thrun et al. 2016). Third, the clustering itself is built on top of the topographic map.
First, the projected pointsFootnote 1p ∈ O are transformed to points on a discrete lattice, and the points are called the best-matching units (BMUs) bmu ∈ B ⊂ ℝ2 of the high-dimensional data points j, analogous to the case for general self-organizing map (SOM) algorithms (for details, see Ultsch and Thrun 2017; Thrun 2018).
Next, let M = {m1, …, mn } be the positions of neurons on a 2D lattice (feature map), D a high-dimensional distance, and W = {w(mi) = wi | i = 1, …n}, W ⊂ ℝn the corresponding set of weights or prototypes of neurons, then the simplified SOM training algorithm constructs a nonlinear and topology-preserving mapping of the input space by finding the bmu for each l ∈ I: \( \mathrm{bmu}(l)=\underset{m_i\in M}{\mathrm{argmin}}\left\{D\left(l,{w}_i\right)\right\},i\in \left\{1,\dots, n.\right\} \)
Then, let N(j) be the eight immediate neighbors of mj ∈ M, let wj ∈ W, W ⊂ ℝn be the corresponding prototype to mj, then the average of all distances between prototypes wi
is defined as a height of the generalized U-matrix. If combined with density information as described in Ultsch et al. (2016), the generalized U*-matrix can be computed. The term “generalized” means that instead of using a standard SOM algorithm, a simplified approach is used as described in Thrun (2018), p. 48, Listing 5.1) that enables to use projected points of one of the projection methods. The generalized U-matrix itself is the approximation of the abstract U-matrix (AU-matrix) (Lötsch and Ultsch 2014): Voronoi cells around each projected point define the abstract U-matrix (AU-matrix).
Given a set of bmu’s B in a space ℝn, for every bmui ∈ B, find the set Li of all points of ℝn that are closer to bmui than any other bmu of B
The resulting Voronoi regions Li form a tesselation of ℝn: ℝn = ∪i Li and Li is the Voronoi region of bmui. Given a set of BMUs of B, the Delaunay graph is defined as follows:
Two BMUs, bmui and bmuj, are connected by a Delaunay edge e if and only if there is a point x ∈ ℝn which is equally close to bmui and bmuj, and closer to bmui and bmuj than any other bmuk ∈ B:
bmui and bmuj connected ⇔
Let pj, l be a path between a pair of BMUs {j, l} ∈ O in the output space, and from every bmuj to bmui, a path exists, then the graph \( \mathcal{D} \) is defined as the Delaunay graph.
In every direct neighborhood, all direct connections from the bmul to the bmuj in the output space are weighted using the input-space distances D(l, j), because on each border between two Voronoi cells a height is defined. It was shown in Lötsch and Ultsch (2014) that a single wall of the AU-matrix represents the true distance information between two points in the high-dimensional space. Additionally, valid density information around projected points can be calculated resulting in the AU*-matrix which represents the true distance information between two points weighted by the true density at the midpoint between these two points. The representation is such that high densities shorten the distance and low densities stretch this distance. All possible Delaunay paths pj, l are calculated toroidal because the topographic map is a toroidal visualization generated by the generalized U-matrix as an approximation of the AU-matrix. Then, the minimum of all possible path distances pj, l between a pair of points {j, l} ∈ O in the output space is calculated as the shortest path \( G\left(l,j,\mathcal{D}\right) \) using the algorithm of Dijkstra (1959) resulting in a new high-dimensional distance D∗(l, j).
In prior work and with the help of the graph theory, two types of clusters could be explicitly defined resulting in compact and connected structures (Thrun 2018). Compact structures are mainly defined by inter- versus intracluster distances (Euclidean graph), whereas connected clusters are defined by neighborhood and density of the data which can be described by various other graphs (Thrun 2018).
Two agglomerative processes of clustering, one called connected approach and one compact approach, are defined: Let {j, l} be the two nearest points of the two clusters c1 ⊂ I and c2 ⊂ I, and let D∗(l, j) be the distance as defined above; then, the connected approach is defined with \( S\left({c}_1,{c}_2\right)=\underset{l\in {c}_1,j\in {c}_2}{\min }{D}^{\ast}\left(\mathrm{bm}{\mathrm{u}}_l,\mathrm{bm}{\mathrm{u}}_j\right) \).
In the connected approach, the two clusters with the minimum distance S between the two nearest BMUs of these clusters are merged together until the given number of clusters is reached.
Let cr ⊂ I and cq ⊂ I be two clusters such that r, q ∈ {1, …, k} and cr ∩ cq = { } for r ≠ q, and let the data points in the clusters be denoted by ji ∈ cq and li ∈ cr, with the cardinality of the sets being k = |cq| and p = |cr| and
then, the variance between two clusters is defined as
In the compact approach, the two clusters with the minimal variance S are merged together until the given number of clusters is reached.
Let cr ⊂ I and cq ⊂ I be two clusters such that r, q ∈ {1, …, k} and cr ∩ cq = { } for r ≠ q, and let the data points in the clusters be denoted by ji ∈ cq and li ∈ cr, with the cardinality of the sets being k = |cq| and p = |cr| and
then, the variance between two clusters is defined as
In both hierarchical approaches, a dendrogram can be shown additionally, and the number of clusters is defined as the number of valleys in the topographic map with hypsometric tints (Thrun et al. 2016) which is produced by the generalized U-matrix. Hypsometric tints are surface colors that represent ranges of elevation (Patterson and Kelso 2004). Here, contour lines are combined with a specific color scale. The color scale is chosen to display various valleys, ridges, and basins: blue colors indicate small distances (sea level), green and brown colors indicate middle distances (low hills), and white colors indicate vast distances (high mountains covered with snow and ice). Valleys and basins represent clusters, and the watersheds of hills and mountains represent the borders between clusters. In this 3D landscape, the borders of the visualization are cyclically connected with a periodicity (L,C). The number of clusters can be estimated by the number of valleys of the visualization. The clustering is valid if mountains do not partition clusters indicated by colored points of the same color and colored regions of points (see examples in Sections 4.1 and 4.2).
3 Methods
Thirty-two clustering algorithms are compared with PBC. The clustering algorithms are divided into three groups. The first group is about the combination of DR with clustering investigating nine algorithms and using k-means as a baseline. The second group consists of the algorithms for which the prior literature review indicated that the algorithms are restricted in their reproducibility of cluster structures (cf. Thrun 2018). Five algorithms are investigated, and again, k-means as baseline was chosen. The third group consists of 18 common clustering algorithms with available open-source software. The following three sections introduce the clustering algorithms very shortly. The last section introduced the used datasets. All algorithms are summarized in the R package “FCPS” on CRAN (https://CRAN.R-project.org/package=FCPS).
3.1 Algorithms Combining DR with Clustering
We use the open-source algorithms available on CRAN in the R language (R Development Core Team 2008). For projection pursuit clustering, the “PPCI” package on CRAN is used (https://CRAN.R-project.org/package=PPCI) (Hofmeyr and Pavlidis 2019). In this package, projection pursuit is combined with clustering via MinimumDensity (PPC_MD) (Pavlidis et al. 2016), MaximumClusterbility (PPC_MC) (Hofmeyr and Pavlidis 2015), NormalisedCut (PPC_NC) (Hofmeyr 2016), and a new approach integrating kernel PCA with nonlinear problems is proposed (Kernel_PCA_Clust) (Hofmeyr and Pavlidis 2019).
For tandem clustering, we use the R package “clustrd” on CRAN (https://CRAN.R-project.org/package=clustrd) (Markos et al. 2019) in which RKM and FKM are implemented. As a baseline, simple LBG k-means (Linde et al. 1980) and k-means with initialization procedure 12 (KM_I12) (Steinley and Brusco 2007) were used.
For PBC, the prior knowledge of a classification is used to switch between the connected or compact approach in the case of natural datasets as well as the number of clusters is set, but the advantage of the topographic map is not used. Instead, the PBC is done entirely automatically which we do not recommend for practical use cases. This is necessary to allow for a fair comparison to conventional methods. PBC is available as a CRAN package “ProjectionBasedClustering” (https://CRAN.R-project.org/package=ProjectionBasedClustering).
3.2 Conventional Clustering Algorithms
The algorithms are called conventional because the cluster structures that these algorithms are able to find is well investigated in the literature (cf. Thrun 2018, chapter 3). These clustering algorithms are single linkage (SL) (Florek et al. 1951), spectral clustering (Ng et al. 2002), the Ward algorithm (Ward Jr 1963), the Linde–Buzo–Gray algorithm (LBG k-means) (Linde et al. 1980), partitioning around medoids (PAM) (Kaufman and Rousseeuw 1990), and the mixture of Gaussians (MoG) method with expectation maximization (EM) (Fraley and Raftery 2002) (also known as model-based clustering). ESOM/U-matrix clustering (Ultsch et al. 2016) was omitted because no default clustering settings exist for this method.
For the k-means algorithm, the CRAN R package cclust was used (https://CRAN.R-project.org/package=cclus). For the SL and Ward algorithms, the CRAN R package stats was used. For the Ward algorithm, the option “ward.D2” was used, which is an implementation of the algorithm as described in Ward Jr (1963). For the spectral clustering algorithm, the CRAN R package kernlab was used (https://CRAN.R-project.org/package=kernlab) with the default parameter settings: “The default character string “automatic” uses a heuristic to determine a suitable value for the width parameter of the RBF kernel,” which is a “radial basis kernel function of the “Gaussian” type.” The “Nyström method of calculating eigenvectors” was not used (=FALSE). The “proportion of data to use when estimating sigma” was set to the default value of 0.75, and the maximum number of iterations was restricted to 200 because of the algorithm’s long computation time (on the order of days) for 100 trials using the FCPS datasets. For the MoG algorithm (also known as model-based clustering), the CRAN R package mclust was used (https://CRAN.R-project.org/package=mclust). In this instance, the default settings for the function “Mclust()” were used, which are not specified in the documentation. For the PAM algorithm, the CRAN R package cluster was used (https://CRAN.R-project.org/package=cluster). For every conventional clustering algorithm, the number of clusters is set.
3.3 Algorithms for Benchmarking
The used clustering algorithms for performance benchmarking are listed as follows: self-organizing maps (SOM) (Wehrens and Buydens 2007), ADP clustering (clustering by fast search and find of density peaks) (Rodriguez and Laio 2014), affinity propagation (AP) clustering (Frey and Dueck 2007), DBscan (Ester et al. 1996), fuzzy clustering (Fanny) (Rousseeuw and Kaufman 1990), Markov clustering (Van Dongen 2000), quality clustering (QTC) (Heyer et al. 1999; Scharl and Leisch 2006), self-organizing tree algorithm (SOTA) (Herrero et al. 2001), large application clustering (CLARA) (Rousseeuw and Kaufman 1990), neural gas clustering (Martinetz et al. 1993), on-line update hard competitive learning (HCL clustering) (Dimitriadou 2002), as well as the following hierarchical clustering algorithms: complete linkage (Lance and Williams 1967; Defays 1977), average linkage (Sokol and Michener 1958), Mcquitty linkage (McQuitty 1966), median linkage (Lance and Williams 1966b; Everitt et al. 2011), centroid linkage (Sokol and Michener 1958), and divisive analysis clustering (DIANA) (Rousseeuw and Kaufman 1990). They are summarized in the R package “FCPS” on CRAN (https://CRAN.R-project.org/package=FCPS).
One hundred trials per algorithm and dataset are calculated. All datasets have uniquely unambiguously defined class labels defined by domain experts or artificially. The error rate is defined as 1 − Accuracy (Eq. 3.1 on p. 29, Thrun 2018) which is used as a sum over all true positive–labeled data points by the clustering algorithm. The best of all permutation of labels of the clustering algorithm regarding the accuracy was chosen in every trial because the labels are arbitrarily defined by the algorithms.
3.4 Datasets
The fundamental clustering problems suite (FCPS) is a repository consisting of twelve datasets with known classifications (Thrun and Ultsch 2020a) available in the R package “FCPS” on CRAN. The subset of artificial datasets is intentionally simple enough to be visualized2 (in 2D or 3D) but nevertheless presents a variety of problems that offer useful tests of the performance of clustering algorithms. The cluster structures of FCPS are defined based on the graph theory and summarized in Table 1. The FCPS is extensively described in Thrun and Ultsch (2020a). For the natural high-dimensional datasets of Leukemia (Haferlach et al. 2010) and Tetragonula (Franck et al. 2004), we also refer to Thrun and Ultsch (2020a).
The Wine dataset (Aeberhard et al. 1992), Swiss Banknotes (Flury and Riedwyl 1988), and Iris (Anderson 1935) are described in Thrun (2018). The Cancer dataset consists of 801 subjects with 20,531 random extractions of gene expressions, and it is a part of the RNA-Seq (HiSeq) PANCAN dataset which is maintained by the Cancer Genome Atlas Cancer Analysis Project (Weinstein et al. 2013). The dataset was taken from the UCI machine learning repository (Lichman 2013). An Illumina HiSeq platform measured RNA-Seq gene expression levels. The subjects have different types of tumor: BRCA (300 subjects), KIRC (146 subjects), COAD (78 subjects), LUAD (141 subjects), and PRAD (136 subjects).
Gene expressions which were zero for all subjects were disregarded. The dataset was decorrelated and robust z-transformed. After preprocessing, the high-dimensional dataset had 18,617 dimensions of 801 cases.
The Breast Cancer dataset was taken from the CRAN package “mlbench” (https://CRAN.R-project.org/package=mlbench). It consists of 9 nominal scaled features with 699 cases having either benign or malignant tumor cells. The samples arrived periodically as Dr. Wolberg reports his clinical cases (Wolberg and Mangasarian 1990). Each variable except for the first was converted into 11 primitive numerical attributes with values ranging from 0 through 10. There are 16 missing attribute values which were KNN imputed with k = 7. Unique IDs were chosen as cases, and a small amount of uniform distributed noise was added to prevent distances equal to zero. The robust normalization of Milligan and Cooper (1988) was applied. The resulting dataset had 645 cases of which 413 are benign and 232 are malignant.
“Anderson’s (1935) Iris dataset was made famous by Fisher (1936), who used it to exemplify his linear discriminant analysis. It has since served to demonstrate the performance of many clustering algorithms” (Ritter 2014, p. 220). The Iris dataset consists of data points with prior classification and describes the geographic variation of Iris flowers. The dataset consists of 50 samples from each of three species of Iris flowers, namely, Iris setosa, Iris virginica, and Iris versicolor. Four features were measured for each sample: the lengths and widths of the sepals and petals. The observations have “only two digits of precision preventing general position of the data” (Ritter 2014, p. 220) and “observations 102 and 142 are even equal” (Ritter 2014, p. 220). The I. setosa cluster is well separated, whereas the I. virginica and I. versicolor clusters slightly overlap. This presents “a challenge for any sensitive classifier” (Ritter 2014, p. 220).
“The idea is to produce bills at a cost substantially lower than the imprinted number. This calls for a compromise and forgeries are not perfect” (Ritter 2014, pp. 223–224). “If a bank note is suspect but refined, then it is sent to a money-printing company, where it is carefully examined with regard to printing process, type of paper, water mark, colors, composition of inks, and more. Flury and Riedwyl (1988) had the idea to replace the features obtained from the sophisticated equipment needed for the analysis with simple linear dimensions” (Ritter 2014, p. 224). The Swiss Banknotes dataset consists of six variables measured on 100 genuine and 100 counterfeit old Swiss 1000-franc bank notes. The variables are the length of the bank note, the height of the bank note (measured on the left side), the height of the bank note (measured on the right side), the distance from the inner frame to the lower border, the distance from the inner frame to the upper border, and the length on the diagonal. The robust normalization of Milligan and Cooper (1988) is applied to prevent a few features from dominating the obtained distances.
The Wine dataset (Aeberhard et al. 1992) is a 13-dimensional, real-valued dataset. It consists of chemical measurements of wines grown in the same region in Italy but derived from three different cultivars. The robust normalization of Milligan and Cooper (1988) is applied to prevent a few features from dominating the obtained distances.
All datasets besides Tetragonula have uniquely unambiguously defined class labels; the Golf Ball dataset of FCPS only possesses one class.
3.5 Comparison Approaches
Typically, performance can be compared using box plots for the reason of simplicity if just the range of results is relevant. However, the box plot is unable to visualize multimodalities (Tukey 1977). Therefore, the mirrored density plot (MD plot; Thrun et al. 2020) is used in Section 4.3 because a finer comparison is necessary. The MD plot visualizes a density estimation in a similar way to the violin plot (Hintze and Nelson 1998) or the well-known box plot (Tukey 1977). The MD plot uses for density estimation the Pareto density estimation (PDE) approach (Ultsch 2005b). It was illustrated that comparable methods like ridgeline plots or bean plots have difficulties in visualizing the probability density function in case of uniform, multimodal, skewed, and clipped data if density estimation parameters remain in a default setting (Thrun et al. 2020). In contrast, the MD plot is particularly designed to discover interesting structures in continuous features and can outperform conventional methods (Thrun et al. 2020). The MD plot does not require any adjustments of parameters of density estimation, which makes the usage compelling for nonexperts.
One hundred trials per algorithm and dataset are calculated. All datasets have uniquely unambiguously defined class labels defined by domain experts or artificially. The adjusted Rand index is used for comparison.
4 Results
The results consist of six sections. In the first three sections, the investigation of cluster tendency (also called clusterability, cf. Adolfsson et al. 2019) as well as the derivation of the number of clusters and the compact or connected parameter is presented. In the fourth section, PBC using NerV projection is compared to other clustering approaches combined with dimensionality reduction. In this section, the reference method is k-means used in the first section as well as, additionally, k-means with the best initialization procedure (see Steinley and Brusco 2007). In the fifth section, the performance based on the adjusted Rand index of conventional clustering approaches like single linkage or Ward is compared to PBC using various projection methods with either the compact or the connected approach. In the last section, the overall performance of PBC is compared to 18 typically available clustering methods.
4.1 Cluster Tendency
For a clustering algorithm, it is relevant to test for the absence of a cluster structure (Everitt et al. 2001, p. 180), the so-called clustering tendency (Theodoridis and Koutroumbas 2009, p. 896) or clusterability (Adolfsson et al. 2019). Usually, tests for the clustering tendency rely on statistical tests (Theodoridis and Koutroumbas 2009, p. 896; Adolfsson et al. 2019). Unlike conventional clustering algorithms, the PBC is able to inspect the cluster tendency visually.
One dataset is chosen exemplarily to illustrate this. The Golf Ball dataset does not exhibit distance- or density-based clusters (Ultsch 2005a; Thrun and Ultsch 2020a). Therefore, it is analyzed separately because, except hierarchical algorithms, the common clustering algorithms do not indicate the existence of clusters. This “cluster tendency problem has not received a great deal of attention but is certainly an important problem” (Jain and Dubes 1988, p. 222). In Ultsch and Lötsch (2017), it was shown that the Ward algorithm indicates six clusters, whereas SL indicates two clusters. However, the presence of cluster structures is not confirmed by the topographic map of Pswarm projection method (Fig. 1). Both PBC approaches of Pswarm divide the data points lying in valleys into different clusters and merge the data points into clusters through hills, resulting in cluster borders that are not defined by mountains. Further tests for cluster tendency can be found in Thrun (2018).

The topographic map of the Pswarm projection and (compact) clustering of the Golf Ball dataset. The colors of the best-matching units (BMUs) depend on the result of the clustering. The projection does not indicate a cluster structure. The clustering generates clusters that are not separated by mountains
4.2 Estimating the Number of Clusters
Generally, two approaches are possible to determine either the number of clusters or the clustering quality. Covariance matrices can be calculated, or the intra- versus intercluster distances can be compared to evaluate the homogeneity versus heterogeneity of the clusters. In the literature, a sufficient overview of 15–30 indices has been provided (Dimitriadou et al. 2002; Charrad et al. 2012), and these indices will not be further discussed here. Instead, we would like to point out a visualization approach for estimating the number of clusters by using the topographic map.
Exemplarily, the Tetragonula dataset is chosen where the number of clusters varies depending on the publication (cf. Franck et al. 2004 with Hennig 2014; see also Thrun and Ultsch 2020a). Contrary to prior works, PBC is able to detect a meaningful structure of this high-dimensional dataset by verifying the result with heatmap and silhouette plot and external data of location not used in the cluster analysis (Thrun 2018).
For the PBC approach, we pick the NeRV projection with connected clustering, but the same result can be achieved with the Pswarm projection method (Thrun 2018). The visualization is shown in Fig. 2. The colors of the BMUs depend on the result of the connected clustering.

The topographic map of the NeRV projection of the Tetragonula dataset with PBC. The colors of the points are defined by the clustering. The connected versus the compact structure parameter as well as the number of clusters (13) for the algorithm is chosen by looking at the visualization
4.3 Selecting the Appropriate PBC Approach
The projection of the high-dimensional data of leukemia was performed in the following two figures. Figures 3 and 4 present the topographic map of the generalized U-matrix of the NerV projection. In Fig. 3a left, the BMUs are colored by the clustering defined in the connected clustering approach. In Fig. 4, the compact clustering approach colors the BMUs. In the right of Figs. 3b and 4b, the dendrograms for each clustering approach are visualized. The branches of each dendrogram have the same colors as the BMUs. Each figure uses 6 as the number of clusters. In Fig. 3a left, each cluster lies in a valley, and the outliers lie in a volcano. Therefore, the clustering was performed appropriately with the connected clustering approach. In Fig. 4a left, a cluster is either divided in separate valleys (blue) or several clusters lie in the same valley (e.g., black green). Hence, the compact clustering approach is not appropriate for the leukemia data.

The topographic map of the NerV projection of the Leukemia dataset (left) and the dendrogram of the connected PBC approach (right). Clustering labels are visualized as colors, and the colors on the branches are the same as the colors of best-matching units (BMUs). BMUs with the same color are lying in the same valley. The clustering was performed appropriately

The topographic map of the NerV projection of the Leukemia dataset (left) and the dendrogram of the compact PBC approach (right). Best-matching units (BMUs) with different colors are lying in the same valley. Clustering labels are visualized as colors, and the colors on the branches are the same as the colors of BMUs. The clustering was performed incorrectly w.r.t. to the high-dimensional structures visible in the topographic map
4.4 Comparison to Clustering Combined with Linear Projection
Figure 5 shows the MD plots (Thrun et al. 2020) for artificial datasets of PBC to several algorithms that used dimensionality reduction for preprocessing. Mirrored density plots estimate the distribution of the error rate in percent per compared algorithm allowing for a finer distinction than box plots.

Artificial datasets: MD plots for nine methods in comparison to projection-based clustering (PBC) are shown. The methods KM and KM-ID12 differ in the initialization procedure. Projection-based clustering (PBC) always yields the best possible performance w.r.t. error rate. The performance of algorithms based projection pursuit or PCA is unable to reproduce nonlinear structures and sensitive to outliers Abbreviations: KM (k-means), KM-ID12 (12th Initialization procedure of Steinley and Brusco (2007)), RKM (Reduced k-means), FKM (Factorial k-means), PPC (Projection Pursuit Clustering) with either MD (MinimumDensity), MaximumClusterbility (MC), or NormalisedCut (NC)
The simple k-means and the best-performing k-means of initialization procedure 12 (I12; Steinley and Brusco 2007) are given as baseline. It is visible that the simple k-means and sometimes the ProClus algorithm have different states of errors, whereas the initialization procedure I12 converges to one state of simple k-means. Other algorithms compared are based on either a combination of linear projections with k-means, projection pursuit methods with more elaborate clustering methods described in Hofmeyr and Pavlidis (2019), or subspace clustering algorithms (Aggarwal et al. 1999; Aggarwal and Yu 2000). The error rates of linear projection methods are high on connected structures or compact structures with noise. These methods perform appropriately on compact structures without noise.
Figure 6 presents the MD plot for the six natural datasets. Projection-based clustering (NerV based) is always one of the algorithms that perform best. For the Leukemia and Cancer (Weinstein) datasets, the tandem clustering methods of factorial k-means and reduced k-means and the Orclus algorithm could not be computed due to the high dimensionality of the data.

Natural datasets: MD plots for nine methods in comparison to projection-based clustering (PBC) are shown. The methods KM and KM-ID12 differ in the initialization procedure. If algorithms are missing, then a clustering could not be computed due to the high dimensionality of the data. Abbreviations: KM (k-means), KM-ID12 (12th Initialization procedure of Steinley and Brusco (2007)), RKM (Reduced k-means), FKM (Factorial k-means), PPC (Projection Pursuit Clustering) with either MD (MinimumDensity), MaximumClusterbility (MC) or NormalisedCut (NC)
4.5 Comparison to Conventional Clustering Algorithms
The adjusted Rand index (Hubert and Arabie 1985) of six common clustering algorithms based on 100 trials is compared to the projection-based clustering approach. Due to the high dimensionality, the datasets Leukemia und Cancer were calculated only ten times. The performance is depicted using box plots. Aside from the number of clusters, which is given for each of the artificial FCPS datasets, only the default parameter settings of the clustering algorithms were used as described in the last section. In this comparison, the simple k-means algorithm (LBG) was used, because the elaborate finalization approach I12 (Steinley and Brusco 2007) was not computable in the case of the high-dimensional datasets of Leukemia and Cancer.
It is visible that all clustering algorithms except Ward and single linkage have a variance of results depending on the trial. In Fig. 7, the simple k-means algorithm has the lowest overall adjusted Rand index, and spectral clustering shows the highest variance. On the Hepta and Tetra dataset, PAM and MoG outperform it, and on the Lsun3D dataset, no conventional clustering algorithm is able to find the structures.
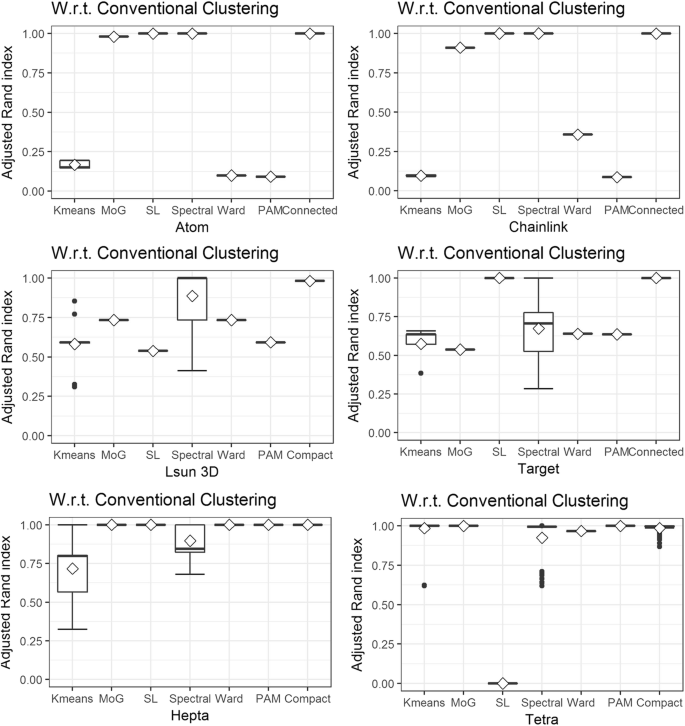
Artificial datasets: Box plots for the six common clustering algorithms in comparison to projection-based clustering are shown. The notch in the box plot shows the mean; if mean and median do not overlap, the values are not normally distributed. Projection-based clustering always yields the best possible performance. The performance of other algorithms changes depending on the dataset. Spectral clustering and K-means sometimes show a high variance of results. Pam is able to find the clusters in 4 out of 6 datasets. Abbreviations: MoG, mixture of Gaussians, for model-based clustering; SL, single linkage
On the artificial datasets, only PBC is able to reproduce the clusters in all datasets. Model-based clustering (MoG) is second best by reproducing the clusters of five datasets.
For the high-dimensional datasets, the k-means and SL algorithms have the lowest adjusted Rand index consistently (Fig. 8). If the SL box plot is missing, then the adjusted Rand index equals zero which happens for all compact cases besides Iris where the SL Rand index is still the (with spectral clustering) lowest. The model-based clustering algorithm (MoG) (Fraley and Raftery 2002) cannot be applied on the Leukemia or Cancer datasets without first using dimensionality reduction methods because the dimensionality of the datasets is too high. It has high values with low variance on Swiss Banknotes and Wine but fails for Iris and Breast Cancer. Spectral clustering has very high values with a low variance for Breast Cancer but fails on Iris, Swiss Banknotes, Cancer, and Leukemia. Ward has a high and stable adjusted Rand index values for Iris, Cancer, and Swiss Banknotes and is outperformed by at least one algorithm in the case of Breast Cancer and Wine. It fails for Leukemia as well as PAM. PAM has a low variance of results but has low adjusted Rand index values on Leukemia and Wine and is outperformed in every dataset by at least one clustering algorithm.
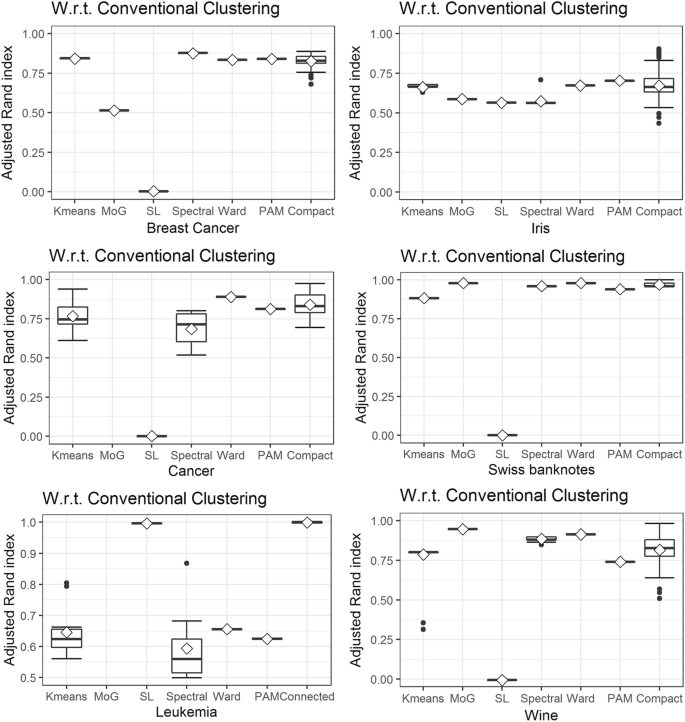
Natural datasets: Box plots for the six common clustering algorithms in comparison to projection-based clustering are shown. The notch in the box plot shows the mean; if mean and median do not overlap, the values are not normally distributed. Due to the high dimensionality of the Leukemia and Cancer dataset, the MoG approach could not be computed. The performance of conventional clustering algorithms changes depending on the dataset. PBCpossess (NerV based) has the possibility to outperform the best conventional clustering algorithm for Breast Cancer, Cancer, Swiss Banknotes, Iris, and Wine. For Leukemia, it slightly outperforms SL. Abbreviations: MoG, mixture of Gaussians, for model-based clustering; SL, single linkage
In comparison to the six conventional algorithms, PBC has the best overall performance but has a high variance of results for Breast Cancer, Iris, Cancer, and Wine. For the Iris dataset, it is the only algorithm with the ability to catch the predefined clusters correctly. Its Rand index is slightly higher than SL in the case of Leukemia. Table 1 provides an overview of the large variety of cluster structures alongside the algorithms with the best results regarding the highest Rand index and error rate with the lowest variance for each dataset.
4.6 Benchmarking of 18 Clustering Algorithms
In Figs. 9, 10, 11, 12, 13, 14, 15, 16, 17, 18, 19, 20, 21, 22, and 23, the performance of 18 clustering algorithms and PBC is illustrated with box plots. The performance is shown using the error rate, which is one minus accuracy of the clustering compared to the prior classification. The abbreviations for the used clustering algorithms are in brackets as follows: self-organizing map clustering (SOM) (Wehrens and Buydens 2007), clustering by fast search and find of density peaks (ADP) (Rodriguez and Laio 2014), affinity propagation clustering (AP) (Frey and Dueck 2007), projection-based clustering (PBC), DBscan (Ester et al. 1996), fuzzy clustering (Fanny) (Rousseeuw and Kaufman 1990), Markov clustering (Van Dongen 2000), model-based clustering (mixture of Gaussians—MoG) (Fraley and Raftery 2002, 2006), quality clustering (QT) (Heyer et al. 1999; Scharl and Leisch 2006), self-organizing tree algorithm (SOTA) (Herrero et al. 2001), large application clustering (CLARA) (Rousseeuw and Kaufman 1990), neural gas clustering (Martinetz et al. 1993), on-line update hard competitive learning (HCL) (Dimitriadou et al. 2002), partitioning around medoids (PAM), hierarchical clusterings of complete linkage (Lance and Williams 1967; Defays 1977), average linkage (Sokol and Michener 1958), McQuitty (1966) linkage, median linkage (Lance and Williams 1966a; Everitt et al. 2011), centroid linkage (Sokol and Michener 1958), and divisive analysis clustering (DIANA) (Rousseeuw and Kaufman 1990). Projection-based clustering (Pswarm based) is the only algorithm that is able to reproduce the cluster structure of all 12 datasets, although in some of them, a variance of results is visible.

Box plots show the performance of 18 clustering algorithms of the Atom dataset. The abbreviations are defined in section 3.3. Best-performing algorithms are PBC, DBscan, and FannyC

Box plots show the performance of 18 clustering algorithms of the Chainlink dataset. Best-performing algorithms are PBC and DBscan

Box plots show the performance of 18 clustering algorithms of the EngyTime dataset. Best-performing algorithms are PBC, ADP, Diana, and Clara

Box plots show the performance of 18 clustering algorithms of the Hepta dataset. Algorithms being unable to reproduce these structures are Diana and HCL

Box plots show the performance of 18 clustering algorithms of the Lsun3D dataset. Best-performing algorithms are PBC and CentroidL

Box plots show the performance of 18 clustering algorithms of the Target dataset. The best-performing algorithm is PBC

Box plots show the performance of 18 clustering algorithms of the Tetra dataset. Algorithms unable to reproduce these cluster structures are AP, DBscan, Diana, FannyC, MedianL, QTC, and SOTA

Box plots show the performance of 18 clustering algorithms of the TwoDiamonds dataset. Algorithms unable to reproduce these cluster structures are AP, MedianL, QTC, and SOTA

Box plots show the performance of 18 clustering algorithms of the WingNut dataset. Algorithms unable to reproduce these cluster structures are ADP, AP, CompleteL, DBscan, and QTC

Box plots show the performance of 18 clustering algorithms of the Breast Cancer dataset. Algorithms unable to reproduce these cluster structures are AP, CentroidL, CompleteL, DBscan, MarkovC, MCquittyL, Median, and QTC

Box plots show the performance of 18 clustering algorithms of the Iris dataset. The best-performing algorithm is PBC

Box plots show the performance of 18 clustering algorithms of the Leukemia dataset. Best-performing algorithms are PBC, ADP, AverageL, CompleteL, Diana, and MCquittyL

Box plots show the performance of 18 clustering algorithms of the Swiss Banknotes dataset. Algorithms unable to reproduce these cluster structures are AP, AverageL, CentroidL, CompleL, DBscan, MarkovC, and QTC

Box plots show the performance of 18 clustering algorithms of the Cancer dataset. Best-performing algorithms are PBC, Clara, NeuralGas, and SOTA

Box plots show the performance of 18 clustering algorithms for the Wine dataset. Best-performing algorithms are PBC, ADP, CompeteL, and NeuralGas
5 Discussion
This work compared 32 clustering algorithms on a benchmark system of artificial datasets and natural datasets. The prior classification of every dataset was based on distance- and density-based cluster structures. It is clearly visible that by defining an objective function or so-called criterion for clustering, the algorithms implicitly assume a structure type, and if distance- and density-based clusters are sought, different clustering methods tend to implicitly assume different structures (Duda et al. 2001, pp. 537, 542, 551; Everitt et al. 2001, pp. 61, 177; Handl et al. 2005; Theodoridis and Koutroumbas 2009, pp. 862, 896; Ultsch and Lötsch 2017). Therefore, besides PBC, none of the investigated clustering algorithms was able to reproduce every prior classification in every trial.
5.1 Discussion of Cluster Structures
PBC is able to reproduce the large variety of cluster structures listed in Table 1 by using the definition of compact versus connected cluster structures with one Boolean parameter to be set. It is apparently visible that the result of other clustering algorithm depends on the structures of the low-dimensional dataset if the compact or connected clusters are sought. It seems that clustering algorithms that search for compact structures have difficulties with outliers (Lsun3D), whereas clustering algorithms that search for connected structures may catch outliers (SL on the target dataset).
If the structures are predefined as it is the case for artificial datasets, the duality of compact versus connected clustering is visible for conventional clustering algorithms except for Hepta and Tetra datasets. In the case of Hepta, clustering methods (e.g., SL) that search for clusters with connected structures can find the compact clusters because the distance between clusters is vast and the density between clusters is very low. Contrary to expectation (Duda et al. 2001; Ng et al. 2002, p. 5), spectral clustering is often but not always able to find the structures of the Tetra dataset. However, PAM or even k-means remain the better choice which was expected (Duda et al. 2001, p. 542; Handl et al. 2005, p. 3202; Kaufman and Rousseeuw 2005; Mirkin 2005, p. 108; Theodoridis and Koutroumbas 2009, p. 742; Hennig 2015, p. 61). A summary of such an assumption found in the literature can be found in Thrun (2018). Besides Tetra, simple k-means is consistently the worst-performing algorithm, and spectral clustering fails if outliers are present in a dataset. K-means with the initialization procedure I12 (Steinley and Brusco 2007) performs better on compact spherical structures with nonoverlapping hulls than simple k-means. However, in the case of connected structures or noise defined by outliers, only the variance is reduced, but the overall performance is not improved. Combining k-means with linear projections (RKM, FKM) resulted in worse performance compared to simple k-means. Other clustering methods based on linear projection methods like projection pursuit (e.g., Hofmeyr and Pavlidis 2015; Hofmeyr 2016; Pavlidis et al. 2016; Hofmeyr and Pavlidis 2019) were unable to reproduce connected structures or compact structures with noise and varying geometric shapes. The exception was clustering based on kernel PCA, which was able to reproduce the cluster structure of overlapping convex hulls in the case of the 2D dataset (because no DR was performed) but not in the case of the 3D dataset and failed on all other cluster structures. Specific subspace clustering performed well for specific connected structures of the artificial datasets. However, subspace clustering was most often not able to reproduce the given cluster structures for the natural datasets investigated. PBC outperformed k-means, Tandem Clustering, and projection pursuit clustering on Iris, Leukemia, Weinstein, and Wine but had a small variance depending on the dataset. In praxis, this variance has to be accounted for using the topographic map. Even though PBC was able to reproduce the cluster structures of the datasets Swiss Banknotes and Breast Cancer, k-means and several approaches of projection pursuit clustering reproduced these structures without a variance. Kernel PCA-based clustering and FKM performed worst in the high-dimensional setting. Overall, it seems that projection pursuit clustering has the smallest variance but is able to reproduce only specific cluster structures that fit their underlying clustering criteria. In contrast, projection-based clustering always has an excellent chance to reproduce the high-dimensional cluster structures entirely but sometimes has a small variance in its results.
The question arises if one can predict if methods that are well investigated in the literature can reproduce specific cluster structures based on the artificial datasets selected. Based on the selection, it can be assumed that either k-means I12, PAM, PBC, or MoG performs well on compact spherical cluster structures. On connected structures, SL and PBC are preferable if outliers are present. If no outliers exist, then spectral clustering or MoG can be considered.
To provide a more general answer in case of higher dimensions is challenging because model-based clustering (MoG) cannot be applied in two cases due to high dimensionality of the data and spectral clustering does not work well for the Leukemia dataset. It seems that besides the cluster structure type, the dimensionality of the data could influence the performance of some algorithms like spectral clustering or kernel PCA-based clustering. In the case of the Leukemia dataset, the reason could also be the occurrence of small clusters, which are essential from the topical perspective (cf. Thrun and Ultsch 2020a). In the case of connected cluster structures with noise defined by outliers or small clusters again, single linkage and PBC performed well.
Interestingly, the variance of results for spectral clustering was very high on several datasets which to the knowledge of the authors was not reported before. Also, the variance of clustering of simple k-means was extremely high although the structures were compact. It seems that the choice of centroids is a crucial factor and that either elaborate but computation-intensive initialization procedure is required or the faster PAM algorithm is the preferable approach if compact spherical structures are sought. The topographic map verifies the existence or absence of distance- and density-based structures of the connected or compact PBC approach. Contrary to Ultsch et al. (2016), the PBC is not based on density information coded in the P-matrix and various parameters of the ESOM algorithm because by choosing the right projection method the connected clustering itself is already able to find density-based structures. Moreover, the combination of the topographic map and a projection method can be used as an unsupervised index to verify the result of a conventional clustering algorithm. If prior knowledge of the dataset to be analyzed is available, then a projection method can be appropriately chosen with regard to the structures. However, the choice of the projection method is critical for the result of PBC because of the used objective function of the projection method uses. Additionally, there can be a variance of results depending on the method. It is still difficult to evaluate if the clusters are disrupted in the visualization. If the projection method is nontoroidal, it could disrupt the clusters, then the PBC approach will fail. This work showed that these problems also exist in most other conventional algorithms. If no prior knowledge of the high-dimensional structures are known beforehand to choose the right objective function, the toroidal Pswarm projection method (Thrun and Ultsch 2020b) seems to be a right choice, because it does not possess an objective function and is, therefore, able, through the concept of emergence (Kim 2006; Ultsch 2007), to find structures.
5.2 Discussion of Overall Performance
This work showed that by keeping in mind the two main types of cluster structures sought, Projection-based clustering (PBC) always performs and is the best conventional clustering algorithm and, in some cases, can even outperform conventional algorithms. The best conventional clustering algorithm varies depending on the dataset. The reason for the reliable performance of PBC is the prior selection of the Boolean parameter of either compact or connected using the topographic map. In comparison to the conventional algorithms, further enhancement is the ability to investigate the cluster tendency or so-called clusterability and the possibility to derive the number of clusters by counting the number of valleys in the topographic map.
There are several clustering algorithms that have an inferior performance on most of the datasets investigated. For example, quality clustering and subspace clustering was not able to reproduce structure for most artificial datasets and not often computable for datasets with high dimensionality (e.g., Leukemia, Cancer). Affinity propagation performed only well on low-dimensional spherical compact cluster structures. Additionally, it seems that the usage of box plots presents the performance of algorithms very coarse in comparison to the Mirrored-density plot, which reveals subtle effects.
In sum, all comparisons indicate that algorithms have either a small variance of results but specialize on specific cluster structures or have a significant variance and sometimes can reproduce a variety of cluster structures. PBC reproduces all given cluster structures through the coexistence of projection and clustering. However, it is strongly suggested to manually investigate the topographic map instead of using the fully automatic PBC compared in this work in order to account for the variance of results depending on the trial and projection method.
6 Conclusion
In concordance with literature, this work illustrated that the common clustering algorithm implicitly assumes different types of structures, if distance- and density-based clusters are sought. The types of clusters can be described as compact and connected structure types. Compact structures are mainly defined by inter- versus intracluster distances, whereas connected clusters are defined by neighborhood and density of the data.
In projection-based clustering, the structure types and the number of clusters can be estimated by counting the valleys in a topographic map as well as from a dendrogram. If the number of clusters and the projection method are chosen correctly, then the clusters will be well separated by mountains in the visualization. Outliers are represented as volcanoes and can be also interactively marked in the visualization after the automated clustering process.
In sum, projection-based clustering, is a flexible and robust clustering framework which always performs and is the best conventional clustering algorithm which varies depending on the dataset. Its main advantage is the human-understandable visualization by a topographic map which internally enables the user to evaluate the cluster tendency and even interactively improve the cluster quality of a dataset. The method is implemented in the R package “ProjectionBasedClustering” on CRAN.
Notes
Or DataBot positions on the hexagonal grid of Pswarm.
References
Adolfsson, A., Ackerman, M., & Brownstein, N. C. (2019). To cluster, or not to cluster: an analysis of clusterability methods. Pattern Recognition, 88, 13–26.
Aeberhard, S., Coomans, D., & De Vel, O. (1992). Comparison of classifiers in high dimensional settings, technical report 92–02. North Queensland: James Cook University of North Queensland, Department of Computer Science and Department of Mathematics and Statistics.
Aggarwal, C.C., Wolf, J.L., Yu, P.S., Procopiuc, C., & Park, J.S. (1999). Fast algorithms for projected clustering. Proc. ACM SIGMOD International Conference on Management of Data (Vol. 28, pp. 61–72) Philadelphia, Pennsylvania: Association for Computing Machinery.
Aggarwal, C. C., & Yu, P. S. (2000). Finding generalized projected clusters in high dimensional spaces. In Proceedings of the ACM SIGMOD international conference on management of data (pp. 70–81). New York: ACM.
Agrawal, R., Gehrke, J., Gunopulos, D., & Raghavan, P. (1998). Automatic subspace clustering of high dimensional data for data mining applications. In Proceedings of the ACM SIGMOD international conference on management of data (pp. 94–105). Seattle: ACM.
Anderson, E. (1935). The Irises of the Gaspé Peninsula. Bulletin of the American Iris Society, 59, 2–5.
Arabie, P., & Hubert, L. (1994). Cluster analysis in marketing research. In R. P. Bagozzi (Ed.), Advanced methods of marketing research (pp. 160–189). Oxford, England: Blackwell Business.
Arabie, P., Hubert, L. J., & De Soete, G. (1996). Clustering and classification. Singapore: World Scientific.
Aupetit, M. (2007). Visualizing distortions and recovering topology in continuous projection techniques. Neurocomputing, 70, 1304–1330.
Bock, H. H. (1987). On the interface between cluster analysis, principal component analysis, and multidimensional scaling. In H. Bozdogan & A. K. Gupta (Eds.), Multivariate statistical modeling and data analysis (pp. 17–34). Dordrecht: Springer.
Bonner, R. E. (1964). On some clustering technique. IBM Journal of Research and Development, 8, 22–32.
Chang, W. C. (1983). On using principal components before separating a mixture of two multivariate normal distributions. Journal of the Royal Statistical Society: Series C: Applied Statistics, 32, 267–275.
Charrad, M., Ghazzali, N., Boiteau, V., & Niknafs, A. (2012). NbClust: An R Package for determining the relevant number of clusters in a data set. Journal of statistical Software, 61(6),1–36. https://doi.org/10.18637/jss.v061.i06
Comon, P. (1992). Independent component analysis. In J. Lacoume (Ed.), Higher-order statistics (pp. 29–38). Amsterdam: Elsevier.
Dasgupta, S., & Gupta, A. (2003). An elementary proof of a theorem of Johnson and Lindenstrauss. Random Structures & Algorithms, 22, 60–65.
De Soete, G., & Carroll, J. D. (1994). K-means clustering in a low-dimensional Euclidean space. In E. Diday, Y. Lechevallier, M. Schader, P. Bertrand, & B. Burtschy (Eds.), New approaches in classification and data analysis (pp. 212–219). Berlin: Springer.
Defays, D. (1977). An efficient algorithm for a complete link method. The Computer Journal, 20, 364–366.
Demartines, P., & Hérault, J. (1995). CCA: “curvilinear component analysis”. In 15° Colloque sur le Traitement du Signal et des Images (pp. 921–924). France: GRETSI, Groupe d’Etudes du Traitement du Signal et des Images.
Dijkstra, E. W. (1959). A note on two problems in connexion with graphs. Numerische Mathematik, 1, 269–271.
Dimitriadou, E. (2002). cclust–convex clustering methods and clustering indexes. R Package Version 0.6-21.
Dimitriadou, E., Dolničar, S., & Weingessel, A. (2002). An examination of indexes for determining the number of clusters in binary data sets. Psychometrika, 67, 137–159.
Duda, R. O., Hart, P. E., & Stork, D. G. (2001). Pattern classification. New York: Wiley.
Ester, M., Kriegel, H.-P., Sander, J., & Xu, X. (1996). A density-based algorithm for discovering clusters in large spatial databases with noise. Proc. Second International Conference on Knowledge Discovery and Data Mining (KDD 96) (Vol. 96, pp. 226–231). Portland, Oregon: AAAI Press.
Everitt, B. S., Landau, S., & Leese, M. (2001). Cluster analysis. London: Arnold.
Everitt, B. S., Landau, S., Leese, M., & Stahl, D. (2011). Hierarchical clustering. In B. S. Everitt, S. Landau, M. Leese, & D. Stahl (Eds.), Cluster analysis (5th ed., pp. 71–110). New York: Wiley.
Fisher, R. A. (1936). The use of multiple measurements in taxonomic problems. Annals of Eugenics, 7, 179–188.
Florek, K., Łukaszewicz, J., Perkal, J., Steinhaus, H., & Zubrzycki, S. (1951). Sur la liaison et la division des points d'un ensemble fini. Proc. Colloquium Mathematicae (Vol. 2, pp. 282–285). Institute of Mathematics Polish Academy of Sciences.
Flury, B., & Riedwyl, H. (1988). Multivariate statistics, a practical approach. London: Chapman and Hall.
Fraley, C., & Raftery, A. E. (2002). Model-based clustering, discriminant analysis, and density estimation. Journal of the American Statistical Association, 97, 611–631.
Fraley, C., & Raftery, A.E. (2006). MCLUST version 3: an R package for normal mixture modeling and model-based clustering Vol. Technical Report No. 504, Department of Statistics, University of Washington, Seattle.
Franck, P., Cameron, E., Good, G., Rasplus, J. Y., & Oldroyd, B. P. (2004). Nest architecture and genetic differentiation in a species complex of Australian stingless bees. Molecular Ecology, 13, 2317–2331.
Frey, B. J., & Dueck, D. (2007). Clustering by passing messages between data points. Science, 315, 972–976.
Ge, R., Ester, M., Jin, W., & Davidson, I. (2007). Constraint-driven clustering Proc. 13th ACM SIGKDD International Conference on Knowledge Discovery and Data Mining (KDD 07) (pp. 320–329). San Jose, California: Association for Computing Machinery.
Haferlach, T., Kohlmann, A., Wieczorek, L., Basso, G., Te Kronnie, G., Béné, M.-C., De Vos, J., Hernández, J. M., Hofmann, W.-K., & Mills, K. I. (2010). Clinical utility of microarray-based gene expression profiling in the diagnosis and subclassification of leukemia: report from the international microarray innovations in leukemia study group. Journal of Clinical Oncology, 28, 2529–2537.
Handl, J., Knowles, J., & Kell, D. B. (2005). Computational cluster validation in post-genomic data analysis. Bioinformatics, 21, 3201–3212.
Hennig, C. (2014). How many bee species? A case study in determining the number of clusters. In M. Spiliopoulou, L. Schmidt-Thieme, & R. Janning (Eds.), Data analysis, machine learning and knowledge discovery (pp. 41–49). Berlin: Springer.
Hennig, C. (2015). Handbook of cluster analysis. New York: Chapman & Hall/CRC.
Herrero, J., Valencia, A., & Dopazo, J. (2001). A hierarchical unsupervised growing neural network for clustering gene expression patterns. Bioinformatics, 17, 126–136.
Heyer, L. J., Kruglyak, S., & Yooseph, S. (1999). Exploring expression data: identification and analysis of coexpressed genes. Genome Research, 9, 1106–1115.
Hinton, G. E., & Roweis, S. T. (2002). Stochastic neighbor embedding. In Advances in neural information processing systems (pp. 833–840). Cambridge: MIT Press.
HINTZE, J. L., & NELSON, R. D. (1998). Violin plots: a box plot-density trace synergism. The American Statistician, 52, 181–184.
Hofmeyr, D., & Pavlidis, N. (2015). Maximum clusterability divisive clustering. In 2015 IEEE symposium series on computational intelligence (pp. 780–786). Piscataway, NJ: IEEE.
Hofmeyr, D., & Pavlidis, N. (2019). PPCI: an R package for cluster identification using projection pursuit. The R Journal, 11, 152.
Hofmeyr, D. P. (2016). Clustering by minimum cut hyperplanes. IEEE Transactions on Pattern Analysis and Machine Intelligence, 39, 1547–1560.
Hotelling, H. (1933). Analysis of a complex of statistical variables into principal components. Journal of Educational Psychology, 24, 417–441.
Hubert, L., & Arabie, P. (1985). Comparing partitions. Journal of Classification, 2, 193–218.
Jain, A. K., & Dubes, R. C. (1988). Algorithms for clustering data. Englewood Cliffs: Prentice Hall College Div.
Johnson, W. B., & Lindenstrauss, J. (1984). Extensions of Lipschitz mappings into a Hilbert space. Contemporary Mathematics, 26(1), 189–206.
Kaufman, L., & Rousseeuw, P. J. (1990). Partitioning around medoids (program PAM). In L. Kaufman & P. J. Rousseeuw (Eds.), Finding groups in data: An introduction to cluster analysis (pp. 68–125). Hoboken, NJ: Wiley.
Kaufman, L., & Rousseeuw, P. J. (2005). Finding groups in data: an introduction to cluster analysis. Hoboken: Wiley.
Kim, J. (2006). Emergence: core ideas and issues. Synthese, 151, 547–559.
Kleinberg, J. (2003). An impossibility theorem for clustering. In Advances in neural information processing systems (pp. 463–470). Vancouver, British Columbia: MIT Press.
Lance, G. N., & Williams, W. T. (1966a). Computer programs for hierarchical polythetic classification (“similarity analyses”). The Computer Journal, 9, 60–64.
Lance, G. N., & Williams, W. T. (1966b). A generalized sorting strategy for computer classifications. Nature, 212, 218.
Lance, G. N., & Williams, W. T. (1967). A general theory of classificatory sorting strategies: 1. Hierarchical systems. The Computer Journal, 9, 373–380.
Lichman, M. (2013). UCI machine learning repository. Irvine: University of California, School of Information and Computer Science.
Linde, Y., Buzo, A., & Gray, R. (1980). An algorithm for vector quantizer design. IEEE Transactions on Communications, 28, 84–95.
Lötsch, J., & Ultsch, A. (2014). Exploiting the structures of the U-matrix. In Advances in self-organizing maps and learning vector quantization (pp. 249–257). Mittweida: Springer International Publishing.
Markos, A., Iodice D’Enza, A., & van de Velden, M. (2019). Beyond tandem analysis: joint dimension reduction and clustering in R. Journal of Statistical Software (Online), 91, 1–24.
Martinetz, T. M., Berkovich, S. G., & Schulten, K. J. (1993). ‘Neural-gas’ network for vector quantization and its application to time-series prediction. IEEE Transactions on Neural Networks, 4, 558–569.
McQuitty, L. L. (1966). Similarity analysis by reciprocal pairs for discrete and continuous data. Educational and Psychological Measurement, 26, 825–831.
Milligan, G. W., & Cooper, M. C. (1988). A study of standardization of variables in cluster analysis. Journal of Classification, 5, 181–204.
Mirkin, B. G. (2005). Clustering: a data recovery approach. Boca Raton: Chapman & Hall/CRC.
Ng, A. Y., Jordan, M. I., & Weiss, Y. (2002). On spectral clustering: analysis and an algorithm. Advances in Neural Information Processing Systems, 2, 849–856.
Niu, D., Dy, J., & Jordan, M. (2011). Dimensionality reduction for spectral clustering. In Gordon, G., Dunson, D. & Dudík, M. (eds.), Proc. Fourteenth International Conference on Artificial Intelligence and Statistics (Vol. 15, pp. 552–560). Fort Lauderdale, FL: PMLR.
Patterson, T., & Kelso, N. V. (2004). Hal Shelton revisited: designing and producing natural-color maps with satellite land cover data. Cartographic Perspectives, 47, 28–55.
Pavlidis, N. G., Hofmeyr, D. P., & Tasoulis, S. K. (2016). Minimum density hyperplanes. The Journal of Machine Learning Research, 17, 5414–5446.
Pearson, K. (1901). LIII. On lines and planes of closest fit to systems of points in space. The London, Edinburgh, and Dublin Philosophical Magazine and Journal of Science, 2, 559–572.
R Development Core Team. (2008). R: a language and environment for statistical computing (Version 3.2.5). Vienna: R Foundation for Statistical Computing Retrieved from http://www.R-project.org.
Ritter, G. (2014). Robust cluster analysis and variable selection. Passau: Chapman & Hall/CRC.
Rodriguez, A., & Laio, A. (2014). Clustering by fast search and find of density peaks. Science, 344, 1492–1496.
Rousseeuw, P. J., & Kaufman, L. (1990). Finding groups in data. Brussels: Wiley.
Scharl, T., & Leisch, F. (2006). The stochastic QT-clust algorithm: evaluation of stability and variance on time-course microarray data. In Proceedings in computational statistics (Compstat) (pp. 1015–1022). Heidelberg: Physica Verlag.
Sokol, R. R., & Michener, C. D. (1958). A statistical method for evaluating systematic relationships. Univ Kansas Science Bulletin, 28, 1409–1438.
Steinley, D., & Brusco, M. J. (2007). Initializing k-means batch clustering: a critical evaluation of several techniques. Journal of Classification, 24, 99–121.
Steinley, D., Brusco, M. J., & Henson, R. (2012). Principal cluster axes: a projection pursuit index for the preservation of cluster structures in the presence of data reduction. Multivariate Behavioral Research, 47, 463–492.
Theodoridis, S., & Koutroumbas, K. (2009). Pattern recognition. Montreal: Elsevier.
Thrun, M. C. (2018). Projection based clustering through self-organization and swarm intelligence. Heidelberg: Springer.
Thrun, M.C., Gehlert, T., & Ultsch, A. (2020). Analyzing the fine structure of distributions. Preprint available at arXiv.org, PLOS ONE, in revision arXiv:1908.06081.
Thrun, M.C., Lerch, F., Lötsch, J., & Ultsch, A. (2016). Visualization and 3D printing of multivariate data of biomarkers. In International conference in Central Europe on computer graphics, visualization and computer vision (WSCG) (pp. 7–16). Plzen.
Thrun, M. C., & Ultsch, A. (2020a). Clustering benchmark datasets exploiting the fundamental clustering problems. Data in Brief, 30 C, 105501. https://doi.org/10.1016/j.dib.2020.105501.
Thrun, M. C., & Ultsch, A. (2020b). Swarm intelligence for self-organized clustering. Journal of Artificial Intelligence, 103237. https://doi.org/10.1016/j.artint.2020.103237.
Timmerman, M. E., Ceulemans, E., Kiers, H. A., & Vichi, M. (2010). Factorial and reduced K-means reconsidered. Computational Statistics & Data Analysis, 54, 1858–1871.
Torgerson, W. S. (1952). Multidimensional scaling: I. Theory and method. Psychometrika, 17, 401–419.
Tukey, J. W. (1977). Exploratory data analysis. Reading: United States Addison-Wesley Publishing Company.
Tung, A. K.., Han, J., Lakshmanan, L. V., & Ng, R.T. (2001). Constraint-based clustering in large databases. In Van den Bussche, J. & Vianu, V. (eds.), Proc. International Conference on Database Theory (ICDT) (Vol. 1973, pp. 405-419). Berlin, Heidelberg, London: Springer.
Ultsch, A. (1995). Self organizing neural networks perform different from statistical k-means clustering. Proc. society for information and classification (GFKL) (Vol. 1995). Basel.
Ultsch, A. (2005a). Clustering wih SOM: U*C. In Proceedings of the 5th workshop on self-organizing maps (pp. 75–82), Paris, France.
Ultsch, A. (2005b). Pareto density estimation: A density estimation for knowledge discovery. In D. BAIER & K. D. Werrnecke (Eds.), Innovations in classification, data science, and information systems (pp. 91–100). Berlin, Germany: Springer.
Ultsch, A. (2007). Emergence in self-organizing feature maps. In 6th workshop on self-organizing maps (WSOM 07) (pp. 1–7). Bielefeld, Germany: University Library of Bielefeld.
Ultsch, A., Behnisch, M., & Lötsch, J. (2016). ESOM visualizations for quality assessment in clustering. In E. Merényi, J. M. Mendenhall, & P. O’Driscoll (Eds.), Advances in self-organizing maps and learning vector quantization: proceedings of the 11th international workshop WSOM 2016, Houston, Texas, USA, January 6–8, 2016 (pp. 39–48). Cham: Springer International Publishing.
Ultsch, A., & Herrmann, L. (2005). The architecture of emergent self-organizing maps to reduce projection errors. In Verleysen, M. (Ed.), Proc. European Symposium on Artificial Neural Networks (ESANN) (pp. 1–6). Belgium: Bruges.
Ultsch, A., & Lötsch, J. (2017). Machine-learned cluster identification in high-dimensional data. Journal of Biomedical Informatics, 66, 95–104.
Ultsch, A., & Thrun, M. C. (2017). Credible visualizations for planar projections. In 12th international workshop on self-organizing maps and learning vector quantization, clustering and data visualization (WSOM) (pp. 1–5). Nany: IEEE.
Ultsch, A., & Vetter, C. (1995). Self organizing neural networks perform different from statistical k-means clustering Proc. Society for Information and Classification (GFKL) (Vol. 1995) Basel 8th-10th.
van der Maaten, L. J. P., Postma, E. O., & van den Herik, H. J. (2009). Dimensionality reduction: A comparative review. Journal of Machine Learning Research, 10, 66–71.
Van Dongen, S.M. (2000). Graph clustering by flow simulation. Utrecht, Netherlands: Ph.D. thesis University of Utrecht.
Venna, J., Peltonen, J., Nybo, K., Aidos, H., & Kaski, S. (2010). Information retrieval perspective to nonlinear dimensionality reduction for data visualization. The Journal of Machine Learning Research, 11, 451–490.
Vichi, M., & Kiers, H. A. L. (2001). Factorial k-means analysis for two-way data. Computational Statistics & Data Analysis, 37, 49–64.
Ward Jr., J. H. (1963). Hierarchical grouping to optimize an objective function. Journal of the American Statistical Association, 58, 236–244.
Wehrens, R., & Buydens, L. M. C. (2007). Self-and super-organizing maps in R: the Kohonen package. Journal of Statistical Software, 21, 1–19.
Weinstein, J. N., Collisson, E. A., Mills, G. B., Shaw, K. R. M., Ozenberger, B. A., Ellrott, K., Shmulevich, I., Sander, C., Stuart, J. M., & Cancer Genome Atlas Research Network. (2013). The cancer genome atlas pan-cancer analysis project. Nature Genetics, 45, 1113–1120.
Wickham, H., & Stryjewski, L. (2011). 40 years of boxplots. The American Statistician.
Wolberg, W. H., & Mangasarian, O. L. (1990). Multisurface method of pattern separation for medical diagnosis applied to breast cytology. Proceedings of the National Academy of Sciences of the United States of America, 87, 9193–9196.
Zhang, B. (2001). Dependence of clustering algorithm performance on clustered-ness of data, technical report HPL-2000-137. Palo Alto: Hewlett-Packard Labs.
Acknowledgments
Special acknowledgment goes to Prof. Torsten Haferlach, MLL (Münchner Leukämielabor) and Prof Andreas Neubauer, Univ. Marburg for data acquisition and provision of the leukemia dataset.
Funding
Open Access funding provided by Projekt DEAL.
Author information
Authors and Affiliations
Corresponding author
Ethics declarations
Dr. Cornelia Brendel, in accordance with the Declaration of Helsinki, obtained patient consent for this dataset and the Marburg local ethics board approved the study (No. 138/16).
Additional information
Publisher’s Note
Springer Nature remains neutral with regard to jurisdictional claims in published maps and institutional affiliations.
Rights and permissions
Open Access This article is licensed under a Creative Commons Attribution 4.0 International License, which permits use, sharing, adaptation, distribution and reproduction in any medium or format, as long as you give appropriate credit to the original author(s) and the source, provide a link to the Creative Commons licence, and indicate if changes were made. The images or other third party material in this article are included in the article's Creative Commons licence, unless indicated otherwise in a credit line to the material. If material is not included in the article's Creative Commons licence and your intended use is not permitted by statutory regulation or exceeds the permitted use, you will need to obtain permission directly from the copyright holder. To view a copy of this licence, visit http://creativecommons.org/licenses/by/4.0/.
About this article

Cite this article
Thrun, M.C., Ultsch, A. Using Projection-Based Clustering to Find Distance- and Density-Based Clusters in High-Dimensional Data. J Classif 38, 280–312 (2021). https://doi.org/10.1007/s00357-020-09373-2
Published:
Issue Date:
DOI: https://doi.org/10.1007/s00357-020-09373-2