
Abstract
The sustainable developments goals (SDGs) introduced monitoring of drinking water quality to the international development agenda. At present, Escherichia coli are the primary measure by which we evaluate the safety of drinking water from an infectious disease perspective. Here, we propose and apply a framework to reflect on the purposes of and approaches to monitoring drinking water safety. To deliver SDG 6.1, universal access to safe drinking water, a new approach to monitoring is needed. At present, we rely heavily on single measures of E. coli contamination to meet a normative definition of safety. Achieving and sustaining universal access to safe drinking water will require monitoring that can inform decision making on whether services are managed to ensure safety and security of access.
Introduction
Access to affordable, safe drinking water is critical for securing health gains from development. Significant gains were made in water access during the millennium development goal (MDG) period (1990–2015); however, the approach to drinking water safety relied on a binary improved/unimproved categorisation of water source types, approximating a crude sanitary inspection, which inadequately addresses water safety1. Building on the achievements of the MDG period, the sustainable development goals (SDGs) include a target for safe drinking water. The associated indicator for this target is based on water quality analysis for a one-off cross-sectional survey of a nationally representative sample of households and the primary water source that they use.
The term ‘safe’ was used in the MDGs (target 7c—‘halve the proportion of people without sustainable access to safe drinking water and basic sanitation’) and again in the SDGs (target 6.1—‘achieve universal and equitable access to safe and affordable drinking water for all’) to emphasise the importance that drinking water should not propagate disease; however, measurement of ‘safety’ has been an ongoing challenge. The intent and operationalisation of the SDGs—through the wording of targets and indicators—was developed through international participatory processes and built on the successes of the MDGs. The negotiations concerning targets and indicators demanded that these be supported by meaningful baseline data. These restrictions constrained the monitoring approach options, in this case to safety as defined by the Joint Monitoring Programme as Escherichia coli and a few selected ‘priority chemical contaminants’. In the coming decade, as we continue to achieve gains in access to water, we need to ensure our monitoring approaches move beyond quality to monitor the safety, and ongoing security, of drinking water services.
In this Special Collection on Monitoring drinking water quality for the Sustainable Development Goals, we reflect on the purposes of monitoring, considering the tools used and their limitations in guiding achievement of that purpose and of progress towards universal use of safe drinking water. Our reflections are framed around the prevention of transmission of infectious disease through drinking water, in both endemic and outbreak forms, and we focus on E. coli as the most common indicator used in drinking water safety monitoring. In developing a framework for monitoring the safety of drinking water safety, we recognise limitations in approaches to delivering safe drinking water, consider the historical pathways that have led us here, and explore opportunities to reimagine monitoring for safe drinking water.
A framework for monitoring drinking water safety
With reference to SDG target 6.1, the aim of drinking water monitoring is to track and advance progress towards universal access to safe drinking water. This indicates two important components of purpose—one concerns the intention to determine levels of coverage and compare them to the goal of universality; the second is the reference to safety as distinct from quality, which requires that the water be judged as to its fitness for human consumption.
The word ‘monitoring’ is defined by the notion of keeping track of something. Scientific dictionaries normally refine this to include two concepts: the ongoing nature of the activity, and the taking of periodic and programmed observations or measurements. Whether implicit or explicit, the definitions convey an understanding that monitoring ought to be designed with reference to a declared purpose, with the resulting data fit for the intended use. Monitoring for different purposes, to inform different decisions, will require different approaches and measures. For example, compliance monitoring tracks performance against a regulated standard such as a chemical or microbiological parameter, whereas operational monitoring tracks performance against process indicator limits such as for turbidity or residual chlorine2,3.
In Fig. 1, we present a framework for monitoring drinking water safety. Monitoring (as it relates to prevention of infectious disease transmission through drinking water) is framed in sequential domains of concern, moving from taking single measurements of indicators or contaminants, to interpreting health hazard, tracking safety of services, and finally monitoring the prospective security of safe services. For the purposes of our discussion here, we use the term ‘safe’ to imply potable water, i.e. that which is fit for human consumption. The framework enables us to interrogate the role of indicators in monitoring drinking water safety. Further, we use it to illustrate the constraints, benefits, and interrelationships of different outlooks—in terms of both conceptualising drinking water safety and interpreting the findings of associated monitoring activities.
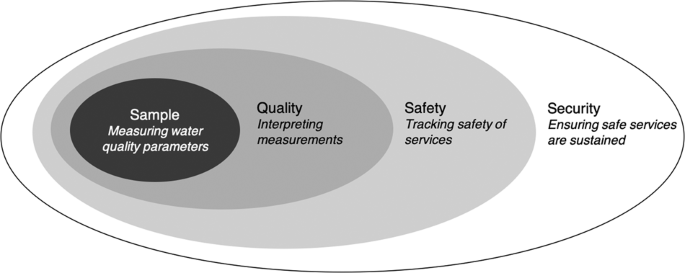
A framework for monitoring drinking water safety.
Sample: measuring water quality parameters
Water quality is measured to assess potential contamination. The most common measure used to determine microbial drinking water quality is E. coli. Used as an index of certain pathogens or as an indicator of faecal contamination, the presence of E. coli informs on the likelihood that pathogens are present4. E. coli are one of a methodologically defined group of indicators, referred to as total coliforms, that includes members of the genera Escherichia, Klebsiella, Enterobacter, Citrobacter and Serratia. Colony count approaches for coliform bacteria have been formally used to manage water quality in the UK since Report 715 was published4. E. coli were identified in the 1880s4, and were suggested as an indicator of water quality in 18926. As ideas on what was required of an indicator organism advanced in the 1960s and 1970s7,8, E. coli became the preferred indicator of faecal contamination9. E. coli were recognised as ‘the more precise indicator of faecal pollution’10 because at the time they were thought to originate exclusively from human and warm-blooded animal faeces, in which they are always present in high quantities. Whereas, other coliform organisms were already known to originate from non-faecal sources as well as from faeces, making them less likely to be reliably associated with the presence of human pathogens9. Recognition of this, alongside advancements in methods, resulted in inclusion of E. coli as a preferred indicator of faecal contamination in the second edition of WHO’s Guidelines for Drinking Water Quality (GDWQ) in 199311, and in the EU Drinking Water Directive in 199812. In addition to E. coli, a less specific methodologically defined faecal indicator organism group, thermotolerant coliforms, is also recognised as useful in the GDWQ. Thermotolerant coliforms are a sub-group of coliforms, inclusive of E. coli, that grow at 44.5 °C. Use of this elevated temperature is intended to inhibit the growth of non-Escherichia coliforms, but mostly Citrobacter and Enterobacter are reduced, and even then, not all strains of those genera13. While fixed ratios of E. coli to thermotolerant coliforms are sometimes reported, this relationship varies widely14—including by climate15 and water type16, and by the enumeration method14. Thermotolerant coliforms are sometimes referred to as ‘faecal coliforms’, a misnomer as they do not all originate from faeces17. An analytical result of zero (or more correctly <1) thermotolerant coliforms in a water sample would imply zero E. coli, but might be more difficult to achieve, whereas a result positive for thermotolerant coliforms does not confirm the presence of E. coli.
Measurement in our framework is the test that can help to assess if a ‘glass’ of water is contaminated, either by direct measurement of contaminants or using indicators. It is worth noting that the volume used in analyses is typically 100 mL, a volume equated with a ‘glass of water’18. The first GDWQ recommended 100 mL sample sizes while also recognising that it would be ‘statistically more meaningful to examine larger samples, possibly 200, 500, or 1000 ml’19.
Quality: interpreting measurements
Measurement results are often interpreted in terms of the hazard they represent. This is too often used to define the quality of water as ‘safe’ or not. For example, water is considered safe with respect to measured parameters if it does not exceed relevant guidelines or standards. This positivist, normative definition assumes that all potential hazards are known, are measurable, and have been considered. Its limitations are exemplified by widespread occurrence of arsenic in groundwater that had been previously declared ‘safe’ in Bangladesh in the 1990s20,21.
Drinking water may contain numerous potential health threats for which guidelines have not been established due to insufficient or inconsistent evidence, the low-priority given to threats deemed to be ‘only’ locally significant in few settings, and as yet unrecognised hazards. Guidelines are revisited as new evidence emerges. But guidelines (and therefore our understanding of safe water by normative definitions) are constrained: firstly, by practical considerations, such as the limits of readily available detection methods (for which arsenic is again an example22) and treatment technologies; and secondly, by political considerations such as trade-offs among competing hazards as is the case of disinfectants versus disinfection by-products.
Consequently, judgments of safety are assisted by objective definitions. The GDWQ23 defines safe drinking-water as that which “does not represent any significant risk to health over a lifetime of consumption, including different sensitivities that may occur between life stages”, where significant risk is defined in terms of the tolerable burden of disease of 10−6 disability adjusted life years per person per year. The UK also uses an objective definition in their water regulations: the term ‘wholesome’ is applied to water that ‘does not contain any micro-organism… or parasite or any substance …at a concentration or value which would constitute a potential danger to human health’ whether or not a standard has been set24.
When E. coli is detected, it is interpreted as a health hazard—in keeping with the notion that it is a ‘faecal indicator bacteria’ (FIB), a long-established notion in sanitary microbiology. Several authors have proposed necessary and desirable characteristics of the ideal faecal indicator25,26,27, and reviewed the degree of fit of candidate organisms against them. Here, we selectively use the criteria that are included in the GDWQ. It is important to revisit these criteria to reflect on the role that E. coli performs as the most common measure to assess progress against SDG 6.1. E. coli align with several of the GDWQ criteria:23 they are (generally) not pathogens themselves; they are universally present in faeces of humans and animals in large numbers; they are present in higher numbers than faecal pathogens; and they are ‘readily detected by simple, inexpensive culture methods’ (p148). However: while the majority of detected E. coli are not pathogens, a significant subset are pathogenic; and while methods may be simple and inexpensive compared to tests for specific pathogens, they remain sufficiently expensive in most settings that they do not meet the intent of this criterion articulated by Medema et al.9: that indicator tests should be inexpensive ‘thereby permitting numerous samples to be taken’.
While field tests have been developed, for regulatory purposes, most E. coli tests are undertaken in a laboratory. This requires that a cold chain be maintained during sample transport and that samples be processed within 6 h, which can be logistically and financially problematic, limiting the validity of results due to changes in the sample composition during storage. For example, in Colombia an estimated 30% of rural water samples would require storage for more than 6 h en route to the laboratory28.
Three of the WHO FIB criteria are not met by E. coli
Firstly, some E. coli multiply in natural waters. Such growth has been demonstrated in soils29,30, sediments31, and water columns32 including in drinking water reservoirs33. It has also been shown in the biofilms of distribution systems34 and in handpumps35. Conditions for growth require temperatures over 15 °C, assimilable carbon availability, and absence of disinfectant residuals36. While these conditions are uncommon in large utility systems in temperate countries, they are common in many other water systems; for example, shallow groundwaters are over 15 °C in much of the world37 and contain high loads of organic carbon38.
Secondly, E. coli are less robust than many pathogens, so they neither persist in water nor respond to treatment processes in a similar fashion to faecal pathogens. E. coli die-off quicker than many viral or protozoan pathogens in surface water and groundwater39,40,41 and during treatment23. E. coli are larger and have different surface charge characteristics than viruses and, therefore, are more readily trapped in filters and soil matrices42. The different behaviour of pathogens and E. coli illustrates why there is no direct correlation between concentrations of indicators and pathogens43. This lack of correlation is a limitation of quantitative microbial risk assessment approaches, since health risk from pathogens is extrapolated from E. coli measurements44.
Since the presence of E. coli is interpreted as indicating a health hazard, ‘immediate investigative action’23 is recommended when E. coli are detected in drinking water. However, because of the limitations described above, presence of E. coli indicates that, at the time the test was taken, there had either been recent faecal contamination, or a large faecal contamination event less recently, or environmental conditions were appropriate for growth of E. coli. Conversely, the absence of E. coli does not definitively confirm the absence of faecal pathogens. To interpret the results of E. coli tests, it becomes necessary to have more information available. Throughout the water safety literature, it is emphasised that E. coli (or FIB) are most useful as a component of a programme of measurements, not as a single test result5,9,45,46. We expand on this in the next section.
A single (or infrequent) test of water for E. coli, and subsequent interpretation of the health hazard, is widely understood as water quality ‘monitoring’, but is not able to advance water safety. E. coli, the most common measure of progress towards universal safe water, has strengths and limitations when we try to use it to infer health hazard. If we use an objective definition of safe drinking water, even within the context of infectious diseases, one test is insufficient to identify and manage threats. For E. coli, when the interpretation of the result is also unclear, a gap emerges between measurement and the stated aim of safety. With reliance on E. coli, and in the absence of other information, results are subject to confirmation bias: If E. coli are not detected in a second test then it is often assumed that the first was wrong and there is no health hazard, rather than considering variability in occurrence and detection. Or if an outbreak occurs, detection of E. coli is assumed to confirm that the water represents a health hazard, however, E. coli may be present for reasons other than recent faecal contamination, and without validation testing it is not possible to ascribe the source of the outbreak.
Safety: tracking safety of services
The preceding domain of our framework, focusing on interpreting measurements, deals simplistically with risk in terms of the likelihood of experiencing a hazard (e.g. of contracting a disease) given a specific exposure. Here we consider safety, which is not simply the inverse of hazard. Effective disease prevention demands consistent hazard-free status. A water supply is not ‘safe’ if it produces one glass of hazard-free water, nor if it delivers pathogen-laden water, briefly, once a year. Empirically, even in highly compliant water supply systems, Setty et al.47 show that disease (diarrhoea) prevalence increased following changes in water quality due to rainfall. The importance of consistency is further illustrated by the modelling work of Hunter et al.48, which suggests an increased risk of over 10% in the probability of annual infection from enteropathogenic E. coli (12.7%), Cryptosporidium (18%) and rotavirus (12%) associated with switching from treated to untreated drinking water for 1 day.
Because sampling and analysis provide a snapshot of quality at the moment of sampling; and because samples of water necessarily represent a negligible fraction of the volume and time of water supplied, assessing on-going safety demands that we move from making and interpreting single measurements to planning sequences of measurements i.e. ‘monitoring’.
There is abundant evidence that E. coli concentrations in water vary rapidly and across orders of magnitude. This is true within natural waters due to non-random distribution49, from hazardous events47 or failures in control measures, which routine sampling regimes do not readily capture as they are limited by logistics. For example, samples are disproportionately taken in mornings and on days earlier in the working week to facilitate transport, analysis and reporting during normal work hours18. Here, online measures, such as turbidity or chlorine residual, can improve understanding of temporal variability47,50 and interpretation of other measurements.
Measurements only provide evidence of what the quality was, so management approaches that integrate understanding of system performance into planning are needed to oversee water safety on an ongoing basis. Prospective management of safety requires and builds on the knowledge of historical measurements. It combines evidence that a system has reliably delivered potable water, based on a programmed series of measurements, with knowledge that controls are in place to ensure that perturbations do not compromise quality. At this level of the framework, we have moved from a focus on measurements, which inform on the water system safety yesterday (which is what E. coli tests currently help us understand), to consideration of safety for tomorrow. This prospective safety perspective and its emphasis on ensuring adequate conditions is exemplified by sanitary inspection and water safety plans (WSPs).
Sanitary inspection originated as an adjunct, to water quality measurement. Victorian hygiene literature is replete with examples, and almost a century ago, Prescott and Winslow51 stated that ‘the first attempt of the expert called in to pronounce upon the character of a potable water should be to make a thorough sanitary inspection’. This illustrates understanding that, even in the absence of contamination at a moment of sampling, a system that is vulnerable to contamination is not safe. As bacteriological methods developed, and their limitations were recognised, these preventative approaches continued to be valued. For example, the first edition of the GDWQ stated that, for non-piped systems, ‘considerable reliance must be placed on sanitary inspection and not exclusively on the results of bacteriological examination’19. Equally, it advised managers of untreated water for piped supplies to include in their assessment of safety both frequent bacteriological results showing the absence of faecal coliforms and information on whether ‘sanitary inspection has shown the catchment area and storage conditions to be satisfactory’19.
In the sense used here, a sanitary inspection is a visual inspection of a piece of water system infrastructure, with the objective of identifying physical factors that could facilitate contamination. It is exhaustive in the sense that all observable faults are considered, but not comprehensive in the sense that not all faults are detectable by visual inspection. Sanitary inspection, reviewed and explored substantively in the paper by Kelly and Bartram52, is widely used by those working on rural water systems, where it is frequently applied to community water sources such as boreholes with handpumps.
Sanitary inspection was one of the tools that inspired the development of the concept of WSPs, along with the hazard analysis and critical control points (HACCP) approach, failure mode analysis, quality management, and multi-barrier approaches (the importance of these approaches is highlighted in Kelly and Bartram’s52 results). Indeed, sanitary inspection is a key component of WSPs, which extend the principles of sanitary inspection to the whole system (‘catchment-to-consumer’).
WSPs and similar systematic risk-based approaches have demonstrated benefits for reducing temporal variation in water quality47, as well as reducing the health burden53. One of the key attributes of a WSP54 is that there is evidence that a water supply system can achieve safe water through validation and verification procedures. In validation, evidence is gathered that a water system can effectively meet water quality targets; this may use a variety of tools, including challenging a water system with different conditions and organisms. Verification provides ongoing evidence that a water system is delivering water of the desired quality, for which regular E. coli measurements provides a useful tool. With the system performance characterised through validation and verification, an individual E. coli measurement can be meaningfully interpreted.
Monitoring water safety requires frequent data collection, underpinned by knowledge of system performance and maintenance. Furthermore, to be effective, monitoring data must be available and useful for decision makers, and should support stakeholder cooperation rather than threaten it55.
Security: ensuring safe services are sustained
As the SDG target of universal access is progressively achieved, the importance of the future sustainability of safe drinking water supply becomes increasingly apparent, i.e. attention turns towards the risk that those with access might experience a reduction of the level of service, or a loss of service56. While for the purpose of this article we focus on safety of drinking water for human consumption, the level of service we aim to secure includes the broader aspects of the human right to water on which the SDG indicators are based57. Securing appropriate levels of quantity, reliability, accessibility, and affordability of water that is fit for purpose, are essential to achieving the health-based targets that WSPs are designed to meet58.
Terms describing sustainability and sustaining services are interpreted inconsistently. While our preceding reflections concern monitoring for sustained achievement of safety and its implied continuation, here we use the term security in a prospective manner similar to that of ‘sustainable development’ i.e. in a sense that differentiates management of the day to day and familiar (safety) from adequacy for the long term and against the unfamiliar (security). We use three factors to illustrate the potential for attained access to be systematically undermined: demographic change, climate change, and increasing water pollution. Although we focus on these three types of systemic change, we recognise that there are others, such as economic volatility and armed conflict, that are important at this final level of the framework.
Demographic trends warn us of impending risks to availability of sufficient quantities of water because of increasing population, and accelerating demand for water as populations change lifestyles with urbanisation and increasing affluence59,60. In Kenya, for example, water is scarce (647 m3 per capita in 200661) and by 2030, the population is projected to increase by over 80%, with a 50% increase in the proportion of urban dwellers. Increases in water demand will coincide for domestic supply, agriculture and industry (supplying both domestic and international markets62), and good regulation will be necessary to prevent damaging shortages.
Further to demographic pressure, climate change will have substantial consequences for water access. Shortages in Cape Town and São Paulo have highlighted the vulnerability of water supplies to climatic events, and the importance of appropriate management63. With climate change, more frequent higher intensity rainfall events will increase the risk of infrastructure damage64. Rising temperatures and increasing evapotranspiration rates will reduce available water and increase competing water demand for irrigation65. And water quality will deteriorate due to heavier and more erratic rainfall47,66, increasing release of glacial flows with associated geochemical hazards67, and increasing salinity from rising sea levels and expanding irrigation.
In addition to climate change impacts, the problem of water quality deterioration is compounded by pollution. Pollution threatens health directly (through contamination of drinking water that treatment processes do not remove) or indirectly (if chemicals make water unpalatable). Thus, increasing pollution threatens to reduce access to safe drinking water; for example, substantial investments are needed in Dhaka, Bangladesh, to ensure continued access where industrial growth has resulted in the need to pump water from over 30 kms away to avoid local pollution68. Environmental water pollution is addressed through SDG 6.3: to ‘improve water quality by reducing pollution…’. Realisation of this goal will require combatting pollution from domestic, agricultural and industrial sources.
To ensure we are working towards sustainable access to safe water, we need tools that can measure and track this progress. Without appropriate indicators, we will continue to focus on access rather than sustainability, potentially misdirecting resources.
New monitoring tools are needed to assess security of safe water supplies
The MDGs, and now SDGs, are based on the notion of provision: increasing the proportion of people with reliable access to affordable, safe drinking water. There remain challenges to achieving the SDG target of universal access, especially for difficult-to-reach populations. There are also practical limits of measuring universality. As we approach the target of universality, however, we need to consider how to shift to a security perspective that encompasses sustainability of high levels of service. Thanks to the achievements of the MDGs and SDGs, 71% of the global population have access to safely managed water services69. But because of this success, it is now possible and necessary to adopt a security perspective and to target prospective, inter-generational access to safe water in our changing world.
The participatory, political nature of the processes that define global targets and indicators creates a conservative environment that hinders innovation and diffusion-adoption of improved approaches. We argue that now is the time to start planning for 2030 and beyond, to support a change in focus from access to security of sustainable, safe water supply services and to ensure we can provide the level of evidence needed for adoption of better indicators by the United Nations committees and processes. We recall that the initial Rapid Assessment of Drinking Water Quality (RADWQ) research, done in 2004/200515, created a platform for change that advanced a recognition of drinking water quality in the MDGs, and then monitoring of quality in the SDGs. In 2020, 5 years into the SDGs, where are the new tools we will need for 2030 and beyond?
Through our framework for monitoring drinking water safety we have deconstructed ‘drinking water quality monitoring’, reflecting on its purpose and component parts. Measurement of drinking water quality alone will not deliver the changes needed for safe water. We have become highly reliant on E. coli as a means to assess drinking water quality. It is critical that we remember, however, that the goal of safe water supply is fitness for human consumption, not absence of E. coli. There are a range of measurement tools available that can facilitate regular checks to track direct or indirect changes in water quality or system performance. These tools are important, but cheaper, quicker methods to measure water quality parameters are not enough. The usefulness of measures, such as E. coli, in communicating the problem of water quality has to be tempered by the risk that we lose sight of their purpose and neglect the range of tools needed to achieve safe water and to sustain improvements.
To assess and manage the safety and security of drinking water services, we need monitoring that includes more than direct water quality measures. Through our framework we advocate for this next step. For water safety, there has been consistent emphasis in the GDWQ on the importance of frequent water testing being complemented by knowledge of risks from sanitary inspections and accompanied by systematic management approaches like WSPs. Increased regulation of water services can be anticipated to increase data availability57 and create an opportunity to focus on management indicators for monitoring the application, oversight and audits of WSPs and sanitary inspections.
These practices, supported by routine monitoring, are essential for safety, and they contribute to ensuring security of drinking water services in the face of threats from demographic and climate change, and pollution. To fully progress from ‘safety’ to ‘security’, however, will require innovations in monitoring that go beyond current practices. There is an opportunity to act smartly, invest strategically, and accelerate progress by incorporating a security perspective. This perspective should enable us to account for prospective long-term drivers that threaten the ongoing sustainability of access to safe water.
Data availability
No datasets were generated or analysed during the current study.
Code availability
No code was generated or used during the current study.
References
Bain, R. et al. Fecal contamination of drinking-water in low- and middle-income countries: a systematic review and meta-analysis. PLoS Med. 11, e1001644 (2014).
Charles, K. & Pond, K. Drinking water quality regulations. Routledge Handb. Water Health https://doi.org/10.4324/9781315693606 (2015).
Rahman, Z., Crocker, J., Chang, K., Khush, R. & Bartram, J. A comparative assessment of institutional frameworks for managing drinking water quality. J. Water Sanit. Hyg. Dev. 1, 242–258 (2011).
Ashbolt, N. J., Grabow, W. O. K. & Snozzi, M. Indicators of microbial water quality. in Water Quality: Guidelines, Standards and Health: Assessment of Risk and Risk Management for Water-Related Infectious Disease (eds Fewtrell, L. & Bartram, J. K.) (World Health Organization, London, UK, 2001).
HMSO. The Bacteriological Examination of Water Supplies. Reports on Public Health and Medical Subjects, 1st edn, No. 71 (1934).
Leclerc, H., Mossel, D. A. A., Edberg, S. C. & Struijk, C. B. Advances in the Bacteriology of the Coliform Group: Their Suitability as Markers of Microbial Water Safety. (2001).
Bonde, G. J. Bacteriological methods for estimation of water pollution. Health Lab. Sci. 3, 124–128 (1966).
Gordon, D. M. The ecology of Escherichia coli. in Escherichia coli: Pathotypes and Principles of Pathogenesis (ed Donnenberg, M.S.) 3–20 (Academic Press, 2013).
Medema, G. J. et al. Safe drinking water: an ongoing challenge. in Assessing Microbial Safety of Drinking Water: Improving Approaches and Methods (eds O. E. C. D. & WHO) (2003).
WHO. Guidelines for Drinking-water Quality: Third edition, incorporating the first and second Addenda, Volume 1 Recommendations. (World Health Organisation, 2008).
WHO. Guidelines for Drinking Water Quality 2nd Edition. Volume 1. Recommendations. (World Health Organisation, 1993).
Anon. Council Directive 98/83/EC of 3 November 1998 on the quality of water intended for human consumption. Off. J. Eur. Commun. 5.12.98, L330/32–L330/53 (1998).
Gray, N. & Gleeson, C. The Coliform Index and Waterborne Disease. https://doi.org/10.4324/9780203476888 (1996).
Hamilton, W. P., Kim, M. & Thackston, E. L. Comparison of commercially available Escherichia coli enumeration tests: implications for attaining water quality standards. Water Res. 39, 4869–4878 (2005).
WHO & UNICEF. Rapid Assessment of Drinking-Water Quality: A Handbook for Implementation. (2012).
Mahmud, Z. H. et al. Occurrence of Escherichia coli and faecal coliforms in drinking water at source and household point-of-use in Rohingya camps, Bangladesh. Gut Pathog. 11, 1–11 (2019).
Allen, M. A. The Public Health Significance of Bacterial Indicators in Drinking Water. in Coliforms and E. coli, Problem or Solution? (eds Kay, D. & Fricker, C.) 176–181 (Royal Society of Chemistry, 1997).
Geldreich, E. E. Reinventing microbial regulations for safer water supplies. in Coliforms and E. coli, Problem or Solution? (eds Kay, D. & Fricker, C.) 218–234 (Royal Society of Chemistry, 1997).
WHO. Guidelines for Drinking Water Quality. First Edition. Vol 1 Recommendations. (World Health Organisation, 1984).
Pepper, D. Bangladeshis poisoned by arsenic sue British organisation. Lancet 367, 199–200 (2006).
George, C. M. The arsenic crisis in Bangladesh. in Routledge Handbook of Water and Health (ed Bartram, J.) 685–692 https://doi.org/10.4324/9781315693606-82 (Routledge, 2015).
WHO. Arsenic in Drinking-water Background Document for Development of WHO Guidelines for Drinking-Water Quality. (World Health Organisation, 2011).
WHO. Guidelines for Drinking-water Quality 4th ed., WHO, Geneva, p. 340. World Health Organization https://doi.org/10.1016/S1462-0758(00)00006-6 (2011).
Anon. Water, England and Wales The Water Supply (Water Quality) Regulations SI 2016/614. Water, England and Wales 52 (2016).
Waite, W. M. Drinking water quality regulation—a European perspective. in Coliforms and E. coli, Problem or Solution? (eds Kay, D. & Fricker, C.) 208–217 (Royal Chemistry Society, 1997).
Geldreich, E. E. Coliforms: a new beginning to an old problem. in Coliforms and E. coli, Problem or Solution? (eds Kay, D. & Fricker, C.) 3–11 (Royal Society of Chemistry, 1997).
Mossel, D. A. A. Index and indicator organisms: a current assessment of their usefulness and significance. Food Technol. Aust. 30, 212–219 (1978).
Wright, J. et al. Water quality laboratories in Colombia: a GIS-based study of urban and rural accessibility. Sci. Total Environ. 485–486, 643–652 (2014).
Brennan, F. P., O’Flaherty, V., Kramers, G., Grant, J. & Richards, K. G. Long-term persistence and leaching of Escherichia coli in temperate maritime soils. Appl. Environ. Microbiol. 76, 1449–1455 (2010).
Brennan, F. P., Abram, F., Chinalia, F. A., Richards, K. G. & O’Flaherty, V. Characterization of environmentally persistent Escherichia coli isolates leached from an Irish soil. Appl. Environ. Microbiol. 76, 2175–2180 (2010).
Haller, L., Poté, J., Loizeau, J. L. & Wildi, W. Distribution and survival of faecal indicator bacteria in the sediments of the Bay of Vidy, Lake Geneva, Switzerland. Ecol. Indic. https://doi.org/10.1016/j.ecolind.2008.08.001 (2009).
Pote, J. et al. Persistence and growth of faecal culturable bacterial indicators in water column and sediments of Vidy Bay, Lake Geneva, Switzerland. J. Environ. Sci. 21, 62–69 (2009).
Ashbolt, N. J., Dorsch, M. R., Cox, P. T. & Banens, B. Blooming E. Coli, what do they mean? in Coliforms and E. coli, Problem or Solution? (eds Kay, D. & Fricker, C.) (The Royal Society of Chemistry, Cambridge, England, 1997).
Block, J. C., Muteaux, L., Gatel, D. & Reasoner, D. J. Survival and growth of E. coli in drinking water distribution systems. in Coliforms and E. coli, Problem or Solution? (eds Kay, D. & Fricker, C.) 157–167 (Royal Society of Chemistry, 1997).
Ferguson, A. S. et al. Hand-pumps as reservoirs for microbial contamination of well water. J. Water Health 9, 708–717 (2011).
LeChavallier, M. W. Conditions favouring coliform and HPC bacterial growth in drinking-water and on water contact surfaces. in Heterotrophic Plate Counts and Drinking-water Safety: The Significance of HPCs for Water Quality and Human Health (eds Bartram, J., Cotruvo, J., Exner, M., Fricker, C. & Glasmacher, A.) 177–198 (WHO, 2003).
Benz, S. A., Bayer, P. & Blum, P. Global patterns of shallow groundwater temperatures. Environ. Res. Lett. 12, 34005 (2017).
McDonough, L. K. et al. Changes in global groundwater organic carbon driven by climate change and urbanization. Nat. Commun. 11, 1–10 (2020).
Leclerc, H., Mossel, D. A. A., Edberg, S. C. & Struijk, C. B. Advances in the bacteriology of the coliform group: their suitability as markers of microbial water safety. Annu. Rev. Microbiol. 55, 201–234 (2001).
Osborn, M. J. et al. Indicators for Waterborne Pathogens. (The National Academies Press, 2004).
Murphy, H. Persistence of Pathogens in Sewage and Other Water Types. in Global Water Pathogen Project (eds Rose, J. & Jiménez-Cisneros, B.) https://doi.org/10.14321/waterpathogens.51 (2017).
Taylor, R., Cronin, A., Pedley, S., Barker, J. & Atkinson, T. The implications of groundwater velocity variations on microbial transport and wellhead protection—review of field evidence. FEMS Microbiol. Ecol. 49, 17–26 (2004).
Payment, P. & Locas, A. Pathogens in water: value and limits of correlation with microbial indicators. Ground Water 49, 4–11 (2011).
Bivins, A. W. et al. Estimating infection risks and the global burden of diarrheal disease attributable to intermittent water supply using QMRA. Environ. Sci. Technol. 51, 7542–7551 (2017).
WHO. Surveillance of Drinking Water Quality. (WHO, 1976).
Taylor, E. W., Beale, J. F., Suckling, E. V. & Thresh, J. C. The Examination of Waters and Water Supplies. (Churchill, 1958).
Setty, K. E. et al. Time series study of weather, water quality, and acute gastroenteritis at Water Safety Plan implementation sites in France and Spain. Int. J. Hyg. Environ. Health 221, 714–726 (2018).
Hunter, P. R., Zmirou-Navier, D. & Hartemann, P. Estimating the impact on health of poor reliability of drinking water interventions in developing countries. Sci. Total Env. 407, 2621–2624 (2009).
Kirchman, D., Sigda, J., Kapuscinski, R. & Mitchell’, R. Statistical analysis of the direct count method for enumerating bacteria. Appl. Environ. Microbiol. 44 (1982).
Setty, K. et al. Assessing operational performance benefits of a Water Safety Plan implemented in Southwestern France. Perspect. Public Health 138, 270–278 (2018).
Prescott, S. C. & Winslow, C.-E. A. Elements of Water Bacteriology, with Special Reference to Sanitary Analysis. (Wiley, 1931).
Kelly, E. R., Cronk, R., Kumpel, E., Howard, G. & Bartram, J. How we assess water safety: a critical review of sanitary inspection and water quality analysis. Sci. Total Environ. 718, 137237 (2020).
Gunnarsdottir, M. J. Benefits of Water Safety Plans: Microbiology, Compliance, and Public Health. https://doi.org/10.1021/es300372h (2012).
WHO. Water Safety Plan Manual: Step-by-step risk management for drinking-water suppliers. WHO Library. https://doi.org/10.1111/j.1752-1688.1970.tb00528.x (2009).
Nowicki, S., Koehler, J. & Charles, K. J. Including water quality monitoring in rural water service provision: why safe water requires challenging the quantity versus quality dichotomy. npj Clean Water 3, 1–9 (2020).
Bradley, D. J. & Bartram, J. K. Domestic water and sanitation as water security: monitoring, concepts and strategy. Philos. Trans. R. Soc. A Math. Phys. Eng. Sci. 371, 20120420 (2013).
Anon. Metadata on 6.1.1. (2017). Available at: https://unstats.un.org/sdgs/metadata/files/Metadata-06-01-01.pdf. Accessed 1 May 2020.
WHO. Guidelines for Drinking-Water Quality: Fourth Edition Incorporating the First Addendum. (WHO Press, 2017).
Damania, R. et al. Uncharted Waters. The New Economics of Water Scarcity and Variability. (2017).
Bartram, J., Elliott, M. & Chuang, P. Getting wet, clean, and healthy: why households matter. Lancet 380, 85–86 (2012).
UN-WATER. Kenya National Water Development Report: Case Study. A WWAP Case Study Prepared for the 2nd UN World Water Development Report: Water, a Shared Responsibility. (2006).
Mendes, D. M. & Paglietti, L. Kenya Irrigation Market Brief. (FAO and IFC, 2015).
Muller, M. Cape Town’s drought: don’t blame climate change. Nature 559, 174–176 (2018).
Howard, G. et al. Securing 2020 vision for 2030: climate change and ensuring resilience in water and sanitation services. J. Water Clim. Chang. https://doi.org/10.2166/wcc.2010.205 (2010).
Taye, M. T., Dyer, E., Hirpa, F. A. & Charles, K. Climate change impact on water resources in the Awash basin, Ethiopia. Water 10, 1–16 (2018).
Auld, H., MacIver, D. & Klaassen, J. Heavy rainfall and waterborne disease outbreaks: the walkerton example. J. Toxicol. Environ. Heal. Part A 67, 1879–1887 (2004).
Brown, G. H., Tranter, M. & Sharp, M. J. Experimental investigations of the weathering of suspended sediment by alpine glacial meltwater. Hydrol. Process. 10, 579–597 (1996).
Chowdhury, F. J., Ahmad, Z. U. & Aalderink, H. Protecting the Meghna river. A Sustainable Water Resource for Dhaka. (Asian Development Bank, 2019).
UNICEF & WHO. Progress on household drinking water, sanitation and hygiene 2000–2017. Special focus on inequalities. Progress on Drinking Water, Sanitation and Hygiene 2000–2017 (2019).
Acknowledgements
K.C. and S.N. are supported by the REACH programme funded by UK Aid from the UK Department for International Development (DFID) for the benefit of developing countries (Aries Code 201880). However, the views expressed and information contained in it are not necessarily those of or endorsed by DFID, which can accept no responsibility for such views or information or for any reliance placed on them. The authors thank the health-related water community for all the discussions that have informed this work.
Author information
Authors and Affiliations
Contributions
K.C. and J.B. conceived of and drafted the paper. S.N. reviewed and commented throughout the process.
Corresponding author
Ethics declarations
Competing interests
The authors declare no competing interests.
Additional information
Publisher’s note Springer Nature remains neutral with regard to jurisdictional claims in published maps and institutional affiliations.
Rights and permissions
Open Access This article is licensed under a Creative Commons Attribution 4.0 International License, which permits use, sharing, adaptation, distribution and reproduction in any medium or format, as long as you give appropriate credit to the original author(s) and the source, provide a link to the Creative Commons license, and indicate if changes were made. The images or other third party material in this article are included in the article’s Creative Commons license, unless indicated otherwise in a credit line to the material. If material is not included in the article’s Creative Commons license and your intended use is not permitted by statutory regulation or exceeds the permitted use, you will need to obtain permission directly from the copyright holder. To view a copy of this license, visit http://creativecommons.org/licenses/by/4.0/.
About this article

Cite this article
Charles, K.J., Nowicki, S. & Bartram, J.K. A framework for monitoring the safety of water services: from measurements to security. npj Clean Water 3, 36 (2020). https://doi.org/10.1038/s41545-020-00083-1
Received:
Accepted:
Published:
DOI: https://doi.org/10.1038/s41545-020-00083-1
This article is cited by
-
Addressing gaps in data on drinking water quality through data integration and machine learning: evidence from Ethiopia
npj Clean Water (2023)
-
When Water Quality Crises Drive Change: A Comparative Analysis of the Policy Processes Behind Major Water Contamination Events
Exposure and Health (2023)
-
Occurrence of waterborne pathogens and antibiotic resistance in water supply systems in a small town in Mozambique
BMC Microbiology (2022)
-
Measuring the gaps in drinking water quality and policy across regional and remote Australia
npj Clean Water (2022)
-
Attainment of water and sanitation goals: a review and agenda for research
Sustainable Water Resources Management (2022)
