Optimal Pipette Resistance, Seal Resistance, and Zero-Current Membrane Potential for Loose Patch or Breakthrough Whole-Cell Recording in vivo
 Linqing Yan
 Qi Fang
 Xingui Zhang4
 - 1Mental Health Center of Shantou University, Shantou, China
- 2Department of Anesthesiology, Central People’s Hospital of Zhanjiang, Zhanjiang, China
- 3Zilkha Neurogenetic Institute, Keck School of Medicine, University of Southern California, Los Angeles, CA, United States
- 4College of Integrative Medicine, Fujian University of Traditional Chinese Medicine, Fuzhou, China
In vivo loose patch and breakthrough whole-cell recordings are useful tools for investigating the intrinsic and synaptic properties of neurons. However, the correlation among pipette resistance, seal condition, and recording time is not thoroughly clear. Presently, we investigated the recording time of different pipette resistances and seal conditions in loose patch and breakthrough whole-cell recordings. The recording time did not change with pipette resistance for loose patch recording (Rp-loose) and first increased and then decreased as seal resistance for loose patch recording (Rs-loose) increased. For a high probability of a recording time ≥30 min, the low and high cutoff values of Rs-loose were 21.5 and 36 MΩ, respectively. For neurons with Rs-loose values of 21.5–36 MΩ, the action potential (AP) amplitudes changed slightly 30 min after the seal. The recording time increased as seal resistance for whole-cell recording (Rs-tight) increased and the zero-current membrane potential for breakthrough whole-cell recording (MPzero-current) decreased. For a high probability of a recording time ≥30 min, the cutoff values of Rs-tight and MPzero-current were 2.35 GΩ and −53.5 mV, respectively. The area under the curve (AUC) of the MPzero-current receiver operating characteristic (ROC) curve was larger than that of the Rs-tight ROC curve. For neurons with MPzero-current values ≤ −53.5 mV, the inhibitory or excitatory postsynaptic current amplitudes did not show significant changes 30 min after the seal. In neurons with Rs-tight values ≥2.35 GΩ, the recording time gradually increased and then decreased as the pipette resistance for whole-cell recording (Rp-tight) increased. For the high probability of a recording time ≥30 min, the low and high cutoff values of Rp-tight were 6.15 and 6.45 MΩ, respectively. Together, we concluded that the optimal Rs-loose range is 21.5–36 MΩ, the optimal Rp-tight range is 6.15–6.45 MΩ, and the optimal Rs-tight and MPzero-current values are ≥2.35 GΩ and ≤ −53.5 mV, respectively. Compared with Rs-tight, the MPzero-current value can more accurately discriminate recording times ≥30 min and <30 min.
Introduction
In vivo loose patch recording and breakthrough whole-cell recording (hereafter, whole-cell recording) are important techniques in neuroscience (Sun et al., 2010; Zhou et al., 2010). However, the recording time is often short (Wang et al., 2016). The recording time is interrelated with the recording electrode’s condition (e.g., pipette resistance) and the recording electrode’s seal condition [e.g., seal resistance before rupturing the cell membrane or zero-current membrane potential (MPzero-current) without artificial interference after rupturing the cell membrane] (Neher et al., 1978; Hamill et al., 1981). The correlation among pipette resistance, seal condition, and recording time remains largely unclear. Solving this problem will help researchers to improve recording time, enhance their confidence in completing studies, and decrease training time.
Via loose patch recording, researchers can measure the suprathreshold firing of a single neuron and investigate the spiking properties of neurons (Tan et al., 2008; Sun et al., 2013). In loose patch recording, the pipette is usually sealed on the membrane patch that is invaginated into its lumen usually via suction (Roberts and Almers, 1992). The cell membrane is not ruptured (Neher et al., 1978). As the pipette resistance for loose patch recording (Rp-loose) decreases, the tip diameter of the recording electrode increases. The larger patched area is harder to seal (Horn and Korn, 1992; Penner, 1995), and even if sealed, the seal is looser and easier to destroy (Hamill et al., 1981). In addition, a larger patch membrane fluctuates more easily and is ruptured by the strength (i.e., the negative pressure in the lumen of the recording electrode or resilience of the cell membrane), which invaginates the cell membrane into the lumen of the recording electrode (Roberts and Almers, 1992). As the Rp-loose increases, the tip diameter of the recording electrode decreases. Thus, the cell membrane is easier to directly pierce by the tip of the recording electrode during recording because of the movement of the cell membrane (Wang et al., 2016). On one hand, when Rp-loose is constant, the larger the seal resistance for loose patch recording (Rs-loose) is, the larger the negative pressure in the lumen of the recording electrode or resilience of the cell membrane is (Roberts and Almers, 1992), and the easier it is to damage the cell membrane (Weiss et al., 1986; Milton and Caldwell, 1990; Roberts et al., 1990; Roberts and Almers, 1992). On the other hand, the smaller Rs-loose is, the looser the seal is and the easier it is to destroy (Hamill et al., 1981). Taken together, Rp-loose and Rs-loose seem to correlate with recording time, but the details of their correlation need to be further investigated.
Using whole-cell recording, researchers can measure the subthreshold excitatory and inhibitory electrical activities of a neuron and explore the properties of specific ion channels or receptors and the effect of neuronal activity on the functionality of neural circuits (Wehr and Zador, 2003; Zhang et al., 2003; Wang et al., 2016). Moreover, during whole-cell recording, staining and pharmacological agents can be infused into the neuron to reveal neuronal morphology and carry out intracellular pharmacological studies (Wang et al., 2016). During whole-cell recording, as the cell membrane is invaginated into the lumen of the recording electrode, the recording electrode is attached to the neuron with a seal resistance for whole-cell recording (Rs-tight) ≥ 1 GΩ, and subsequently, the cell membrane is ruptured (Horn and Brodwick, 1980; Hamill et al., 1981). As analyzed in the above loose patch recording description, a smaller pipette resistance for whole-cell recording (Rp-tight) means a looser seal (Horn and Korn, 1992), which is easier to destroy (Hamill et al., 1981). A larger Rp-tight means a smaller amount of patch membrane is involved, which makes fluctuations more difficult and increases the difficulty of rupture. The process of rupturing the membrane alters the mechanical stability of the seal with a higher probability. As the seal resistance increases (Hamill et al., 1981) and the zero-current membrane potential (MPzero-current) decreases (Hamill et al., 1981; Kornreich, 2007), the seal is mechanically more stable. Therefore, Rp-tight, Rs-tight, and MPzero-current values all theoretically influence the recording time (Hamill et al., 1981). However, the detailed correlation among these factors remains unclear.
The Rp-loose, Rp-tight, and Rs-loose values cannot be too small or too large. The Rs-tight cannot be too small, and the MPzero-current cannot be too high. Therefore, we hypothesize that for long-lasting recording, there are optimal ranges of Rp-loose, Rs-loose, and Rp-tight. Additionally, there are optimal cutoff values for Rs-tight and MPzero-current. To test our hypothesis in this study, we analyzed the data (Rp-loose, Rs-loose, Rp-tight, Rs-tight, MPzero-current, and recording time) of loose patch and whole-cell recordings in the primary auditory cortex and aimed to determine the correlation among pipette resistance, seal condition, and recording time.
Methods
Animal Preparation
All experimental procedures were approved by the Animal Care and Use Committee of Shantou University Medical College, Guangdong, China. C57BL/6J mice (female, 6–8 weeks, 16–20 g) with normal hearing were used in this study. The mice were housed under a 12-h light/dark cycle with water and food provided ad libitum. The mice were first anesthetized using sodium pentobarbital (60–70 mg/kg i.p., Sigma-Adrich, St. Louis, MO, USA), with an additional dose administered if the pedal withdrawal reflex was evoked by a toe pinch. The mouse body temperature was continuously monitored and maintained at 37°C using a heating pad with a feedback controller. Atropine sulfate (0.25 mg/kg, Nandao, Hainan, China) was injected subcutaneously to reduce secretions in the respiratory tracts. The heads of the mice were fixed using a customized apparatus with dental cement. Then, for approximately 3 days, the mice were then habituated, allowed to recover, and trained to be accustomed to head fixation on the recording setup.
In vivo Recordings of Awake Mice
Before electrophysiological recordings, the mouse was anesthetized with isoflurane (2%; Sigma-Adrich, St. Louis, MO, USA), and a craniotomy was performed over the primary auditory cortex. The electrophysiological experiments, including loose patch recording and breakthrough whole-cell recording in vivo, were carried out on an anti-vibration table in a soundproof room, and the head of the mouse was immobilized as described above (Xiong et al., 2013).
After the mouse awakened from isoflurane anesthesia, the dura was removed, and a glass pipette (tip diameter of approximately 1.0 μm, Sutter, Inc., USA, vertically pulled by PC-10, Narishige, Tokyo, Japan) was inserted in the primary auditory cortex vertically to the brain surface controlled by a micromanipulator (Siskiyou Inc., Grants Pass, OR, USA). The pipette solution contained artificial cerebral spinal fluid (ACSF; in mM: 124 NaCl, 2.5 KCl, 2 CaCl2, 1 MgCl2, 25 NaHCO3, 1.23 NaH2PO4, 20 glucose, and 1.5% biocytin, pH 7.25, Sigma-Adrich, St. Louis, MO, USA) for loose patch recording or a synthetic fluid (in mM: 125 Cs-gluconate, 2 CsCl, 5 TEA-Cl, 4 MgATP, 0.3 GTP, 8 phosphocreatine, 10 HEPES, 10 EGTA, 1 QX-314, pH 7.23, Sigma-Adrich, St. Louis, MO, USA) for whole-cell recordings. After being inserted into an electrode holder (Axon Instruments), the patch pipette was first rapidly lowered to the desired depth (from L2/3 to L6, i.e., 151–1,000 μm) under 6-psi positive pressure; then, the pipette was slowly advanced (in 1 μm steps) at a lower pressure (0.5–1 psi) until a neuron was detected, which was reflected by a pipette resistance change. When the patch pipette obtained a low seal resistance (10–200 MΩ), the neuron recording was considered to be a loose patch recording. An Axoclamp 700B amplifier (Axon Instruments/Molecular Devices, Sunnyvale, CA, USA) was used in current-clamp mode for recording action potential (AP). When the patch pipette obtained a high seal resistance (≥1 GΩ) and the neuron membrane was successfully sucked through, the recording was considered to be a whole-cell recording that would allow the MPzero-current to be evaluated in current-clamp mode (I = 0) first and then the recording mode could be switched to voltage-clamp mode to record the inhibitory postsynaptic current (IPSC) and excitatory postsynaptic current (EPSC). For recording the IPSC and EPSC, the membrane potential was held at 0 mV and −70 mV, respectively (Wu et al., 2011). For voltage-clamp recording, the whole cell and pipette were completely compensated for, and the initial series resistance (20–40 MΩ) was compensated for by 50–60% to achieve an effective series resistance of 10–20 MΩ (Wu et al., 2006). Electrical signals were filtered with a bandpass filter (300–3,000 Hz) and sampled at 20 kHz.
Sound Calibration and Generation
White noise stimuli with various frequencies (2–45 kHz, 0.1-octave interval) were generated and delivered to the contralateral ear of mice using a Tucker-Davis Technologies System 3 (TDT 3, Tucker-Davis Technologies, Alachua, FL, USA). A real-time processor (RP 2.1) and a custom-made program written with RPvdsEx software were used to generate the sound signals, and the intensities of the sound were controlled by a programmable attenuator (PA5). The synthesized signals were amplified and delivered through an electrostatic speaker driver (ED1) and a free-field ultrasonic loudspeaker (ES1; frequency range, 2–110 kHz). The loudspeaker was calibrated with 1/8- and 1/4-inch microphones (Brüel and Kjaer 4138, 4135, Naerum, Denmark) and an amplifier (Brüel and Kjaer 2610, Naerum, Denmark) before the experiment. The noise parameters (60 dB SPL, 50-ms duration, 5-ms rise–fall time) were controlled by Brain Ware software. The noises were repeated until no recognizable APs, IPSCs, or EPSCs were observed and the interstimulus interval was 500 ms.
Data Processing
The Rp-loose, Rp-tight, Rs-loose, Rs-tight, MPzero-current, and recording time were documented. To investigate the correlation among the above variables, scatterplots of the two above variables were plotted. The receiver operating characteristic (ROC) curve is a tool to find the optimal cutoff value of a variable to better predict a positive event in many studies (Søreide, 2009; Mandrekar, 2010). In this study, to find the optimal cut-off values of a variable for a high probability of recording time ≥30 min, the ROC curve was determined, and the area under the curve (AUC) and Youden index were computed (Mandrekar, 2010). For offline data processing, the APs from loose patch recording were extracted via a custom-made MATLAB program. The IPSCs and EPSCs from the whole-cell recording were directly extracted via Clampex 12 (Axon, USA). Then, the amplitudes of APs, IPSCs, and EPSCs at 5 and 30 min were measured and compared.
All statistical analyses were performed with SPSS statistical software (version 13). The measurement data were presented as the mean ± SE and were first tested for normal distribution (Shapiro–Wilk test) and equal variances (Levene’s test) before performing appropriate parametric tests. For two-group comparisons, a two-tailed unpaired t-test (for normally distributed data) or Mann–Whitney U test (for nonnormally distributed data) was applied to evaluate significance. The enumeration data were tested with the Chi-square test. A p-value of less than 0.05 was considered to indicate significance.
Results
Correlation Among Rp-loose, Rs-loose, and Recording Time in Loose Patch Recording
Loose patch recording was carried out in 156 neurons. Rp-loose ranged from 2.4 to 8.9 MΩ, Rs-loose ranged from 10 to 100 MΩ, and the recording time ranged from 5 to 50 min. As Rp-loose increased, the recording time did not seem to be significantly changed (Figure 1A). The entire interval of Rp-loose was averagely divided into three small intervals [the range of any small interval was (biggest Rp-loose − smallest Rp-loose)/3] (Figure 1A, two green lines). The proportion of neurons with a recording time ≥30 min (hereafter, neurons ≥30 min; Figure 1A, red dots) did not present significant change with Rp-loose values in three small intervals (Chi-square test, χ2 = 4.52, P = 0.11). The Rs-loose values of neurons (≥30 min; Figure 1B, red dots) were mostly in the range of 18–35 MΩ. When 18 and 35 MΩ were used as the cutoff values, the proportion of neurons (≥30 min; Figure 1B, red dots) first increased and then decreased as Rs-loose increased (Chi-square test, χ2 = 25.74, P = 2.58 × 10⁻⁶).
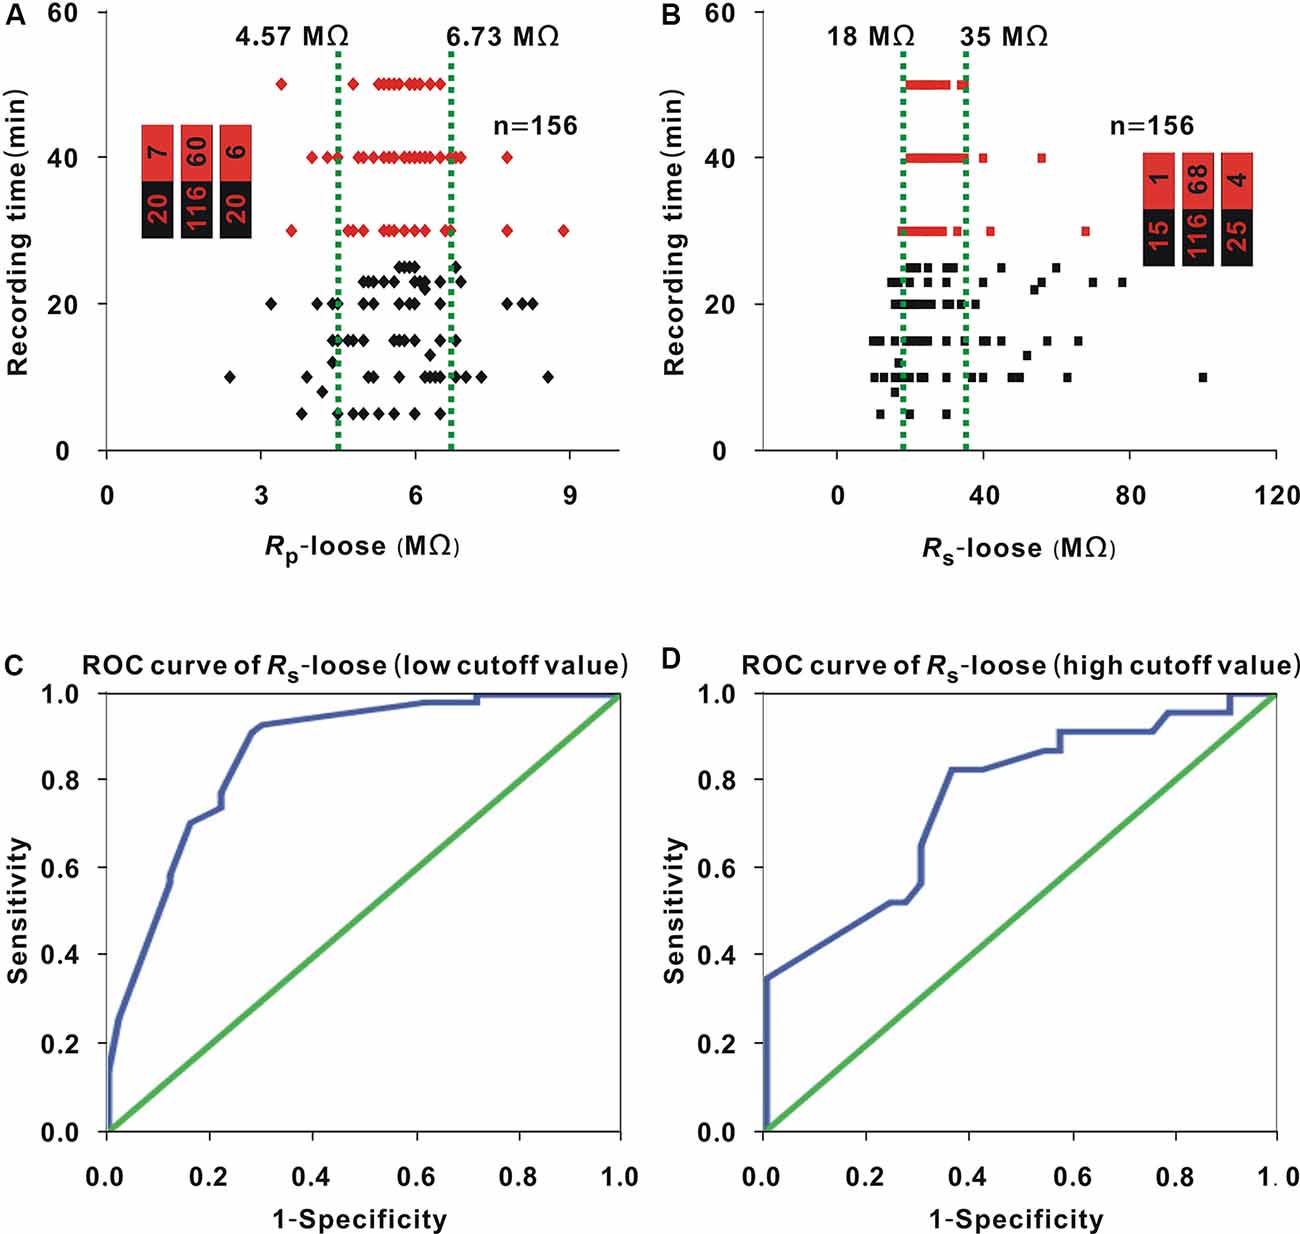
Figure 1. Influence of Rp-loose and Rs-loose on recording time. (A) Change in recording time with Rp-loose (Chi-square test, P > 0.05). Red dots represent neurons (≥30 min). The two green lines were the cut off values to divide the entire interval of the abscissa variable into three small intervals, and the numbers in the bar chart were the number of neurons (≥30 min)/total number in the three small intervals (corresponding to values from left to right); panel (B) is depicted in a similar manner. (B) Change in recording time with Rs-loose (Chi-square test, P < 0.01). Red dots represent neurons (≥30 min). (C) Receiver operating characteristic (ROC) curve to find the low cutoff value of Rs-loose for a high probability of a recording time ≥30 min area under the curve [area under the curve (AUC) = 0.87, and low cutoff value = 21.5 MΩ]. (D) ROC curve to find the high cut off value of Rs-loose for a high probability of a recording time ≥30 min (AUC = 0.76, and high cutoff value = 36 MΩ).
A recording time ≥30 min was considered a successful recording. The optimal interval of Rs-loose should include two cutoff values. To find the two cutoff values, we first determined the Rs-loose values with the highest proportion of neurons (≥30 min). With a 3-MΩ step, the entire interval of 18–35 MΩ could be divided into six small intervals. The number of neurons (≥30 min)/(total number) in these small intervals of 18–20 MΩ, 21–23 MΩ, 24–26 MΩ, 27–29 MΩ, 30–32 MΩ, and 33–35 MΩ were 3/24, 17/20, 33/41, 8/8, 5/15, and 2/8, respectively. In the small interval of 27–29 MΩ, the proportion of neurons (≥30 min) was highest (8/8). To find the low cutoff value, the data of neurons with a Rs-loose value ≤ 29 MΩ were used to draw the ROC curve (Figure 1C), and the AUC was 0.87. According to the Youden index, the low cutoff value was 21.5 MΩ. Similarly, the data of neurons with a Rs-loose value ≥ 27 MΩ were used to draw the ROC curve to find the high cutoff value (Figure 1D), and the AUC was 0.76. According to the Youden index, the high cutoff value was 36 MΩ. Using a similar method to that used in Figure 1A, the proportion of neurons with a Rs-loose value of 21.5–36 MΩ [hereafter, neurons (21.5–36 MΩ); Figure 2, red dots] was not influenced by Rp-loose (Chi-square test, χ2 = 3.21, P = 0.20).
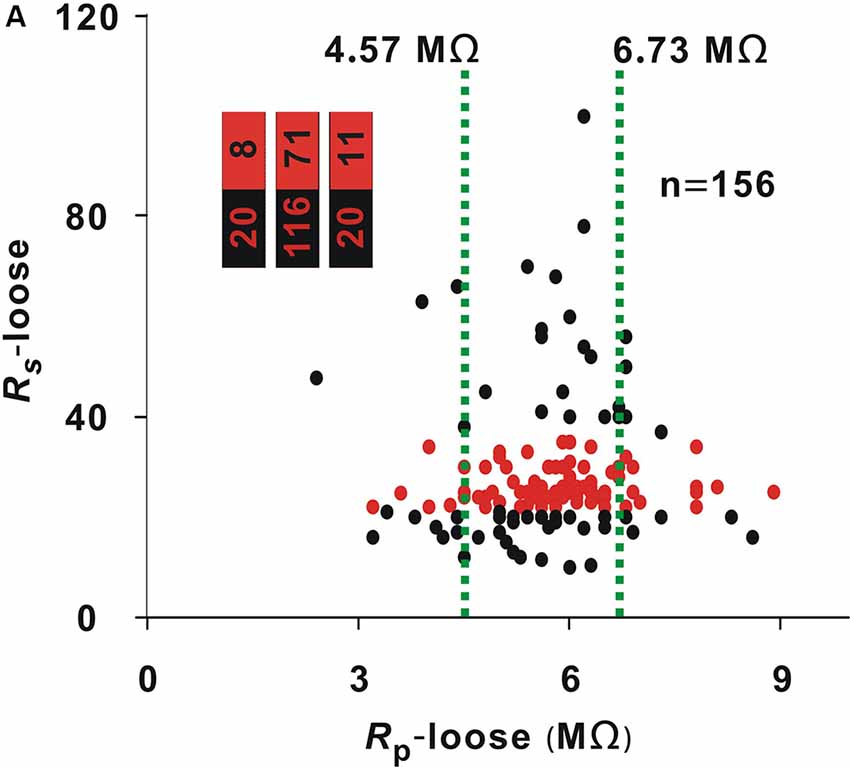
Figure 2. Influence of Rp-loose on Rs-loose. Change in Rs-loose with Rp-loose (Chi-square test, P > 0.05). Red dots represent neurons (21.5–36 MΩ). The two green lines were the cut off values to divide the entire interval of the abscissa variable into three small intervals; numbers in the bar chart were the number of neurons (21.5–36 MΩ)/total number in the three small intervals (corresponding to values from left to right).
Recording Quality of Neurons With a Rs-loose Value of 21.5–36 MΩ and a Recording Time ≥30 min in Loose Patch Recording
In this study, there were 90 neurons (21.5–36 MΩ). Among these 90 neurons, there were 64 neurons (≥30 min; 71.11%). In an example neuron, 60 dB noise stimulation with 20 repetitions was delivered, and we recorded APs 5 and 30 min after sealing (Figures 3A,B, black lines). The AP waveforms were then averaged (Figures 3A,B, red lines). The voltage difference from the positive peak to the negative valley was defined as the AP amplitude (Figure 3A, the voltage between two green lines). The amplitudes of 20 APs or 64 averaged APs at 5 min were similar to those at 30 min in the example neuron (Figure 3C, Mann–Whitney U test, Z = −1.89, P = 0.06) or in all recorded neurons (Figure 3D, Mann–Whitney U test, Z = −0.74, P = 0.45).
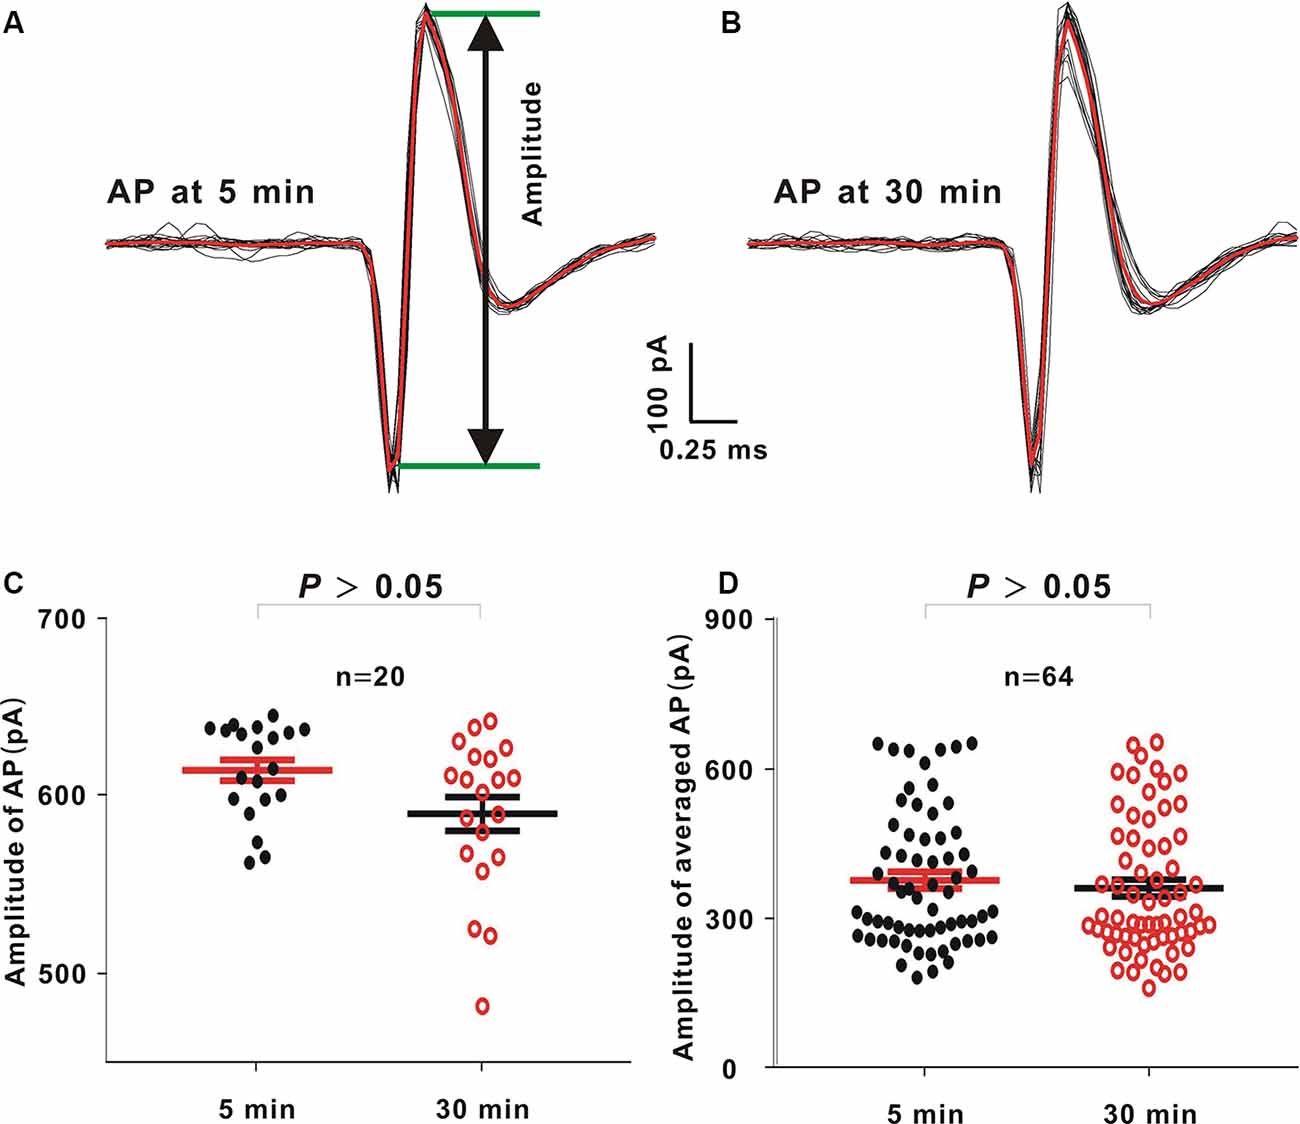
Figure 3. Comparison between action potential (AP) amplitudes at 5 and 30 min after sealing in loose patch recording. (A,B) In an example neuron, 60 dB noise evoked APs 5 and 30 min after sealing. The averaged APs (red lines) were obtained by averaging 20 APs (black lines) to the same acoustic stimulus. (C) AP amplitudes from the example neuron at 5 and 30 min (mean = 613.45 and SE = 5.88 at 5 min, and mean = 588.99 and SE = 8.52 at 30 min, Mann–Whitney U test, P > 0.05). (D) Averaged AP amplitudes from all neurons at 5 and 30 min (mean = 377.79 and SE = 16.79 at 5 min, and mean = 362.10 and SE = 16.78 at 30 min, Mann–Whitney U test, P > 0.05).
Correlation Among Rp-Tight, Rs-Tight, MPzero-current, and Recording Time in Whole-Cell Recording
Whole-cell recording was carried out in 146 neurons. Rp-tight ranged from 4.8 to 7.2 MΩ; Rs-tight ranged from 1 to 5.6 GΩ; MPzero-current ranged from −78 to −15 mV; and the recording time ranged from 5 to 50 min. With the same method as that used in Figure 1A, in three small intervals, the proportion of neurons (≥30 min; Figure 4A, red dots) did not significantly change as Rp-tight increased (Chi-square test, χ2 = 4.13, P = 0.13), the proportions of neurons (≥30 min; Figures 4B,C, red dots) gradually increased as Rs-tight increased (Chi-square test, χ2 = 14.75, P = 0.63 × 10⁻³), and MPzero-current decreased (Chi-square test, χ2 = 36.86, P = 9.90 × 10⁻⁹). A recording time ≥30 min was defined as a successful recording. To find the cutoff values of Rs-tight and MPzero-current for a high probability of a recording time ≥30 min, the ROC curves of Rs-tight and MPzero-current were plotted (Figures 4D,E). The AUC of Rs-tight was 0.73, which was smaller than that of MPzero-current (0.80). According to the Youden index, the cutoff value of Rs-tight was 2.35 GΩ, and the cutoff value of MPzero-current was −53.5 mV.
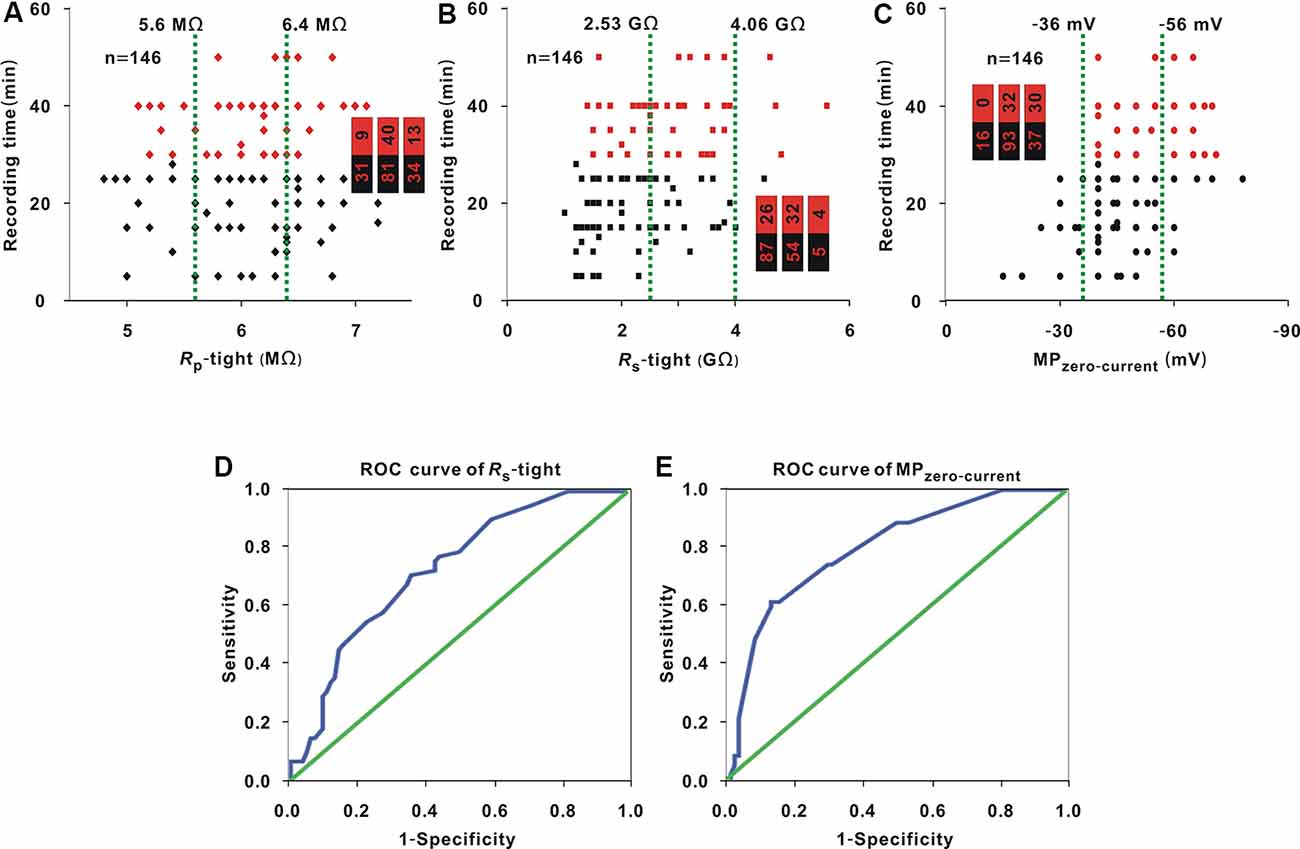
Figure 4. Influence of Rp-tight, Rs-tight, and MPzero-current on recording time. (A) Change in recording time with Rp-tight (Chi-square test, P > 0.05). Red dots represent neurons (≥30 min), which is the same in panels (B,C). The two green lines are the cutoff values to divide the entire interval of the abscissa variable into three small intervals; the numbers in the bar chart are the number of neurons (≥30 min)/total number in the three small intervals (corresponding to values from left to right); the same is the case in panels (B,C). (B) Change in recording time with Rs-tight (Chi-square test, P < 0.01). (C) Change in recording time with MPzero-current (Chi-square test, P < 0.01). (D) ROC curve to find the cutoff value of Rs-tight for a high probability of a recording time ≥30 min (AUC = 0.73, cutoff value = 2.35 GΩ). (E) ROC curve to find the cutoff value of MPzero-current for a high probability of a recording time ≥30 min (AUC = 0.80, cutoff value = −53.5 mV).
As shown in the analysis in Figure 1A, in the three small intervals, the proportion of neurons with MPzero-current values ≤ −53.5 mV [hereafter, neurons (≤ −53.5 mV; Figure 5A, red dots)] did not change with Rp-tight (Chi-square test, χ2 = 0.49, P = 0.78), and the proportion of neurons (≤ −53.5 mV) or neurons with a Rs-tight value ≥ 2.35 GΩ [hereafter, neurons (≥2.35 GΩ; Figures 5B,C, red dots)] gradually increased as Rs-tight (Chi-square test, χ2 = 11.08, P = 3.92 × 10⁻³) or Rp-tight (Chi-square test, χ2 = 14.78, P = 0.62 × 10⁻³) increased. A MPzero-current value ≤ −53.5 mV was defined as a successful seal. To find the cutoff value of Rs-tight for the high probability of a MPzero-current value ≤ −53.5 mV, the ROC curve of Rs-tight was plotted (Figure 5D). The AUC was 0.69. According to the Youden index, the cutoff value of Rs-tight was 2.70 GΩ, which was similar to the cutoff value (2.35 GΩ) of Rs-tight for a high probability of a recording time ≥30 min.
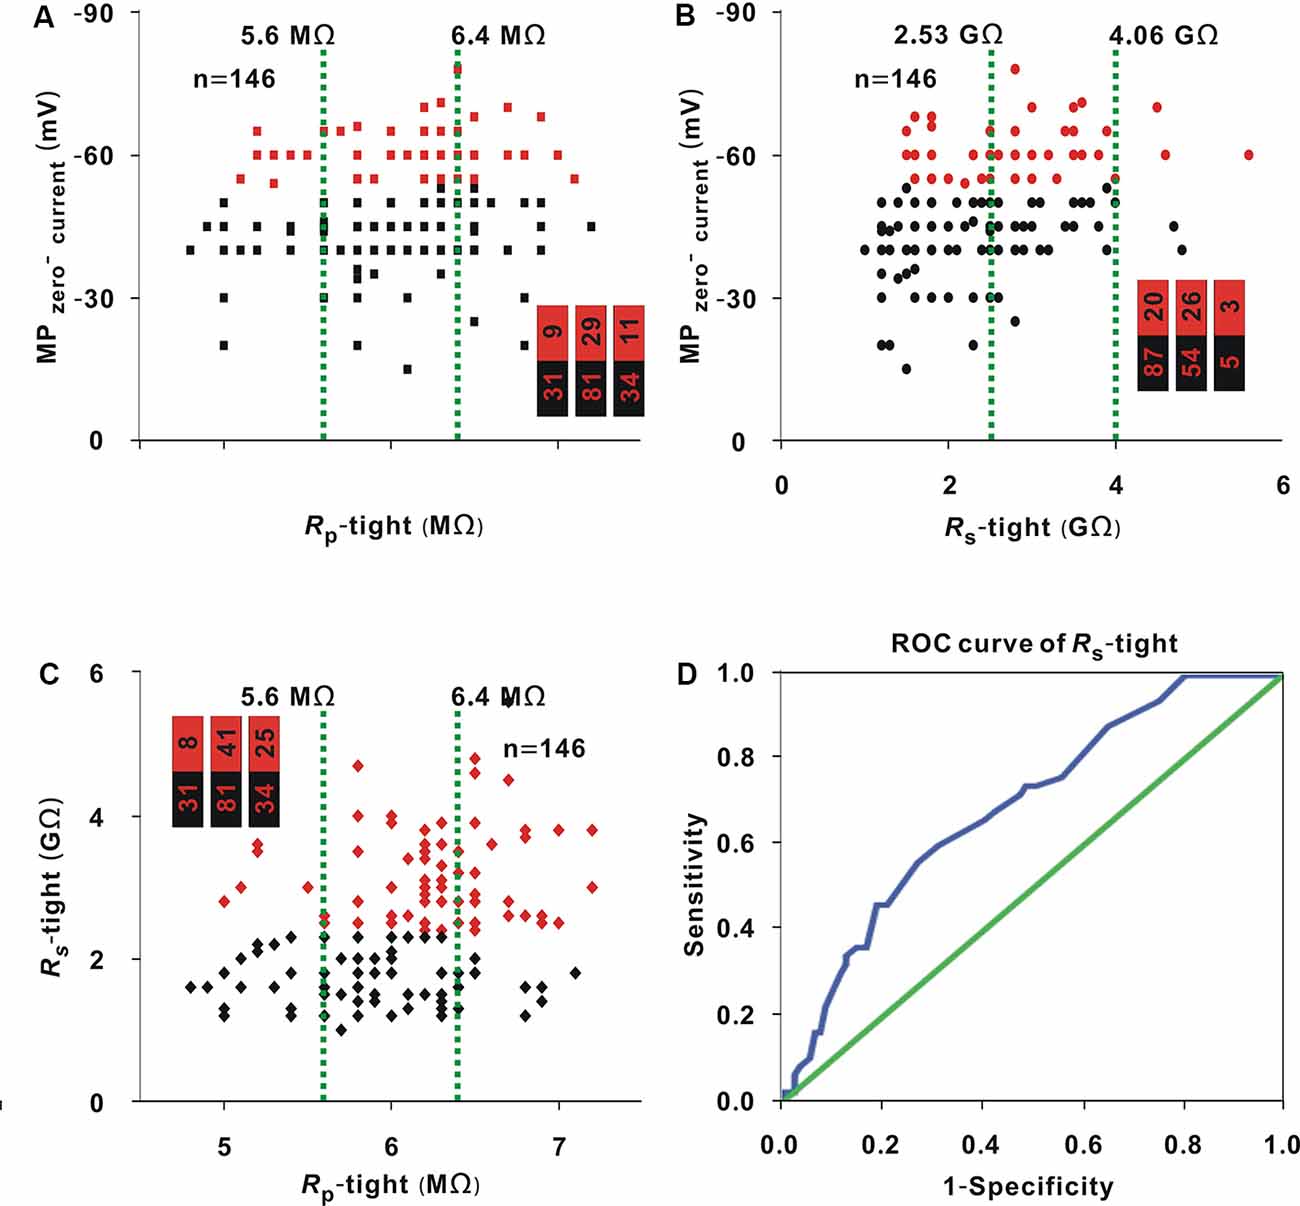
Figure 5. Correlation among MPzero-current, Rs-tight, and Rp-tight. (A) Change in MPzero-current with Rp-tight (Chi-square test, P > 0.05). Red dots represent neurons (−53.5 mV). The two green lines are the cutoff values to divide the entire interval of the abscissa variable into three small intervals, and the numbers in the bar chart were the number of neurons (−53.5 mV)/total number in the three small intervals (corresponding to values from left to right); this is also the case in panels (B,C). (B) Change in MPzero-current with Rs-tight (Chi-square test, P < 0.01). Red dots represent neurons (≤ −53.5 mV). (C) Changes in Rs-tight with Rp-tight (Chi-square test, P < 0.01). Red dots represent neurons (≥2.35 GΩ). (D) ROC curve to find the cutoff value of Rs-tight for a high probability of a MPzero-current ≤ −53.5 mV (AUC = 0.69, cutoff value = 2.70 GΩ).
Recording Quality of Neurons With a MPzero-current Value ≤ −53.5 mV and a Recording Time ≥30 min in Whole-Cell Recording
In this study, there were 49 neurons (≤ −53.5 mV), among which there were 38 neurons (≥30 min; 77.55%). Similar to the loose patch recording approach, 60-dB noise stimulation with 20 repetitions was presented to evoke IPSCs and EPSCs (Figures 6A,B, black lines, an example neuron). Then, the averaged IPSC and EPSC were obtained (Figures 6A,B, red line). The IPSC and EPSC amplitudes were extracted by measuring the voltage difference from the baseline to the positive or negative peak (Figures 6A,B, the voltage between two green lines). In the example neuron, the amplitudes of 20 IPSCs or EPSCs at 5 min were not significantly different from those at 30 min (IPSC, unpaired t-test, t = 0.32, P = 0.75; Figure 6C; EPSC, Mann–Whitney U test, Z = −0.62, P = 0.53; Figure 6D). Moreover, when the averaged IPSC or EPSC was used to measure the amplitude, in 38 recorded neurons, the amplitudes of averaged IPSC or EPSC at 5 min were consistent with those at 30 min (IPSC, unpaired t-test, t = 0.48, P = 0.63; Figure 6E; EPSC, Mann–Whitney U test, Z = −0.46, P = 0.64; Figure 6F).
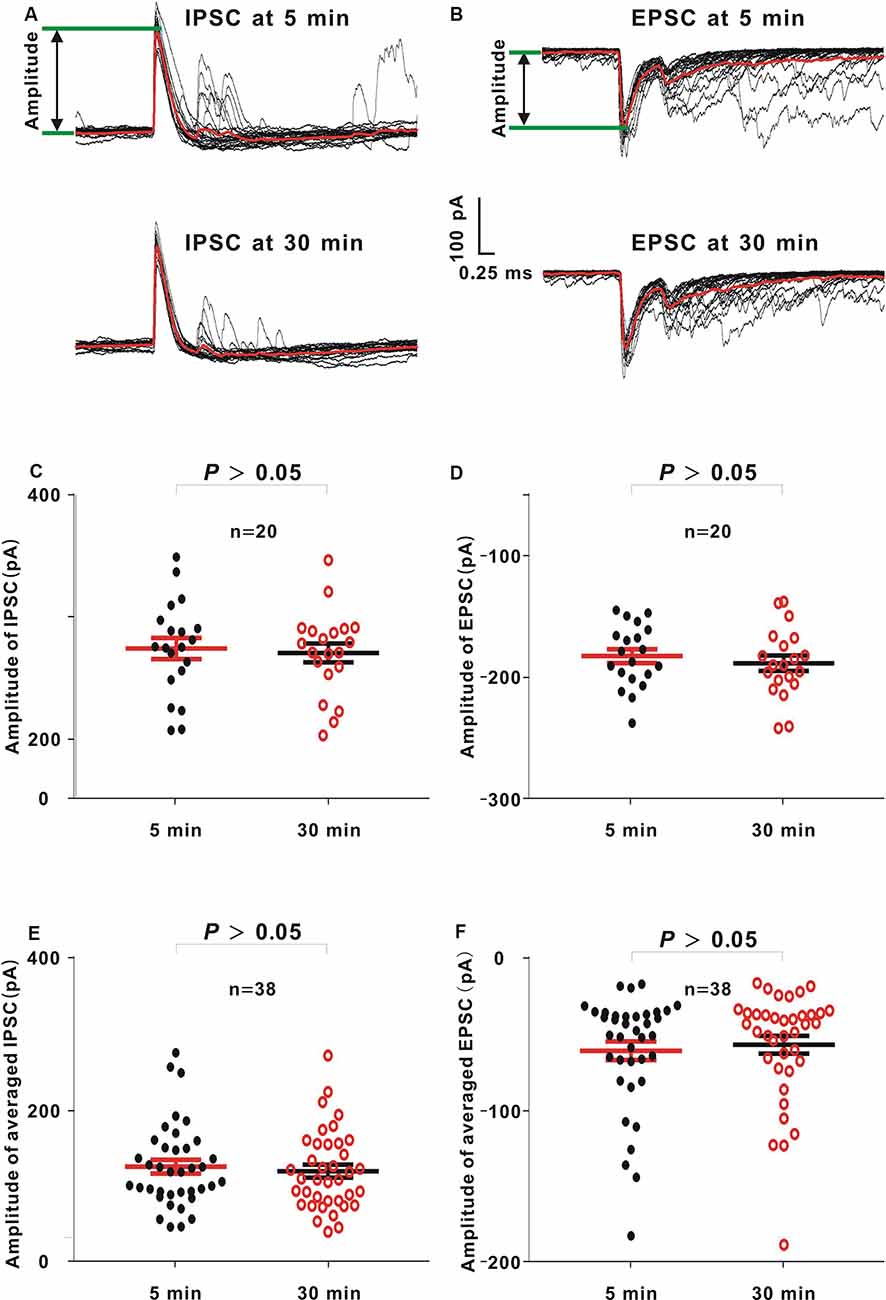
Figure 6. Comparison between amplitudes of inhibitory postsynaptic currents (IPSCs) or excitatory postsynaptic currents (EPSCs) 5 and 30 min after sealing in whole-cell recording. (A,B) In an example neuron, 60-dB noise-evoked IPSCs (A) or EPSCs (B) 5 and 30 min after the seal. The averaged IPSCs or EPSCs (red lines) were obtained by averaging 20 IPSCs or EPSCs (black lines) to the same acoustic stimulus. (C,D) IPSC or EPSC amplitudes from the example neuron at 5 and 30 min (IPSC, mean = 274.47 and SE = 8.74 at 5 min, and mean = 270.75 and SE = 7.79 at 30 min, unpaired t test, P > 0.05; EPSC, mean = −182.29 and SE = 5.72 at 5 min, and mean = −188.14 and SE = 6.34 at 30 min, Mann–Whitney U test, P > 0.05). (E,F) Averaged IPSC or EPSC amplitudes from all neurons at 5 and 30 min (IPSC, mean = 125.18 and SE = 8.89 at 5 min, and mean = 119.31 and SE = 8.41 at 30 min, unpaired t-test, P > 0.05; EPSC, mean = −61.02 and SE = 6.07 at 5 min, and mean = −57.05 and SE = 5.81 at 30 min, Mann–Whitney U test, P > 0.05).
Correlation Between Rp-Tight and MPzero-current or Recording Time in Neurons (≥2.35 GΩ) or Neurons With a Rs-Tight <2.35 GΩ in Whole-Cell Recording
In whole-cell recording, the MPzero-current and recording time were associated with Rs-tight (Figures 4B, 5B), and Rs-tight was associated with Rp-tight (Figure 5C). Thus, the MPzero-current and recording time should theoretically depend on Rp-tight. However, this dependence is not supported by our results (Figures 4A, 5A). To further examine the correlation between Rp-tight value and MPzero-current value or recording time, we divided the neurons in whole-cell recording into two groups, neurons (≥2.35 GΩ) and neurons with a Rs-tight < 2.35 GΩ [hereafter, neurons (<2.35 GΩ)].
The data in Figures 7A–D were analyzed with similar methods to that used in Figure 1A. In neurons (<2.35 GΩ), the proportion of neurons (≤ −53.5 mV; Figure 7A, red dots) or neurons (≥30 min; Figure 7B, red dots) did not show a significant change with Rp-tight (MPzero-current: Chi-square test, χ2 = 1.14, P = 0.57; recording time: Chi-square test, χ2 = 0.05, P = 0.98). In neurons (≥2.35 GΩ), the proportion of neurons (≤ −53.5 mV; Figure 7C, red dots) exhibited no significant change with Rp-tight (Chi-square test, χ2 = 2.43, P = 0.30); the proportion of neurons (≥30 min; Figure 7D, red dots) first showed an increase and then a decrease as Rp-tight increased (Chi-square test, χ2 = 9.96, P = 6.86 × 10⁻³).
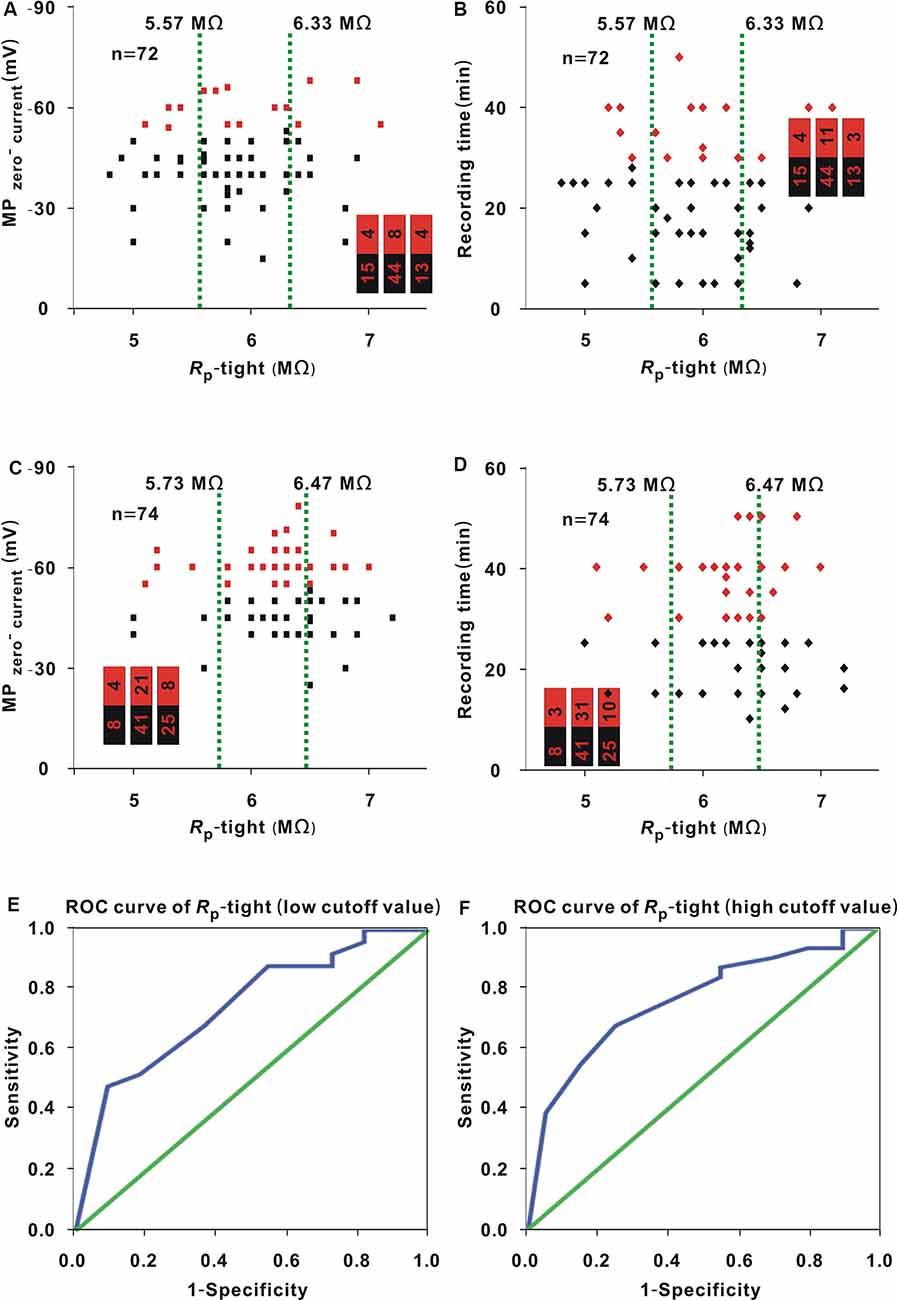
Figure 7. Influence of Rp-tight on the MPzero-current and recording time in neurons (≥2.35 GΩ) or neurons (<2.35 GΩ) for whole-cell recording. (A) Change in MPzero-current with Rp-tight in neurons (<2.35 GΩ; Chi-square test, P > 0.05). Red dots represent neurons (≤ −53.5 mV). The two green lines were the cutoff values to divide the entire interval of the abscissa variable into three small intervals, and the numbers in the bar chart were the number of neurons (≤ −53.5 mV)/total number in the three small intervals (corresponding to values from left to right); this is also the case in panels (B–D). (B) Change in recording time with Rp-tight in neurons (<2.35 GΩ; Chi-square test, P > 0.01). Red dots represent neurons (≥30 min). (C) Change in MPzero-current with Rp-tight in neurons (≥2.35 GΩ; Chi-square test, P > 0.05). Red dots represent neurons (≤ −53.5 mV). (D) Changes in recording time with Rp-tight in neurons (≥2.35 GΩ; Chi-square test, P < 0.01). Red dots represent neurons (≥30 min). (E) ROC curve to find the low cutoff value of Rp-tight for a high probability of a recording time ≥30 min in neurons (≥2.35 GΩ; AUC = 0.75, low cutoff value = 6.15 MΩ). (F) ROC curve to find the high cutoff value of Rp-tight for a high probability of a recording time ≥30 min in neurons (≥2.35 GΩ; AUC = 0.76, high cutoff value = 6.45 MΩ).
In the second small interval of 5.73–6.47 MΩ (Figure 7D), we further examined the seven small intervals determined in the 1-MΩ step. The numbers of neurons (≥30 min)/(total number) in the small intervals of 5.8 MΩ, 5.9 MΩ, 6.0 MΩ, 6.1 MΩ, 6.2 MΩ, 6.3 MΩ, and 6.4 MΩ were 5/7, 0/0, 4/6, 1/2, 12/13, 5/7, and 4/6, respectively. In the small interval of 6.2 MΩ, the proportion of neurons (≥30 min) was highest (12/13). To find the low cutoff value, the data of neurons with a Rp-tight ≤6.2 MΩ were used to plot the ROC curve (Figure 7E). The AUC was 0.75, and the low cutoff value was 6.15 MΩ based on the Youden index. Similarly, the data of neurons with a Rp-tight ≥6.2 MΩ were used to plot the ROC curve and determine the high cutoff value (Figure 7F). The AUC was 0.76, and the high cutoff value was 6.45 MΩ from the Youden index.
Discussion
Rp-loose and Rp-Tight for a High Probability of a Recording Time ≥30 min
An AUC value ≥0.7 of the ROC suggests that the prediction performance of a variable is acceptable (Mandrekar, 2010). In neurons (≥2.35 GΩ), the AUC values of the two ROC curves for finding low and high cutoff values of Rp-tight were larger than 0.7. Therefore, 6.15–6.45 MΩ were optimal Rp-tight values for a high probability of a recording time ≥30 min, which is similar to the Rp-tight values used in the report by Malboubi et al. (2009). This result supported the analysis in the “Introduction” section, which states that Rp-tight cannot be too small or too large. However, in loose patch recording or neurons (<2.35 GΩ), the Rp-loose or Rp-tight did not influence the recording time (Figures 1A, 7B). This lack of influence may be because the Rp-loose or Rp-tight in our study may be in the optimal range for having a high probability of a recording time ≥30 min or because the seal is relatively loose in loose patch recording or neurons (<2.35 GΩ), and the recording time is greatly influenced by the mechanical stability of the seal, not by Rp-loose or Rp-tight value.
Rs-loose or Rs-Tight for a High Probability of a Recording Time ≥30 min
The AUC values of ROC curves to find the cutoff values of Rs-loose or Rs-tight were larger than 0.7 (Mandrekar, 2010). Consequently, it was suitable that for a high probability of a recording time ≥30 min, the optimal Rs-loose was 21.5–36 MΩ and the optimal Rs-tight was ≥2.35 GΩ. In neurons (21.5–36 MΩ), 71.11% of neurons could be recorded ≥30 min; at 30 min after sealing, the AP amplitudes remained the same (Figures 3C,D). These results further support that Rs-loose values of 21.5–36 MΩ are suitable. In theory, higher Rs-loose or Rs-tight value means that the mechanical stability of the seal is higher. However, loose patch recording is a form of extracellular recording without rupturing the membrane (Neher et al., 1978). Different from whole-cell recording, if Rs-loose reaches GΩ, the AP is not usually recognizable in loose patch recording. Therefore, Rs-loose needs to be smaller, and the electrode tip and cell membrane cannot be too clean in loose patch recording. Due to the uncleanliness, suction is usually used to reach the target Rs-loose value (Roberts and Almers, 1992). The larger the strength of suction is, the higher Rs-loose is, and the easier it is to damage the cell membrane or seal (Weiss et al., 1986; Milton and Caldwell, 1990; Roberts et al., 1990; Roberts and Almers, 1992). That is, different from Rs-tight, as Rs-loose further increases, the recording time conversely decreases.
After determining the optimal Rs-loose value, we can adjust Rs-loose to the target value via suction or advancing or retracting the recording electrode. Whole-cell recording requires higher Rs-tight (≥1 GΩ; Hamill et al., 1981), which is very difficult to achieve by only suction, or altering the depth of the recording electrode. To achieve optimal Rs-tight value, it is important to keep the electrode tip and cell membrane clean (Hamill et al., 1981; Stett et al., 2003; Kornreich, 2007) and the recording system steady (Wang et al., 2016).
MPzero-current for a High Probability of a Recording Time ≥30 min
In addition to Rs-tight, the MPzero-current value also reflects the seal state. A lower MPzero-current value means a higher mechanical stability of the seal (Hamill et al., 1981; Kornreich, 2007). As the AUC value of the ROC curve increases, the prediction performance of a variable becomes better (Mandrekar, 2010). The AUC of the ROC curve to find the cutoff value of MPzero-current (0.80) was larger than that of Rs-tight (0.73). Therefore, compared with Rs-tight, the MPzero-current is a better index for predicting a high probability of a recording time ≥30 min. The optimal MPzero-current value was ≤ −53.5 mV. This optimal value was also supported by a high proportion of neurons (≥30 min) and a high recording quality of IPSC and EPSC in neurons (≤ −53.5 mV; Figures 6E,F).
The MPzero-current reflects the eventual seal state. For whole-cell recording, if the Rs-tight value is ≥1 GΩ, the cell membrane needs to be artificially ruptured (Hamill et al., 1981). During the rupturing process, the stability of the seal may decrease. Therefore, Rs-tight does not reflect the eventual seal state and results in worse prediction performance in comparison with the MPzero-current. Reaching the optimal Rs-tight value does not mean that the optimal MPzero-current can be achieved. It is still necessary for the experimenter to improve his or her skill regarding rupturing membrane to obtain the optimal MPzero-current.
Correlation Between Seal Resistance and MPzero-current or Pipette Resistance in Loose Patch or Whole-Cell Recording
Both Rs-tight and MPzero-current represent seal condition. Rs-tight was related to the MPzero-current (Figures 5B,D). For a high probability of an MPzero-current ≤ −53.5 mV, the optimal Rs-tight was ≥2.70 GΩ, which was similar to ≥2.35 GΩ for a high probability of a recording time ≥30 min. Notably, 2.35 GΩ was determined by directly analyzing the recording time and was smaller than 2.70 GΩ. We considered that the value ≥2.35 GΩ was optimal for Rs-tight. Rs-tight changed with Rp-tight (Figure 5C). This result was different from that of Rs-loose, which was not influenced by Rp-loose (Figure 2A). This difference may also be attributed to the fact that Rp-loose had been in the optimal range or that the seal is relatively loose in the loose patch recording, and Rs-loose is mostly dependent on the mechanical stability of the seal, not on the Rp-loose.
Strengths and Limitations of This Study
In previous studies, Rp-loose (Roberts and Almers, 1992), Rp-tight (Hamill et al., 1981; Malboubi et al., 2009), Rs-loose (Roberts and Almers, 1992), Rs-tight (Neher et al., 1978; Malboubi et al., 2009), or MPzero-current (Hamill et al., 1981) values vary greatly. In this study, for long-lasting in vivo loose patch or whole-cell recordings, we applied the ROC curve to analyze the recording time for obtaining optimal Rp-loose, Rp-tight, Rs-loose, Rs-tight, or MPzero-current values. However, this study has some limitations. First, the recording time can be influenced by other factors (craniotomy quality (Lee et al., 2014), animal movement (Lee and Lee, 2017), brain pulsation (Levy et al., 2012), and cleanliness of the recording electrode (Hamill et al., 1981; Stett et al., 2003). These other factors cannot be controlled based on identical standards and may cause a biased result. Second, according to our experiment, a recording time ≥30 min was defined as a successful recording. When the cutoff value of the recording time was not 30 min, the results would be different. Third, the cell type and size can influence the selection of electrode or seal parameters (Penner, 1995). Our data were acquired from neurons in the primary auditory cortex, most of which have a size of at least 10 μm (Gopal and Gross, 1996; Hinova-Palova et al., 2018) and a MPzero-current of −70 mV (Zhao et al., 2015). For smaller neurons (Tucker et al., 1979) or other cells (Lacampagne et al., 1996; Euler and Wässle, 1998), the optimal Rp-loose, Rp-tight, Rs-loose, Rs-tight, or MPzero-current values may be different.
Conclusions
For a high probability of a recording time ≥30 min, 21.5–36 MΩ is the optimal Rs-loose value, 6.15–6.45 MΩ is the optimal Rp-tight value, ≥2.35 GΩ is the optimal Rs-tight value, and ≤ −53.5 mV is the optimal MPzero-current value. Additionally, the MPzero-current is better than Rs-tight for predicting a positive event.
Data Availability Statement
All datasets generated for this study are included in the article.
Ethics Statement
The animal study was reviewed and approved by the Animal Care and Use Committee of Shantou University Medical College, Guangdong, China.
Author Contributions
LY: conceptualization, data curation, formal analysis, investigation, writing—review and editing. QF: formal analysis, investigation, writing—review and editing. XZ: data calculation and manuscript revision. BH: conceptualization, supervision, funding acquisition, validation, investigation, visualization, methodology, project administration, and writing—original draft.
Conflict of Interest
The authors declare that the research was conducted in the absence of any commercial or financial relationships that could be construed as a potential conflict of interest.
References
Euler, T., and Wässle, H. (1998). Different contributions of GABAA and GABAC receptors to rod and cone bipolar cells in a rat retinal slice preparation. J. Neurophysiol. 79, 1384–1395. doi: 10.1152/jn.1998.79.3.1384
Gopal, K. V., and Gross, G. W. (1996). Auditory cortical neurons in vitro: cell culture and multichannel extracellular recording. Acta Otolaryngol. 116, 690–696. doi: 10.3109/00016489609137908
Hamill, O. P., Marty, A., Neher, E., Sakmann, B., and Sigworth, F. J. (1981). Improved patch-clamp techniques for high-resolution current recording from cells and cell-free membrane patches. Pflugers Arch. 2, 85–100. doi: 10.1007/bf00656997
Hinova-Palova, D., Iliev, A., Edelstein, L., Landzhov, B., Kotov, G., and Paloff, A. (2018). Electron microscopic study of Golgi-impregnated and gold-toned neurons and fibers in the claustrum of the cat. J. Mol. Histol. 6, 615–630. doi: 10.1007/s10735-018-9799-7
Horn, R., and Brodwick, M. S. (1980). Acetylcholine-induced current in perfused rat myoballs. J. Gen. Physiol. 75, 297–321. doi: 10.1085/jgp.75.3.297
Horn, R., and Korn, S. J. (1992). Prevention of rundown in electrophysiological recording. Methods Enzymol. 207, 149–155. doi: 10.1016/0076-6879(92)07010-l
Kornreich, B. G. (2007). The patch clamp technique: principles and technical considerations. J. Vet. Cardiol. 9, 25–37. doi: 10.1016/j.jvc.2007.02.001
Lacampagne, A., Lederer, W. J., Schneider, M. F., and Klein, M. G. (1996). Repriming and activation alter the frequency of stereotyped discrete Ca2+ release events in frog skeletal muscle. J. Physiol. 497, 581–588. doi: 10.1113/jphysiol.1996.sp021791
Lee, D., and Lee, A. K. (2017). Whole-cell recording in the awake brain. Cold Spring Harb. Protoc. 2017:pdb.top087304. doi: 10.1101/pdb.top087304
Lee, D., Shtengel, G., Osborne, J. E., and Lee, A. K. (2014). Anesthetized- and awake-patched whole-cell recordings in freely moving rats using UV-cured collar-based electrode stabilization. Nat. Protoc. 12, 2784–2795. doi: 10.1038/nprot.2014.190
Levy, M., Schramm, A. E., and Kara, P. (2012). Strategies for mapping synaptic inputs on dendrites in vivo by combining two-photon microscopy, sharp intracellular recording and pharmacology. Front. Neural Circuits 6:101. doi: 10.3389/fncir.2012.00101
Malboubi, M., Ostadi, H., Wang, S., Gu, Y., and Jiang, K. (2009). The Effect of Pipette Tip Roughness on Giga-Seal Formation. London, UK: The World Congress on Engineering.
Mandrekar, J. N. (2010). Receiver operating characteristic curve in diagnostic test assessment. J. Thorac. Oncol. 5, 1315–1316. doi: 10.1097/jto.0b013e3181ec173d
Milton, R. L., and Caldwell, J. H. (1990). Na current in membrane blebs: implications for channel mobility and patch clamp recording. J. Neurosci. 10, 885–893. doi: 10.1523/JNEUROSCI.10-03-00885.1990
Neher, E., Sakmann, B., and Steinbach, J. H. (1978). The extracellular patch clamp: a method for resolving currents through individual open channels in biological membranes. Pflugers Arch. 375, 219–228. doi: 10.1007/bf00584247
Penner, R. (1995). “A practical guide to patch clamping,” in Single-Channel Recording, eds B. Sakmann and E. Neher (New York, NY: Plenum), 3–30.
Roberts, W. M., and Almers, W. (1992). Patch voltage clamping with low-resistance seals: loose patch clamp. Methods Enzymol. 207, 155–176. doi: 10.1016/0076-6879(92)07011-c
Roberts, W. M., Jacobs, R. A., and Hudspeth, A. J. (1990). Colocalization of ion channels involved in frequency selectivity and synaptic transmission at presynaptic active zones of hair cells. J. Neurosci. 10, 3664–3684. doi: 10.1523/JNEUROSCI.10-11-03664.1990
Søreide, K. (2009). Receiver-operating characteristic curve analysis in diagnostic, prognostic and predictive biomarker research. J. Clin. Pathol. 62, 1–5. doi: 10.1136/jcp.2008.061010
Stett, A., Burkhardt, C., Weber, U., van Stiphout, P., and Knott, T. (2003). CYTOCENTERING: a novel technique enabling automated cell-by-cell patch clamping with the CYTOPATCH chip. Rec. Channels 1, 59–66. doi: 10.1080/10606820308254
Sun, Y. J., Kim, Y. J., Ibrahim, L. A., Tao, H. W., and Zhang, L. I. (2013). Synaptic mechanisms underlying functional dichotomy between intrinsic-bursting and regular-spiking neurons in auditory cortical layer 5. J. Neurosci. 12, 5326–5339. doi: 10.1523/JNEUROSCI.4810-12.2013
Sun, Y. J., Wu, G. K., Liu, B. H., Li, P., Zhou, M., Xiao, Z., et al. (2010). Fine-tuning of pre-balanced excitation and inhibition during auditory cortical development. Nature 7300, 927–931. doi: 10.1038/nature09079
Tan, X., Wang, X., Yang, W., and Xiao, Z. (2008). First spike latency and spike count as functions of tone amplitude and frequency in the inferior colliculus of mice. Hear. Res. 235, 90–104. doi: 10.1016/j.heares.2007.10.002
Tucker, G. S., Hamasaki, D. I., Labbie, A., and Muroff, J. (1979). Anatomic and physiologic development of the photoreceptor of the kitten. Exp. Brain Res. 3, 459–474. doi: 10.1007/bf00236817
Wang, Y., Liu, Y. Z., Wang, S. Y., and Wang, Z. (2016). In vivo whole-cell recording with high success rate in anaesthetized and awake mammalian brains. Mol. Brain 1:86. doi: 10.1186/s13041-016-0266-7
Wehr, M., and Zador, A. M. (2003). Balanced inhibition underlies tuning and sharpens spike timing in auditory cortex. Nature 426, 442–446. doi: 10.1038/nature02116
Weiss, R. E., Roberts, W. M., Stuhmer, W., and Almers, W. (1986). Mobility of voltage-dependent ion channels and lectin receptors in the sarcolemma of frog skeletal muscle. J. Gen. Physiol. 6, 955–983. doi: 10.1085/jgp.87.6.955
Wu, G. K., Li, P., Tao, H. W., and Zhang, L. I. (2006). Nonmonotonic synaptic excitation and imbalanced inhibition underlying cortical intensity tuning. Neuron 4, 705–715. doi: 10.1016/j.neuron.2006.10.009
Wu, G. K., Tao, H. W., and Zhang, L. I. (2011). From elementary synaptic circuits to information processing in primary auditory cortex. Neurosci. Biobehav. Rev. 35, 2094–2104. doi: 10.1016/j.neubiorev.2011.05.004
Xiong, X. R., Liang, F., Li, H., Mesik, L., Zhang, K. K., Polley, D. B., et al. (2013). Interaural level difference-dependent gain control and synaptic scaling underlying binaural computation. Neuron 4, 738–753. doi: 10.1016/j.neuron.2013.06.012
Zhang, L. I., Tan, A. Y., Schreiner, C. E., and Merzenich, M. M. (2003). Topography and synaptic shaping of direction selectivity in primary auditory cortex. Nature 6945, 201–205. doi: 10.1038/nature01796
Zhao, Y., Zhang, Z., Liu, X., Xiong, C., Xiao, Z., and Yan, J. (2015). Imbalance of excitation and inhibition at threshold level in the auditory cortex. Front. Neural Circuits 9:11. doi: 10.3389/fncir.2015.00011
Keywords: in vivo recordings, pipette resistance, seal resistance, membrane potential, recording time
Citation: Yan L, Fang Q, Zhang X and Huang B (2020) Optimal Pipette Resistance, Seal Resistance, and Zero-Current Membrane Potential for Loose Patch or Breakthrough Whole-Cell Recording in vivo. Front. Neural Circuits 14:34. doi: 10.3389/fncir.2020.00034
Received: 09 March 2020; Accepted: 11 May 2020;
Published: 30 June 2020.
Edited by:
Alexey Semyanov, Institute of Bioorganic Chemistry (RAS), RussiaReviewed by:
Giorgio Rispoli, University of Ferrara, ItalyYulia Dembitskaya, Collège de France, France
Copyright © 2020 Yan, Fang, Zhang and Huang. This is an open-access article distributed under the terms of the Creative Commons Attribution License (CC BY). The use, distribution or reproduction in other forums is permitted, provided the original author(s) and the copyright owner(s) are credited and that the original publication in this journal is cited, in accordance with accepted academic practice. No use, distribution or reproduction is permitted which does not comply with these terms.
*Correspondence: Bowan Huang, bowanhuang@126.com
† These authors have contributed equally to this work