Construction of 3-D Humeral Head Statistical Shape Model in CT Images
by
 , ,
, ,
Fahad Parvez Mahdi
1,* ,
,
Tomoyuki Muto
2,
Hiroshi Tanaka
2,
Hiroaki Inui
2,
Katsuya Nobuhara
2 and
Syoji Kobashi
1
1
Graduate School of Engineering, University of Hyogo, Hyogo 671-2280, Japan
2
Nobuhara Hospital and Institute of Biomechanics, Hyogo, Japan
*
Author to whom correspondence should be addressed.
Appl. Sci. 2020, 10(16), 5591; https://doi.org/10.3390/app10165591
Submission received: 20 July 2020
/
Revised: 9 August 2020
/
Accepted: 10 August 2020
/
Published: 12 August 2020
(This article belongs to the Special Issue Computational modeling in medical image analysis)
Abstract
:Featured Application
The research work is aimed to provide a statistical shape model of the humeral head towards the treatment of glenohumeral osteoarthritis.
Abstract
Replacing the humeral head with an artificial one via surgery is one of the options to treat glenohumeral osteoarthritis. Thus, designing the artificial humeral head is an important step to alter clinical outcomes. In order to design the artificial humeral head, the individual variety of the humeral heads should be investigated. The statistical shape model (SSM) has been attracting considerable attention to grasp 3-D shape variety; however, no method to derive the SSM of humeral heads has been studied. This paper proposes a method to construct an SSM of humeral heads based on the anatomical landmarks in shoulder computed tomography (CT) images. The proposed method consists of three steps: humeral head extraction, position and pose alignment, and finally, principle component analysis. The method was applied to 22 male subjects with leave-one-out cross validation. The proposed method obtained an average Dice coefficient of 0.92 to represent the individual shape using the constructed SSM. According to shape analysis of the humeral head, we found that the thickness of the humeral head was associated with individual characteristics of the humeral head. Therefore, it can be said that this study can provide patient-specific design of an artificial humeral head.
1. Introduction
Osteoarthritis has a negative impact on daily activities for millions of elderly people around the world [1,2]. In relation to the aging of articular cartilage or rotator cuff dysfunction, glenohumeral joint osteoarthritis prohibits smooth motion between the humeral head and glenoid [3]. Previous epidemiology studies show that 32.8% of people with over sixty years old are affected by glenohumeral joint osteoarthritis and debilitated joint function due to the age-related change [1]. The breakdown of cartilage causes the humeral head and glenoid to rub and grind against each other [3]. It induces acute pain and loss of function, i.e., mobility of the arm [2]. To compensate for the cartilage breakdown, excess cells are produced in the humeral head in the form of bone spurs. This leads to even more friction, pain, and limiting of function. Thus, one of the most popular treatments of this disease is to surgically remove the humeral head and replace it with an artificial one [3]. The design of an artificial humeral head is likely to alter the surgical outcome for glenohumeral joint osteoarthritis. Research studies showed that artificial humeral head design with some kind approximation (e.g., spherical or elliptical) did not bring an adequate outcome [4]. It also limited the range of motion (ROM) of the shoulder [5]. Some studies showed that increasing the similarity between the artificial humeral head and the actual one could increase the ROM of the shoulder [4,6]. Therefore, the focus of this research was to discuss a method that can provide patient-specific design of artificial humeral heads.
From the previous study in humeral head morphology, the humeral head was composed of different curvatures [7,8]. In addition, Humphrey et al. [9] clarified that use of elliptical heads resulted in improved replication of the normal humeral head shape in comparison with use of spherical prosthetic heads. Furthermore, the cadaveric study by Jun et al. [4] revealed that the custom, non-spherical prosthetic head more accurately replicated the head shape, rotational range of motion, and glenohumeral joint kinematics than the commercially available, spherical prosthetic heads when compared with the native humeral head.
However, humeral head size, including interindividual variation, has not been well investigated. The statistical shape model (SSM) [7] is one of the methods that expresses the interindividual variation of the shape statistically, and is basically used as prior knowledge of various algorithms. SSMs were used in number of medical applications, especially related to bones and joints. To assess the potential risk factors associated with bone fracture, an SSM was used by Gregory et al. [10] in their study. They concluded that SSMs might be useful in identifying the individuals at risk of possible femoral fracture. To aid detecting vertebral fractures, SSMs of vertebrae were used by Roberts et al. in [11]. SSM was used successfully for early identification of developing radiographic osteoarthritis of hips by Gregory et al. [12]. Apart from that, SSMs were used to automate implant design and screw placement in shoulder arthroplasty [13], surgical planning [14], medical image segmentation [7], and implant design [15,16].
SSMs avoid arbitrary assumptions by trying to capture the actual patterns of variability in a set of objects of same class. It is usually constructed by applying principal component analysis (PCA) [17] to feature vectors of multiple individual shapes [18]. PCA is used in other statistical modeling as well [19]. Feature vectors can be classified into two categories: point-based or distance-based feature vectors [7]. The point-based feature vector is calculated from 2-D or 3-D coordinate values of feature points. The feature points between individuals should be associated. Thus, it requires a feature point extraction method, which limits the application. The distance-based method segments the target organ first, and then makes distance map from the extracted organ contour. The distance value of all pixels in 2-D or voxels in 3-D is utilized as the feature vector. The remaining work is to align the position and orientation of the target organ, and the alignment method is different for each organ and for each purpose. As of now, there are no studies which investigate the procedure of constructing the SSM of a humeral head.
This study aims to propose a method of constructing the SSM of a humeral head towards the design of patient-specific artificial humeral heads. The proposed method consists of three steps: segmentation of humerus, humeral head extraction, pose alignment of humeral head, and finally, construction of the SSM by applying PCA. This study particularly focuses on the shape of the humeral head, whereas our previous study [5] focused on the shape of the whole humerus. Furthermore, this experiment demonstrates the effectiveness of SSMs by studying the individual shape variability using the SSM. The rest of the paper is structured as follows: Section 2 discusses the images used in this study and Section 3 describes the proposed methods. Section 4 presents the experimental results. Finally, the paper is concluded by summarizing the experimental results and the achievements of the research, as well as future research directions.
2. Subjects and Materials
A total of 22 male subjects with age range from 18 to 79 years and mean ± standard deviation (SD) age of 39.0 ± 20.4 years old were considered to construct the humeral head SSM. The subjects had no significant disease in their shoulder joints. The local ethics committee of Nobuhara Hospital, Tatsuno, Japan approved this study and all the subjects provided written informed consent according to the approved procedure.
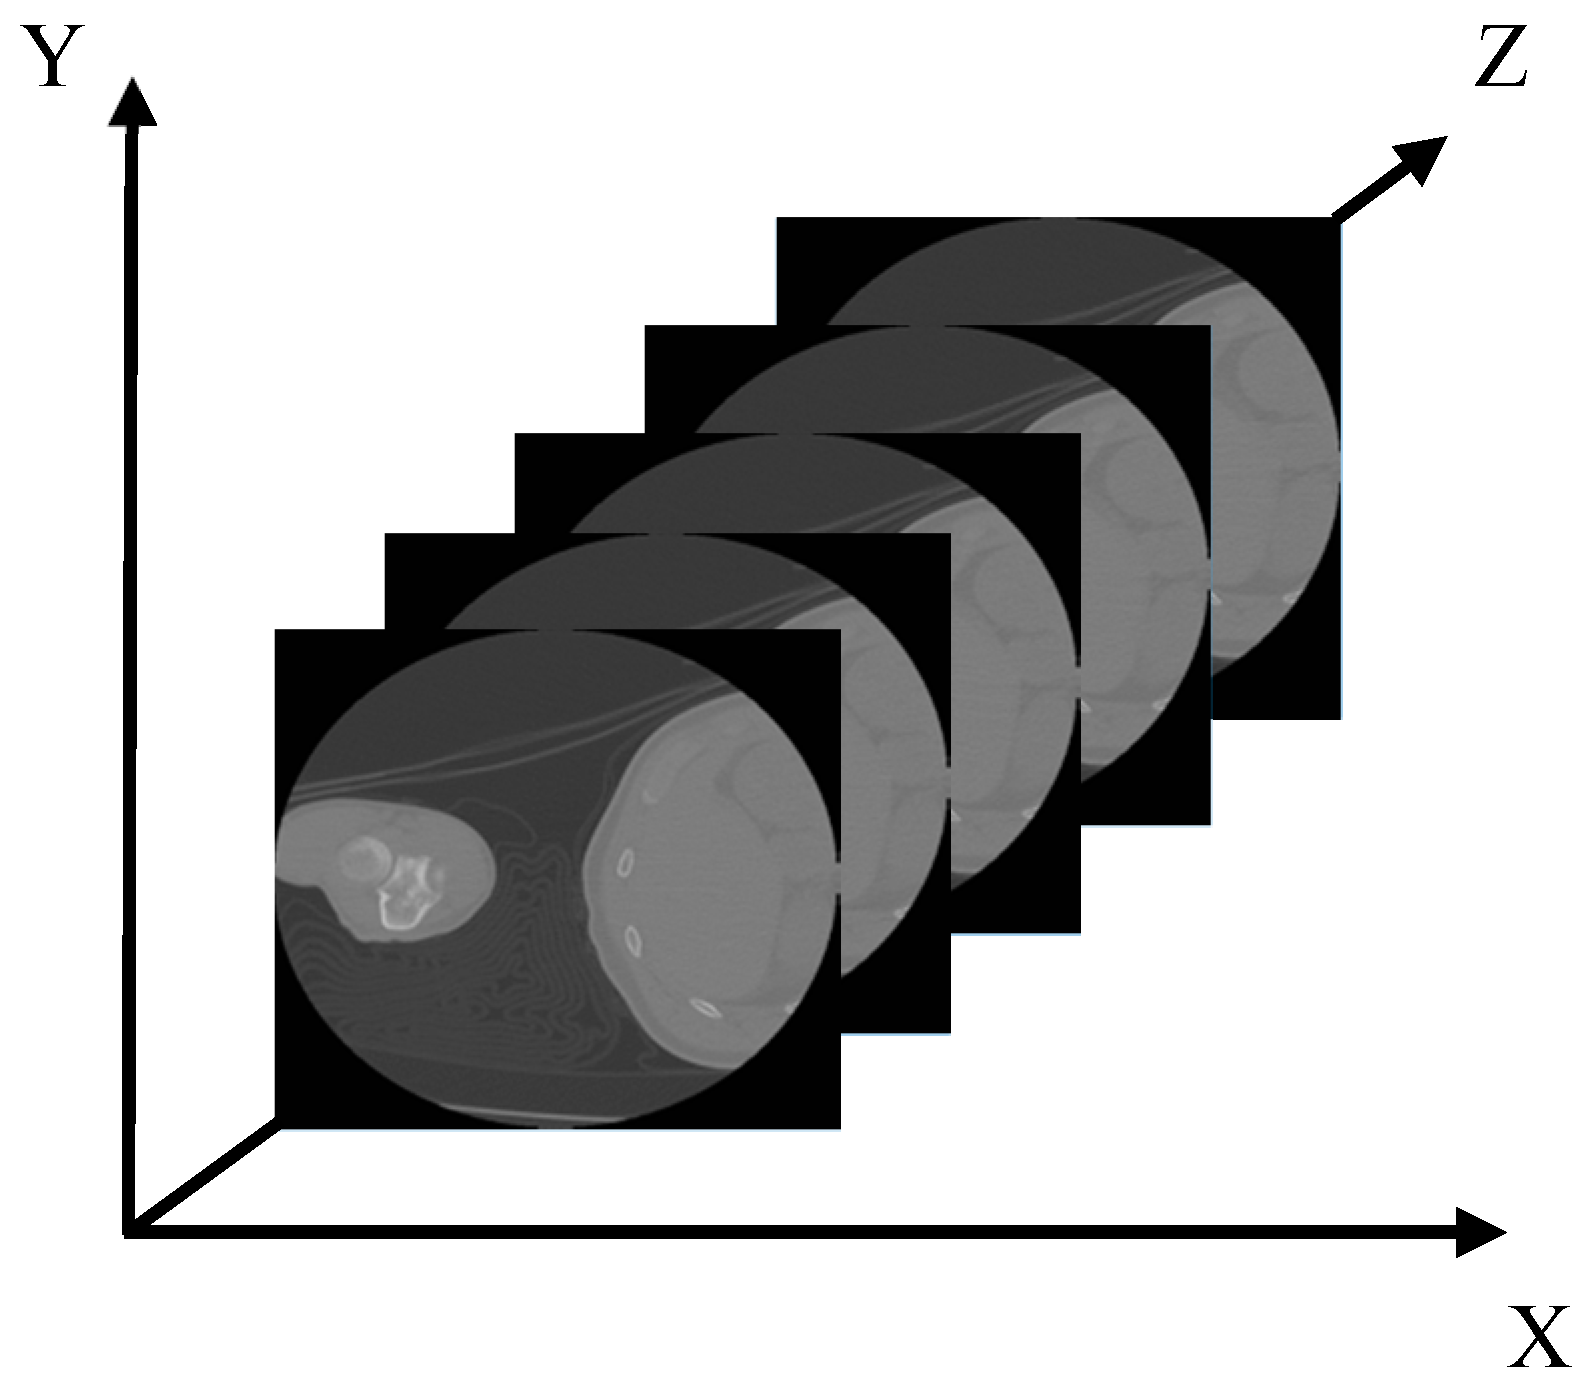
Axial computed tomography (CT) images of the left shoulder were acquired for each subject to cover the whole shoulder joint using a CT scanner (120 kVp, 250 mA; ECLOS, Hitachi Medical Corporation, Japan) at the Nobuhara Hospital from 21 February 2013 to 20 November 2018. The imaging technique that creates two-dimensional cross sectional images from three-dimensional body structures is known as computed tomography or CT [20]. The combination of volume and pixel is known as a voxel, which represents a value in three-dimensional space on a regular grid [21]. Voxels are extensively used in medical and scientific data, especially in medical CT scans, for visualization and analysis. The number of images for each subject varied from 554 to 734. The thickness, voxels per slice, and pixel resolution on the slice plane were 1.25 mm, 512 by 512, and 0.391–0.841 mm, respectively. Figure 1 shows the acquired axial CT images.
3. Proposed Method
SSM is an established tool in medical image analysis that represents the shape variations of a particular class of shapes. Shape variations are learned from a set of training examples and the variation of shape is represented by using the leading principle components. The process of constructing the SSM of a humeral head involves three steps, including (step 1) segmentation of the humeral head, (step 2) position and orientation alignment, and finally, (step 3) PCA shape analysis. Detailed description of each step is given below.
3.1. Segmentation of the Humeral Head Region
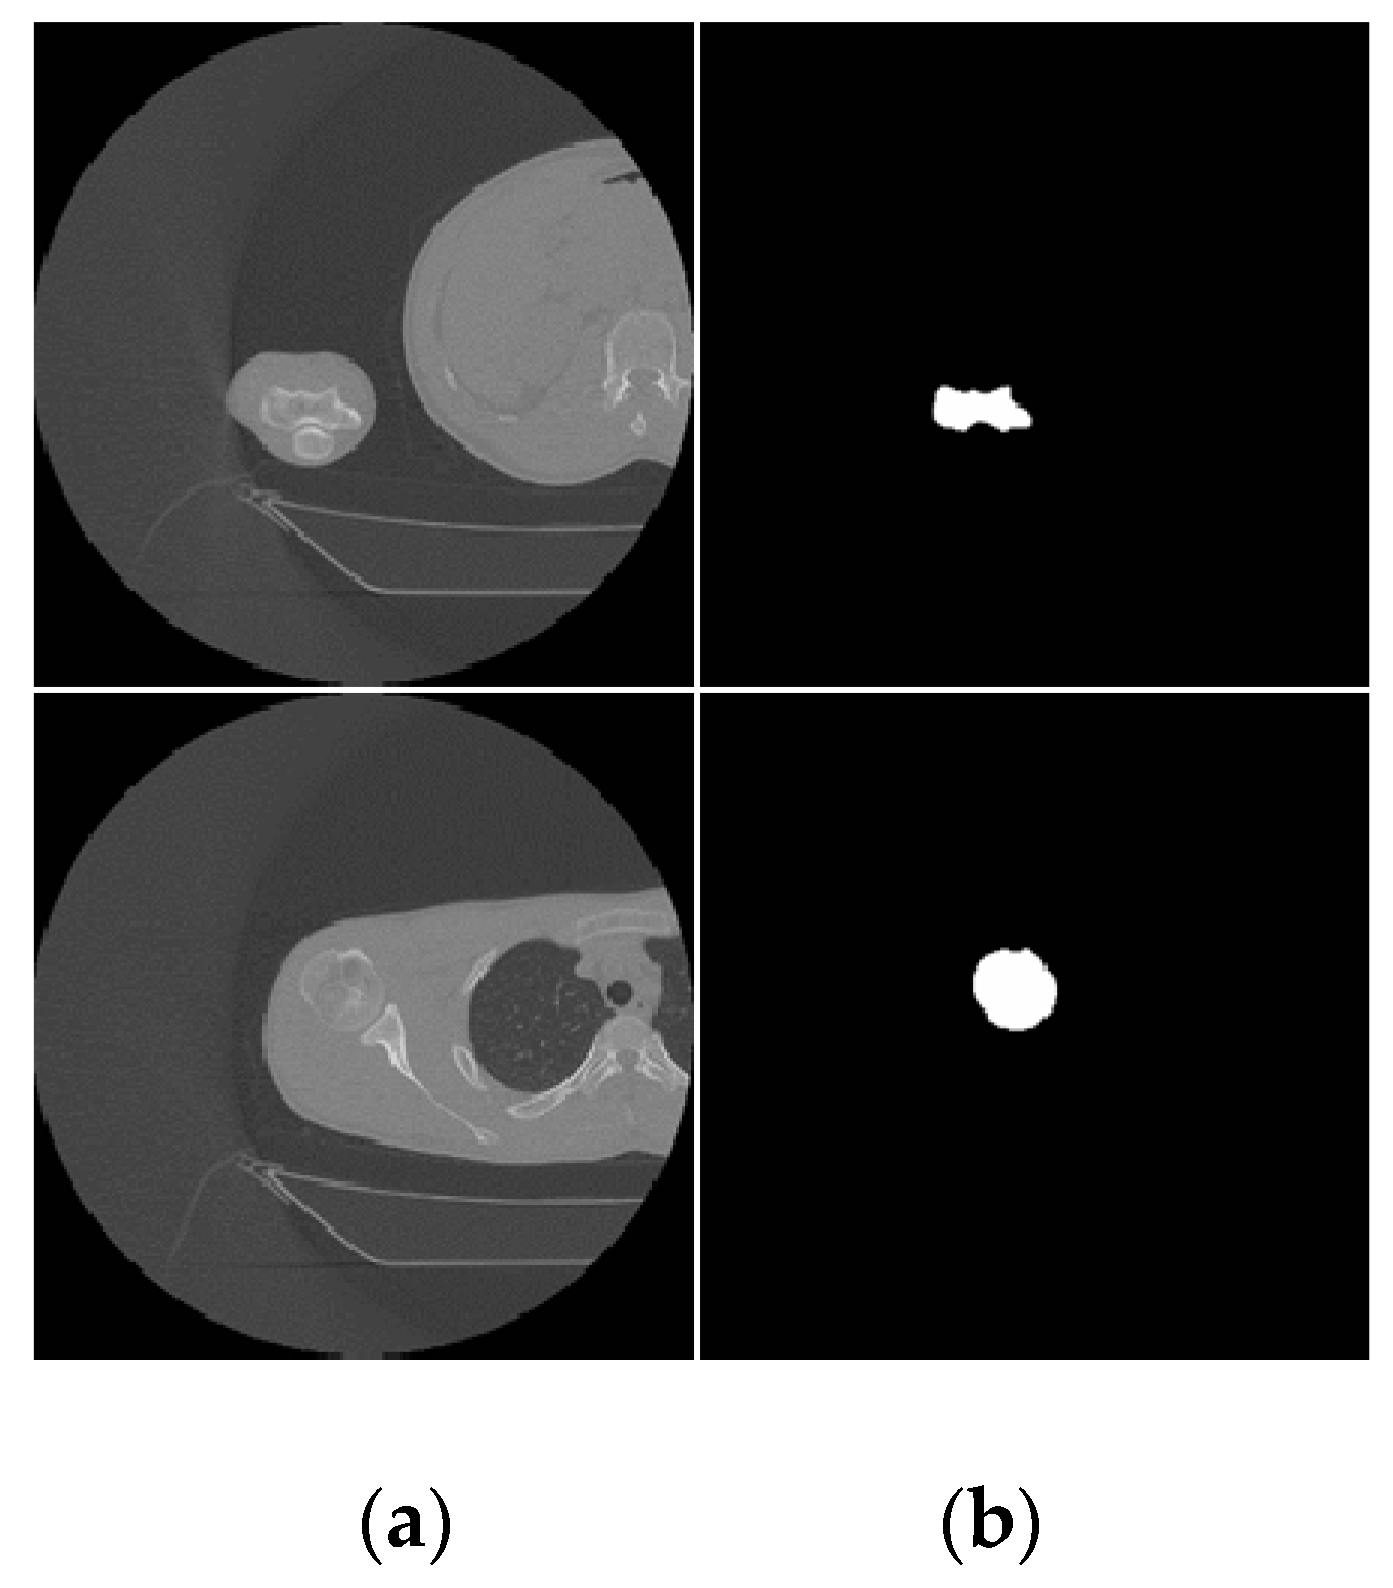
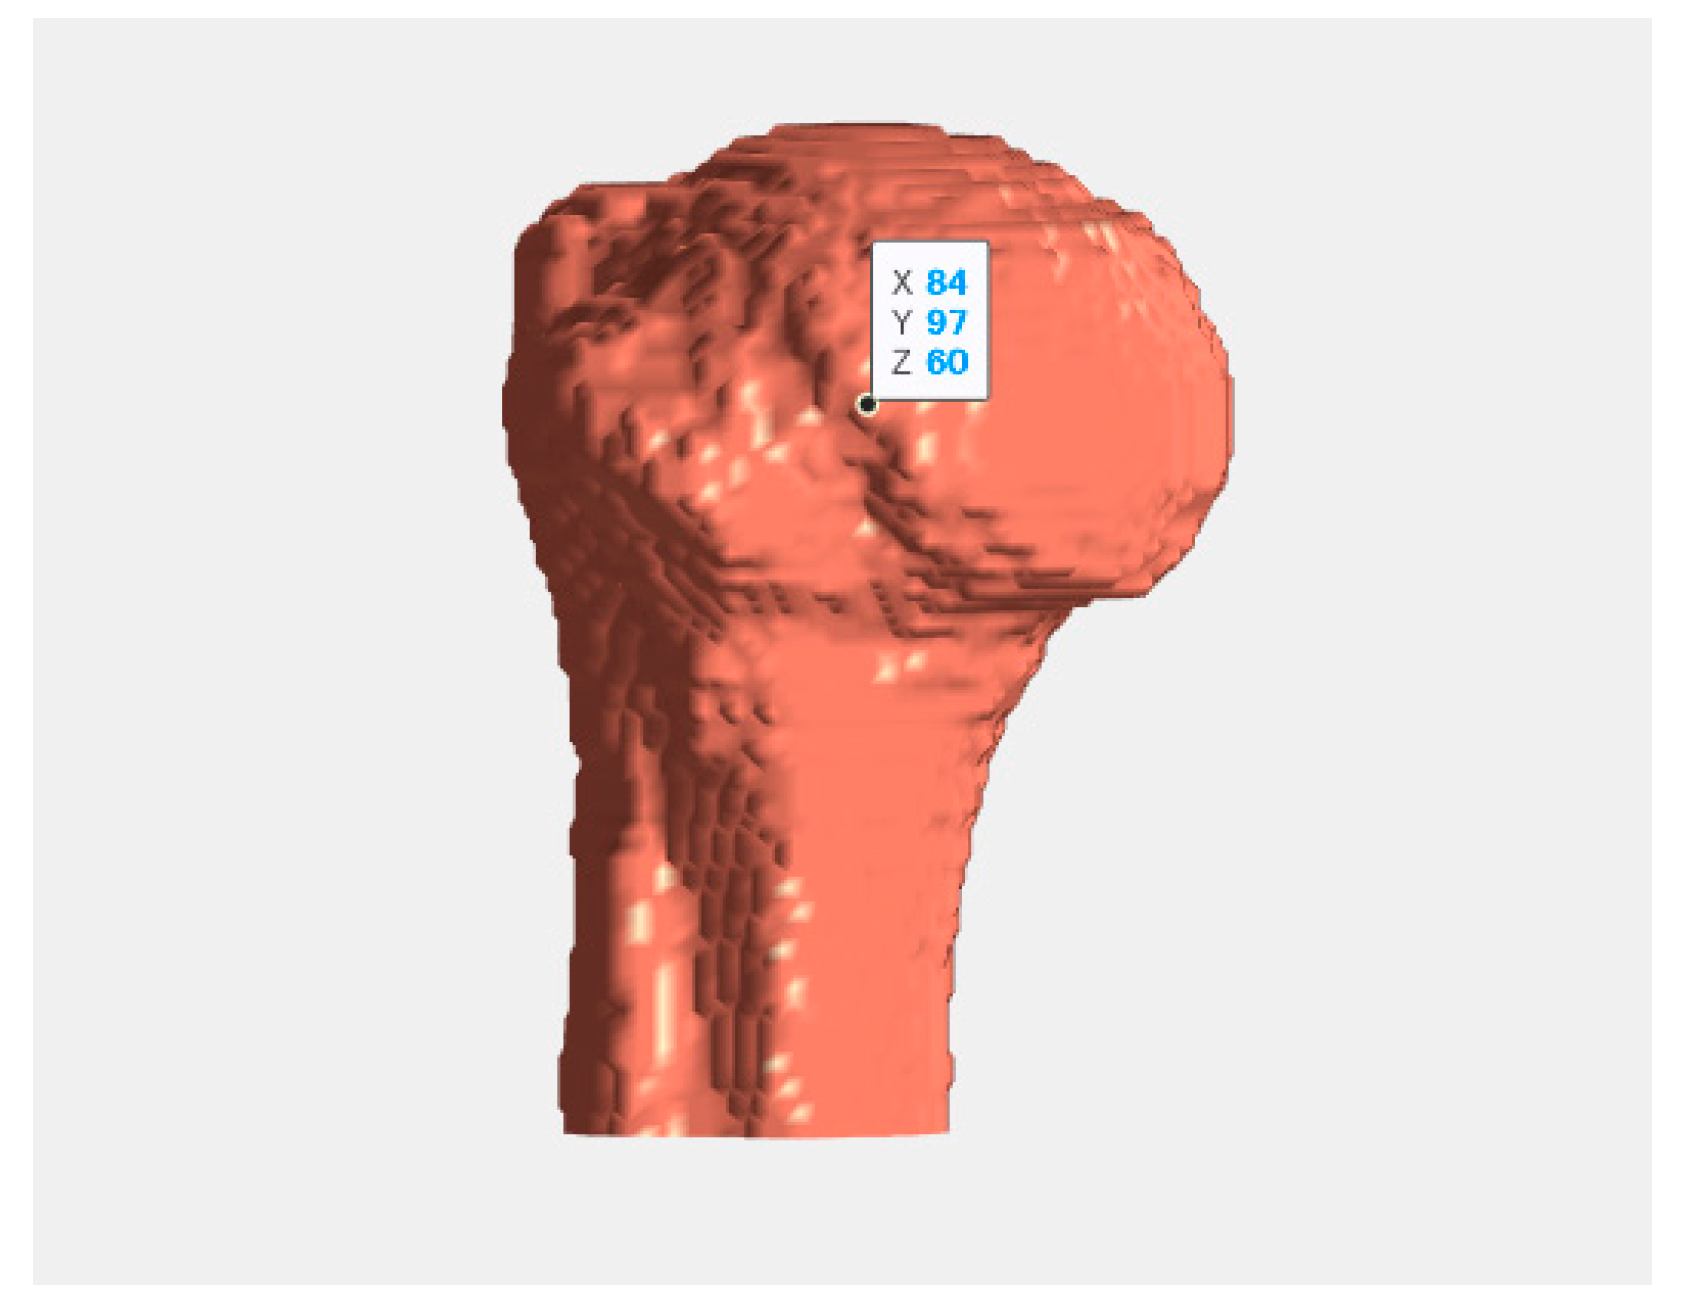
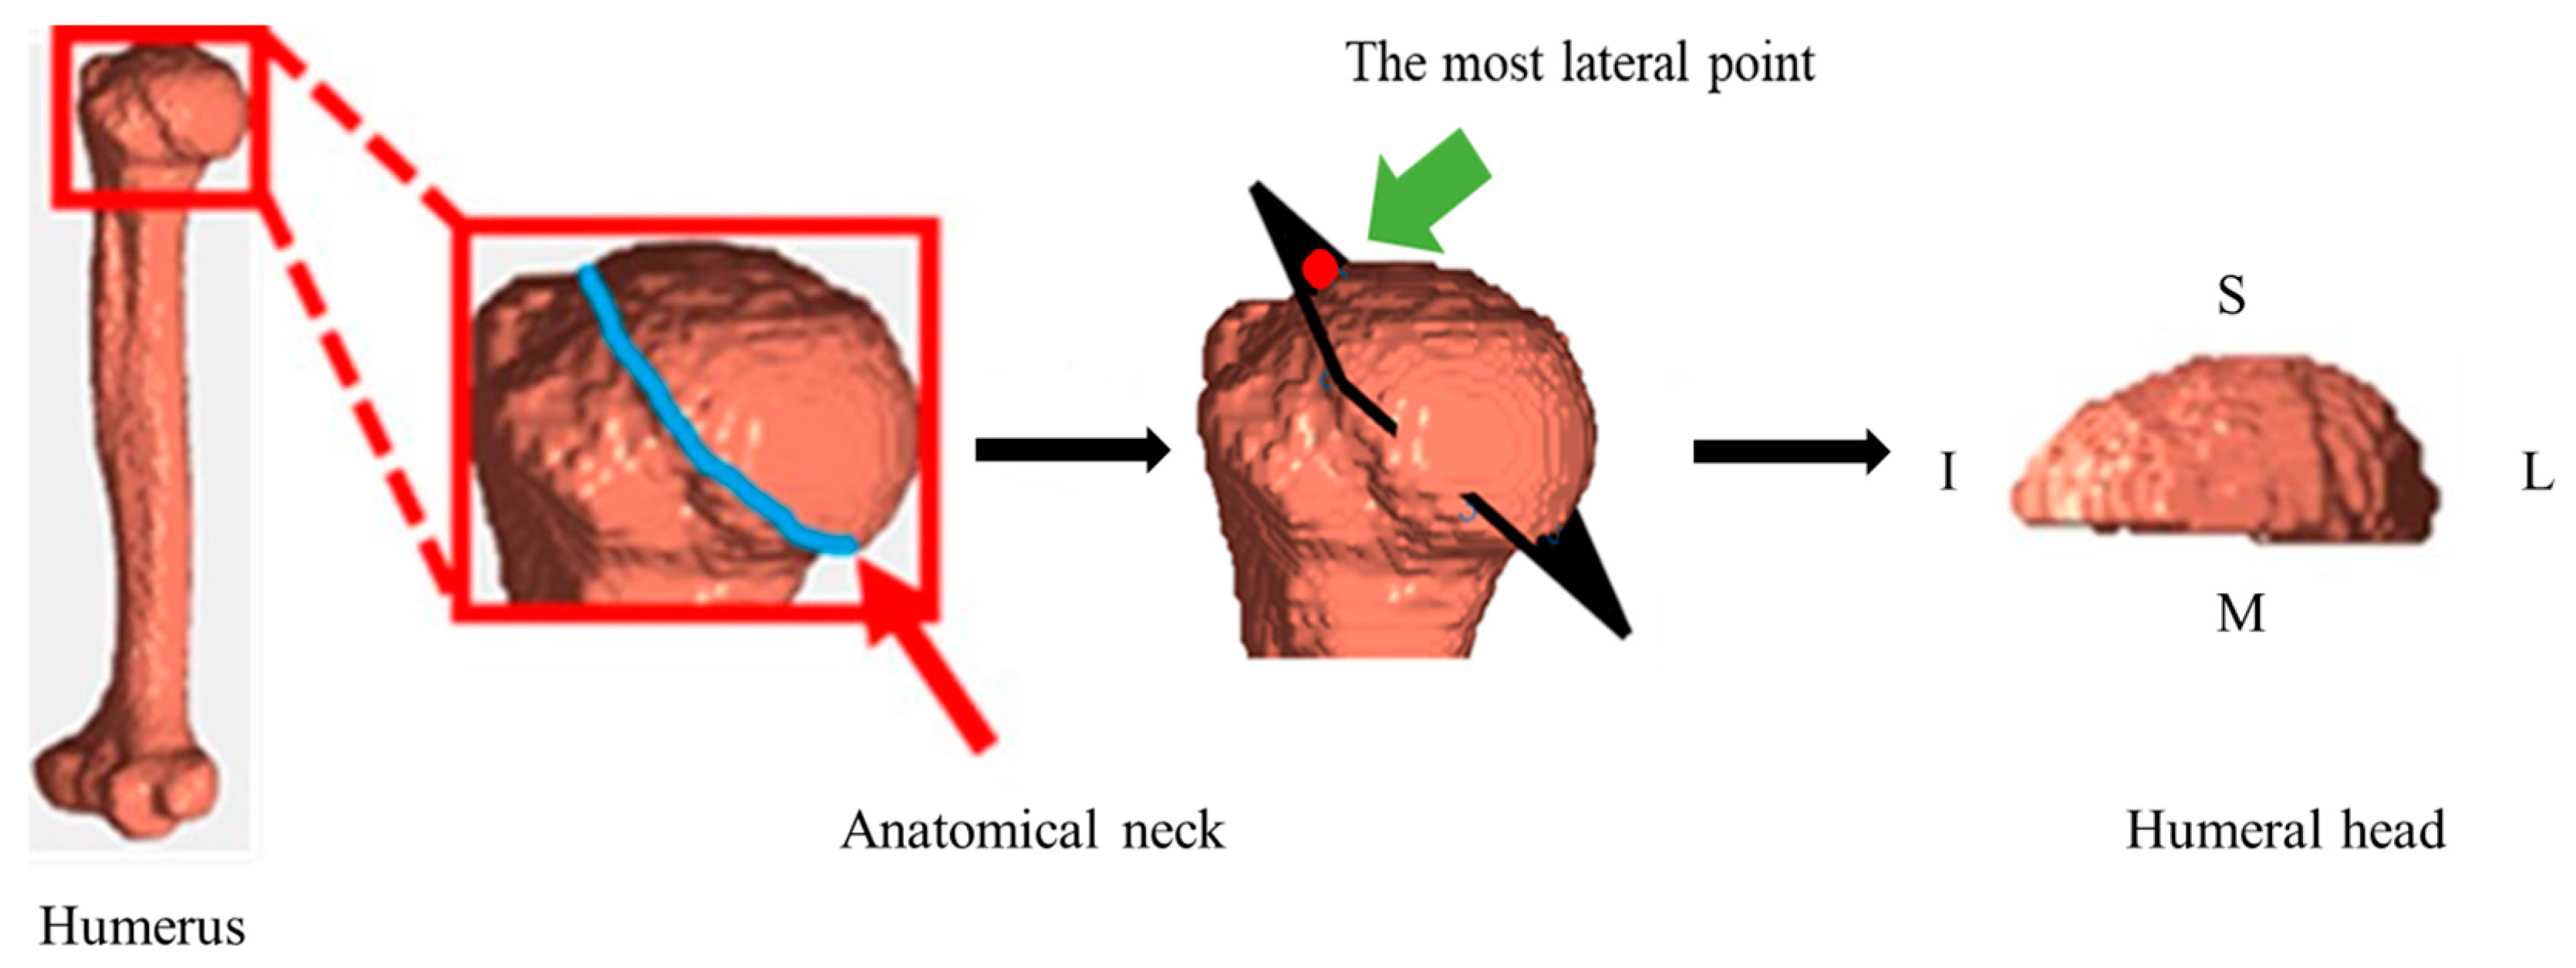
The humeral region is firstly segmented from CT images manually for each subject. Figure 2 shows an example of a manually segmented humerus region from shoulder CT images. To extract the humeral head from the segmented humerus region, the anatomical neck points are acquired manually. Figure 3 shows an example of the acquired point. Next, the anatomical neck points are approximated by a plane using the least squares method. Figure 4 depicts the flow of humeral head extraction from a segmented humerus.
3.2. Position and Orientation Alignment
To align the interindividual position and orientation difference of humeral head shape of each subject, a 3-D anatomical coordinate system is defined. The origin of the coordinate system O = [Ox, Oy, Oz] is the center of the gravity of the anatomical neck points. The most lateral point of the anatomical surface, PL, is acquired from the plane approximation. An example of the most lateral point can be seen in Figure 3. The X-axis is a vector, which is directed from the origin O to the most lateral point of the anatomical surface PL. The Z-axis, which is a vector directed from the origin toward the curvature of the humeral head, is the normal vector of the plane. Finally, the Y-axis is the cross product of Z-axis and X-axis. By determining this 3-D anatomical coordinate system, the position and orientation of each subject’s shape is aligned.
The position and orientation of shapes of all subjects are aligned in the same reference space (X-Y-Z left-handed rectangular coordinate system) by affine transformation. Figure 5 shows an example of the coordinate system.
3.3. Principal Component Analysis of Shape Matrix
A distance transform [22], which assigns positive distances from the surface to the outer of the humerus, is applied to the aligned volume of the humeral region. The 6 neighborhood Manhattan distance is used as the distance function. The Manhattan distance d(A, B) between two points and is calculated using the equation below:
The distance on the humerus bone surface voxel is zero. The obtained 3-D distance image of subject i is converted to a 1-D vector to create a feature vector matrix (). The conversion is applied to all training data, and Ns vectors are obtained. Nv is the number of voxels, and Ns is the number of subjects. Equation (1) shows a feature vector matrix F, in which the number of rows equals to the number of voxels in the image Nv (256 × 256 × 256), and the number of columns equals to the number of subjects Ns.
In the next step, the average shape matrix () of all subjects is calculated using the following equation
where Fi is the feature vector matrix of ith subject. Covariance matrix C of feature vector matrix F is calculated by the equation below
The eigenvalue decomposition of the covariance matrix (C) is used to calculate the eigenvalue and the eigenvector (V). Covariance matrix C can be expressed in terms of the eigenvalue and the eigenvector (V) using the equation below:
where the eigenvalue and the eigenvector V can be expressed by the equations below:
where , , …, refer to the eigenvalues of corresponding ranks, and NE represents the maximum number of dimensions of the reduced matrix that is determined by the cumulative contribution rate. ej = [e1j,e2j,…, eNvj]T refers to the eigenvector of jth rank, where each column is arranged by the rate of contribution. The principle component (PC) score (θi) of the feature vector of the ith subject is calculated using the following equation
Subject shape can be reconstructed with the mean shape, eigenvector (V), and PC score as shown in the equation below:
By assigning a PC score (θi), an arbitrary shape can be synthesized within the range of individual difference.
In this study, they are synthesized by changing the coefficients along each eigenvector to the mean shape (middle) using the following equation:
where is the mean shape; and are the eigenvalues of the first and the second PC, respectively; and a and b are parameters. e1 and e2 are the eigenvectors. The reconstructed signed distance map is then converted to a binary image.
3.4. Shape Parameter Definition Using Statistical Shape Model
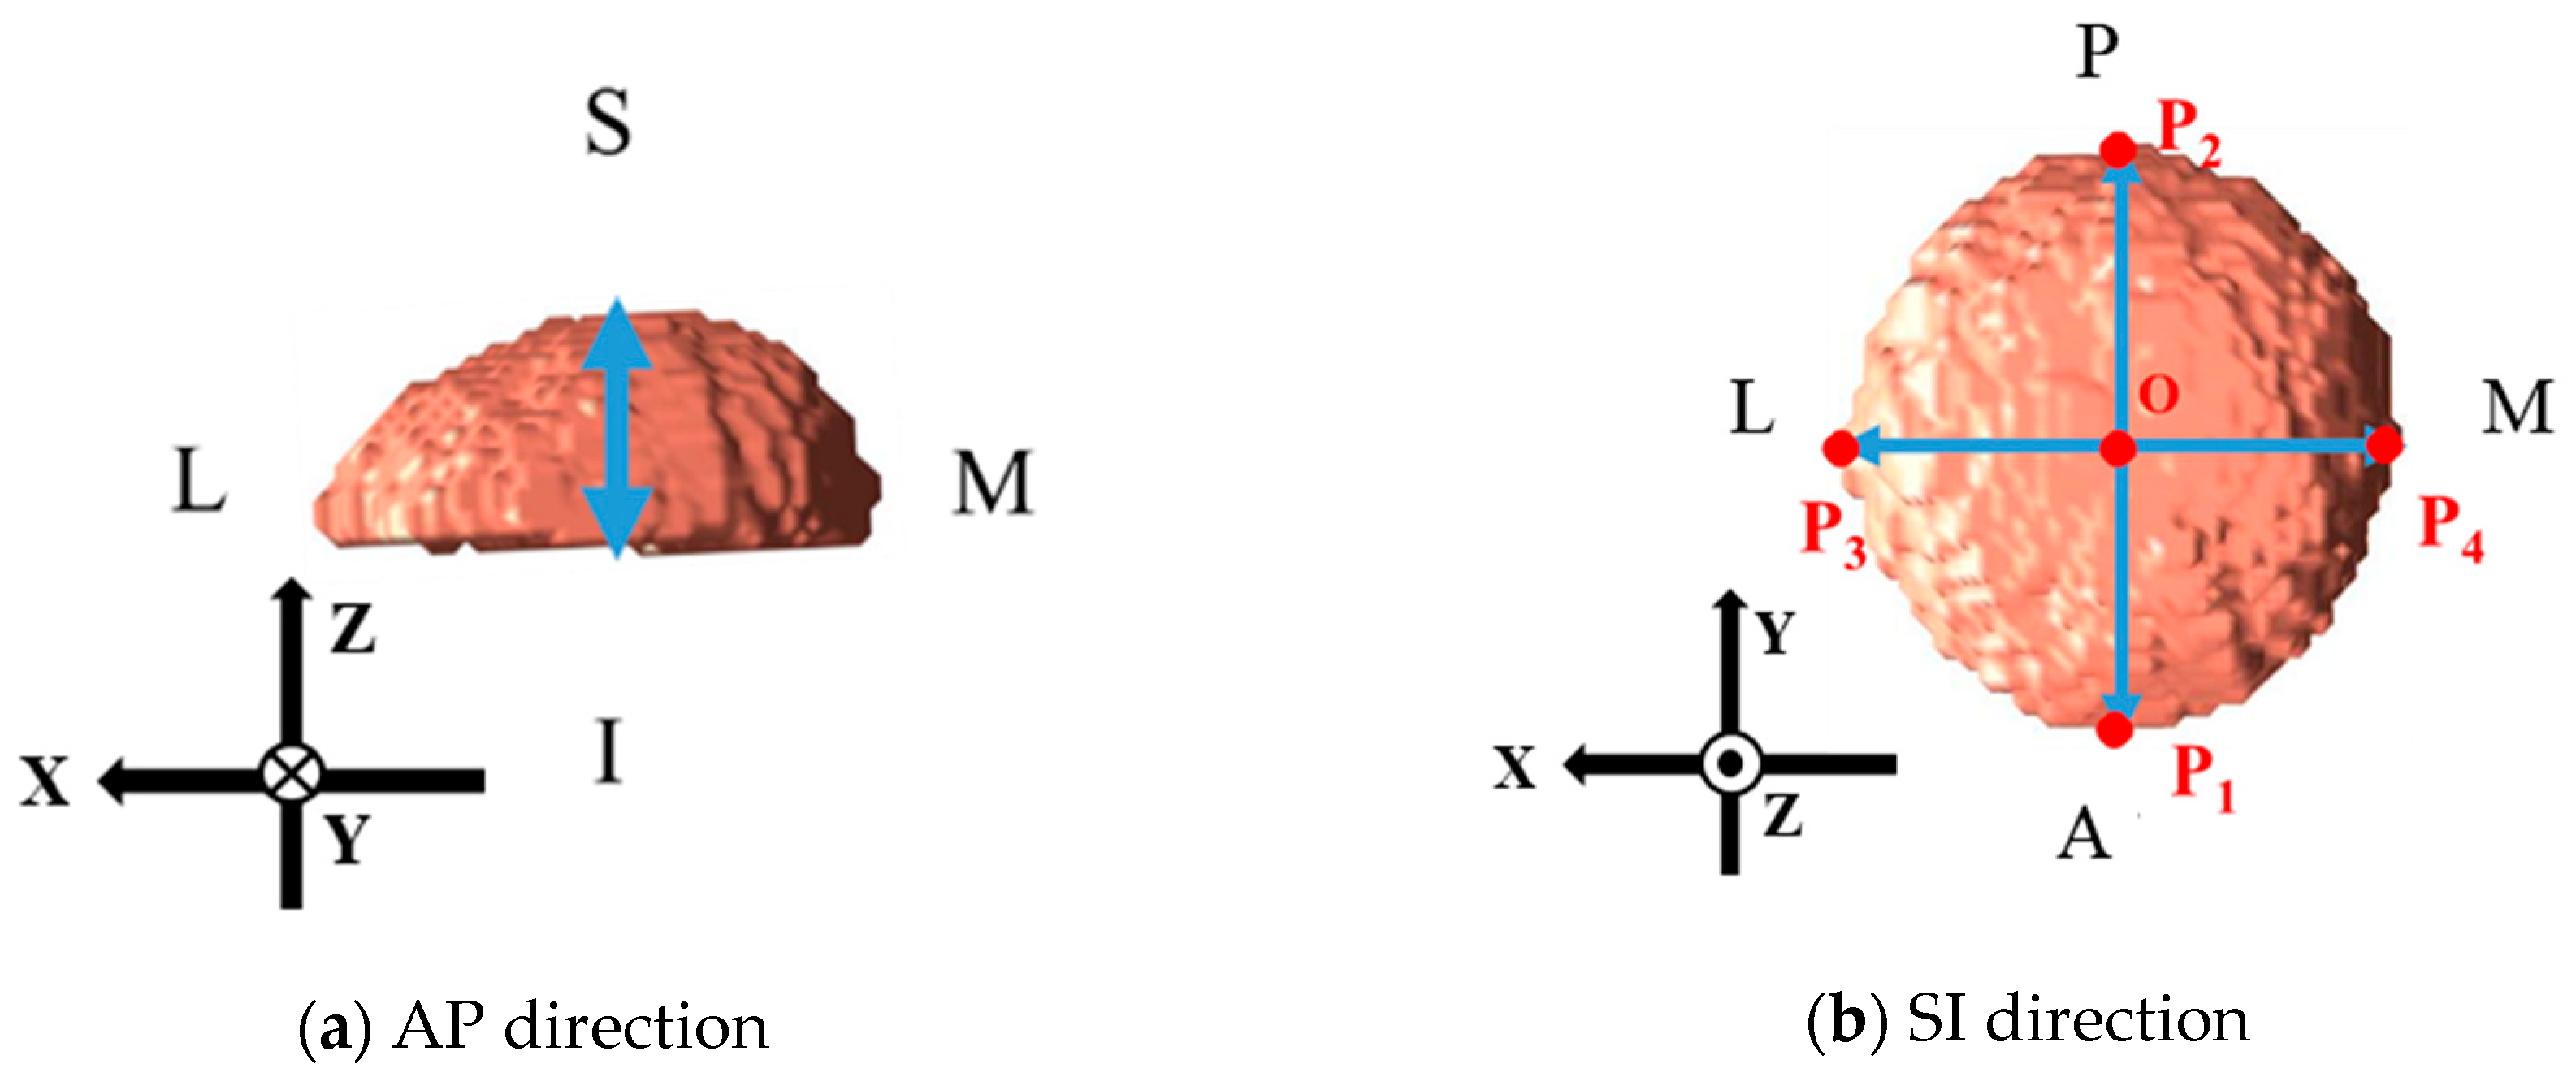
To quantitatively evaluate the interindividual variations of humeral head shape, the following measurements are performed. Figure 5 shows the anatomical direction of the humeral head. At first, the thickness of the humeral head is measured, which is in the superior-inferior (SI) direction as shown in Figure 5a. In the projection of the Z-axis direction, which is the SI direction, shown in Figure 5b, the vertices that are parallel to the Y-axis and have the longest line segment connecting the two boundary points are defined as P1 and P2, respectively. The vertices that are parallel to the X-axis and have the longest line segment connecting the two boundary points are defined as P3 and P4, respectively. The point of intersection of line segments P1–P2 and P3–P4 is point O. Next, the distances between two points (i.e., P1–P2, P3–P4, P1–O, P2–O, P3–O, and P4–O) are calculated.
4. Experimental Results
4.1. Construction of Humeral Head SSM and Its Performance Evaluation
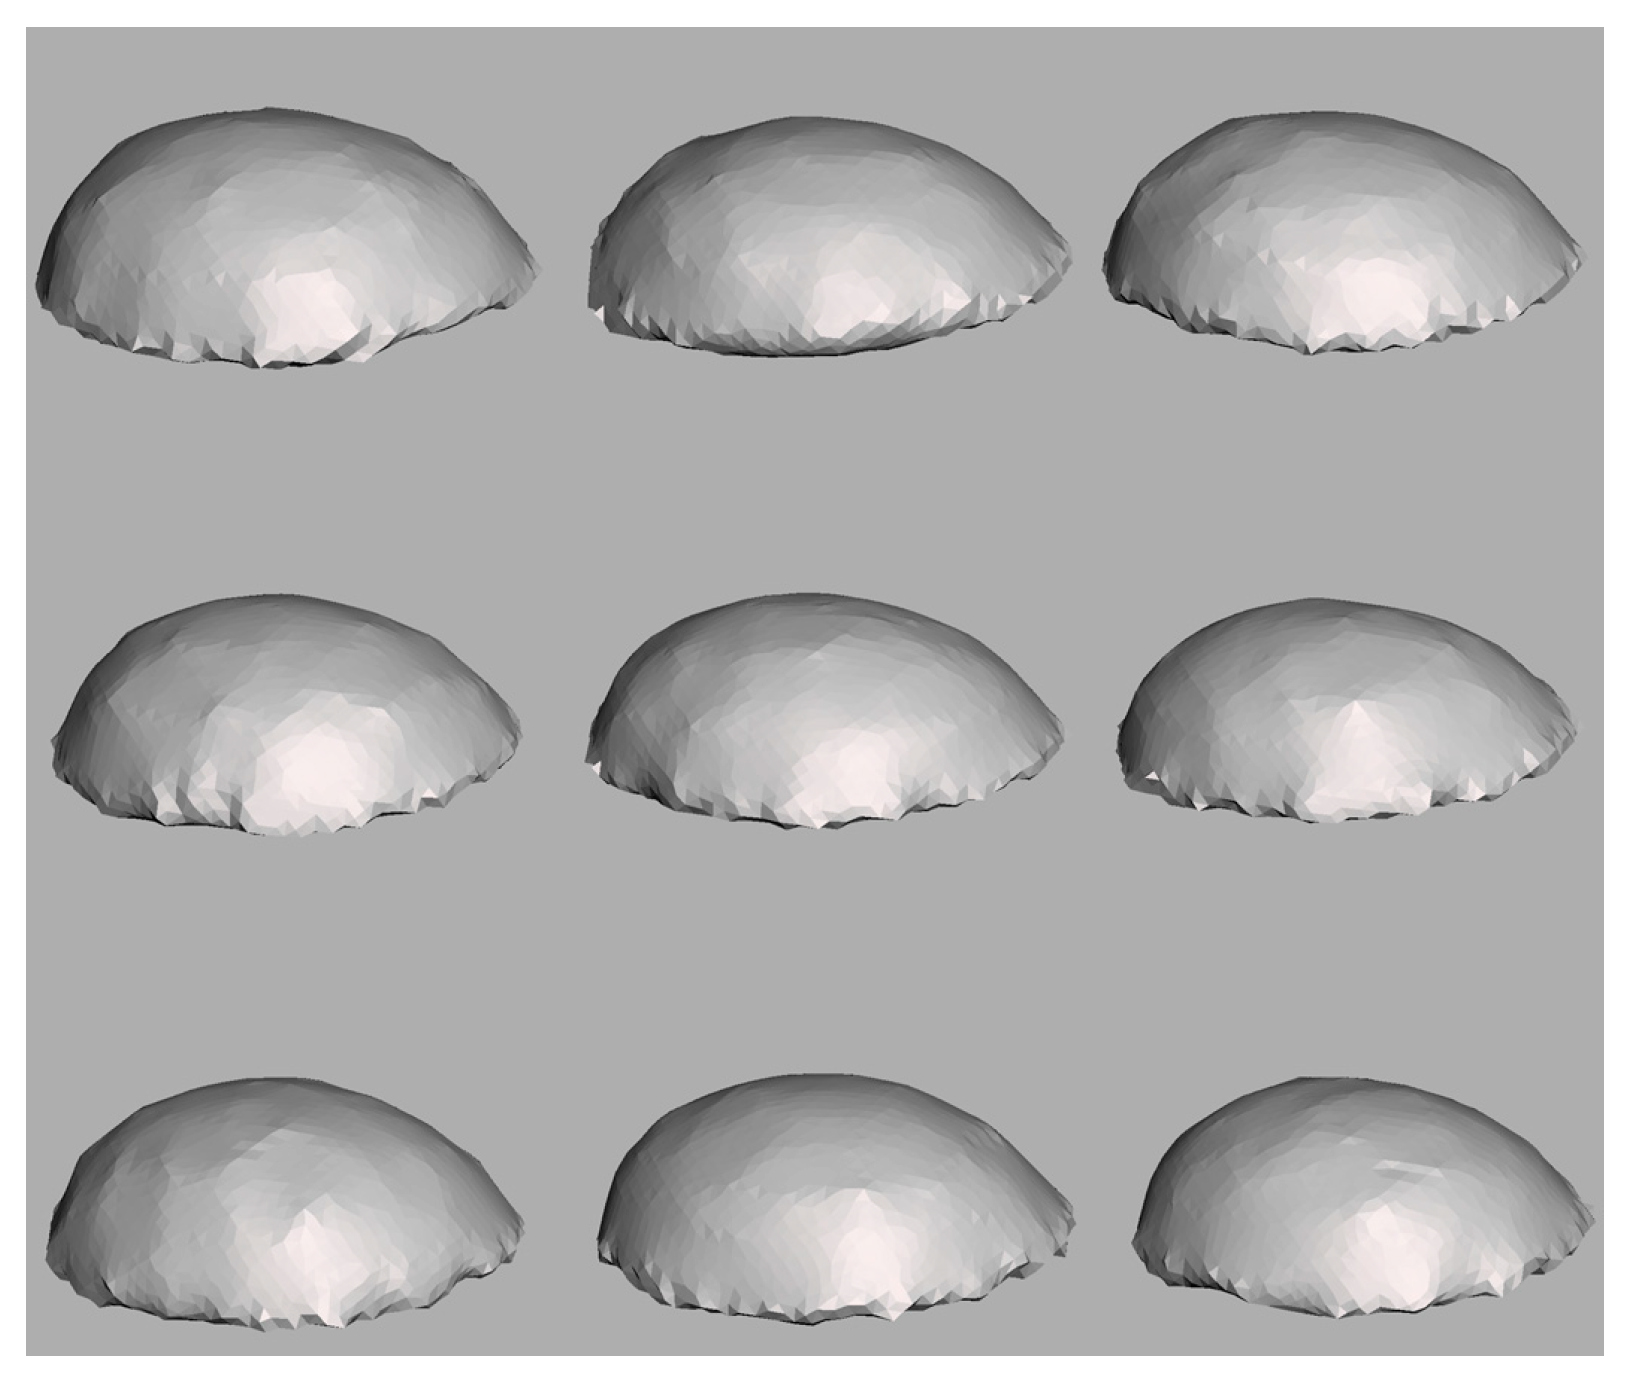
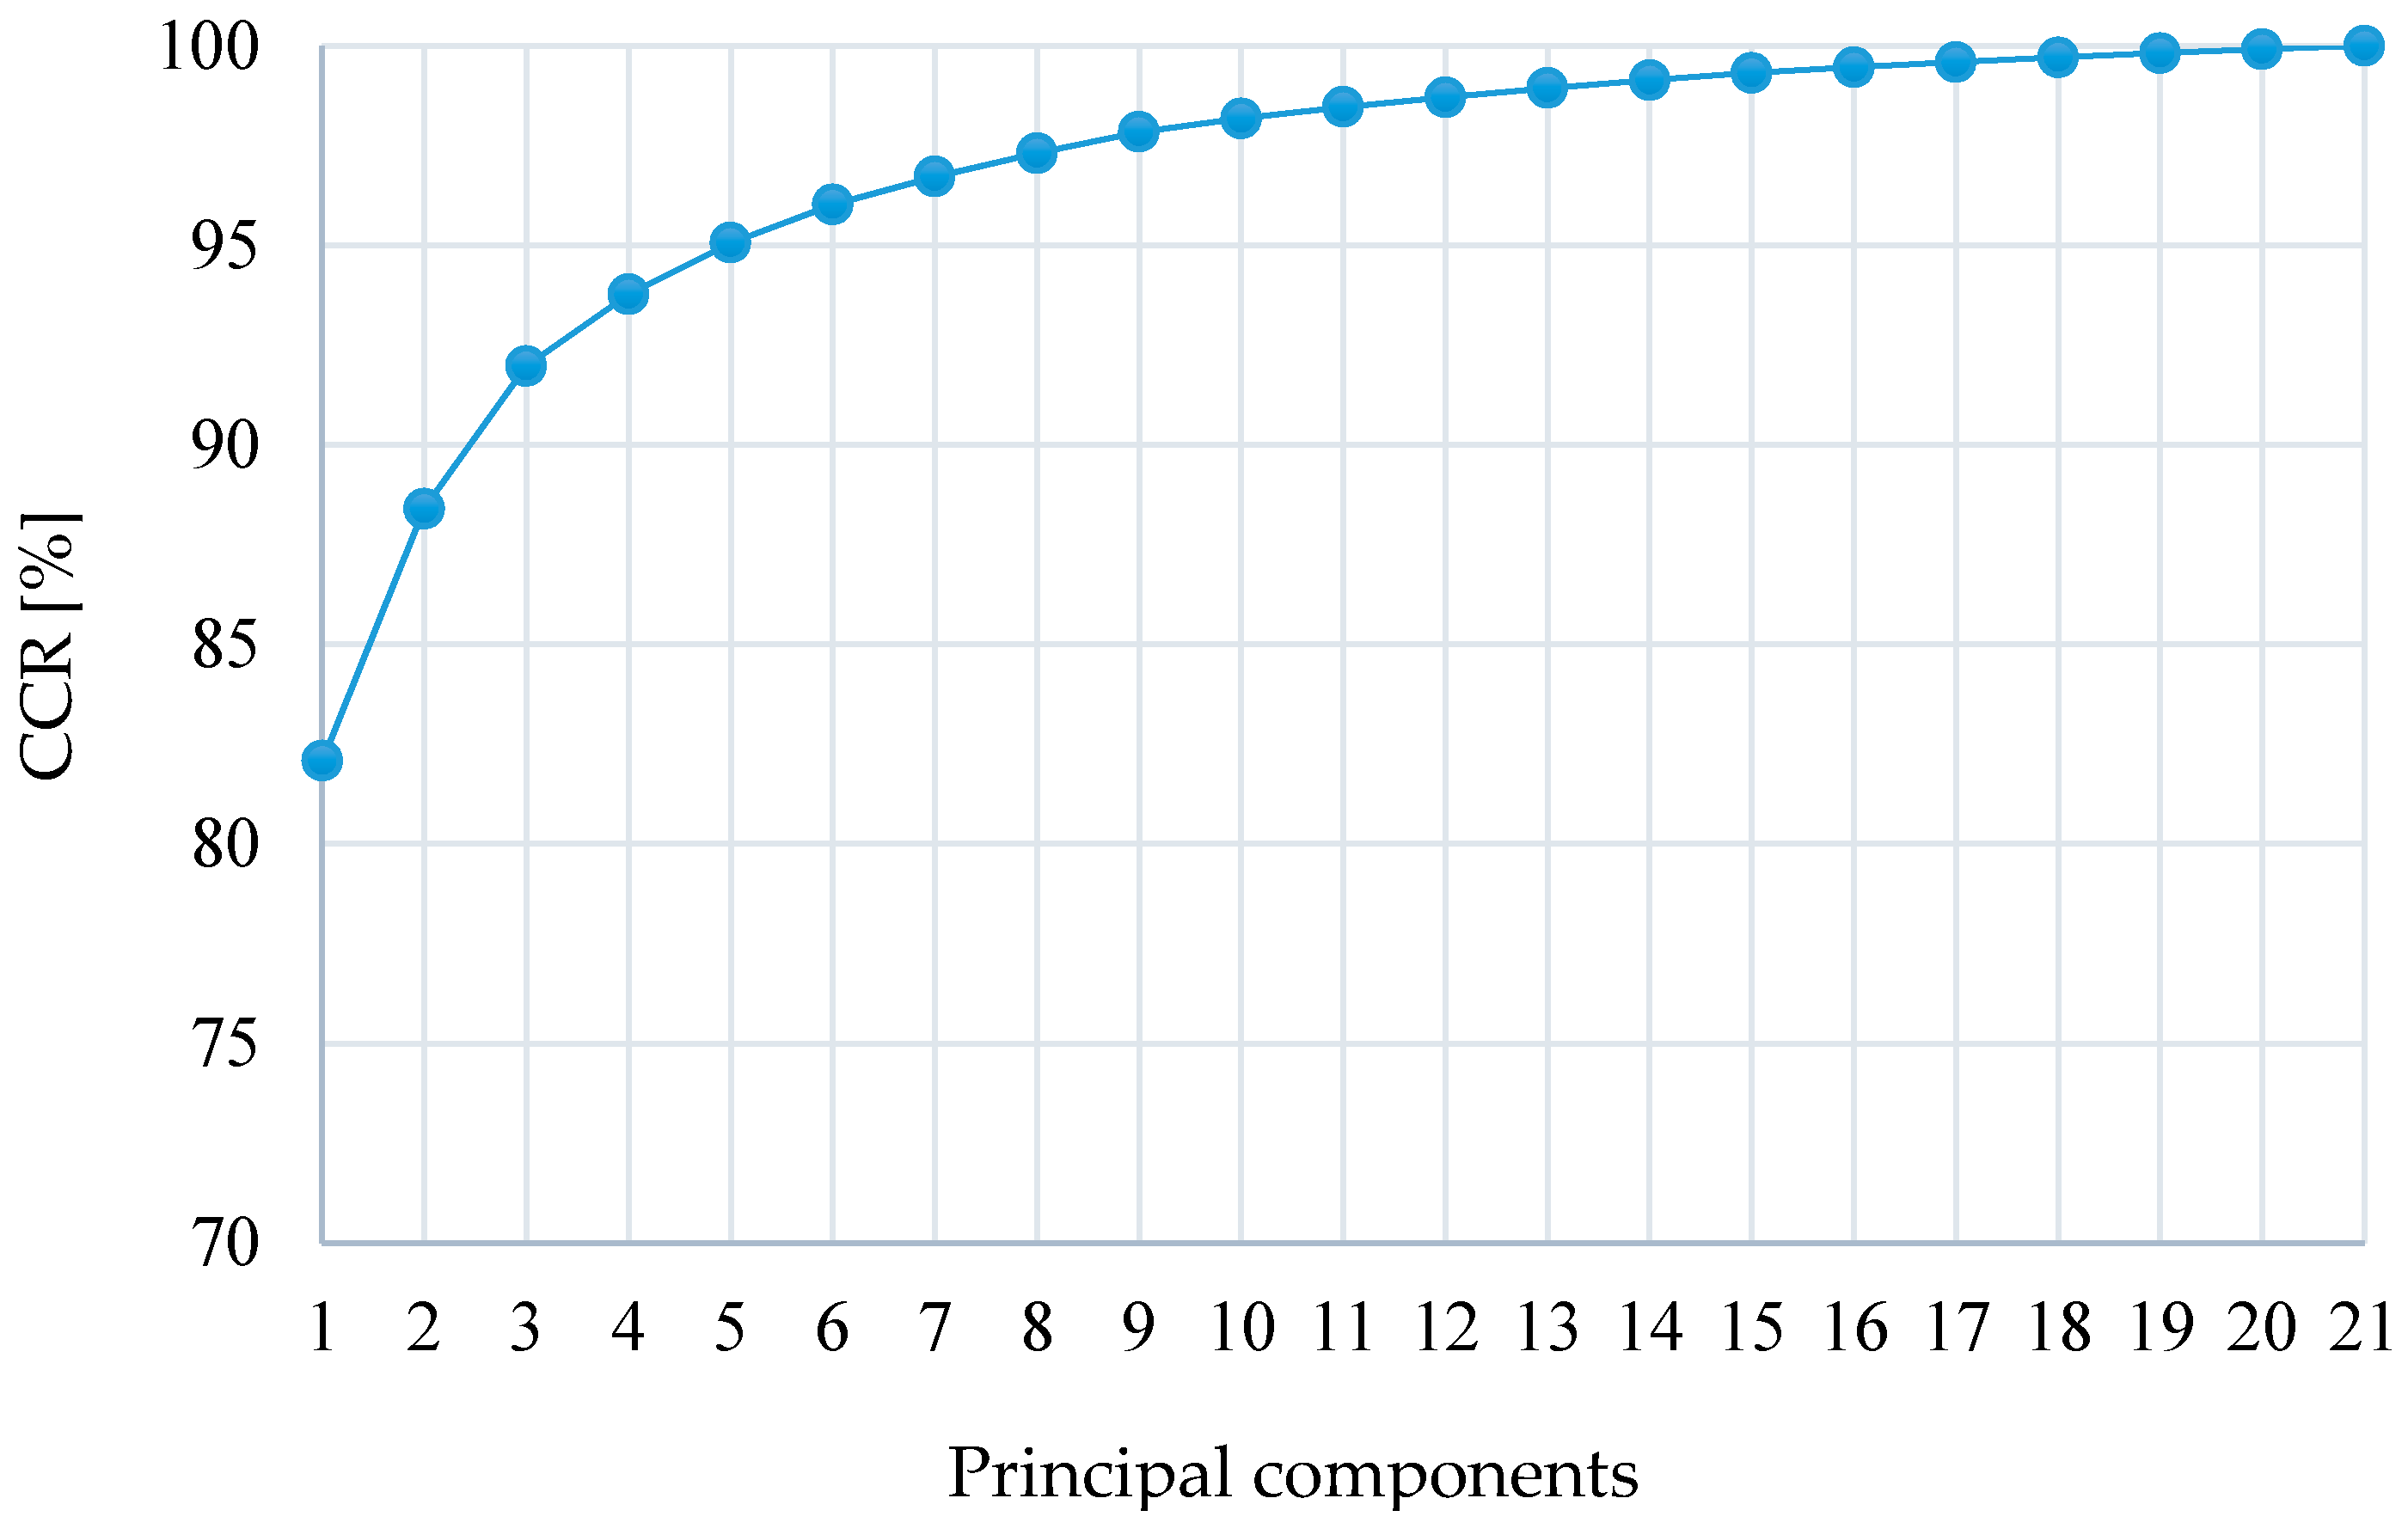
This study involved a total of 22 subjects, as described earlier in the materials section. The signed distance was used to create the feature vector matrix. Eigenvector, mean vector, and PC scores were calculated using PCA. Figure 6 shows shape variations of the humeral heads synthesized by using the SSM. The horizontal direction of Figure 6 corresponds to the first PC, whereas the vertical direction corresponds to the second PC. Figure 7 shows the cumulative contribution rate (CCR) corresponding to the number of PCs. It shows that the SSM can represent around 95% of shape variation by using the first five PCs.
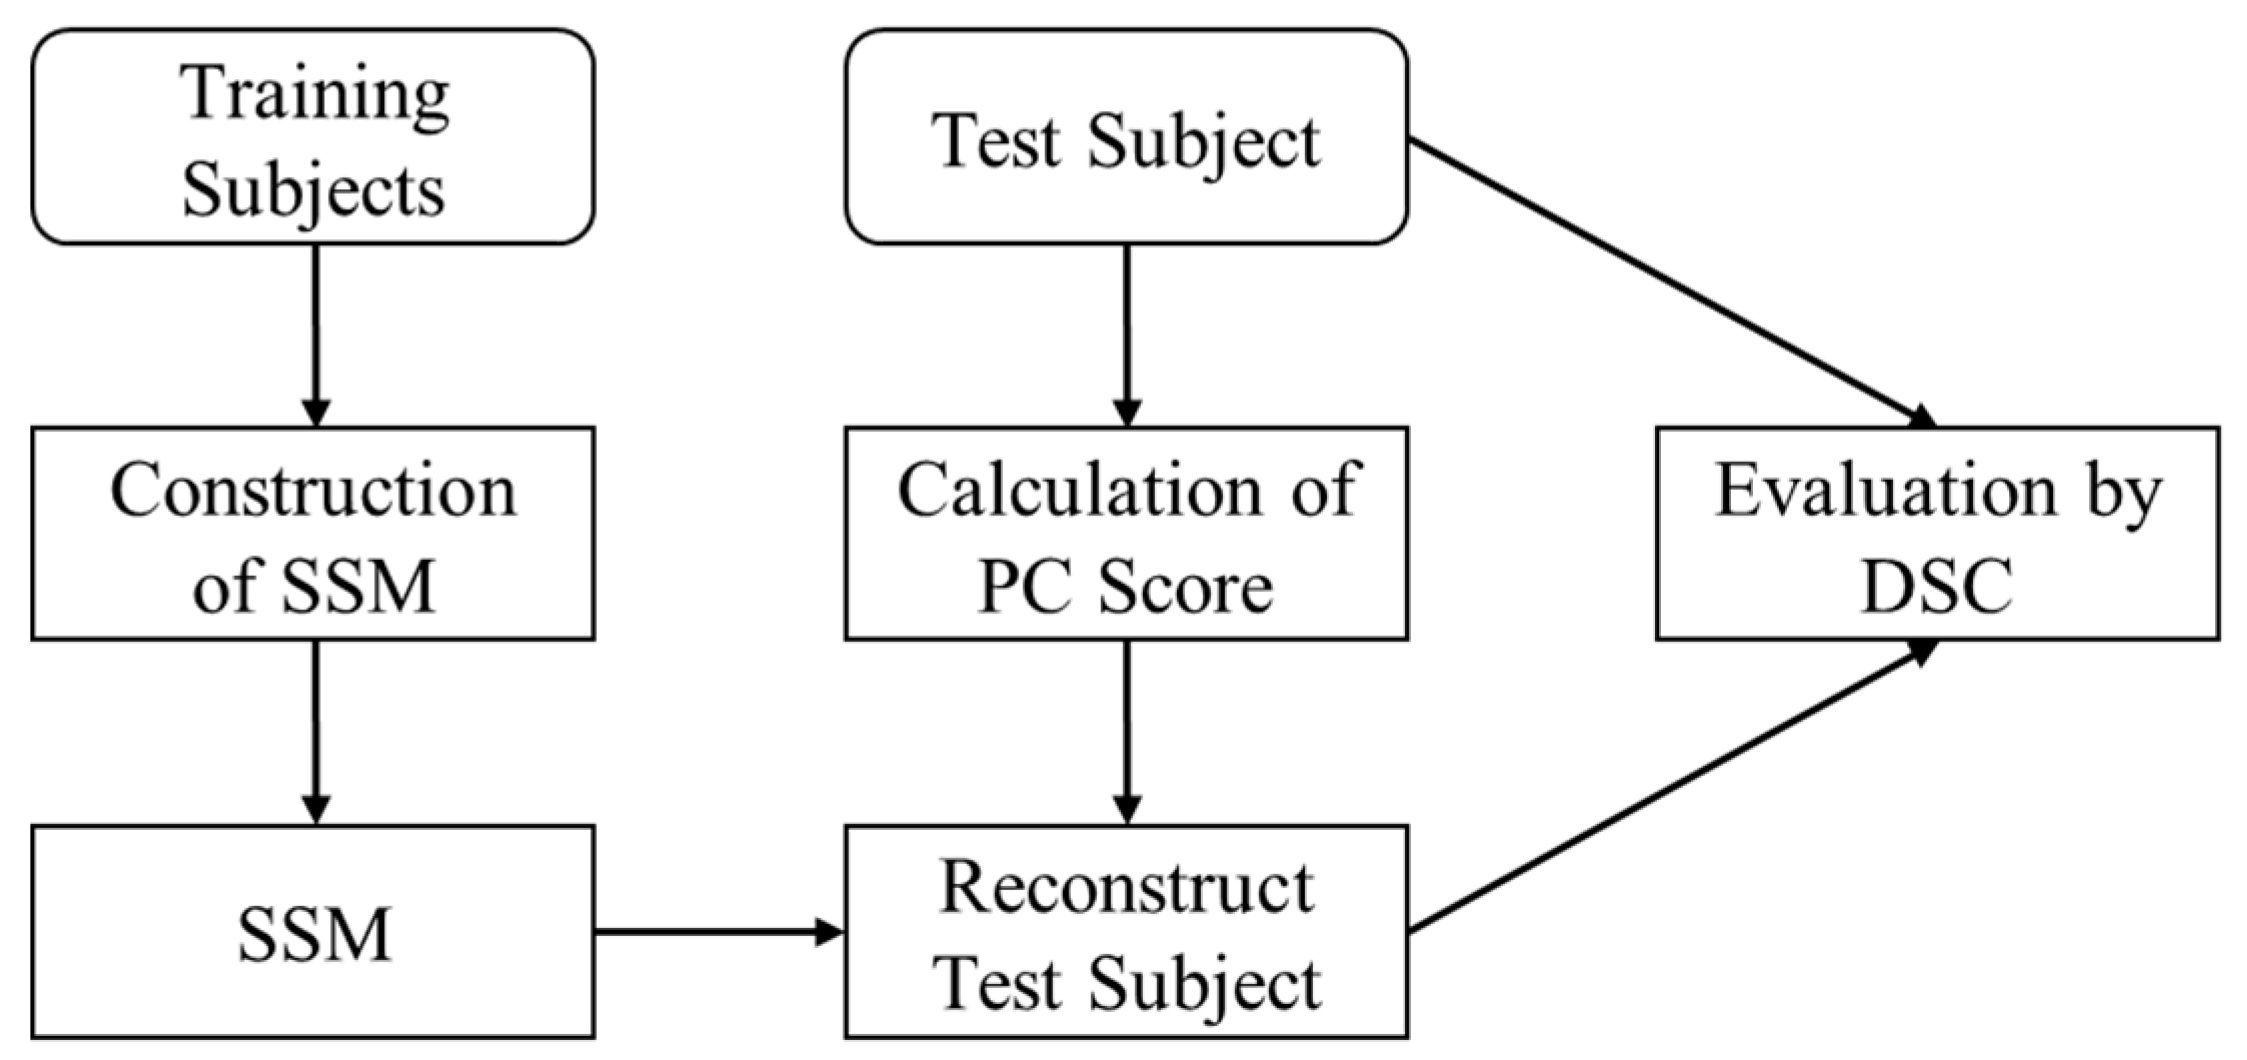
An SSM can express the interindividual variation of the shape by the mean (i.e., average shape), the eigenvectors, and the PC scores (i.e., shape parameter). It can also reconstruct the original individual shape [5]. The shape of one subject was chosen as the test data, whereas the shapes of all other subjects were used to build an SSM. The shape parameter of the test data was calculated by PCA. The test data were reconstructed by using the SSM and the calculated parameter by Equation (8). Therefore, verification of the generalization ability [23] of the SSM was evaluated by comparing the test data shapes with the reconstructed one. The Sørensen–Dice coefficient (DSC) was used as an evaluation metric. Figure 8 shows a schematic diagram of the overall process.
The leave-one-out cross validation (LOOCV) procedure [23] was used to validate the generalization ability of the SSM. As the total subjects were 22, LOOCV became a 22-fold cross validation process in this case. For every left-out subject (test subject), a new SSM was computed from the remaining training subjects. The parameters of the left-out subject were computed to reconstruct the subject. In this experiment, a total of 22 different evaluations were available. The average DSC was 0.918. The selected number of PCs was six because the cumulative contribution ratio of the PCs was 95% or more.
4.2. Humeral Head Shape Analysis Using Statistical Shape Model
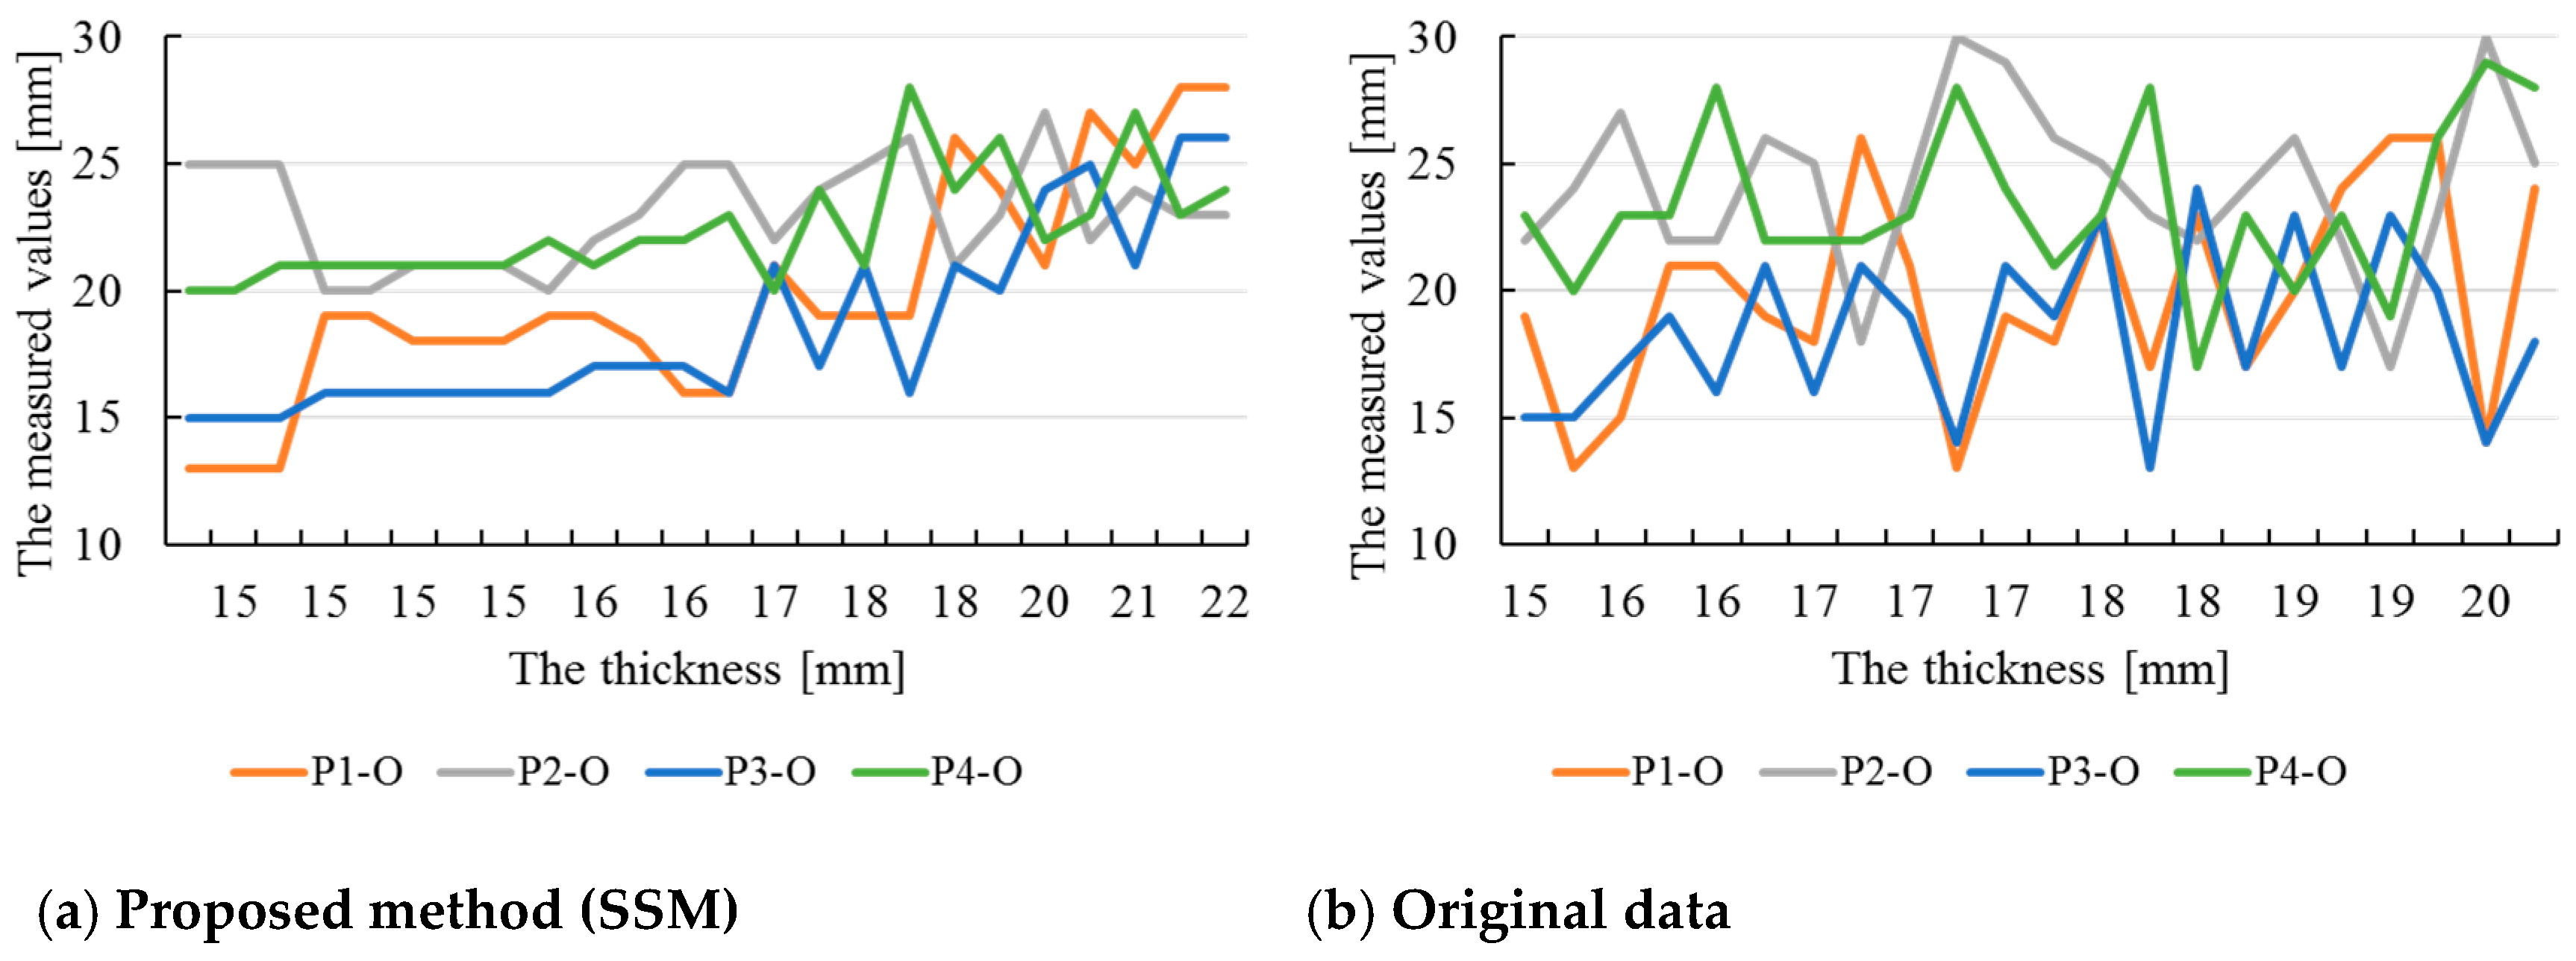
To evaluate the interindividual humeral head shape quantitatively, the measurements were done for 25 statistical shape models constructed by changing the standard deviation along the first PC from to at intervals of , where is the Eigen value of the first PC. The measurement was performed on the shape of each subject. Table 1 shows the average and variance of the measured values between different points. The results showed that the first PC had a large variance in the distance between P1–P2 and P3–P4, i.e., the interindividual variation in the anterior-posterior to lateral-medial (AP-LM) direction was large. In particular, it was found that the variance of the distance P1–O was large. The results showed that the variance in the distance P1–O was large in both of the measurements, i.e., measurement from the SSM and measurement from the subject’s shape. Thus, it confirmed that the SSM by the proposed method can grasp the tendency of the subject population. Table 1 also shows the measured values for original data. Figure 9 and Table 2 show the correlation coefficients between the thicknesses and the distances between different points, i.e., P1–O, P2–O, P3–O, and P4–O, considering both the measurements. These results showed that the thicknesses and distances of P1–O and P3–O had a strong positive correlation (>0.8) when using the proposed method, by the SSM. In other words, it could be considered that the prosthesis should be deformed by considering the same tendency at each size, because the head is not just a scale-up, but rather the extension of anterior and lateral is dominant.
5. Discussions
In glenohumeral osteoarthritis treatment, one of the most preferred ways is to replace the humeral head surgically with an artificial one. Popular consensus among experts is that accurate replication would bring better functional outcome [4,24,25,26]. Although it is well documented that the humeral head is ovoid [4,24,25,26,27], the use of spherical artificial humeral heads during the reconstructive surgery of the shoulder is general practice. Even small alterations (4–5 mm) of size and position of the articular surface could cause adverse effects on the biomechanics of the glenohumeral during arthroplasty surgery on the glenohumeral [4,28,29]. A potential concern arises from this, as the spherical artificial humeral head often exceeds a 4 mm mismatch, when compared with the anatomical measurement of a normal humeral head [30]. Thus, this study proposed a method to construct a humeral head SSM for the design of a patient-specific artificial humeral head. The generalization ability of SSMs was verified using the LOOCV technique, and the results indicated that its generalization ability was quite strong. The study also investigated the interindividual shape of the humeral head quantitatively using the SSM. The investigation demonstrated a strong correlation between individual characteristics of the humeral head and the thickness of the humeral head, which the conventional method failed to identify by simply analyzing the subject data. In line with the hypothesis, this newly obtained knowledge might be useful in designing patient-specific artificial humeral heads. On the contrary, the reliability of the study was impacted by the absence of a sufficient number of subjects. On top of that, the methodological choices were constrained by manual segmentation, which was a very tedious and inefficient process, especially for the persons involved in it. Thus, to improve the reliability and acceptability of the proposed method, the number of subjects should be increased. In addition, the manual segmentation process should be replaced by automatic segmentation.
6. Conclusions
One of the most important criteria for a successful glenohumeral osteoarthritis treatment is that the shape of the artificial humeral head be similar to the actual shape of the humeral head from the viewpoint of the ROM. This study proposed a method to construct a humeral head SSM from CT images. The SSM expressed the interindividual shape variation of the humeral head, and the generalization ability of the SSM was validated by calculating the Dice coefficient, which was 0.918. Humeral head shape analysis using the SSM was conducted, and the anatomical features of the humeral heads were obtained in that process. The quantitative analysis of the humeral head SSM discovered the fact that the thickness of the humeral head had a strong positive correlation with the anterior and lateral expansion of the humeral head. The encouraging segmentation results and the information obtained by quantitative humeral head SSM shape analysis could be considered as an important tool towards successful design of artificial humeral heads. Future works should be directed to increase the reliability of the model by increasing the number of subjects, optimize the extraction method of the humeral head, and elucidate the differences of interindividual variations of humeral head shape in other principal components.
Author Contributions
Conceptualization, S.K.; methodology, S.K. and H.T.; software, S.K.; validation, F.P.M. and S.K.; formal analysis, H.T.; investigation, K.N., H.I., and T.M.; resources, K.N.; data curation, K.N., H.T., and H.I.; writing—original draft preparation, F.P.M.; writing—review and editing, S.K. and H.T.; visualization, S.K. and H.T.; supervision, S.K.; project administration, S.K. All authors have read and agreed to the published version of the manuscript.
Funding
This research received no external funding.
Conflicts of Interest
The authors declare no conflicts of interest.
References
- Kerr, R.; Resnick, D.; Pineda, C.; Haghighi, P. Osteoarthritis of the glenohumeral joint: A radiologic-pathologic study. Am. J. Roentgenol. 1985, 144, 967–972. [Google Scholar] [CrossRef] [PubMed] [Green Version]
- Chillemi, C.; Franceschini, V. Shoulder osteoarthritis. Arthritis 2013, 2013, 370231. [Google Scholar] [CrossRef] [PubMed] [Green Version]
- Millett, P.J.; Gobezie, R.; Boykin, R.E. Shoulder osteoarthritis: Diagnosis and management. Am. Fam. Physician 2008, 78, 605–611. [Google Scholar] [PubMed]
- Jun, B.J.; Iannotti, J.P.; McGarry, M.H.; Yoo, J.C.; Quigley, R.J.; Lee, T.Q. The effects of prosthetic humeral head shape on glenohumeral joint kinematics: A comparison of non-spherical and spherical prosthetic heads to the native humeral head. J. Shoulder Elb. Surg. 2013, 22, 1423–1432. [Google Scholar] [CrossRef]
- Kubo, Y.; Hossain, B.; Nii, M.; Muto, T.; Tanaka, H.; Inui, H.; Nobuhara, K.; Kobashi, S. 3-D statistical shape model of the humerus towards artificial shoulder joint design. In Proceedings of the 2018 World Automation Congress (WAC), Washington, DC, USA, 3–6 June 2018; pp. 1–5. [Google Scholar]
- Harrold, F.; Wigderowitz, C. Humeral head arthroplasty and its ability to restore original humeral head geometry. J. Shoulder Elb. Surg. 2013, 22, 115–121. [Google Scholar] [CrossRef]
- Heimann, T.; Meinzer, H.-P. Statistical shape models for 3D medical image segmentation: A review. Med. Image Anal. 2009, 13, 543–563. [Google Scholar] [CrossRef]
- Wataru, S.; Kazuomi, S.; Yoshikazu, N.; Hiroaki, I.; Takaharu, Y.; Hideki, Y. Three-dimensional morphological analysis of humeral heads: A study in cadavers. Acta Orthop. 2005, 76, 392–396. [Google Scholar] [CrossRef]
- Humphrey, C.S.; Gale, A.L. Spherical versus elliptical prosthetic humeral heads: A comparison of anatomic fit. J. Shoulder Elb. Surg. 2018, 27, S50–S57. [Google Scholar] [CrossRef]
- Gregory, J.S.; Testi, D.; Stewart, A.; Undrill, P.E.; Reid, D.M.; Aspden, R.M. A method for assessment of the shape of the proximal femur and its relationship to osteoporotic hip fracture. Osteoporos. Int. 2004, 15, 5–11. [Google Scholar] [CrossRef]
- Roberts, M.; Cootes, T.; Pacheco, E.; Adams, J. Quantitative vertebral fracture detection on DXA images using shape and appearance models. Acad. Radiol. 2007, 14, 1166–1178. [Google Scholar] [CrossRef]
- Gregory, J.S.; Waarsing, J.H.; Day, J.; Pols, H.A.; Reijman, M.; Weinans, H.; Aspden, R.M. Early identification of radiographic osteoarthritis of the hip using an active shape model to quantify changes in bone morphometric features: Can hip shape tell us anything about the progression of osteoarthritis? Arthritis Rheum. 2007, 56, 3634–3643. [Google Scholar] [CrossRef] [PubMed]
- Pitocchi, J.; Wirix-Speetjens, R.; van Lenthe, G.H.; Pérez, M.Á. Integration of cortical thickness data in a statistical shape model of the scapula. Comput. Methods Biomech. Biomed. Eng. 2020, 1–7. [Google Scholar] [CrossRef] [PubMed]
- Marzola, A.; Servi, M.; Volpe, Y. A Reliable Procedure for the Construction of a Statistical Shape Model of the Cranial Vault; Springer International Publishing: Cham, Switzerland, 2020; pp. 788–800. [Google Scholar]
- Merle, C.; Waldstein, W.; Gregory, J.S.; Goodyear, S.R.; Aspden, R.M.; Aldinger, P.R.; Murray, D.W.; Gill, H.S. How many different types of femora are there in primary hip osteoarthritis? An active shape modeling study. J. Orthop. Res. 2014, 32, 413–422. [Google Scholar] [CrossRef] [Green Version]
- Shih, K.-S.; Hsu, C.-P.; Liu, C.-W.; Wang, L.-L.; Hou, S.-M.; Lin, S.-C. Comparison between different screening strategies to determine the statistical shape model of the pelvises for implant design. Comput. Methods Biomech. Biomed. Eng. 2019, 178, 265–273. [Google Scholar] [CrossRef] [PubMed]
- Jolliffe, I.T. Principal Component Analysis, 2nd ed.; Springer-Verlag: New York, NY, USA, 1986. [Google Scholar]
- Audenaert, E.A.; Pattyn, C.; Steenackers, G.; De Roeck, J.; Vandermeulen, D.; Claes, P. Statistical shape modeling of skeletal anatomy for sex discrimination: Their training size, sexual dimorphism, and asymmetry. Front. Bioeng. Biotechnol. 2019, 7, 302. [Google Scholar] [CrossRef] [Green Version]
- Liu, H.; Xiong, R.; Zhang, J.; Gao, W. Image denoising via adaptive soft-thresholding based on non-local samples. In Proceedings of the 2015 IEEE Conference on Computer Vision and Pattern Recognition (CVPR), Boston, MA, USA, 7–12 June 2015; pp. 484–492. [Google Scholar]
- Mikla, V.I.; Mikla, V.V. (Eds.) 2-Computed tomography. In Medical Imaging Technology; Elsevier: Oxford, UK, 2014; pp. 23–38. [Google Scholar]
- Butrie, M. Industrial CT Scanning Terms—What Are ‘Voxels’ And Why Do They Matter? Available online: https://3dproscan.com/industrial-ct-scanning-terms-what-are-voxels-and-why-do-they-matter/ (accessed on 2 August 2020).
- Osher, S.; Fedkiw, R. (Eds.) Implicit functions. In Level Set Methods and Dynamic Implicit Surfaces; Springer: New York, NY, USA, 2003; pp. 3–16. [Google Scholar] [CrossRef]
- Davies, R.; Twining, C.; Taylor, C. Statistical Models of Shape: Optimisation and Evaluation; Springer Publishing Company, Incorporated: New York, NY, USA, 2008. [Google Scholar]
- Boileau, P.; Walch, G. The three-dimensional geometry of the proximal humerus. Implications for surgical technique and prosthetic design. J. Bone Jt. Surg. Br. Vol. 1997, 79, 857–865. [Google Scholar] [CrossRef]
- McPherson, E.J.; Friedman, R.J.; An, Y.H.; Chokesi, R.; Dooley, R.L. Anthropometric study of normal glenohumeral relationships. J. Shoulder Elb. Surg. 1997, 6, 105–112. [Google Scholar] [CrossRef]
- Pearl, M.L.; Kurutz, S. Geometric analysis of commonly used prosthetic systems for proximal humeral replacement *. JBJS 1999, 81, 660–671. [Google Scholar] [CrossRef]
- Pearl, M.L.; Volk, A.G. Coronal plane geometry of the proximal humerus relevant to prosthetic arthroplasty. J. Shoulder Elb. Surg. 1996, 5, 320–326. [Google Scholar] [CrossRef]
- Karduna, A.R.; Williams, G.R.; Williams, J.L.; Iannotti, J.P. Glenohumeral joint translations before and after total shoulder arthroplasty. a study in cadavera *. JBJS 1997, 79, 1166–1174. [Google Scholar] [CrossRef]
- Karduna, A.R.; Williams, G.R.; Williams, J.L.; Iannotti, J.P. Joint stability after total shoulder arthroplasty in a cadaver model. J. Shoulder Elb. Surg. 1997, 6, 506–511. [Google Scholar] [CrossRef]
- Humphrey, C.S.; Sears, B.W.; Curtin, M.J. An anthropometric analysis to derive formulae for calculating the dimensions of anatomically shaped humeral heads. J. Shoulder Elb. Surg. 2016, 25, 1532–1541. [Google Scholar] [CrossRef] [PubMed]
Figure 1.
Acquired axial computed tomography (CT) images

Figure 2.
Manual segmentation of the humerus from shoulder CT image: (a) CT image and (b) corresponding humeral region.
Figure 2.
Manual segmentation of the humerus from shoulder CT image: (a) CT image and (b) corresponding humeral region.

Figure 3.
An example of the acquired coordinate value in the anatomical neck.

Figure 4.
The flow of extracting the humeral head from the humerus (S: superior, I: inferior, L: lateral, M: medial).
Figure 4.
The flow of extracting the humeral head from the humerus (S: superior, I: inferior, L: lateral, M: medial).

Figure 5.
The 3-D coordinate system for the humeral head (A: anterior, P: posterior).

Figure 6.
Humeral head shape variation synthesized by the statistical shape model (SSM), where the horizontal direction corresponds to the first principle component (PC) score and vertical direction corresponds to the second PC score.
Figure 6.
Humeral head shape variation synthesized by the statistical shape model (SSM), where the horizontal direction corresponds to the first principle component (PC) score and vertical direction corresponds to the second PC score.

Figure 7.
Cumulative contribution rate (CCR) of the SSM corresponding to the number of principal components; the SSM can represent 95% shape variation from the first five PCs.
Figure 7.
Cumulative contribution rate (CCR) of the SSM corresponding to the number of principal components; the SSM can represent 95% shape variation from the first five PCs.

Figure 8.
Schematic diagram of SSM validation.

Figure 9.
Relationship between the thicknesses and the distances of different points on the humeral head.
Figure 9.
Relationship between the thicknesses and the distances of different points on the humeral head.


Table 1.
The average and the variance of the measured values between different points on the humeral head (in mm).
Table 1.
The average and the variance of the measured values between different points on the humeral head (in mm).
| Measured Points | Proposed Method (SSM) | Original Data |
|---|---|---|
| The thickness | 17.2 ± 5.7 | 17.6 ± 2.3 |
| P1–P2 | 43.2 ± 20.5 | 44.0 ± 8.1 |
| P3–P4 | 41.4 ± 24.2 | 41.9 ± 7.4 |
| P1–O | 20.1 ± 20.3 | 19.9 ± 15.8 |
| P2–O | 23.1 ± 3.9 | 24.2 ± 10.3 |
| P3–O | 18.7 ± 12.8 | 18.4 ± 10.3 |
| P4–O | 22.6 ± 5.5 | 23.4 ± 10.0 |
Table 2.
The correlation coefficient between thickness and each measured values of different points on the humeral head.
Table 2.
The correlation coefficient between thickness and each measured values of different points on the humeral head.
| P1–O | P2–O | P3–O | P4–O | |
|---|---|---|---|---|
| The proposed method (SSM) | 0.87 | 0.24 | 0.89 | 0.67 |
| Original data | 0.40 | 0.06 | 0.26 | 0.20 |
© 2020 by the authors. Licensee MDPI, Basel, Switzerland. This article is an open access article distributed under the terms and conditions of the Creative Commons Attribution (CC BY) license (http://creativecommons.org/licenses/by/4.0/).
Share and Cite
MDPI and ACS Style
Mahdi, F.P.; Muto, T.; Tanaka, H.; Inui, H.; Nobuhara, K.; Kobashi, S. Construction of 3-D Humeral Head Statistical Shape Model in CT Images. Appl. Sci. 2020, 10, 5591. https://doi.org/10.3390/app10165591
AMA Style
Mahdi FP, Muto T, Tanaka H, Inui H, Nobuhara K, Kobashi S. Construction of 3-D Humeral Head Statistical Shape Model in CT Images. Applied Sciences. 2020; 10(16):5591. https://doi.org/10.3390/app10165591
Chicago/Turabian StyleMahdi, Fahad Parvez, Tomoyuki Muto, Hiroshi Tanaka, Hiroaki Inui, Katsuya Nobuhara, and Syoji Kobashi. 2020. "Construction of 3-D Humeral Head Statistical Shape Model in CT Images" Applied Sciences 10, no. 16: 5591. https://doi.org/10.3390/app10165591
Note that from the first issue of 2016, this journal uses article numbers instead of page numbers. See further details here.