Service-Aware Interactive Presentation of Items for Decision-Making


Computer Science Department, University of Torino, Corso Svizzera 185, I10149 Torino, Italy
*
Author to whom correspondence should be addressed.
Appl. Sci. 2020, 10(16), 5599; https://doi.org/10.3390/app10165599
Submission received: 22 July 2020
/
Revised: 6 August 2020
/
Accepted: 9 August 2020
/
Published: 12 August 2020
(This article belongs to the Special Issue Implicit and Explicit Human-Computer Interaction)
Abstract
:Current information exploration models present low-level features or technical aspects related to the paradigm used to generate results. While this may increase transparency, it does not help the user form a personal opinion about items because it does not describe the overall experience with them. In order to address this issue, we propose the INTERactivE viSualizaTion model (INTEREST) that supports the exploration and analysis of search results by means of a graphical representation of consumer feedback aimed at making the user aware of the service properties in all the stages of fruition, focusing on the data that is most relevant to her/him. INTEREST is based on the Service Journey Maps for the design and description of user experience with services. We applied it to the home booking domain by developing the Apartment Monitoring application that supports overviewing and analyzing online reviews about rented homes. In a user study, we compared the decision-making support provided by our application with that of a baseline model that enables a temporal filtering of consumer feedback. We found out that Apartment Monitoring outperforms the baseline in user experience, user awareness of item properties, and user control during the interaction with the system. In particular, according to the participants of the study, Apartment Monitoring describes the expectations about the homes and it supports their selection in a more effective way than the baseline. These findings encourage moving from a low-level description of item properties to a service-oriented one in order to improve users’ decision-making capabilities.
1. Introduction
The classical ranked list of results presented by search engines poorly supports content interpretation because it cannot explain why the returned items are relevant to the submitted query, or to some of its terms, and how results are related to each other; see in [1]. In order to mitigate this issue, and to increase the acceptance of results, recent recommender systems [2] adopt presentation models aimed at supporting transparency [3] and trust [4,5] by enriching the suggestions they generate with a description of the degree, or of the type of matching between users and items. For instance, RSR [6] shows the topic relations between user and proposed items, e.g., by research theme. Moreover, hybrid recommender systems propose analytic visualizations that show how strongly the embedded engines support the suggested items [7,8,9]. Furthermore, to support exploratory search [10], other works promote the development of faceted search interfaces that empower the user to control the information filtering process by guiding her/him in the selection of item features, e.g., see the seminal works by Hearst [11,12] and recent ones such as in [13,14].
We claim that current information presentation models offer limited support the exploration of online catalogs, because of the following.
- Describing the rationale behind the suggestions generated by a system can enhance its transparency but it does not necessarily provide the user with the information (s)he needs to decide whether the proposed items are good or bad for her/him. This type of explanation has been traditionally applied in diagnostic expert systems [15] to substantiate their inferences, as a trust measure to help the user assess the validity of the reached conclusions. Moreover, it has been promoted to improve interactive systems in [16]. However, when selecting items, users might adopt multiple evaluation criteria [17,18] which might differ from those applied by the recommender system. Therefore, explaining why an item is suggested is not sufficient to support people in decision-making.
- Faceted search interfaces return items having the exact features or aspects specified by the user, e.g., the restaurants that offer outdoor seating or which serve good food. However, these interfaces poorly address evaluation dimensions that depend on the aggregation of multiple properties, e.g., product quality.
- Decision-making cannot be restricted to information filtering because the experience with items can involve different stages of interaction with the provider, from their search to their delivery/fruition, all of which impact on satisfaction. Moreover, specifically concerning experience goods [19], which have to be used in order to be evaluated, previous consumers’ opinions are a key type of data to be considered, see, e.g., in [20].
Indeed, the data about items available in online catalogs and services can be exploited to enhance user awareness and decision-making because it complements metadata with a rich source of information about consumer experience represented by item reviews. Thus, in order to address the limitations of the above listed approaches, we aim at developing a novel information presentation model that provides the user with a holistic perspective on search results, based on a direct analysis of previous consumers’ experience rather than on an internal elaboration of low-level details representing the viewpoint of the system. Different from existing models, which attempt to explain why items fit the user, we aim at enabling her/him to make a first-hand opinion about the proposed solutions by efficiently inspecting consumer feedback, in an interactive way. In other words, we propose to treat results generation and presentation as separate concerns. This approach has two main advantages: on the one hand, it enhances the system transparency by making information presentation independent of its inferences, which might be error-prone. On the other hand, it supports the development of agnostic presentation models that can be applied on top of different information filtering techniques in order to enrich them with an efficient presentation of their results. Both aspects contribute to improve information exploration support tools with a better presentation of results.
The INTERactivE viSualizaTion (INTEREST) model, described in this paper, implements the previously discussed points. INTEREST provides a holistic, visual summary of consumer feedback based on interactive charts that support the analysis of reviews and their inspection at different temporal and content granularity levels to satisfy individual information needs. Building on the large availability of reviews in online catalogs of products and services (e.g., Amazon [21] and Yelp [22]), and on the existing literature on service design and evaluation, our model provides a synthesis of the satisfaction with items under multiple evaluation dimensions associated with consumer experience. Specifically, INTEREST is based on one of the most used conceptual models for the design and description of user experience, the “Service Journey Maps” [23,24], which support the definition of high-level aspects of a service associated with different stages of fruition by users. In our model we define the evaluation dimensions as follows.
- First, we model the user experience in stages, e.g., considering online product sales, the experience starts with searching for goods on the web site of the retailer and ends with after sales assistance.
- Then, starting from the above stages, we identify a set of evaluation dimensions for item selection.
- Finally, we extract the sentiment of online reviews with respect to the identified dimensions in order to automatically build a holistic synthesis of consumer feelings towards items.
The interactive charts generated by INTEREST summarize previous consumers’ opinions about the service evaluation dimensions. Moreover, they support a direct access to relevant reviews by highlighting the evaluated dimensions for easy identification. This enhances user awareness by supporting the formation of a personal opinion about items. In fact, the user can overview the search results focusing on the dimensions of interest, and (s)he can go in depth if (s)he is interested in specific data, being helped to identify the relevant text to be read. The definition of service evaluation dimensions for item presentation is a novel aspect of our approach: while some existing works provide diagrams to visually summarize low-level properties of items (see, e.g., in [25]), they cannot describe items in the holistic perspective given by service design. Notice also that, as INTEREST works on a set of items without making any assumptions about how they have been retrieved, it can be applied to explore the results of a recommendation algorithm, as well as of a faceted exploration system. This is a very important aspect because it makes it possible to exploit our model as a complement to any existing information filtering technology.
INTEREST can be instantiated on different domains, after having analyzed the underlying services and evaluation dimensions. In our work we applied INTEREST to home booking and we tested it on a dataset of reviews gathered from Airbnb [26]. The resulting application, named Apartment Monitoring, enables the user to search for homes and to analyze reviews by focusing on different dimensions of the overall service experience, such as the appreciation of the host by her/his guests and the in-apartment experience. We designed a Service Journey Map describing the stages of a typical home renting experience from the viewpoint of the guest. Then, for each stage, we identified the evaluation criteria to be modeled in the application starting from those found in the literature about home and hotel booking [27,28,29]. Finally, we detected a set of relevant evaluation dimensions with respect to the service stages.
We carried out a user study to investigate the User Experience (UX) with Apartment Monitoring by comparing it to a baseline system that enables the user to filter reviews by time frame. The experimental results show that the INTEREST model underlying our application outperforms the baseline presentation of information in all UX aspects, including the perception of awareness and control during data exploration for decision-making. In summary, this paper brings the following scientific contributions.
- A novel methodology to design interactive information presentation models supporting a holistic evaluation of items from a service-oriented point of view.
- An interactive visual model (INTEREST) to evaluate search results with respect to evaluation dimensions concerning all the phases of service fruition, and at different temporal granularity levels. This is aimed at helping the user quickly understand whether items are suitable for her/him on the basis of existing online consumer feedback.
- A prototype system (Apartment Monitoring) obtained by instantiating INTEREST in the home booking domain.
- Validation results of our model within a user study with real users.
The remainder of this paper is organized as follows. Section 2 positions our work within the related one. Section 3 presents the INTEREST model and the Apartment Monitoring application. Section 4 describes the validation methodology we applied. Section 5 describes the experimental results. Section 6 discusses these results, outlines the limitations of our work and presents our future research. Finally, Section 7 concludes the paper.
2. Background and Related Work
2.1. Background on Service Journey Maps
The Service Journey Maps (SJM) [23,30] model is one of the most largely used models in service design and innovation because they provide a powerful tool for a holistic approach to the design and development of products and services by focusing on the way customers experience them. A SJM is a visual description of the user experience in using a physical or virtual service. The graphic visualization follows a temporal line from the start point (e.g., enter website or enter shop) to the end one (e.g., on site or online customer care) in order to highlight and understand the various stages a person gets in touch with to benefit from the service; these stages are named touchpoints. SJMs are included as a visual model in the ServiceML language [24] that has been applied to industry case studies; moreover, they have been proposed to improve the design of online Reputation Management Systems (reputation describes a general “expectation about an agent’s behavior based on information about or observations of its past behavior” [31]. This concept has a global perspective, and Mui et al. [32] describe it as the “perception that an agent creates through past actions about its intentions and norms”. According to Misztal [33], reputation “helps us to manage the complexity of social life by singling out trustworthy people—in whose interest it is to meet promises”). Starting from the intuition that service design and reputation system modeling share many demands (to represent a variety of entities involved in the related domains), aims (to improve services and businesses with the aim of meeting user needs), and problems (they all involve stakeholders having very different backgrounds and skills), Capecchi and Bettini et al. [34,35] propose tools for service modeling that support designers in capturing high-level reputation management requirements and their implementation. Specifically, they show how consumer feedback can be directly matched to roles and partners involved in business/service creation to detect responsibilities and to plan appropriate actions.
2.2. Information Exploration Support Models
Several graphical models for the presentation of search results go beyond the traditional ranked list to make relations within results explicit and to support visual thinking. Some works extend the ranked list with graphical annotations; see Table 1 for an overview. For instance, HotMap [36] adopts color coding to highlight the terms of the search query in each retrieved item. Moreover, Concept Highlighter [36] applies color coding to describe the degree of match between each item and a set of concepts extracted by interpreting the query. Furthermore, Exploration Wall [37] provides streams of topically related results and prompts suggestions to help information search on mobile devices. Other models abandon the ranked list in favor of 2D representations to visualize the relevance of results and some types of relations between them [38]. For instance, VIBE [39] presents data on a 2D plane using proximity to denote content similarity with respect to points in the map that denote particularly interesting keywords, topics, or other. Cartograph [40] leverages thematic cartography to visually represent semantic relations among non-geographic data and OnToMap [14] supports facet-based focusing of geographic maps based on multiple dimensions of selection. Some works visualize semantic relations among clusters of results, e.g., FacetAtlas [41] links topics in a 3D diagram supporting the representation of multidimensional relations among them, and SolarMap [42] combines topic-based document clustering with a radial representation of facets to support two-level, topic-based document filtering.
Even though we focus on the visualization of information about individual search results, we are concerned about the presentation of possibly large data sets because, in online catalogs, items can receive a significant amount of feedback. In order to enhance the efficiency of this task, our model supports filtering reviews with respect to the defined evaluation dimensions and we apply color coding to relate the words appearing in the reviews to such dimensions. Moreover, we annotate each review with smilies indicating whether it has negative, neutral, or positive sentiment so that the user can quickly interpret it; in this way, (s)he can survey consumer feedback without inspecting it in detail.
2.3. Explanation of Recommender Systems Suggestions
Recent recommender systems help users analyze the results they generate with the aim of enhancing transparency [3] and trust [4,5].
Table 1 summarizes the works that we overview. Considering collaborative recommenders, Herlocker et al. [44] base explanations on the conceptual model that the use has of the recommendation process: they find out that grouping neighbors’ ratings, and presenting the past performance of a system, enhance the acceptance of its suggestions. Moreover, Pu and Chen [43] propose explanations organized by grouping items on the basis of their trade-off properties to help decision-making.
Explanations can be based on the applied recommendation paradigm. For instance, content-based recommender systems [45] can motivate suggestions by highlighting the content that matches the user’s interests. Moreover, feature-based recommenders [46] and multicriteria ones [47,48,49] separately evaluate the utility of item features; therefore, they can use this information to present the suggestions. Furthermore, graph-based recommenders such as RSR [6] and RippleNet [50] use the chains of relations connecting the user and the suggested items as explanations, while [51] exploits chains connecting users and items in the Linked Open Data cloud to justify recommendations regardless of how they have been generated.
Hybrid recommender systems are more complex to explain because they integrate heterogeneous inference techniques. In that case, the presentation of results typically aims at helping the user shed light on the influence of the embedded engines on item suggestion. For instance, MyMovieFinder [53] adopts a ranked-list visualization and, by clicking on items, the user can see the recommendation criteria they meet. TalkExplorer [8] graphically represents multiple dimensions of items relevance within bidimensional graphs. Analytic models such as Venn diagrams are also proposed to overview the suggestions [56]; SetFusion [54] exploits this type of diagram, combined with color bars, to visualize items and to show how strongly the embedded recommenders support them. RelevanceTuner [7] directly visualizes the degree of support received by the items of the ranked list as stackable bars, and IntersectionExplorer [55] uses the UpSet matrix [72] to show the number of common suggestions provided by the recommenders in a grid-layout. Finally, HyPER [9] integrates heterogeneous recommenders by means of probabilistic logic rules also used to explain the results.
We pursue a direct interaction with results to avoid complex analytic visualizations that might challenge non-technical users and people having low visual spatial abilities [73,74]. For this purpose, we invest in improving the efficiency of analysis of individual items, assuming that the user has picked them, e.g., from a ranked list. In this perspective, we offer a simple, interactive model to (i) visualize a synthesis of consumer sentiment about the evaluation dimensions selected by the user and (ii) provide direct access to the reviews supporting that sentiment. In this way the user can easily identify the comments relevant to her/his interests and form a “first-hand” opinion about items. Our work is related to Millecamp et al.’s one [25] because both models present item dimensions by means of charts. However, we provide holistic information about items, based on high-level service evaluation dimensions; differently, in the other work the diagrams support the visualization of low-level item properties such as music tracks’ tempo and acousticness. Similar to the work in [51,75,76], our model is agnostic with respect to how items are filtered. However, rather than justifying recommendations by means of a synthesis of reviews, we aim at empowering the user to efficiently explore the existing feedback to make a personal opinion about items. This has a triple advantage: (i) it supports user awareness of item properties; (ii) it does not infringe the transparency of the recommender system; and (iii) it is not affected by issues related to personal characteristics, which in some domains impact on the user’s confidence in the explanations (s)he receives [77].
Review-based recommender systems [57] extract item features and aspects from online user feedback to build user and item models for personalized recommendations [59,60,61,62], or to build user–item chains of relations for graph-based recommendation as in TriRank [52]. While most works strictly focus on improving Top-N recommendation (see, e.g., in [58,63,64,65]), McAuley and Leskovec [71] introduce the idea of matching relevant item features extracted from reviews to latent factors in order to support explanation in Matrix Factorization. In the same line of research, Muhammad et al. [66] and O’Mahony and Smyth [68] mine bigram and single-noun phrases and map them to items metadata to address general features in explanations. Moreover, Ni and McAuley [69] and Lu et al. [70] extract positive and negative opinions about item features to integrate recommendation and explanation of results into a single task. Furthermore, Chen and Wang [67] classify extracted features using metadata to group them in explanation. Differently, SearchLens [13] enables the user to define search “lenses” that specify the desired features of items; it returns result lists enriched with a specification of the degree of matching between items and search criteria.
Different from the above works, which focus on specific features (e.g., outdoor seating) or aspects (e.g., taste of food), INTEREST extracts consumer sentiment about evaluation dimensions describing the whole user experience with items, from their selection to their fruition. This is possible thanks to the exploitation of Service Journey Maps that describe the stages of service underlying item selection. Moreover, our model offers an abstract representation of consumer feedback based on interactive charts that enhance data analysis and interpretation, as well as a direct access to relevant reviews.
2.4. Techniques for Analyzing Review Content
Several works identify aspects of items from reviews to understand which features emerge from consumer feedback. For this purpose they employ rather different methods. For instance, Alam et al. [78] propose a multi-grain topic sentiment extractor of semantic aspects by extending topic models such as LDA [79]. Moreover, Tang et al. [80] jointly extract multi-grain aspects and opinions by modeling aspects, opinions, sentiment, and granularities simultaneously within a probabilistic approach. On a more specific perspective, Xu et al. [81] apply LSA [82] to identify key attributes driving customer satisfaction and dissatisfaction toward hotel product and service attributes. Furthermore, Xiong and Litman [83] apply Supervised LDA [79] to extract relevant topics from high-quality reviews for summarization purposes. Korfiatis et al. [84] apply Structural Topic Models [85] to identify evaluation aspects in the reviews written by airline passengers and combine those aspects with rating data to improve the understanding of service quality. Finally, Chang et al. [86] propose an integrated framework supporting the visual analysis of hotel ratings and reviews.
At the current stage, we do not apply these techniques to extract clusters of co-occurring keywords from reviews because we exploit the elements that compose the service experience underlying the application domain to identify the high-level dimensions for item presentation and evaluation. For instance, as far as home booking is concerned, we consider the interaction with the website, check-in, check-out, etc., as suggested by the Service Journey Maps that model the home booking experience from the viewpoint of a guest.
3. Materials and Methods
We propose the INTEractivE viSualizaTion model supporting decision-making to help the user in selecting the preferred items out of a list of options (e.g., a recommendation list ) by exploiting a service design framework for the identification of evaluation dimensions. Given an item in the user’s focus of attention and the reviews about it posted by consumers, our model enables the user to do the following.
- Choose any subset of the set of evaluation dimensions derived from the underlying service model to assess the suitability of item i. The dimensions of describe previous consumer experience with items from the stage of searching for it online to its fruition.
- Select a time interval for filtering the reviews to be considered. This supports item evaluation in specific contextual conditions, e.g., starting from the most recent reviews, or from those posted within a particular time frame.
The choices that the user makes determine the set of reviews to be analyzed. On this basis, INTEREST generates a visual, interactive representation of the item aimed at summarizing its properties. Moreover, it supports a direct inspection of the relevant reviews, which are graphically annotated to show the level of satisfaction they convey, and to highlight the words concerning the evaluation dimensions they deal with, see Section 3.4. INTEREST can be configured to work on different evaluation dimensions, as long as they are identified within the application domain of interest. The following sections describe the concepts, methodologies, and techniques underlying our model.
3.1. Specification of the Dimensions of Item Evaluation
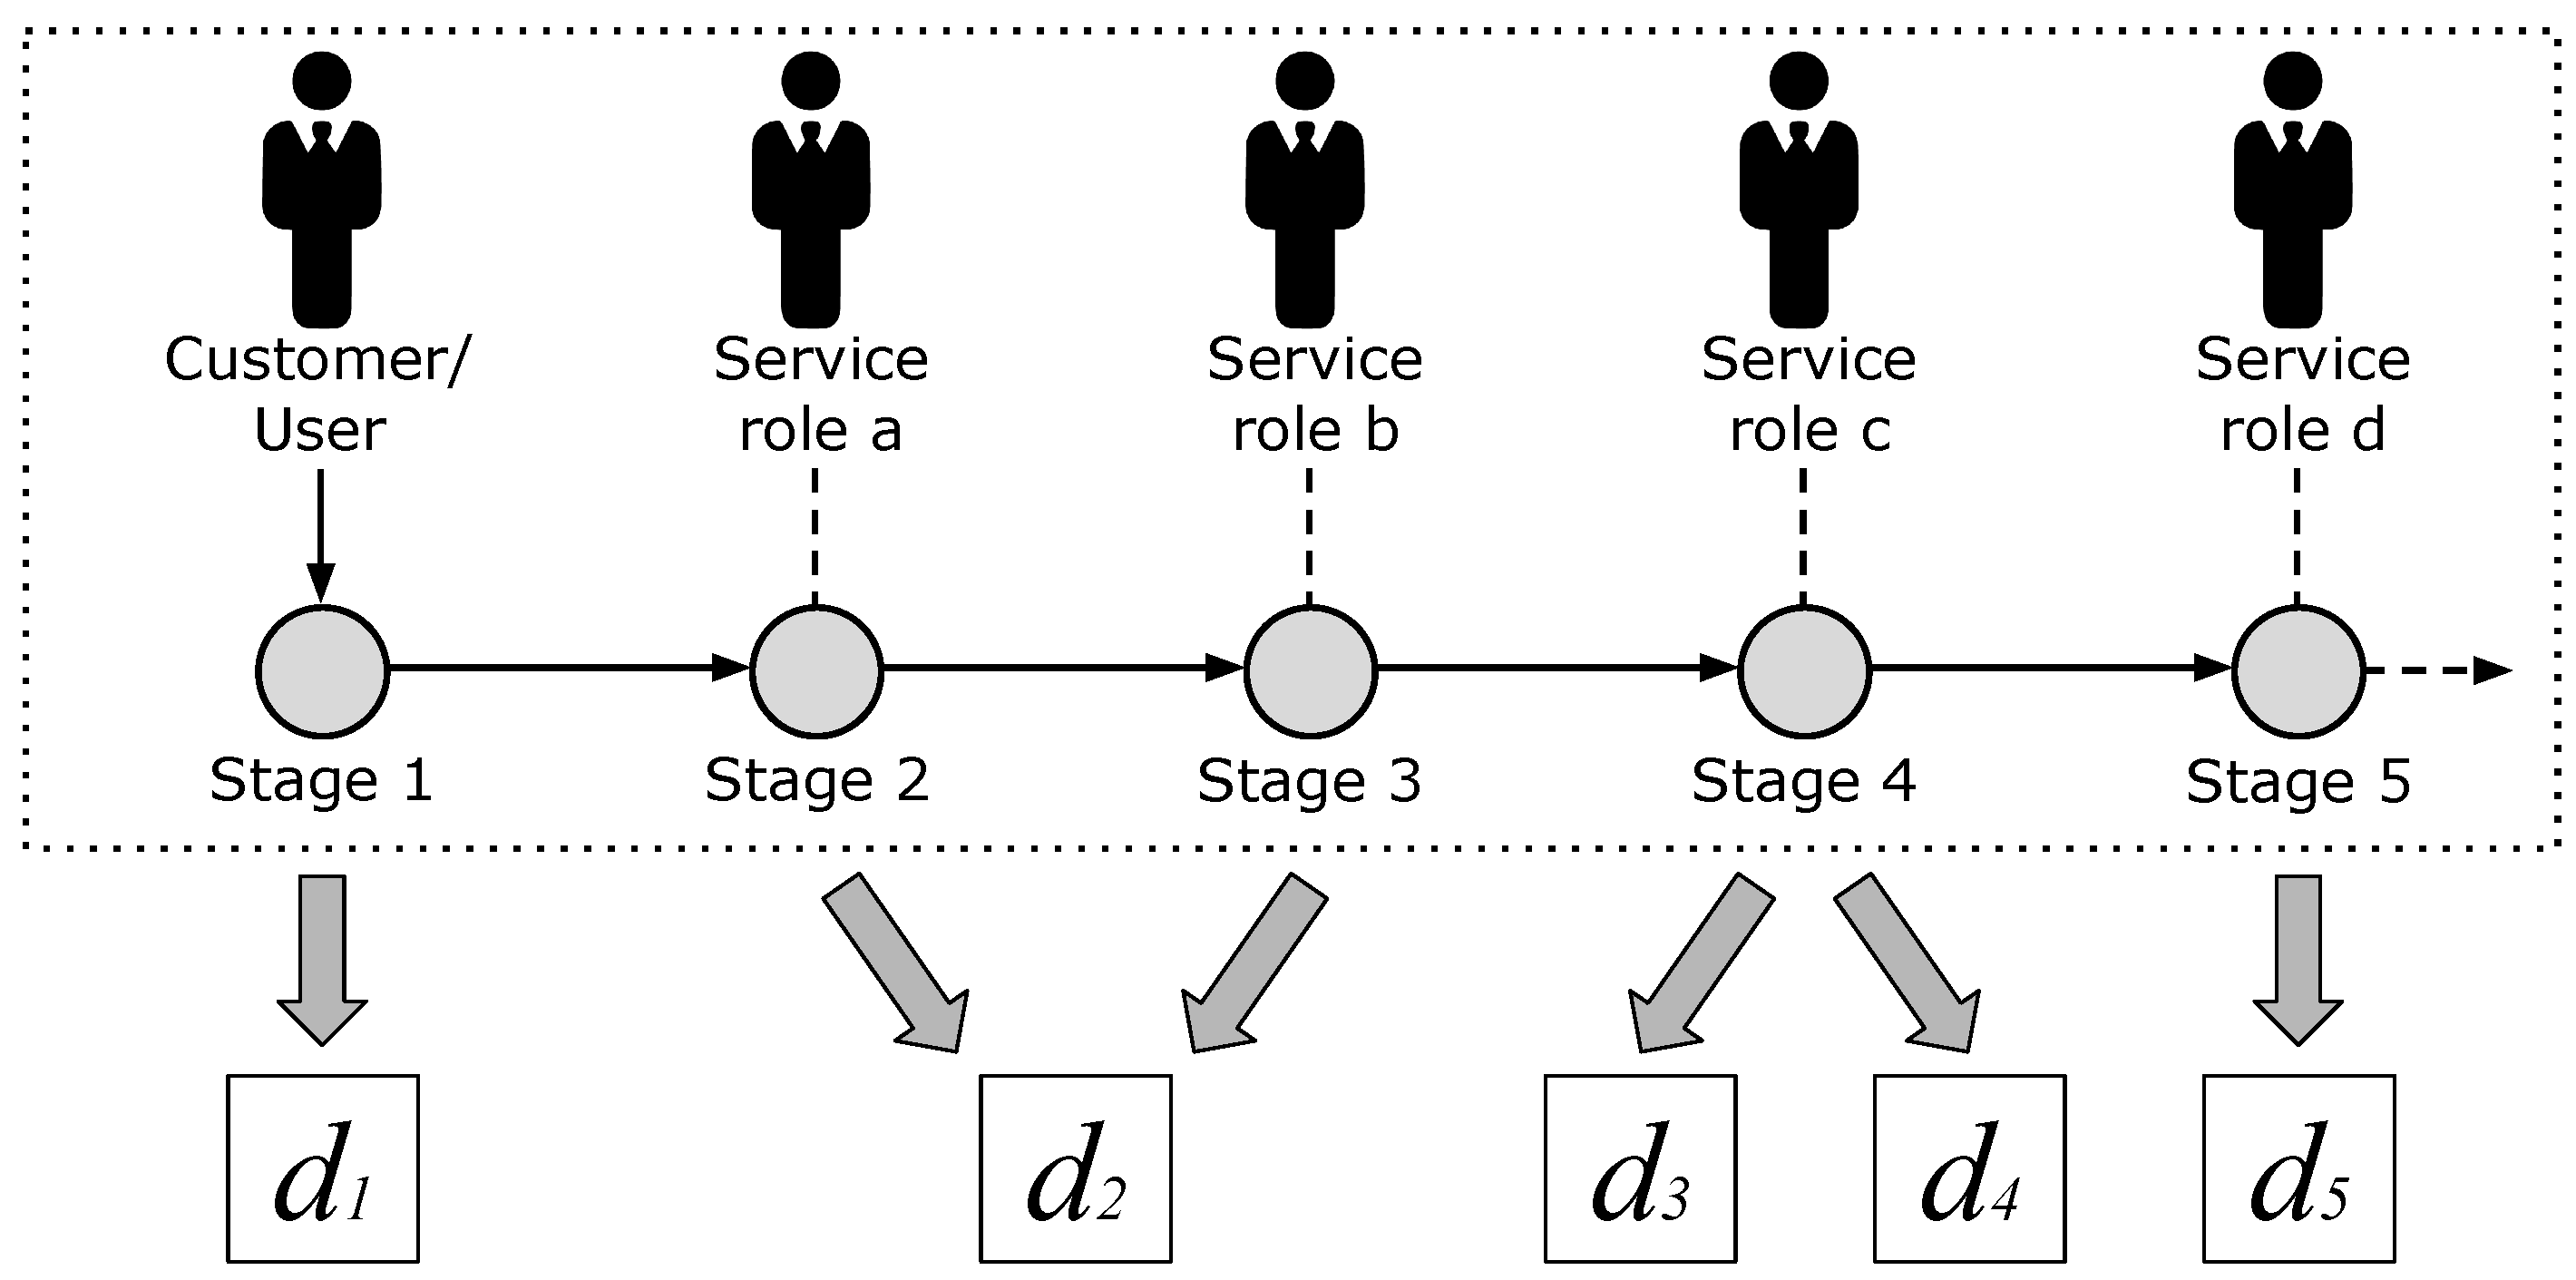
In order to define the evaluation dimensions to be used for presenting items we apply the Service Journey Maps (SJM) [24], which describe the typical flow of user activities that a participant, service provider, or other stakeholder perform in a service execution; see the upper boxed portion of Figure 1. In the map, each activity is encapsulated in a touch-point (stage) represented as a gray circle. An actor can either initiate a touch-point or be involved in it through some inputs or outputs. The former case is represented by a plain open arrow, such as the one connecting customer/user to Stage 1; the latter one is represented by means of dashed lines. The arrows connecting touch points specify their order within the overall workflow. The level of touch point details depends on the nature of the services being modeled as well as on the association between the service stages and the user experience.
The set of evaluation dimensions describing user experience with items includes high-level concepts that are retrieved from the stages of service fruition. In general, we might have a one-to-one correspondence between evaluation dimensions and stages. However, for finer-grained reasoning, we might want to identify multiple dimensions relevant to a single stage; moreover, a single dimension could be related to different stages. In order to comply with these requirements, we keep stages and evaluation dimensions as separate concepts and we model the associations between them as [M, N] relations; see the lower portion of Figure 1.
Notice that reviews rarely mention evaluation dimensions explicitly: most comments refer to item features that have to be mapped to a dimension to support their identification. For instance, the host appreciation in the home booking domain might be described by making reference to her/his family and hospitality or to other aspects of the interaction such as her/his helpfulness. In order to identify the sentences that deal with these dimensions, a thesaurus of keywords has to be built for each evaluation dimension . The thesauri can be defined using previous studies of the service domain. Notice that the keywords of the thesauri must be lemmatized to have a single, base format for each of them; for this purpose, we use the spaCy Python library [87].
As described in Section 4.2 for home booking, the identification of evaluation dimensions starting from the stages of a Service Journey Map is a possibly iterative process and it is strictly intertwined with thesaurus construction:
- We start with a one-to-one association between stages and evaluation dimensions.
- We build a first version of a thesaurus for each identified dimension .
- We analyze each of the defined thesauri and we detect:
- Dimensions that need a finer-grained representation because the associated keywords refer to topics describing service aspects that deserve to be promoted to dimensions. For instance, the “Stay in apartment” stage can be associated to distinct dimensions to separately evaluate the internal environment of the home and its surroundings.
- Keywords related to aspects that are relevant to more than one stage, such as the interaction with the host: these aspects can be promoted to evaluation dimensions associated with multiple stages.
It can be noticed that the performance of roles in delivering the service along stages can have an important impact on the construction of thesauri and, consequently, on the definition of the evaluation dimensions to be modeled. For instance, in a Service Journey Map describing the experience of customers in a restaurant, the waiter’s behavior and attitudes highly influence the experience in stages such as “order meal” and “consume meal”.
3.2. Review Analysis
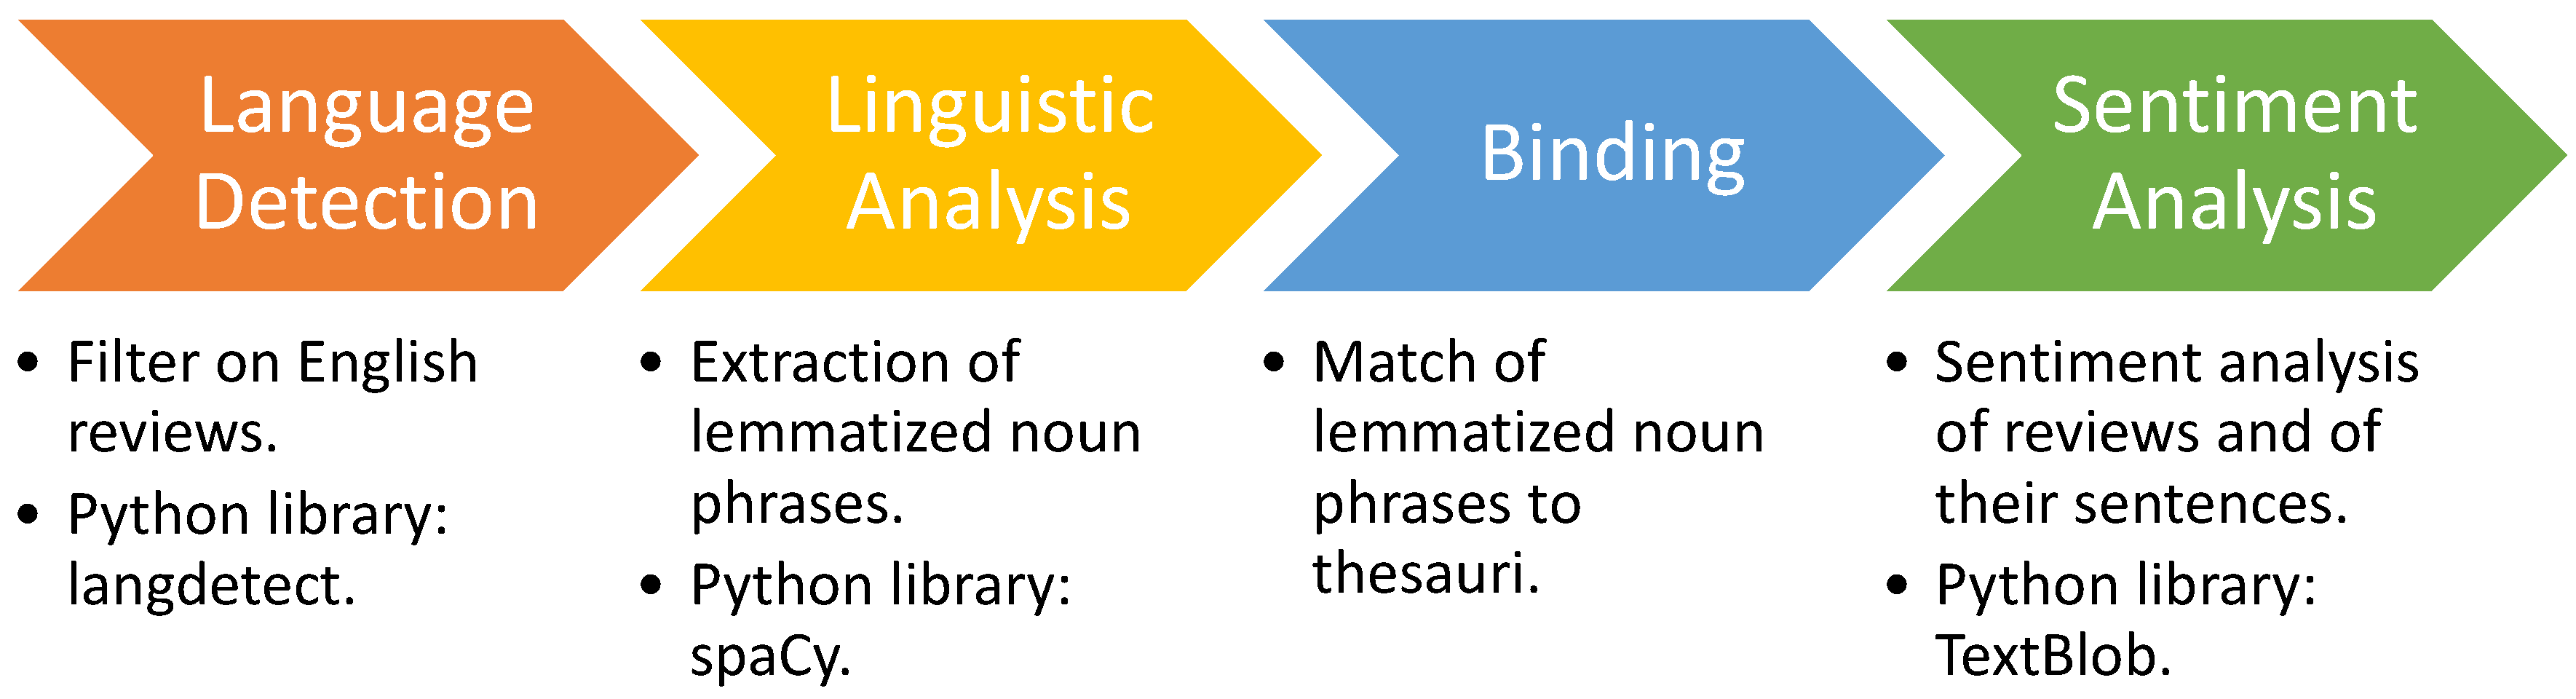
Given the thesauri storing the lemmatized keywords, each review is processed to identify the evaluation dimensions it addresses and the emerging sentiment. Figure 2 depicts the pipeline of activities concerning the analysis of an individual review. It can be noticed that, while items have to be dynamically evaluated on the basis of the selections made by the user (e.g., time frame), reviews can be analyzed as soon as they are posted online. We thus permanently store this type of information into a database for subsequent usage. Even though the review analysis pipeline is rather standard, the following sections describe it for completeness.
3.2.1. Language Detection
The language detection step is needed to select the linguistic resources to be applied for content analysis. We identify the language of a review r by using the Python langdetect library [88]; currently, we focus on the reviews written in English and we filter out the other ones.
3.2.2. Linguistic Analysis
In this step of the pipeline we extract and lemmatize the noun phrases occurring in r. Specifically, we group them by sentence to obtain a structured representation of r that supports its subsequent analysis: each sentence s contained in r is thus associated with a set of lemmatized noun phrases representing the noun phrases of s as lemmas. We carry out both noun phrase extraction and lemmatization using the spaCy Python library.
3.2.3. Binding Review Sentences to Evaluation Dimensions
In order to support the retrieval of reviews that are relevant to a specific evaluation dimension , and to summarize consumer satisfaction, the sentences of r have to be associated to the dimensions they deal with. For this purpose, we analyze each sentence s of r and we match its lemmatized noun phrases to the thesauri defined in Section 3.1. A sentence s matches a thesaurus if it contains at least one noun phrase that includes a lemmatized keyword of . Having identified the thesauri matched by s, we bind s and we index it under the corresponding dimensions for quick retrieval at information presentation time.
When this step of the pipeline is completed, each sentence s of r is associated to a list of lemmatized noun phrases and to a set of referred dimensions as shown in Listing 1.
Listing 1. Output of the review analysis pipeline.
review id: x;
satisfaction: y;
sentence1:
lemmatized noun phrases:lnp1, ⋯, lnpm;
referred dimensions:d1, ⋯, dk;
sat:x1;
sentence2:
noun phrases: ⋯;
referred dimensions: ⋯;
sat: ⋯;
sentence3:
⋯
3.2.4. Sentiment Analysis
The sentiment analysis step is aimed at identifying the positive, neutral, or negative polarity emerging from review text. Combined with the identification of the dimensions referenced by the sentences of the review r, this makes it possible to estimate r’s author evaluation of item . We perform this analysis at two granularity levels:
- Sentiment of the review: this is aimed at extracting the reviewer’s overall sentiment about i, balancing the possibly different opinions that emerge from the individual sentences included in r. For instance, the reviewer might be happy about certain aspects of item i and unhappy about other ones, conveying a neutral overall evaluation in r. We compute the sentiment of r as the polarity of its text by using the TextBlob Python library [89]. This library leverages the Pattern library [90] that takes into account the individual word scores from SentiWordNet [91] and uses heuristics for negation to compute the overall polarity of a text.
- Sentiment of sentences by evaluation dimension: this is aimed at extracting the sentiment of the reviewer concerning the considered evaluation dimension. For each sentence s of r, for each dimension addressed in s, the sentiment of s for d is computed as the polarity of s using the TextBlob library on the text of s.
As the polarity is defined in the [−1, 1] interval we normalize it to a level of satisfaction in [0, 100] in order to be presented as a percentage in the user interface of the information visualization system.
Listing 1 shows the output of the review analysis pipeline. Each review r is represented by means of a data structure reporting its identifier (id) and satisfaction level (satisfaction, denoted as in the following). As previously described, for each sentence s of the review, the data structure reports its lemmatized noun phrases, referred dimensions, and the satisfaction level of s (sat).
3.3. Item Evaluation
The INTEREST model enables the user to select a time frame and a set of evaluation dimensions that determine a set of relevant reviews to be considered. Given this set, our model aggregates review data to summarize consumer feedback about the item . Specifically, the level of satisfaction with i for each evaluation dimension (denoted as ) is computed as the mean satisfaction level of the sentences that are included in the reviews of and are indexed under d:
Our model also supports the generation of an overall satisfaction level about item i by computing the mean satisfaction of the reviews belonging to :
All satisfaction levels take values in [0, 100].
3.4. Data Visualization
Our model can present consumer feedback at different granularity levels to flexibly support the user in the assessment of item suitability. Specifically, given :
- The structured review representation generated by the review analysis pipeline makes it possible to generate dynamic charts that show the overall satisfaction level about i, as well as the satisfaction about specific evaluation dimensions in .
- The indexing of review sentences under specific dimensions of supports a direct and efficient access to the reviews that address the evaluation criteria selected by the user.
- The computation of the satisfaction level of individual reviews makes it possible to visually annotate them for fast interpretation.
- By exploiting the thesauri, the words of the reviews that make reference to the various evaluation dimensions can be identified and highlighted.
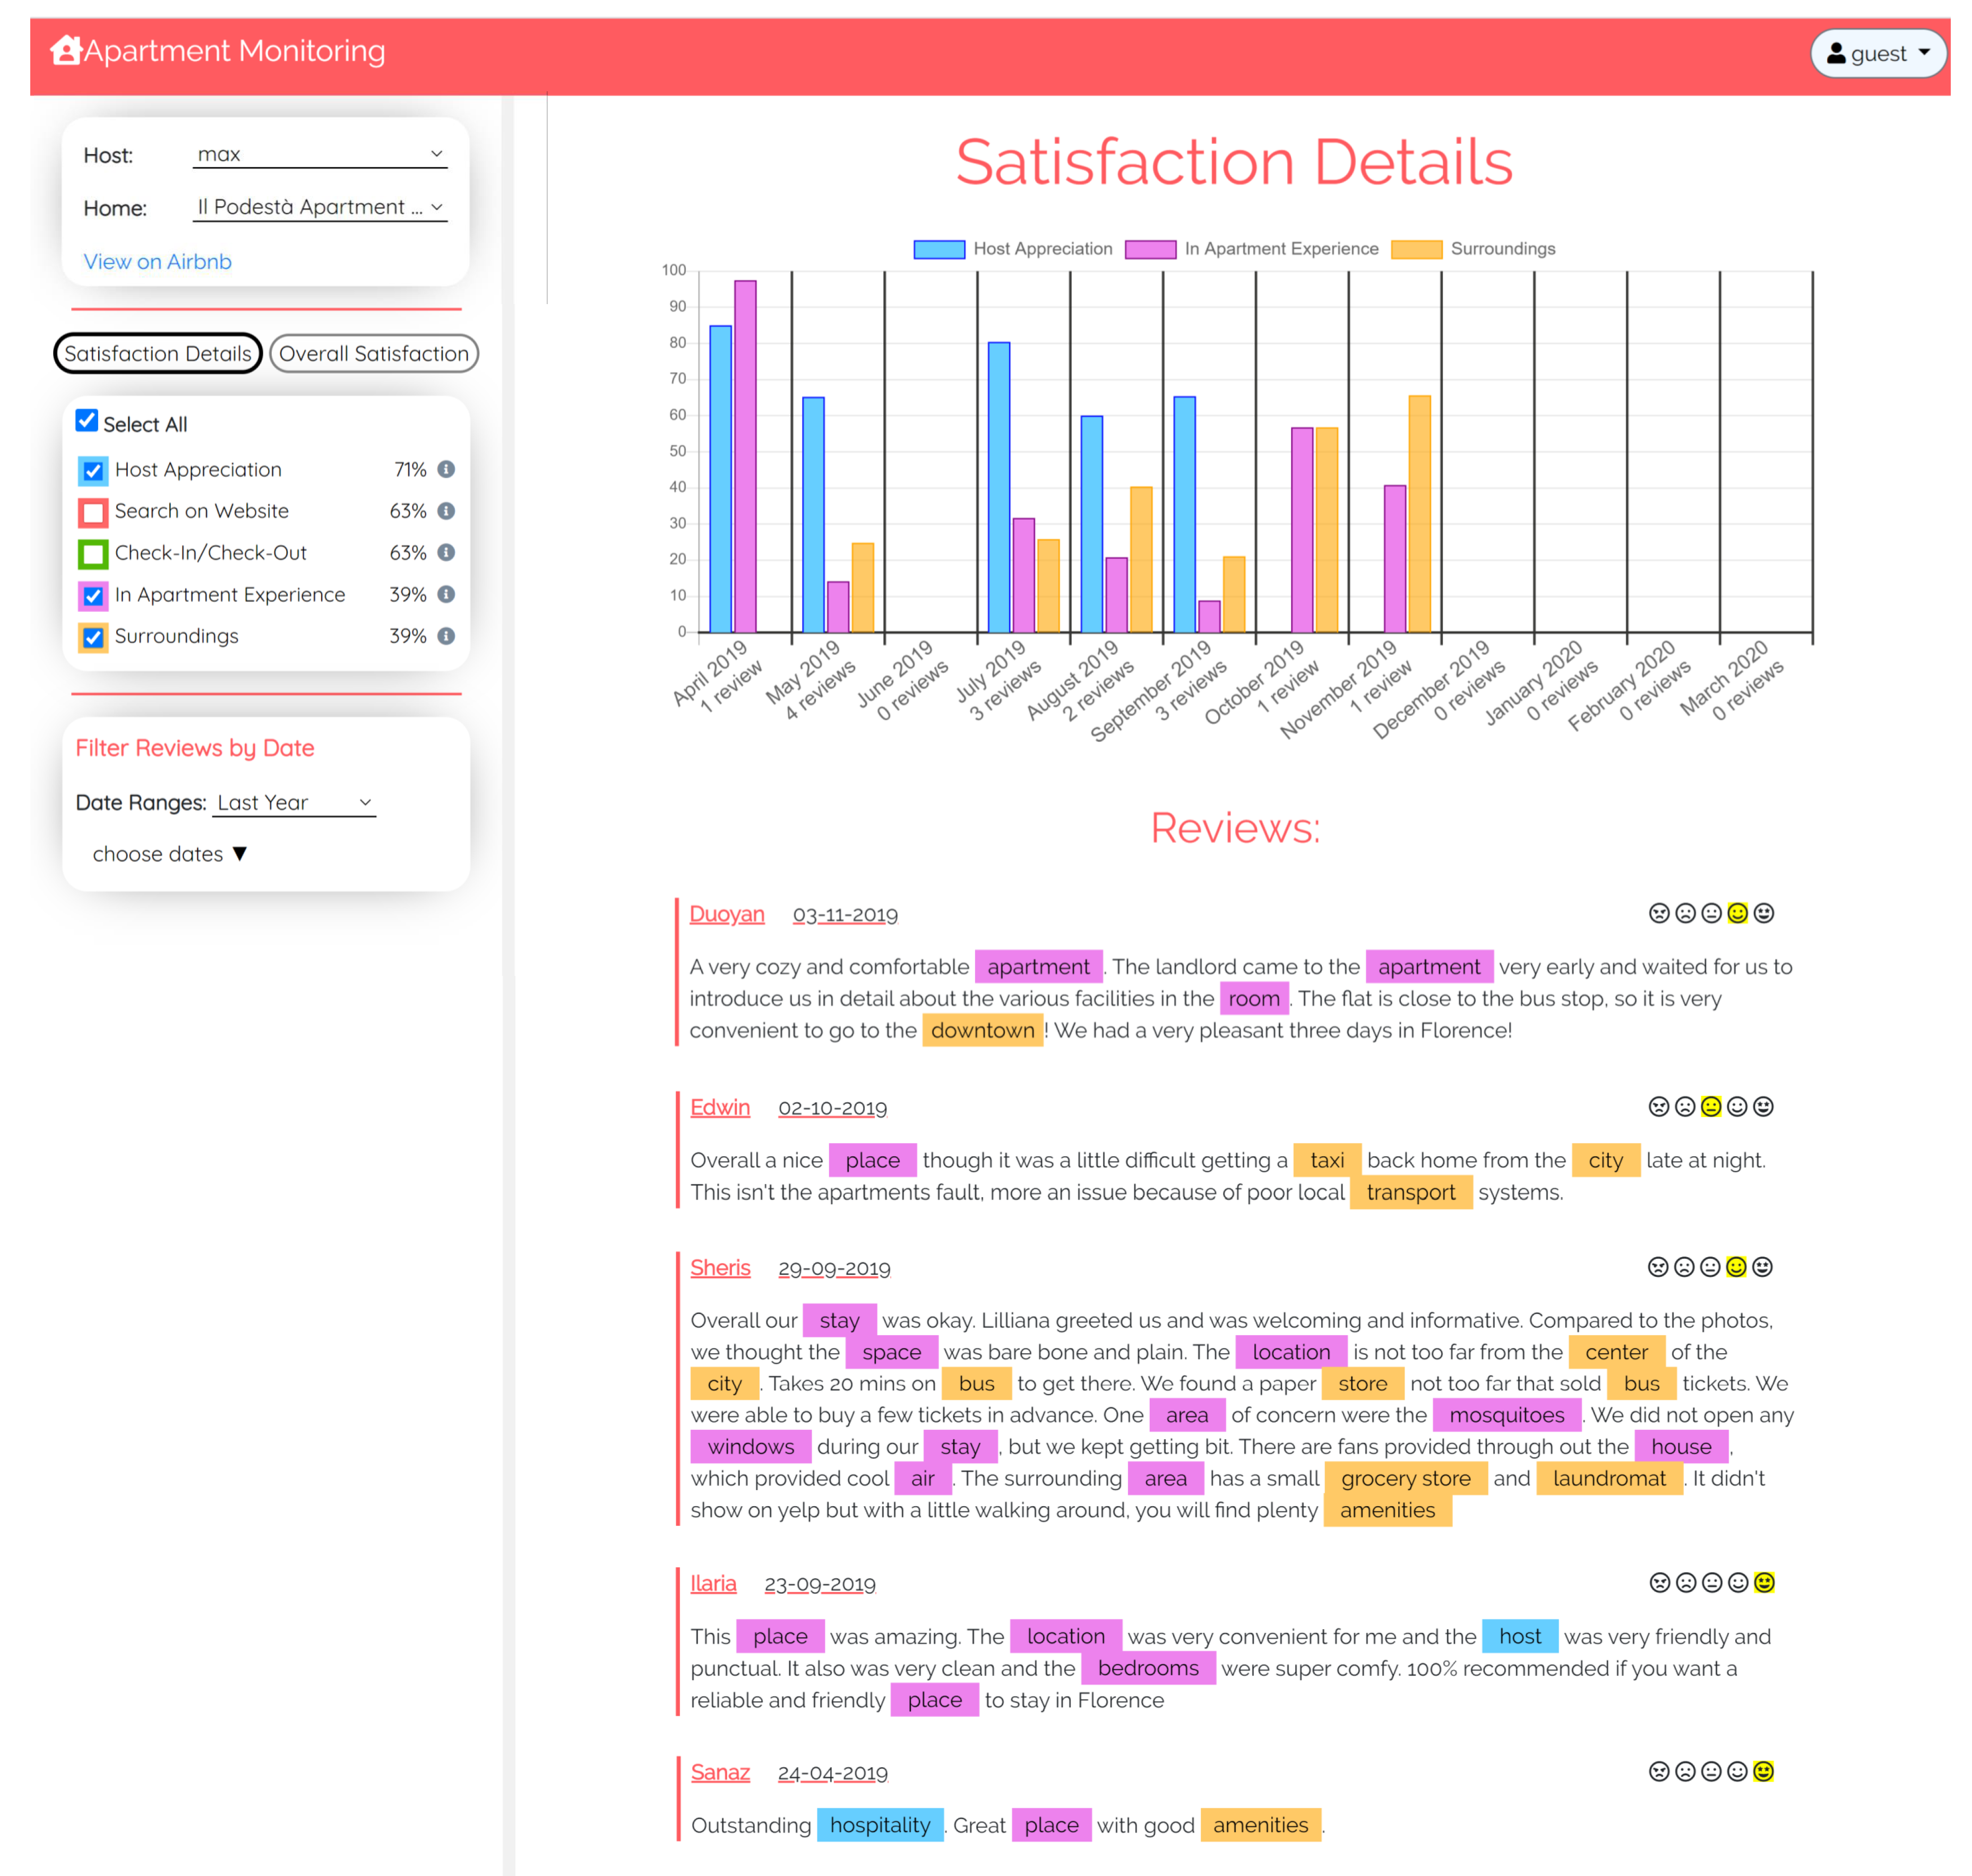
Figure 3 shows a portion of the user interface of the Apartment Monitoring application, which we use to simplify the presentation of the visual model we propose.
- The left panel is organized as follows.
- -
- At the top, there is the menu for selecting the item to be evaluated out of the list proposed to the user, and the link to view the home on the Airbnb web site.
- -
- At the bottom, a graphical widget supports the selection of the time frame of analysis.
- -
- In the middle, a component includes a checkbox for each evaluation dimension that the user can choose to explore the item. Each dimension is associated with the mean level of satisfaction derived from the whole set of reviews that belong to the selected time frame. For example, the visualized item has 71% level of satisfaction regarding the host appreciation.
- The right panel of the user interface shows the detailed information about the item:
- -
- A histogram visually represents evaluation dimensions by breaking the time frame selected by the user into sub-intervals to overview the temporal distribution of consumer satisfaction. Each bar of the histogram shows the level of satisfaction concerning the associated dimension within its own time interval. The exact level can be visualized by placing the mouse over the bar.
- -
- Below the chart there is the list of reviews used for the analysis. These reviews depend on the chosen time frame and on the dimensions selected using the checkboxes. The reviews posted in the same time interval which do not address those dimensions are not shown. In each review, a scale of smilies displays its satisfaction level; moreover, the words that correspond to the selected dimensions are highlighted using color coding.
The bars of the histogram are interactive: if the user clicks on any of them, the visualized set of reviews is refreshed to only include the relevant ones and the highlighted words are updated to maintain the consistency with her/his selections. Thus, the user can dynamically filter reviews, e.g., (s)he might investigate why the in-apartment experience received a low evaluation in May and in September 2019.
4. Validation Methodology
We validate our model on the home booking domain with particular reference to the information available in Airbnb [26], which is increasingly used by people to find homes for their holidays, as well as for working purposes, and thus provides consumer data referring to a rich spectrum of evaluation contexts. Similar to other services such as Booking [92], and as a measure to strengthen the robustness of the underlying Reputation Management System [93], Airbnb enables each consumer to upload at most one review for each renting contract after having left the apartment. This guarantees that online feedback is based on truly experienced services.
4.1. Dataset
The experiments are based on a portion of a large, public dataset of reviews collected in the city of Florence (IT) by the Airbnb home booking service (the dataset is periodically updated and can be downloaded from http://insideairbnb.com/get-the-data.html) [26]. The dataset stores information about hosts, homes (denoted as “listings”), and their neighborhood; moreover, it stores the textual feedback uploaded by visitors. The following information about reviews is provided.
- listing_id: numerical identifier of the home evaluated in the review.
- id: numerical identifier of the review.
- date: timestamp of the review.
- reviewer_id: numerical identifier of the author of the review.
- reviewer_name: name of the author of the review.
- comments: review text in Natural Language.
Even though the Airbnb website makes it possible to rate the homes in a 5-point Likert scale, the dataset does not report such ratings.
We omit the descriptive statistics of the whole dataset because for our study we focused on a small number of apartments, corresponding to a result list proposed to the user. Within this list, we asked participants to evaluate four specific homes, the same for all people, with the purpose of exposing users to the same amount of data to be analyzed, see Section 4.3. The selected homes have similar size and facilities to be comparable from the viewpoint of basic requirements; e.g., number of rooms. Moreover, each apartment has approximately 15 reviews and the overall amount of text from reviews presented during the evaluation of a home is approximately 50 lines.
4.2. Evaluation Dimensions for the Home Booking Domain
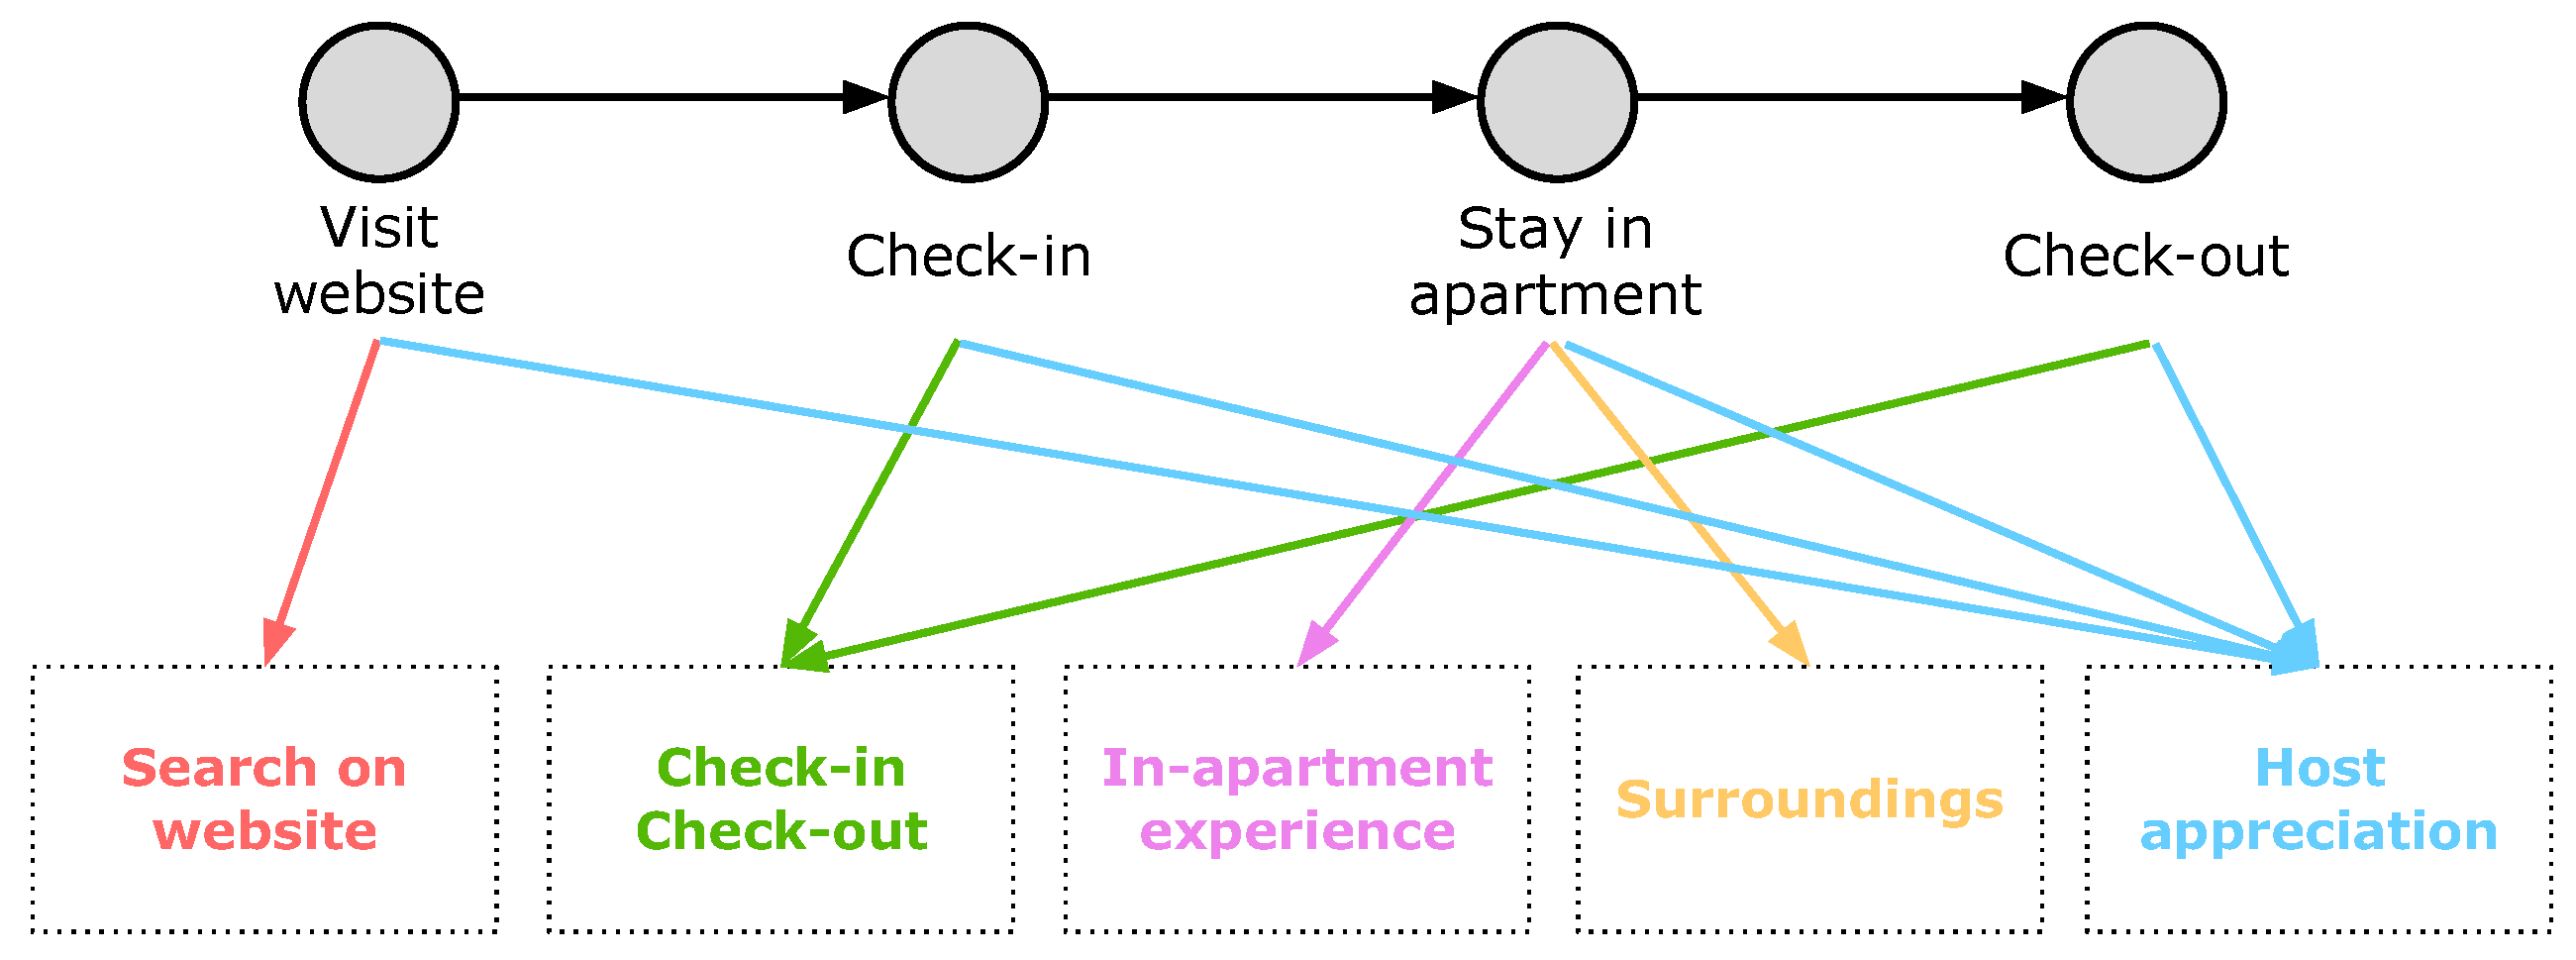
In order to identify the evaluation dimensions, we first designed a Service Journey Map (SJM) describing the home booking experience from the viewpoint of the guest. As in this work we focus on home renter experience, we only model the customer and apartment owner roles. Specifically, we ignore the actors involved in other service stages, such as the visit to the website.
With the first SJM we identified four service stages: Visit website, Check-in, Stay in apartment, and Check-out. We associated a separate evaluation dimension to each stage and we built the corresponding thesaurus by using previous studies that describe the topics addressed in the reviews collected by home booking services [27] or by similar ones, such as hotel booking ones [28,29]. However, after a first analysis we found out the following.
- Check-in and check-out are usually related in reviews and they are associated to the same keywords, which appear in both thesauri.
- Stay in apartment has a rather large number of keywords. Moreover, in their comments, reviewers frequently separate the aspects related to the apartment interiors (furniture, comfort, services) from those concerning its surroundings, e.g., geographic position, available public transportation, shops, and presence of noise.
- The interaction with the host and her/his properties represent a relevant evaluation dimension crossing all the service stages.
Consequently, we revised the original evaluation dimensions and we obtained those represented in Figure 4, i.e., Host appreciation, Search on website, Check-in/Check-out, In-apartment experience, and Surroundings. Table 2 shows a few sample keywords for each thesaurus and Table A1 in the Appendix A reports the full list. We remind the reader that these (lemmatized) keywords are used to index review sentences with respect to the corresponding evaluation dimensions and to highlight review words in the user interface of Apartment Monitoring.
4.3. Study Design
We conducted a user study using Apartment Monitoring to test the support of the INTEREST model to item evaluation. We assume that a previous filtering phase provides the user with a list of items that satisfy her/his basic requirements (e.g., arrival and leaving dates and number of guests), and that (s)he interacts with the system to overview the properties of the filtered items, leveraging online reviews to evaluate them. Therefore, starting from a list of results, the experiment investigates the level of support provided by our application to make an informed item selection decision.
As discussed in Section 2, existing information exploration and recommender systems focus on rather specific item features and aspects, or they attempt to explain the recommendation paradigm applied to generate the results. Therefore, they cannot provide the user with a holistic, service-oriented presentation of items, which is a main objective of our work. Moreover, the systems generating item overviews have rather complex user interfaces that can overload users. We thus decided to compare our approach to models that leverage review data to provide a direct impression of what consumers think about items. In our case, it was natural to consider home booking services, and Airbnb in particular. We thus analyzed the following.
- The INTEREST model in its Apartment Monitoring implementation. This model empowers the user to evaluate items by means of (i) interactive charts that summarize consumer feedback, (ii) visual annotations of reviews that highlight (in synch with the charts) the evaluation dimensions of the experience, and (iii) a temporal selection of reviews.
- A Baseline model that shows the textual reviews as in most booking and e-commerce platforms. To build a strong baseline, we included in this model the date picker supporting the selection of the time frame of interest for the selection of the reviews to be inspected.
We asked each participant of the study to imagine that (s)he had to plan a holiday in the city of Florence and to select an apartment for renting. We explained that, using the two systems, (s)he should have analyzed the properties of the host, home, etc., based on the task to be solved, in order to select the apartment that (s)he would have liked to rent.
We aimed at separately evaluating INTEREST and Baseline but we wanted to minimize the learning effect on participants. Therefore, we formed the result list by selecting four homes that were comparable from the viewpoint of a search query, and which also had a similar amount of consumer feedback in terms of lines of text. We investigated User Experience (UX) with the applications in two learning tasks, each one using a different apartment:
- Task1: question answering using the functions provided by INTEREST, i.e., interactive charts, temporal and dimension-dependent review selection, and word highlighting.
- Task2: question answering using the basic list of reviews (Baseline) with temporal filter.
The study was a within-subjects design one. We considered each treatment condition as an independent variable and every participant received the two treatments. We counterbalanced the order of tasks to minimize the impact of result biases and the effects of practice and fatigue. People joined the user study on a voluntary basis, without any compensation, and they gave their informed consent to participate in the study. The consent form described the research purposes, procedure, duration, confidentiality of data, sharing of results, right to refuse or withdraw, and contact persons. The user study took place live, in video calls with shared screen due to COVID-19 pandemic, i.e., we did not use any platform such as Amazon Mechanical Turk or similar to recruit participants or to manage the tasks of the study.
4.4. The Experiment
One person at a time participated in the study, which lasted approximately 30 min. We did not impose any time restrictions in solving the tasks and we allowed her/him to take as much time as (s)he needed in order to comply with diverse backgrounds and levels of confidence with technology. Then, we asked her/him to answer a pre-test questionnaire designed to assess demographic information, cultural background, and familiarity with booking and e-commerce platforms.
For each task of the study the participant used either the Apartment Monitoring implementation of INTEREST, or the Baseline application, in the context of the organization of a holiday in Florence: within the task, we asked her/him to look at the proposed homes and to answer two questions that required either scoring (thumb up or down) an evaluation dimension of an apartment, or identifying the content corresponding to the dimension within the available reviews. For each home, all participants answered the same questions, which were based on the following templates.
- Give a thumb up/thumb down evaluation of of provided by in .For instance, “Give a thumb up/thumb down evaluation of the surroundings of Toscanella apartment provided by host Francesco during the last year”.
- List the characteristics of of provided by in .For example, “List the characteristics of the host of Il Podestà apartment provided by host Max during the last six months.”
While the participant carried out a task, the experimenter took notes about her/his voice comments using the think aloud protocol [94]; we did not put any time restrictions on question answering. For the study we focused on User Experience (UX).
- After the completion of each task, the participant filled in a post-task questionnaire to evaluate the model (s)he had used. We selected the Italian version of the UEQ questionnaire [95] that supports a quick assessment of a comprehensive impression of user experience covering perceived ergonomic quality, perceived hedonic quality, and perceived attractiveness of a software product. However, as UEQ does not cover user awareness and control, we extended it with three items aimed at investigating these aspects. For this purpose we took inspiration from the ResQue questionnaire for recommender systems [96].Participants answered each item of our questionnaire by selecting a rating in a 7-point Likert scale. In UEQ, questions are proposed as bipolar items, e.g., [annoying 1 2 3 4 5 6 7 enjoyable]. Moreover, in order to check user attention, half of the items start with the positive term (e.g., “good” versus “bad”) while the other ones start with the negative term (e.g., “annoying” versus “enjoyable”) in randomized order. In order to support a uniform measurement of scales in the analysis of results, the ratings provided by users are mapped from −3 (fully agree with the negative term) to +3 (fully agree with the positive one). Questions correspond to individual UX aspects and belong to six UEQ factors that describe broader user experience aspects (“Attractiveness”, “Perspicuity”, “Novelty”, “Stimulation”, “Dependability”, and “Efficiency”), plus the “user awareness and control” that we added. Table 3 shows the set of bipolar items of our questionnaire, grouped by factor, and displays the items we added in italics; for the specific ordering of questions see Figure 5.
- After the completion of the tasks the participant filled in a post-test questionnaire aimed at capturing her/his overall experience and at comparing Apartment Monitoring to Baseline. In this case, (s)he had to select the model that best matched the questions reported in Table 4. These questions include an open one (Notes) to provide feedback for improving Apartment Monitoring.
5. Results
5.1. Demographic Data and Background of Participants
For the user study we recruited 38 participants (44.74% women; 55.26% men). Their age is between 18 to 54 years, with a mean value of 30.29. They are part of the university staff (researchers and professors) and students, as well as people working in the industry. In the pre-test questionnaire, we analyzed their background and familiarity with technology: 55.26% of participants have a scientific background, 13.16% a technical one, 26.32% humanities and linguistics, and 5.26% economics and law. Regarding the education level, 39.47% attended the high school, 44.74% university, 13.16% have a Ph.D, and 2.63% attended middle school. Regarding familiarity with technology, 39.47% of participants qualified themselves as experts in using technology, 42.11% as intermediate, and 18.42% as beginners. Moreover, 47.37% of people declared that they use e-commerce platforms or online booking services monthly, 28.95% about twice a year, 15.79% weekly, and 7.89% daily.
5.2. User Experience: Post-Task Questionnaire Results
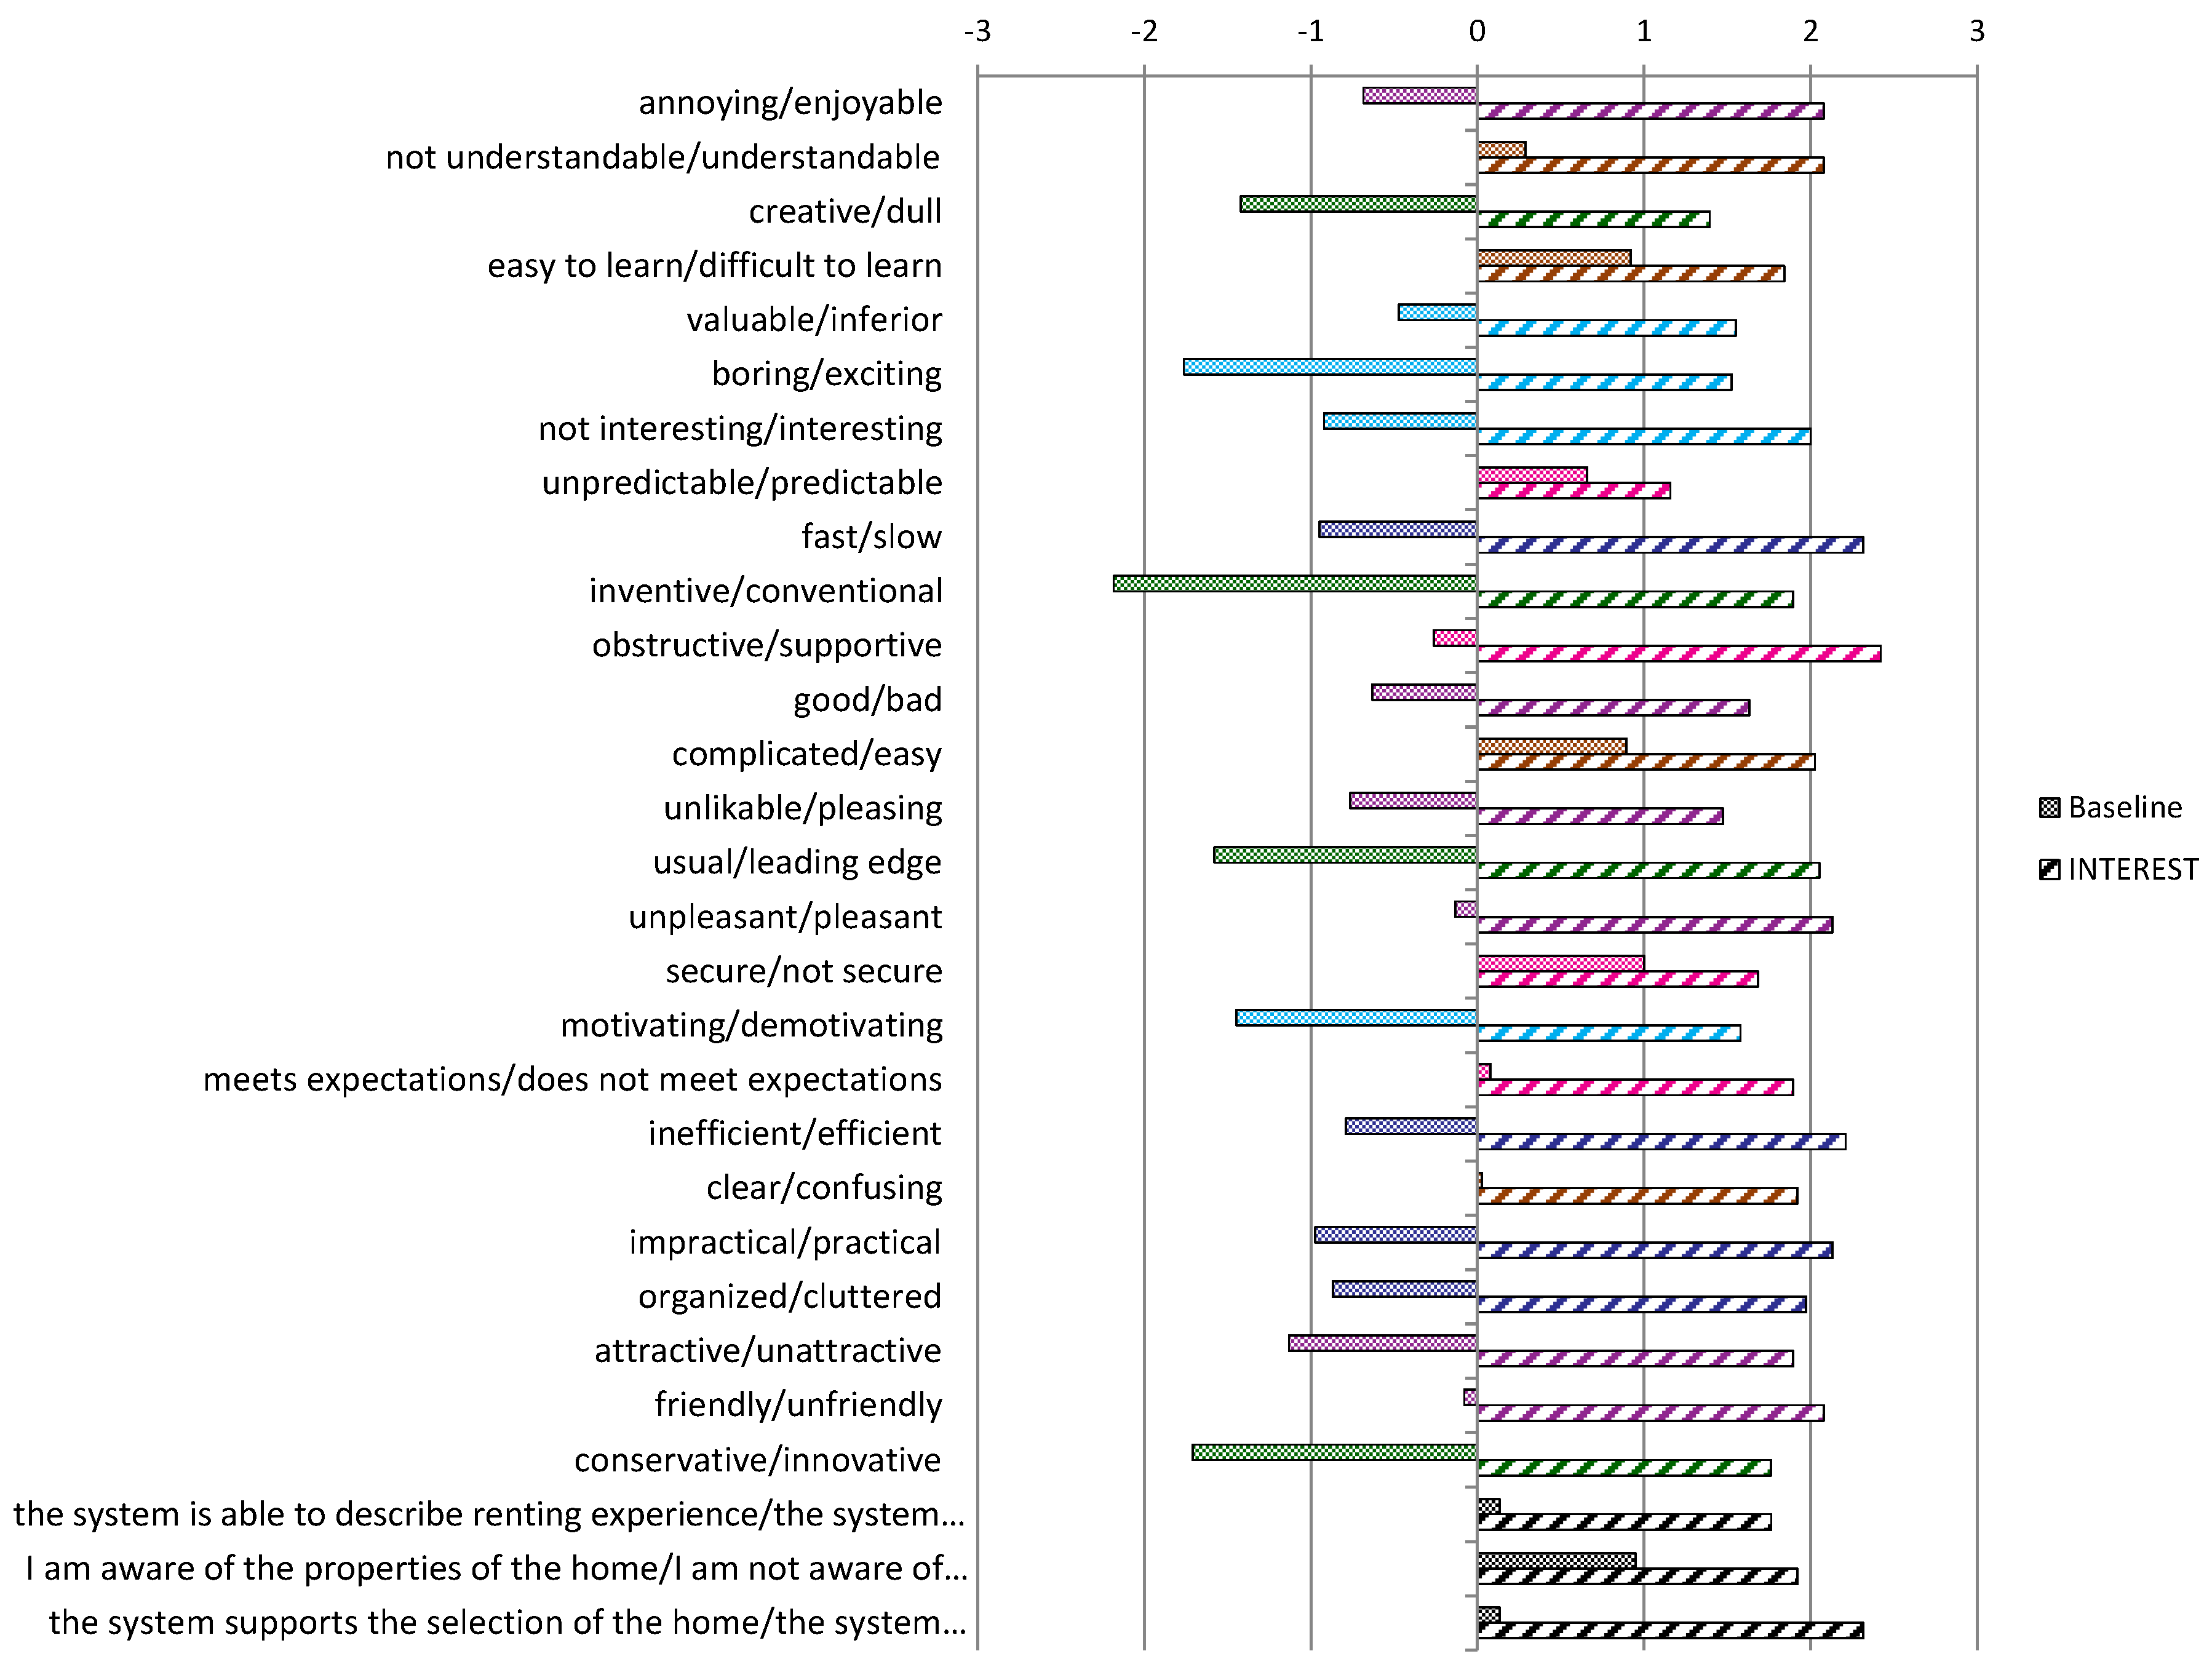
Figure 5 shows the evaluation results concerning user experience with Baseline and the INTEREST model underlying Apartment Monitoring. The figure provides detailed results for each item of the post-task questionnaire. As these aspects are measured in the [−3, 3] scale, we consider as positive the values ≥0.8 and negative those lower than −0.8; the other ones are neutral.
- The Baseline model received some positive values related to the following factors. Perspicuity (easy to learn/easy), Dependability (secure), and Awareness and control (awareness of the properties of the home). However, it definitely has negative values concerning Novelty (dull, conventional, usual, conservative) and Stimulation (boring, not interesting, motivating). Furthermore, it has moderately negative values of Efficiency (slow, impractical, cluttered) and Attractiveness (unattractive); the other user awareness aspects are neutral. Table A2 in the Appendix A shows detailed numeric values.
- INTEREST, in its Apartment Monitoring implementation, received positive values in all UX aspects, with a slightly weaker evaluation of Dependability (predictable) with respect to the other values, see Table A3 in the Appendix A for details.
Notice that, even in the cases in which Baseline received a neutral or positive evaluation, the difference between its value and the one obtained by INTEREST is large and our model achieves the best results.
Table 5 shows the aggregated values obtained by averaging participants’ answers by UX factor (Attractiveness, etc.). These results are particularly interesting because they describe the overall perception of ergonomic and hedonic qualities, attractiveness, and awareness and control, which are the main UX evaluation factors we consider. In the table, colored arrows help data interpretation: → denotes a neutral value, ↓ a negative one, and ↑ a positive one. We compared these results by means of a paired T-Test and the differences are significant (). From these results, it can be seen that Baseline was unsatisfactory as far as Efficiency, Stimulation, and Novelty are concerned, while it received neutral evaluations in the other factors. Differently, INTEREST obtained positive values in all UX factors, showing its superiority. Specifically, our model excelled in participants’ perception of its Efficiency, Perspicuity, and Awareness and control, all of which got values very near to 2 o higher than that. The lowest value concerns Stimulation, which is well above 1.6, i.e., positive.
In order to provide a more analytic view of participants’ experience with the two systems we converted the UX results presented in Table 5 to the [0, 100] scale and we computed the relative difference between the obtained values. The third column of Table 6 shows these differences. It can be seen that INTEREST obtained dramatically higher results in what concerns Attractiveness, Efficiency, Stimulation, and Novelty, where it outperformed Baseline by more than 100%. Moreover, it outperformed Baseline in Perspicuity, Dependability, and Awareness and control by approximately 40–45%. While all such results are positive, those concerning Efficiency (+145%) show that participants perceived the user interface of Apartment Monitoring as much more supportive to information search than the Baseline one. Moreover, we are interested in the results concerning Dependability (+42.19%) and Awareness and control (+46.89%), which tell us that, with respect to a direct analysis of reviews, the mediation offered by the interactive charts and the evaluation dimensions employed in the INTEREST model highly improve user experience.
5.3. User Experience: Post-Test Questionnaire Results
The results of the post-test questionnaire (whose questions are reported in Table 4) are consistent with those of the post-task ones. Participants agreed that Apartment Monitoring made them save effort when they were solving the tasks of the experiment; moreover, they were more satisfied with this application than with the Baseline one. A large proportion (81.58%) of people said that Apartment Monitoring was easy to use, but some users agreed that a certain initial effort is needed to learn its functionalities. Almost all (97.37%) of the study participants stated that they would recommend our application to a friend and 100% said that they would use it again in the future to explore and analyze homes for renting.
In the open comments participants declared that keywords highlighting in reviews supports readability and that it helps in quickly finding the information related to evaluation dimensions in the visualized list of reviews. However, some people said that the initial impact with several colors creates a bit of confusion.
5.4. Observed Participants’ Behavior and Collected Feedback
During the experiment, participants were asked to use the think aloud protocol [94]; thus, we were able to collect their comments, feedback, and suggestions about the systems they used.
Concerning the Baseline application, people observed that the list of reviews often includes too much text and this makes users skip some comments or only read the shortest ones. Moreover, it is difficult to overview the reviews and to find the needed information. In general, the Baseline application made users feel overloaded and confused, which is in line with the results obtained in the post-task and post-test questionnaires.
Regarding the Apartment Monitoring implementation of our INTEREST model, participants perceived some initial learning effort to get acquainted with the tools offered by its user interface. However they said that, after having been familiarized with it, the system is more useful and efficient in finding information than the Baseline one. We noticed that some users looked at the reviews corresponding to the bars of the histogram with the lowest satisfaction levels in order to go in-depth with the analysis of the poorest aspects of evaluation of the apartments. Moreover, some users first analyzed the histogram to check the general trend of the evaluation dimensions along time; then, in a second step, they read the reviews to gather more precise information about the home. Conversely, some users directly read the information corresponding to the highlighted keywords in the reviews, overlooking the chart. The latter behavior can be explained by the fact that people are more familiar with the list of reviews that is typical in booking and e-commerce platforms, than with diagrams.
Participants also gave some suggestions for future work. Specifically, they said that it would be useful to have a summary of the home reporting, e.g., the total number of reviews and its overall rating. In this way, users would be able to filter out the apartments that are below their own standards; for instance, users said that if a home had few reviews or a bad evaluation, they would not consider it at all. People also suggested a function to filter reviews by keyword in order to quickly find the comments dealing with specific topics. Finally, some participants felt confused about the initial impact of the set of colors used to highlight the words in the reviews. They suggested to have this functionality on demand, which is particularly interesting because it supports the idea of adapting explanations and visualization to individual needs, proposed in works such as [25].
6. Discussion
The positive results of the user study show that the INTEREST visualization model underlying Apartment Monitoring efficaciously supports the selection of items within a set of search results by empowering users to analyze item properties from a service-oriented perspective. Our model supports the presentation of item data by means of a user interface which the participants of the study considered as attractive, novel, stimulating, perspicuous, and dependable. From the viewpoint of user awareness and control, participants confirmed that the system was able to describe the experience to be expected from the homes, that they were aware of the properties of the homes, and that the system supported them in their selection. Thus, people felt in control during information exploration and decision-making. We believe that participants’ perception of the Apartment Monitoring application strongly depended on two key elements: first, users were empowered to directly access the reviews dealing with the evaluation dimensions they were interested in; second, data interpretation was supported by the graphical visualization of dimension values and of relevant keywords from the reviews. In fact, the focus on specific evaluation dimensions and the direct access to reviews, which are graphically annotated to highlight their cues, support the overview of the available items and a quick acquisition of a first-hand opinion about them. The high perception of the system efficiency in the post-task questionnaires and the observations of people’s behavior during the experiment (either using histograms first and then focusing on the selected reviews, or directly exploiting keyword highlights in the reviews to search for relevant information) support our hypothesis.
The lesson we take is that, while automated evaluation techniques (e.g., those developed in the recommender systems research) are crucial to select plausibly likable items for the individual user out of the plethora of available ones, her/his trust in these techniques can be enhanced by supporting a quick access and a deep inspection of explicit human judgments describing previous consumers’ experience. This function enables the user to build her/his own personal opinion by focusing on the evaluation criteria (s)he is most interested in and by finding direct evidence of them in the reviews, with the help of the system. In this perspective, it is however important to develop an item evaluation model that mirrors as closely as possible the experience dimensions that consumers care about. In this respect, service design models such as the Service Journey Maps we used are key building blocks to be applied. We believe that the human perspective on item evaluation is a primary element of trust in the system suggestions because it reduces the mediation role of numerical ratings and it brings the user closer to the experience of the people who previously chose the same items, without using any other proxies to represent their judgments. This leads to promoting a coupled development of enhanced information filtering models and interactive information visualization ones complementing each other for a better user acceptance of both.
Even though the results of our study are very encouraging, they might be affected by limitations that we aim at addressing in our future work. First, the number of users involved in the experiment is limited and we plan to extend it by recruiting a greater number of more differentiated people. In this respect, we value the live contact with participants; thus, we will continue with one-to-one interactions, even though this is time-consuming, and we will not use any automated crowdsourcing platforms to recruit and manage users. Second, we tested our model within a single application domain, i.e., home booking; in our future work we will instantiate INTEREST in a different domain, e.g., Amazon products sales, and we will carry out a new user study to evaluate our model in that scenario. Another limitation of our work is the fact that we implemented the INTEREST model by means of a single version of the user interface, i.e., the one based on histograms. Other types of charts might be evaluated to check their impact on user experience; e.g., radars, value charts, and so forth. Moreover, other presentation models, e.g., focused on item properties instead of service-oriented evaluation dimensions, might be developed to compare our approach to feature-based ones (see, e.g., in [25]), with the aim of understanding whether people prefer to visualize high-level item properties, specific aspects, or a combination of the two in a more articulated user interface.
In our future work we will enrich INTEREST with functions suggested by the participants of the user study, e.g., the search by keywords within consumer reviews and the summary of the home properties. Moreover, we will extend our model to capture service characteristics in a finer-grained way and from the perspective of multiple stakeholders. Conceptual models and tools for service design take a holistic view of services [23] to represent the variety of entities involved in the related domains. As discussed by Jacobucci and Calder, “in more complex consumer experience [...] there may be literally hundreds of small elements of experience the consumer notices” [97]. The aim of the Service Journey Maps is to model those features that compose the value delivered to and perceived by consumers in order to improve services and businesses to meet the needs of their users. While in the present work we used the SJMs to enhance decision-making in item selection, the same approach can be used to support the service provider in the analysis of consumer feedback at different temporal and content granularities. This kind of information can point to providers parts of the service/business that consumers perceive as bad or good; in turn, it helps improve the organization output in line with customer needs. For this purpose we plan to extend INTEREST to the service provider perspective by using Service Blueprints [98], a richer model than SJM. Service Blueprints go several steps deeper in service description by combining the customer’s experience with all employee actions, support processes, and physical resources that may or may not be visible to her/him.
7. Conclusions
We described the INTERactivE viSualizaTion (INTEREST) information presentation model, which supports the exploration of item properties from a holistic, service-oriented point of view. This model is based on the intuition that, when choosing an item out of a list of results, the user should be aware of its properties by considering the overall service to be used (from item selection to delivery and after sales assistance), as well as previous consumers feedback. INTEREST is based on the Service Journey Maps for the design and description of user experience with services. These maps support the identification of high-level evaluation dimensions that are used in our model to provide a visual summary of item properties, tightly connected to the item reviews used to evaluate the items. We designed INTEREST as an agnostic information model that ignores the algorithm applied to generate the search results; as such, it can be connected to any information filtering system to present its results in a transparent way. We applied INTEREST to the home booking domain by developing the Apartment Monitoring application that supports the overview and analysis of online reviews about rented homes. A user study involving 38 participants has shown that this application outperforms a temporal presentation of consumer feedback in user experience, user awareness, and user control. This encourages the exploitation of our model to present search results provided by information filtering systems.
Author Contributions
Conceptualization, L.A., S.C. and N.M.; methodology, N.M., L.A. and S.C.; software, R.G.; validation, S.C., N.M. and R.G.; formal analysis, N.M.; investigation, L.A. and N.M.; resources, L.A.; data curation, N.M.; writing—original draft preparation, L.A., N.M. and S.C.; visualization, N.M.; supervision, L.A.; project administration, L.A.; funding acquisition, L.A. All authors have read and agreed to the published version of the manuscript.
Funding
This research was funded by the University of Torino grant number ARDL_AUTOFIN_12_01.
Acknowledgments
We are grateful to Gianmarco Izzi for having helped us deploy the Apartment Monitoring application.
Conflicts of Interest
The authors declare no conflict of interest. The funders had no role in the design of the study; in the collection, analyses, or interpretation of data; in the writing of the manuscript; or in the decision to publish the results.
Appendix A

Table A1.
Evaluation dimensions and keywords for the home booking domain.
| Evaluation Dimension | Keywords |
|---|---|
| Host appreciation | host, owner, renter, interaction, people, relation, hospitality, manner, language, communication |
| Search on website | search, reservation, booking, arrangement, agreement, deal, line, sign, message, channel, mail, voice, information, info, stuff, example, program, website |
| Check-in/Check-out | entrance, arrival, entry, suggestion, term, conversation, understanding, welcome, regard, key, english, reception, check-in, check-out, query, wait, money, checkin, checkout, hour, check, help, direction, instruction, advice, luggage, access, bag, wheelchair, mobility, baggage, departure, time, delay, document, identification, code |
| In-apartment experience | visit, family, experience, dog, cat, animal, parking, room, space, night, morning, view, living, bed, bedroom, water, door, bathroom, bath, garden, floor, stair, shower, clean, step, call, kitchen, interior, exterior, decoration, amenity, amenity, wi-fi, wifi, shower, maintenance, cleaning, fixture, repair, support, sheet, cover, blanket, cookware, cooker, kettle, pot, air, conditioning, conditioner, lighting, fridge, home, appliances, washer, refrigerator, dishwasher, freezer, tv, pc, computer, laptop, meal, dish, tea, breakfast, dinner, snack, launch, smoking, smoke, air, breeze, gas, temperature, heat, smell, light, sun, sight, atmosphere, ambiance, sunlight, sunshine, ray, furniture, relax, safety, security, law, guard, lock, box, pool, balcony, cleanliness, material, phone, stay, cook, experience, party, meal, terrace, accommodation, porch, supply, fragrance, courtyard, beverage, snack, treat, speaker, towel, platter, air, stove, furnishing, bedspread, table, equipment, bunkbed, pleasure, size, area, coffee, insect, mosquito, ceiling, dryer, breakfast, library, bird, television, privacy, toiletry, guest, lack, terrasse, hallway, facility, house, accessibility, location, apartment, apt, place, home, block, suite, hostel, rooms, flat, construction, penthouse, base, view, architecture, garden, yard, backyard, grove, field, playground, design, decor, layout, order, color, style, paint, space, internet, mattress, window, curtain, heater, lamp, soap, shampoo |
| Surroundings | noise, music, sound, voice, disturbance, bell, quietness, city, beach, transport, airport, café, restaurant, walking, nearby, food, shops, bus, station, ferry, street, surrounding, attraction, crowd, town, cab, neighborhood, park, culture, walk, bakery, outskirt, transportation, downtown, center, ride, zone, trip, square, road, taxi, sunset, shop, store, museum, weather, eatery, traffic, distance, sport, gym, swimming pool, silence, mountain, lake, river, crops, sea, seaside, beach, shopping, neighbour, neighbor, neighbourhood, street, park, playground, pub, disco, club |
Table A2.
Post-task questionnaire results for the Baseline information presentation model. The first column shows the order of the questions posed to participants; the second one shows the mean rating they gave: → denotes a neutral value, ↓ a negative one and ↑ a positive one. The third and fourth colums report variance and standard deviation of ratings. The Aspect column shows the UX aspect associated to the question and the last column recaps the Factor to which the aspect belongs.
| Question | Mean | Variance | Standard Deviation | Aspect | Factor |
|---|---|---|---|---|---|
| 1 | → −0.684 | 2.817 | 1.678 | annoying/enjoyable | Attractiveness |
| 2 | → −0.289 | 2.752 | 1.659 | not understandable/understandable | Perspicuity |
| 3 | ↓ −1.421 | 3.331 | 1.825 | creative/dull | Novelty |
| 4 | ↑ −0.921 | 3.102 | 1.761 | easy to learn/difficult to learn | Perspicuity |
| 5 | → −0.474 | 2.959 | 1.720 | valuable/inferior | Stimulation |
| 6 | ↓ −1.763 | 1.537 | 1.240 | boring/exciting | Stimulation |
| 7 | ↓ −0.921 | 2.291 | 1.514 | not interesting/interesting | Stimulation |
| 8 | → −0.658 | 3.528 | 1.878 | unpredictable/predictable | Dependability |
| 9 | ↓ −0.947 | 4.376 | 2.092 | fast/slow | Efficiency |
| 10 | ↓ −2.184 | 1.127 | 1.062 | inventive/conventional | Novelty |
| 11 | → −0.263 | 2.794 | 1.671 | obstructive/supportive | Dependability |
| 12 | → −0.632 | 1.969 | 1.403 | good/bad | Attractiveness |
| 13 | ↑ −0.895 | 3.935 | 1.984 | complicated/easy | Perspicuity |
| 14 | → −0.763 | 1.213 | 1.101 | unlikable/pleasing | Attractiveness |
| 15 | ↓ −1.579 | 2.413 | 1.553 | usual/leading edge | Novelty |
| 16 | → −0.132 | 1.577 | 1.256 | unpleasant/pleasant | Attractiveness |
| 17 | ↑ −1.000 | 1.946 | 1.395 | secure/not secure | Dependability |
| 18 | ↓ −1.447 | 1.767 | 1.329 | motivating/demotivating | Stimulation |
| 19 | → −0.079 | 2.345 | 1.531 | meets expectations/does not meet expectations | Dependability |
| 20 | → −0.789 | 2.657 | 1.630 | inefficient/efficient | Efficiency |
| 21 | → −0.026 | 3.053 | 1.747 | clear/confusing | Perspicuity |
| 22 | ↓ −0.974 | 3.270 | 1.808 | impractical/practical | Efficiency |
| 23 | ↓ −0.868 | 3.739 | 1.934 | organized/cluttered | Efficiency |
| 24 | ↓ −1.132 | 2.117 | 1.455 | attractive/unattractive | Attractiveness |
| 25 | → −0.079 | 2.129 | 1.459 | friendly/unfriendly | Attractiveness |
| 26 | ↓ −1.711 | 1.454 | 1.206 | conservative/innovative | Novelty |
| 27 | → −0.132 | 2.820 | 1.679 | the system is able to describe renting experience/ the system is unable to describe renting experience | Awareness and control |
| 28 | ↑ −0.947 | 3.024 | 1.739 | I am aware of the properties of the home/ I am not aware of the properties of the home | Awareness and control |
| 29 | → −0.132 | 3.036 | 1.742 | the system supports the selection of the home/ the system does not support the selection of the home | Awareness and control |
Table A3.
Post-task questionnaire results for Apartment Monitoring; we use the same notation as in Table A2.
Table A3.
Post-task questionnaire results for Apartment Monitoring; we use the same notation as in Table A2.
| Question | Mean | Variance | Standard Deviation | Aspect | Factor |
|---|---|---|---|---|---|
| 1 | ↑ 2.079 | 0.669 | 0.818 | annoying/enjoyable | Attractiveness |
| 2 | ↑ 2.079 | 0.561 | 0.749 | not understandable/understandable | Perspicuity |
| 3 | ↑ 1.395 | 2.516 | 1.586 | creative/dull | Novelty |
| 4 | ↑ 1.842 | 2.299 | 1.516 | easy to learn/difficult to learn | Perspicuity |
| 5 | ↑ 1.553 | 1.497 | 1.224 | valuable/inferior | Stimulation |
| 6 | ↑ 1.526 | 1.391 | 1.179 | boring/exciting | Stimulation |
| 7 | ↑ 2.000 | 0.703 | 0.838 | not interesting/interesting | Stimulation |
| 8 | ↑ 1.158 | 2.083 | 1.443 | unpredictable/predictable | Dependability |
| 9 | ↑ 2.316 | 0.817 | 0.904 | fast/slow | Efficiency |
| 10 | ↑ 1.895 | 1.178 | 1.085 | inventive/conventional | Novelty |
| 11 | ↑ 2.421 | 0.358 | 0.599 | obstructive/supportive | Dependability |
| 12 | ↑ 1.632 | 1.320 | 1.149 | good/bad | Attractiveness |
| 13 | ↑ 2.026 | 1.161 | 1.078 | complicated/easy | Perspicuity |
| 14 | ↑ 1.474 | 1.499 | 1.224 | unlikable/pleasing | Attractiveness |
| 15 | ↑ 2.053 | 0.754 | 0.868 | usual/leading edge | Novelty |
| 16 | ↑ 2.132 | 0.712 | 0.844 | unpleasant/pleasant | Attractiveness |
| 17 | ↑ 1.684 | 1.519 | 1.233 | secure/not secure | Dependability |
| 18 | ↑ 1.579 | 1.494 | 1.222 | motivating/demotivating | Stimulation |
| 19 | ↑ 1.895 | 1.124 | 1.060 | meets expectations/does not meet expectations | Dependability |
| 20 | ↑ 2.211 | 0.549 | 0.741 | inefficient/efficient | Efficiency |
| 21 | ↑ 1.921 | 1.480 | 1.217 | clear/confusing | Perspicuity |
| 22 | ↑ 2.132 | 0.820 | 0.906 | impractical/practical | Efficiency |
| 23 | ↑ 1.974 | 1.432 | 1.197 | organized/cluttered | Efficiency |
| 24 | ↑ 1.895 | 1.070 | 1.034 | attractive/unattractive | Attractiveness |
| 25 | ↑ 2.079 | 0.831 | 0.912 | friendly/unfriendly | Attractiveness |
| 26 | ↑ 1.763 | 1.375 | 1.173 | conservative/innovative | Novelty |
| 27 | ↑ 1.763 | 1.483 | 1.218 | the system is able to describe renting experience/ the system is unable to describe renting experience | Awareness and control |
| 28 | ↑ 1.921 | 1.858 | 1.363 | I am aware of the properties of the home/ I am not aware of the properties of the home | Awareness and control |
| 29 | ↑ 2.316 | 1.249 | 1.118 | the system supports the selection of the home/ the system does not support the selection of the home | Awareness and control |
References
- Lin, J.; DiCuccio, M.; Grigoryan, V.; Wilbur, W.J. Navigating information spaces: A case study of related article search in PubMed. Inf. Process. Manag. 2008, 44, 1771–1783. [Google Scholar] [CrossRef]
- Ricci, F.; Rokach, L.; Shapira, B. Introduction to Recommender Systems Handbook. In Recommender Systems Handbook; Ricci, F., Rokach, L., Shapira, B., Kantor, P.B., Eds.; Springer US: Boston, MA, USA, 2011; pp. 1–35. [Google Scholar] [CrossRef]
- Tintarev, N.; Masthoff, J. Explaining recommendations: Design and evaluation. In Recommender Systems Handbook; Ricci, F., Rokach, L., Shapira, B., Eds.; Springer US: Boston, MA, USA, 2015; pp. 353–382. [Google Scholar] [CrossRef]
- Berkovsky, S.; Taib, R.; Conway, D. How to Recommend? User Trust Factors in Movie Recommender Systems. In Proceedings of the 22nd International Conference on Intelligent User Interfaces (IUI’17); Association for Computing Machinery: New York, NY, USA, 2017; pp. 287–300. [Google Scholar] [CrossRef]
- Berkovsky, S.; Taib, R.; Hijikata, Y.; Braslavsku, P.; Knijnenburg, B. A Cross-Cultural Analysis of Trust in Recommender Systems. In Proceedings of the 26th Conference on User Modeling, Adaptation and Personalization (UMAP’18); Association for Computing Machinery: New York, NY, USA, 2018; pp. 285–289. [Google Scholar] [CrossRef]
- Amal, S.; Tsai, C.H.; Brusilovsky, P.; Kuflik, T.; Minkov, E. Relational social recommendation: Application to the academic domain. Expert Syst. Appl. 2019, 124, 182–195. [Google Scholar] [CrossRef]
- Tsai, C.H.; Brusilovsky, P. Exploring social recommendations with visual diversity-promoting interfaces. ACM Trans. Interact. Intell. Syst. 2019, 10, 5:1–5:34. [Google Scholar] [CrossRef] [Green Version]
- Verbert, K.; Parra, D.; Brusilovsky, P. Agents vs. users: Visual recommendation of research talks with multiple dimension of relevance. ACM Trans. Interact. Intell. Syst. 2016, 6. [Google Scholar] [CrossRef]
- Kouki, P.; Schaffer, J.; Pujara, J.; O’Donovan, J.; Getoor, L. Personalized explanations for hybrid recommender systems. In Proceedings of the 24th International Conference on Intelligent User Interfaces (IUI’19); Association for Computing Machinery: New York, NY, USA, 2019; pp. 379–390. [Google Scholar] [CrossRef]
- Marchionini, G. Exploratory search: From finding to understanding. Commun. ACM 2006, 49, 41–46. [Google Scholar] [CrossRef]
- Hearst, M.; Elliott, A.; English, J.; Sinha, R.; Swearingen, K.; Yee, K.P. Finding the flow in web site search. Commun. ACM 2002, 45, 42–49. [Google Scholar] [CrossRef]
- Hearst, M.A. Design recommendations for hierarchical faceted search interfaces. In ACM SIGIR Workshop on Faceted Search; ACM: New York, NY, USA, 2006; pp. 26–30. [Google Scholar]
- Chang, J.C.; Hahn, N.; Perer, A.; Kittur, A. SearchLens: Composing and capturing complex user interests for exploratory search. In Proceedings of the 24th International Conference on Intelligent User Interfaces (IUI ’19); ACM: New York, NY, USA, 2019; pp. 498–509. [Google Scholar] [CrossRef]
- Mauro, N.; Ardissono, L.; Lucenteforte, M. Faceted search of heterogeneous geographic information for dynamic map projection. Inf. Process. Manag. 2020, 57, 102257. [Google Scholar] [CrossRef]
- Dressler, O.; Puppe, F. Knowledge-based diagnosis—Survey and future directions. In XPS-99: Knowledge-Based Systems; Puppe, F., Ed.; Springer: Berlin/Heidelberg, Germany, 1999; pp. 24–46. [Google Scholar] [CrossRef]
- Johnson, H.; Johnson, P. Explanation Facilities and Interactive Systems. In Proceedings of the 1st International Conference on Intelligent User Interfaces (IUI’93); Association for Computing Machinery: New York, NY, USA, 1993; pp. 159–166. [Google Scholar] [CrossRef]
- Von Winterfeldt, D.; Edwards, W. Decision Analysis and Behavioral Research; Cambridge University Press: Cambridge, UK, 1986. [Google Scholar]
- Keeney, R.; Raiffa, H. Decisions with Multiple Objectives: Preferences and Value Tradeoffs; John Wiley & Sons: New York, NY, USA, 1976. [Google Scholar] [CrossRef]
- Nelson, P. Advertising as Information. J. Political Econ. 1974, 82, 729–754. [Google Scholar] [CrossRef]
- Bilici, E.; Saygın, Y. Why do people (not) like me?: Mining opinion influencing factors from reviews. Expert Syst. Appl. 2017, 68, 185–195. [Google Scholar] [CrossRef] [Green Version]
- Amazon.com. Amazon.com: Online Shopping for Electronics, Apparel, etc. 2020. Available online: http://www.amazon.com (accessed on 8 July 2020).
- Yelp. Yelp. 2019. Available online: https://www.yelp.com (accessed on 15 September 2019).
- Stickdorn, M.; Schneider, J.; Andrews, K. This is Service Design Thinking: Basics, Tools, Cases; Wiley: Hoboken, NJ, USA, 2011. [Google Scholar]
- Berre, A.J.; Lew, Y.; Elvesaeter, B.; de Man, H. Service Innovation and Service Realisation with VDML and ServiceML. In Proceedings of the 2012 IEEE 16th International Enterprise Distributed Object Computing Conference Workshops, Vancouver, BC, Canada, 9–13 September 2013; pp. 104–113. [Google Scholar] [CrossRef]
- Millecamp, M.; Htun, N.N.; Conati, C.; Verbert, K. What’s in a User? Towards Personalising Transparency for Music Recommender Interfaces. In Proceedings of the 28th ACM Conference on User Modeling, Adaptation and Personalization (UMAP’20); Association for Computing Machinery: New York, NY, USA, 2020; pp. 173–182. [Google Scholar] [CrossRef]
- Airbnb. 2020. Available online: https://airbnb.com (accessed on 8 July 2020).
- Cheng, M.; Jin, X. What do Airbnb users care about? An analysis of online review comments. Int. J. Hosp. Manag. 2019, 76, 58–70. [Google Scholar] [CrossRef]
- Xu, X.; Lu, Y. The antecedents of customer satisfaction and dissatisfaction toward various types of hotels: A text mining approach. Int. J. Hosp. Manag. 2016, 55, 57–69. [Google Scholar] [CrossRef]
- Ren, L.; Qiu, H.; Wang, P.; Lin, P.M. Exploring customer experience with budget hotels: Dimensionality and satisfaction. Int. J. Hosp. Manag. 2016, 52, 13–23. [Google Scholar] [CrossRef]
- Richardson, A. Using Customer Journey Maps to Improve Customer Experience. Harv. Bus. Rev. 2015, 15, 2–5. [Google Scholar]
- Abdul-Rahman, A.; Hailes, S. Supporting Trust in Virtual Communities. In Proceedings of the 33rd Hawaii International Conference on System Sciences, Maui, HI, USA, 7 January 2000; p. 9. [Google Scholar] [CrossRef]
- Mui, L.; Mohtashemi, M.; Halberstadt, A. A computational model of trust and reputation. In Proceedings of the 35th Annual Hawaii International Conference on System Sciences, Big Island, HI, USA, 10 January 2002; pp. 2431–2439. [Google Scholar] [CrossRef] [Green Version]
- Misztal, B. Trust in Modern Societies; Polity Press: Cambridge, MA, USA, 1996. [Google Scholar]
- Capecchi, S.; Pisano, P. Reputation by Design: Using VDML and Service ML for Reputation Systems Modeling. In Proceedings of the 2014 IEEE 11th International Conference on e-Business Engineering (ICEBE), Guangzhou, China, 5–7 November 2014; IEEE Computer Society: Los Alamitos, CA, USA, 2014; pp. 191–198. [Google Scholar] [CrossRef] [Green Version]
- Bettini, L.; Capecchi, S. VDML4RS: A Tool for Reputation Systems Modeling and Design. In Proceedings of the 8th International Workshop on Social Software Engineering (SSE 2016); Association for Computing Machinery: New York, NY, USA, 2016; pp. 8–14. [Google Scholar] [CrossRef] [Green Version]
- Hoeber, O.; Yang, X.D. A comparative user study of web search interfaces: HotMap, Concept Highlighter, and Google. In Proceedings of the 2006 IEEE/WIC/ACM International Conference on Web Intelligence (WI ’06), Hong Kong, China, 18–22 December 2006; IEEE Computer Society: Washington, DC, USA, 2006; pp. 866–874. [Google Scholar] [CrossRef]
- Klouche, K.; Ruotsalo, T.; Cabral, D.; Andolina, S.; Bellucci, A.; Jacucci, G. Designing for exploratory search on touch devices. In Proceedings of the 33rd Annual ACM Conference on Human Factors in Computing Systems (CHI ’15); ACM: New York, NY, USA, 2015; pp. 4189–4198. [Google Scholar] [CrossRef] [Green Version]
- Kagie, M.; van Wezel, M.; Groenen, P.J. Map based visualization of product catalogs. In Recommender Systems Handbook; Ricci, F., Rokach, L., Shapira, B., Kantor, P.B., Eds.; Springer: Boston, MA, USA, 2011; pp. 547–576. [Google Scholar] [CrossRef] [Green Version]
- Olsen, K.A.; Korfhage, R.R.; Sochats, K.M.; Spring, M.B.; Williams, J.G. Visualization of a document collection: The VIBE system. Inf. Process. Manag. 1993, 29, 69–81. [Google Scholar] [CrossRef]
- Sen, S.; Swoap, A.B.; Li, Q.; Boatman, B.; Dippenaar, I.; Gold, R.; Ngo, M.; Pujol, S.; Jackson, B.; Hecht, B. Cartograph: Unlocking spatial visualization through semantic enhancement. In Proceedings of the 22nd International Conference on Intelligent User Interfaces (IUI ’17); ACM: New York, NY, USA, 2017; pp. 179–190. [Google Scholar] [CrossRef]
- Cao, N.; Sun, J.; Lin, Y.R.; Gotz, D.; Liu, S.; Qu, H. FacetAtlas: Multifaceted visualization for rich text corpora. IEEE Trans. Vis. Comput. Graph. 2010, 16, 1172–1181. [Google Scholar] [CrossRef] [Green Version]
- Cao, N.; Gotz, D.; Sun, J.; Lin, Y.; Qu, H. SolarMap: Multifaceted visual analytics for topic exploration. In Proceedings of the 11th IEEE International Conference on Data Mining (KDD ’08), Vancouver, BC, Canada, 11–14 December 2011; pp. 101–110. [Google Scholar] [CrossRef]
- Pu, P.; Chen, L. Trust-inspiring explanation interfaces for recommender systems. Knowl. Based Syst. 2007, 20, 542–556. [Google Scholar] [CrossRef]
- Herlocker, J.L.; Konstan, J.A.; Riedl, J. Explaining Collaborative Filtering recommendations. In Proceedings of the 2000 ACM Conference on Computer Supported Cooperative Work (CSCW’00); Association for Computing Machinery: New York, NY, USA, 2000; pp. 241–250. [Google Scholar] [CrossRef]
- Lops, P.; de Gemmis, M.; Semeraro, G. Content-based recommender systems: State of the art and trends. In Recommender Systems Handbook; Ricci, F., Rokach, L., Shapira, B., Kantor, P.B., Eds.; Springer: Boston, MA, USA, 2011; pp. 73–105. [Google Scholar] [CrossRef]
- Han, E.H.S.; Karypis, G. Feature-based recommendation system. In Proceedings of the 14th ACM International Conference on Information and Knowledge Management (CIKM ’05); ACM: New York, NY, USA, 2005; pp. 446–452. [Google Scholar] [CrossRef] [Green Version]
- Adomavicius, G.; Kwon, Y. New recommendation techniques for multicriteria rating systems. IEEE Intell. Syst. 2007, 22, 48–55. [Google Scholar] [CrossRef] [Green Version]
- Jannach, D.; Zanker, M.; Fuchs, M. Leveraging multi-criteria customer feedback for satisfaction analysis and improved recommendations. Inf. Technol. & Tour. 2014, 14, 119–149. [Google Scholar] [CrossRef]
- Zheng, Y. Criteria chains: A novel multi-criteria recommendation approach. In Proceedings of the 22nd International Conference on Intelligent User Interfaces (IUI ’17); ACM: New York, NY, USA, 2017; pp. 29–33. [Google Scholar] [CrossRef]
- Wang, H.; Zhang, F.; Wang, J.; Zhao, M.; Li, W.; Xie, X.; Guo, M. RippleNet: Propagating user preferences on the knowledge graph for recommender systems. In Proceedings of the 27th ACM International Conference on Information and Knowledge Management (CIKM’18); Association for Computing Machinery: New York, NY, USA, 2018; pp. 417–426. [Google Scholar] [CrossRef] [Green Version]
- Musto, C.; Narducci, F.; Lops, P.; de Gemmis, M.; Semeraro, G. Linked open data-based explanations for transparent recommender systems. Int. J. Hum. Comput. Stud. 2019, 121, 93–107. [Google Scholar] [CrossRef]
- He, X.; Chen, T.; Kan, M.Y.; Chen, X. TriRank: Review-aware explainable recommendation by modeling aspects. In Proceedings of the 24th ACM International on Conference on Information and Knowledge Management (CIKM’15); Association for Computing Machinery: New York, NY, USA, 2015; pp. 1661–1670. [Google Scholar] [CrossRef]
- Loepp, B.; Herrmanny, K.; Ziegler, J. Blended recommending: Integrating interactive information filtering and algorithmic recommender techniques. In Proceedings of the 33rd Annual ACM Conference on Human Factors in Computing Systems (CHI ’15); ACM: New York, NY, USA, 2015; pp. 975–984. [Google Scholar] [CrossRef]
- Parra, D.; Brusilovsky, P. User-controllable personalization: A case study with SetFusion. Int. J. Hum. Comput. Stud. 2015, 78, 43–67. [Google Scholar] [CrossRef] [Green Version]
- Cardoso, B.; Sedrakyan, G.; Gutiérrez, F.; Parra, D.; Brusilovsky, P.; Verbert, K. IntersectionExplorer, a multi-perspective approach for exploring recommendations. Int. J. Hum. Comput. Stud. 2019, 121, 73–92. [Google Scholar] [CrossRef]
- Kouki, P.; Schaffer, J.; Pujara, J.; O’Donovan, J.; Getoor, L. User preferences for hybrid explanations. In Proceedings of the Eleventh ACM Conference on Recommender Systems; Association for Computing Machinery (RecSys’17); ACM: New York, NY, USA, 2017; pp. 84–88. [Google Scholar] [CrossRef]
- Chen, L.; Chen, G.; Wang, F. Recommender systems based on user reviews: The state of the art. User Model. User-Adapt. Interact. 2015, 25, 99–154. [Google Scholar] [CrossRef]
- Hernández-Rubio, M.; Cantador, I.; Bellogín, A. A comparative analysis of recommender systems based on item aspect opinions extracted from user reviews. User Model. User-Adapt. Interact. 2019, 29, 381–441. [Google Scholar] [CrossRef]
- Bao, Y.; Fang, H.; Zhang, J. TopicMF: Simultaneously exploiting ratings and reviews for recommendation. In Proceedings of the Twenty-Eighth AAAI Conference on Artificial Intelligence (AAAI’14); AAAI Press: Palo Alto, CA, USA, 2014; pp. 2–8. [Google Scholar] [CrossRef]
- Zhao, T.; McAuley, J.; King, I. Improving latent factor models via personalized feature projection for one class recommendation. In Proceedings of the 24th ACM International on Conference on Information and Knowledge Management (CIKM ’15); ACM: New York, NY, USA, 2015; pp. 821–830. [Google Scholar] [CrossRef] [Green Version]
- Musto, C.; de Gemmis, M.; Semeraro, G.; Lops, P. A multi-criteria recommender system exploiting aspect-based sentiment analysis of users’ reviews. In Proceedings of the Eleventh ACM Conference on Recommender Systems; ACM (RecSys ’17); ACM: New York, NY, USA, 2017; pp. 321–325. [Google Scholar] [CrossRef]
- Hu, G.N.; Dai, X.Y.; Qiu, F.Y.; Xia, R.; Li, T.; Huang, S.J.; Chen, J.J. Collaborative Filtering with topic and social latent factors incorporating implicit feedback. ACM Trans. Knowl. Discov. Data 2018, 12, 23:1–23:30. [Google Scholar] [CrossRef]
- Musat, C.C.; Faltings, B. Personalizing product rankings using collaborative filtering on opinion-derived topic profiles. In Proceedings of the 24th International Conference on Artificial Intelligence (IJCAI’15); AAAI Press: Palo Alto, CA, USA, 2015; pp. 830–836. [Google Scholar]
- Li, S.T.; Pham, T.T.; Chuang, H.C. Do reviewers’ words affect predicting their helpfulness ratings? Locating helpful reviewers by linguistics styles. Inf. Manag. 2019, 56, 28–38. [Google Scholar] [CrossRef]
- Shen, R.P.; Zhang, H.R.; Yu, H.; Min, F. Sentiment based matrix factorization with reliability for recommendation. Expert Syst. Appl. 2019. [Google Scholar] [CrossRef]
- Muhammad, K.; Lawlor, A.; Rafter, E.; Smyth, B. Great Explanations: Opinionated explanations for recommendations. In Case-Based Reasoning Research and Development; Hullermeier, E., Minor, M., Eds.; Springer International Publishing: Cham, Switzerland, 2015; pp. 244–258. [Google Scholar] [CrossRef]
- Chen, L.; Wang, F. Explaining recommendations based on feature sentiments in product reviews. In Proceedings of the 22nd International Conference on Intelligent User Interfaces (IUI’17); Association for Computing Machinery: New York, NY, USA, 2017; pp. 17–28. [Google Scholar] [CrossRef]
- O’Mahony, M.P.; Smyth, B. From opinions to recommendations. In Social Information Access: Systems and Technologies; Brusilovsky, P., He, D., Eds.; Springer International Publishing: Cham, Switzerland, 2018; pp. 480–509. [Google Scholar] [CrossRef] [Green Version]
- Ni, J.; McAuley, J. Personalized review generation by expanding phrases and attending on aspect-aware representations. In Proceedings of the 56th Annual Meeting of the Association for Computational Linguistics (Volume 2: Short Papers); Association for Computational Linguistics: Melbourne, Australia, 2018; pp. 706–711. [Google Scholar] [CrossRef]
- Lu, Y.; Dong, R.; Smyth, B. Coevolutionary Recommendation Model: Mutual Learning between Ratings and Reviews. In Proceedings of the 2018 World Wide Web Conference (WWW’18); International World Wide Web Conferences Steering Committee: Geneva, Switzerland, 2018; pp. 773–782. [Google Scholar] [CrossRef] [Green Version]
- McAuley, J.; Leskovec, J. Hidden factors and hidden topics: Understanding rating dimensions with review text. In Proceedings of the 7th ACM Conference on Recommender Systems (RecSys’13); Association for Computing Machinery: New York, NY, USA, 2013; pp. 165–172. [Google Scholar] [CrossRef]
- Lex, A.; Gehlenborg, N.; Strobelt, H.; Vuillemot, R.; Pfister, H. UpSet: Visualization of intersecting sets. IEEE Trans. Vis. Comput. Graph. 2014, 20, 1983–1992. [Google Scholar] [CrossRef]
- Allen, G.L.; Miller Cowan, C.R.; Power, H. Acquiring information from simple weather maps: Influences of domain-specific knowledge and general visual-spatial abilities. Learn. Individ. Differ. 2006, 16, 337–349. [Google Scholar] [CrossRef]
- Canham, M.; Hegarty, M. Effects of knowledge and displays design on comprehension of complex graphics. Learn. Instr. 2010, 20, 155–166. [Google Scholar] [CrossRef]
- Ni, J.; Li, J.; McAuley, J. Justifying recommendations using distantly-labeled reviews and fine-grained aspects. In Proceedings of the 2019 Conference on Empirical Methods in Natural Language Processing and the 9th International Joint Conference on Natural Language Processing (EMNLP-IJCNLP); Association for Computational Linguistics: Hong Kong, China, 2019; pp. 188–197. [Google Scholar] [CrossRef]
- Musto, C.; de Gemmis, M.; Lops, P.; Semeraro, G. Generating post hoc review-based natural language justifications for recommender systems. User-Model. User-Adapt. Interact. 2020, 27. [Google Scholar] [CrossRef]
- Millecamp, M.; Htun, N.N.; Conati, C.; Verbert, K. To explain or not to explain: The effects of personal characteristics when explaining music recommendations. In Proceedings of the 24th International Conference on Intelligent User Interfaces (IUI’19); Association for Computing Machinery: New York, NY, USA, 2019; pp. 397–407. [Google Scholar] [CrossRef]
- Alam, M.H.; Ryu, W.J.; Lee, S. Joint multi-grain topic sentiment: Modeling semantic aspects for online reviews. Inf. Sci. 2016, 339, 206–223. [Google Scholar] [CrossRef]
- Blei, D.M.; McAuliffe, J.D. Supervised topic models. In Proceedings of the 20th International Conference on Neural Information Processing Systems (NIPS’07); Curran Associates Inc.: Red Hook, NY, USA, 2007; pp. 121–128. [Google Scholar] [CrossRef]
- Tang, F.; Fu, L.; Yao, B.; Xu, W. Aspect based fine-grained sentiment analysis for online reviews. Inf. Sci. 2019, 488, 190–204. [Google Scholar] [CrossRef]
- Xu, X.; Wang, X.; Li, Y.; Haghighi, M. Business intelligence in online customer textual reviews: Understanding consumer perceptions and influential factors. Int. J. Inf. Manag. 2017, 37, 673–683. [Google Scholar] [CrossRef]
- Landauer, T.K.; Foltz, P.W.; Laham, D. An introduction to latent semantic analysis. Discourse Process. 1998, 25, 259–284. [Google Scholar] [CrossRef]
- Xiong, W.; Litman, D. Empirical analysis of exploiting review helpfulness for extractive summarization of online reviews. In Proceedings of COLING 2014, the 25th International Conference on Computational Linguistics: Technical Papers; Dublin City University and Association for Computational Linguistics: Dublin, Ireland, 2014; pp. 1985–1995. [Google Scholar]
- Korfiatis, N.; Stamolampros, P.; Kourouthanassis, P.; Sagiadinos, V. Measuring service quality from unstructured data: A topic modeling application on airline passengers’ online reviews. Expert Syst. Appl. 2019, 116, 472–486. [Google Scholar] [CrossRef] [Green Version]
- Roberts, M.E.; Stewart, B.M.; Tingley, D.; Lucas, C.; Leder-Luis, J.; Gadarian, S.K.; Albertson, B.; Rand, D.G. Structural topic models for open-ended survey responses. Am. J. Political Sci. 2014, 58, 1064–1082. [Google Scholar] [CrossRef] [Green Version]
- Chang, Y.C.; Ku, C.H.; Chen, C.H. Social media analytics: Extracting and visualizing Hilton hotel ratings and reviews from TripAdvisor. Int. J. Inf. Manag. 2019, 48, 263–279. [Google Scholar] [CrossRef]
- Explosion, A.I. SpaCy—Industrial Natural Language Processing in Python. 2017. Available online: https://spacy.io/ (accessed on 6 July 2020).
- Shuyo, N. Langdetect. 2020. Available online: https://pypi.org/project/langdetect/ (accessed on 6 July 2020).
- Loria, S. TextBlob: Simplified Text Processing. 2020. Available online: https://textblob.readthedocs.io/en/dev/index.html (accessed on 6 July 2020).
- Smedt, T.D.; Daelemans, W. Pattern for Python. J. Mach. Learn. Res. 2012, 13, 2063–2067. [Google Scholar]
- Baccianella, S.; Esuli, A.; Sebastiani, F. SentiWordNet 3.0: An Enhanced Lexical Resource for Sentiment Analysis and Opinion Mining. In Proceedings of the Seventh International Conference on Language Resources and Evaluation (LREC’10); European Language Resources Association (ELRA): Valletta, Malta, 2010. [Google Scholar]
- Booking.com. 2019. Available online: https://www.booking.com (accessed on 18 October 2019).
- Jøsang, A.; Ismail, R.; Boyd, C. A Survey of Trust and Reputation Systems for Online Service Provision. Decis. Support Syst. 2007, 43, 618–644. [Google Scholar] [CrossRef] [Green Version]
- Jørgensen, A.H. Thinking-aloud in user interface design: A method promoting cognitive ergonomics. Ergonomics 1990, 33, 501–507. [Google Scholar] [CrossRef]
- Laugwitz, B.; Held, T.; Schrepp, M. Construction and evaluation of a user experience questionnaire. In HCI and Usability for Education and Work; Holzinger, A., Ed.; Springer: Berlin/Heidelberg, Germany, 2008; pp. 63–76. [Google Scholar] [CrossRef]
- Pu, P.; Chen, L.; Hu, R. A user-centric evaluation framework for recommender systems. In Proceedings of the Fifth ACM Conference on Recommender Systems (RecSys’11); Association for Computing Machinery: New York, NY, USA, 2011; pp. 157–164. [Google Scholar] [CrossRef] [Green Version]
- Iacobucci, D.; Calder, B. Kellogg on Integrated Marketing; Wiley: Hoboken, NJ, USA, 2002. [Google Scholar]
- Ceric, A.; D’Alessandro, S.; Soutar, G.; Johnson, L. Using blueprinting and benchmarking to identify marketing resources that help co-create customer value. J. Bus. Res. 2016, 69, 5653–5661. [Google Scholar] [CrossRef]
Figure 1.
The dashed box shows the Service Journey Map model of [24]. Gray circles represent service stages; below each stage, we report the corresponding evaluation dimensions (, ⋯, ). We downloaded the icons from https://www.pngkit.com/bigpic/u2e6y3e6u2o0w7r5/.
Figure 1.
The dashed box shows the Service Journey Map model of [24]. Gray circles represent service stages; below each stage, we report the corresponding evaluation dimensions (, ⋯, ). We downloaded the icons from https://www.pngkit.com/bigpic/u2e6y3e6u2o0w7r5/.

Figure 2.
Pipeline of activities for the analysis of an individual review.

Figure 3.
Apartment Monitoring: visualization of consumer satisfaction about a home regarding the host appreciation, in-apartment experience, and surroundings, during the last year.
Figure 3.
Apartment Monitoring: visualization of consumer satisfaction about a home regarding the host appreciation, in-apartment experience, and surroundings, during the last year.

Figure 4.
The upper portion of this figure shows the Service Journey Map related to the home booking experience. Each stage of the map is connected to the associated evaluation dimensions. Evaluation dimensions are colored as in the user interface of the Apartment Monitoring application.
Figure 4.
The upper portion of this figure shows the Service Journey Map related to the home booking experience. Each stage of the map is connected to the associated evaluation dimensions. Evaluation dimensions are colored as in the user interface of the Apartment Monitoring application.

Figure 5.
Post-task questionnaire results with items sorted as in the administered survey. The histogram shows the comparison of Baseline and INTEREST models on individual UX aspects. The colors of each bar represents the UX factor to which the bipolar item belongs, see Table 3 for color mappings.
Figure 5.
Post-task questionnaire results with items sorted as in the administered survey. The histogram shows the comparison of Baseline and INTEREST models on individual UX aspects. The colors of each bar represents the UX factor to which the bipolar item belongs, see Table 3 for color mappings.

Table 1.
Overview of the support to the analysis of results offered in the information exploration and recommender systems (RS) areas.
Table 1.
Overview of the support to the analysis of results offered in the information exploration and recommender systems (RS) areas.
| Type of System | Dimensions of Item Exploration | Visualization/Explanation | Citation |
|---|---|---|---|
| information exploration | search keywords/concepts | color coding of result list | [36,37] |
| information exploration | search keywords/concepts | 2D plan-based visualization of results | [14,39,40] |
| information exploration | search keywords/concepts | 2D/3D visualization of clusters of results | [41,42] |
| RS | item properties | group items by trade-off properties | [43] |
| collaborative RS | similar users/items | group user ratings, describe past performance | [44] |
| content-based RS | user content similarity | any | [45] |
| feature-based and multicriteria RS | features utility | feature-based, bar charts | [25,46,47,48,49] |
| graph-based RS | user–item relations | relation graph | [6,50,51,52] |
| hybrid RS | supporting recommender | stackable bars, relation graphs, grids, textual explanation, Venn diagrams | [7,8,9,53,54,55,56] |
| review-based RS | aspects and features of items | - | [57,58,59,60,61,62,63,64,65] |
| review-based RS | features and sentiment | feature-based | [13,66,67,68,69,70,71] |
Table 2.
Evaluation dimensions and sample lemmatized keywords for the thesauri of the home booking domain. Table A1 in the Appendix A shows the complete thesauri.
Table 2.
Evaluation dimensions and sample lemmatized keywords for the thesauri of the home booking domain. Table A1 in the Appendix A shows the complete thesauri.
| Evaluation Dimension | #Keywords | Sample Lemmatized Keywords |
|---|---|---|
| Host appreciation | 10 | host, owner, renter, interaction, hospitality, ⋯ |
| Search on website | 18 | search, reservation, booking, arrangement, agreement, ⋯ |
| Check-in/Check-out | 37 | arrival, welcome, key, reception, check-in, check-out, ⋯ |
| In-apartment experience | 180 | bed, bedroom, bathroom, bath, kitchen, internet, exterior, ⋯ |
| Surroundings | 70 | beach, transport, cafés, restaurant, shops, bus, park, ⋯ |
Table 3.
Post-test questionnaire: UX aspects grouped by factor. We consider the 6 UEQ factors plus an extra one (in italics) that describes user awareness and control. The last three items are translated from the Italian language.
Table 3.
Post-test questionnaire: UX aspects grouped by factor. We consider the 6 UEQ factors plus an extra one (in italics) that describes user awareness and control. The last three items are translated from the Italian language.
| Factor | Values |
|---|---|
| Attractiveness | annoying/enjoyable |
| good/bad | |
| unlikable/pleasing | |
| unpleasant/pleasant | |
| attractive/unattractive | |
| friendly/unfriendly | |
| Perspicuity | not understandable/understandable |
| easy to learn/difficult to learn | |
| complicated/easy | |
| clear/confusing | |
| Efficiency | fast/slow |
| inefficient/efficient | |
| impractical/practical | |
| organized/cluttered | |
| Dependability | unpredictable/predictable |
| obstructive/supportive | |
| secure/not secure | |
| meets expectations/does not meet expectations | |
| Stimulation | valuable/inferior |
| boring/exciting | |
| not interesting/interesting | |
| motivating/demotivating | |
| Novelty | creative/dull |
| inventive/conventional | |
| usual/leading edge | |
| conservative/innovative | |
| Awareness and control | the system is able to describe renting experience/the system is unable to describe renting experience |
| I am aware of the properties of the home/I am not aware of the properties of the home | |
| the system supports the selection of the home/the system does not support the selection of the home |
Table 4.
Post-test questionnaire translated from the Italian language.
| # | Question |
|---|---|
| 1 | The application made me save effort when solving the task (efficiency) |
| 2 | The application was easy to use |
| 3 | I would recommend the application to a friend |
| 4 | I would like to use the application in the future |
| 5 | I am satisfied about the application |
| 6 | Notes |
Table 5.
Post-task questionnaire results: comparison of Baseline and INTEREST on UX factors. The second and third columns show the mean aggregate rating of each factor. Values are obtained by averaging the ratings given by participants to individual UX aspects: → denotes a neutral value, ↓ a negative one and ↑ a positive one. Significance is encoded as (*) .
| Baseline | INTEREST | |
|---|---|---|
| Attractiveness | → −0.570 | ↑ 1.882 * |
| Perspicuity | → −0.533 | ↑ 1.967 * |
| Efficiency | ↓ −0.895 | ↑ 2.158 * |
| Dependability | → −0.368 | ↑ 1.789 * |
| Stimulation | ↓ −1.151 | ↑ 1.664 * |
| Novelty | ↓ −1.724 | ↑ 1.776 * |
| Awareness and control | → −0.404 | ↑ 2.000 * |
Table 6.
Post-task questionnaire results in a [0, 100] scale with relative difference between Baseline and INTEREST on UX factors. The colored arrows have the same meaning as in Table 5.
Table 6.
Post-task questionnaire results in a [0, 100] scale with relative difference between Baseline and INTEREST on UX factors. The colored arrows have the same meaning as in Table 5.
| Baseline | INTEREST | Relative Difference | |
|---|---|---|---|
| Attractiveness | → 40.50% | ↑ 81.36% | 100.90% |
| Perspicuity | → 58.88% | ↑ 82.79% | 40.60% |
| Efficiency | ↓ 35.09% | ↑ 85.96% | 145.00% |
| Dependability | → 56.14% | ↑ 79.82% | 42.19% |
| Stimulation | ↓ 30.81% | ↑ 77.74% | 152.31% |
| Novelty | ↓ 21.27% | ↑ 79.61% | 274.23% |
| Awareness and control | → 56.73% | ↑ 83.33% | 46.89% |
© 2020 by the authors. Licensee MDPI, Basel, Switzerland. This article is an open access article distributed under the terms and conditions of the Creative Commons Attribution (CC BY) license (http://creativecommons.org/licenses/by/4.0/).
Share and Cite
MDPI and ACS Style
Mauro, N.; Ardissono, L.; Capecchi, S.; Galioto, R. Service-Aware Interactive Presentation of Items for Decision-Making. Appl. Sci. 2020, 10, 5599. https://doi.org/10.3390/app10165599
AMA Style
Mauro N, Ardissono L, Capecchi S, Galioto R. Service-Aware Interactive Presentation of Items for Decision-Making. Applied Sciences. 2020; 10(16):5599. https://doi.org/10.3390/app10165599
Chicago/Turabian StyleMauro, Noemi, Liliana Ardissono, Sara Capecchi, and Rosario Galioto. 2020. "Service-Aware Interactive Presentation of Items for Decision-Making" Applied Sciences 10, no. 16: 5599. https://doi.org/10.3390/app10165599
Note that from the first issue of 2016, this journal uses article numbers instead of page numbers. See further details here.