Putting COI Metabarcoding in Context: The Utility of Exact Sequence Variants (ESVs) in Biodiversity Analysis
 Teresita M. Porter
 Mehrdad Hajibabaei
- Centre for Biodiversity Genomics and Department of Integrative Biology, University of Guelph, Guelph, ON, Canada
DNA barcoding and metabarcoding are techniques that focus on signature genomic regions that in theory provide species level resolution, but in practice this is not always possible. We place animal-focused COI metabarcoding in context with respect to the use of marker gene sequencing in microbial and fungal ecology. We focus on three specific aspects of metabarcodes: (1) the process of metabarcode sequence clustering, (2) how metabarcode cluster types affect the results of biodiversity analyses, and (3) the current state of reference sequence databases used for metabarcode identification. Using examples from the arthropod COI metabarcode literature, we show that exact sequence variants (ESVs) detect more unique taxa than operational taxonomic units (OTUs) but with similar patterns in taxonomic resolution. We also show that the difference between ordinations based on ESVs or OTUs recover similar groupings. We compile a list of reference sequence databases useful for multi-marker metabarcoding and present a list of reference sequence databases specifically formatted for use with a naive Bayesian classifier for rigorous metabarcode taxonomic assignments. Sophisticated tools and reference databases are available for analyzing COI sequences, and these compare favorably with those available for other metabarcode markers such as the ribosomal RNA genes used to target microbes and fungi.
Background
The objective of DNA barcoding is to permit specimen identificationto the species rank. Part of the DNA barcoding process involves building a high-quality reference database containing geographic, morphological, and taxonomic information that is submitted along with a high-quality reference sequence providing species-level resolution (Hebert et al., 2003). DNA barcodes can then be used to help identify unknown specimens when compared to a reference sequence database. Cytochrome c oxidase subunit I (COI) mitochondrial DNA (mtDNA) barcodes for animal species are about 650 bp, the length supported by Sanger sequencing, but modern barcoding has been able to scale up by using newer sequencing technology (Box 1). In practice, however, only a proportion of DNA barcode records themselves represent fully-identified specimens at the species rank (Porter and Hajibabaei, 2018b). Some issues that hamper rapid taxonomic identification include dwindling taxonomic expertise (Ebach et al., 2011); hyperdiversity in certain taxa such as insects, microbes, and fungi (Lozupone and Knight, 2007; Blackwell, 2011; Basset et al., 2012; Tedersoo et al., 2014); and lack of morphological characters at certain life stages such as immature insect larva or asexual fungal cultures. Even specimens with degraded DNA, however, such as food products or archival specimens, have been successfully sequenced using mini-barcodes (Box 2). The commonality of these challenges across multiple fields of study, from microbes to animals, has driven the development of DNA-based methods to detect and identify organisms.
BOX 1. Scaling up DNA barcoding.
Though DNA barcodes can be generated for a few samples at a time to help fill out a reference dataset for a particular study, the process can also be scaled up tremendously where researchers have access to automation, liquid handling machines, and high throughput sequencing technology (Hebert et al., 2003, 2018; Hajibabaei et al., 2005). Initially, DNA barcodes were generated in batches using Sanger sequencing. Later, protocols were adapted for high throughput sequencing using an Illumina MiSeq platform where multiple overlapping mini-barcode regions were targeted and then assembled into full length barcodes (Shokralla et al., 2015b). More recently, scalability has been increased and overall cost per sequence decreased by using asymmetric unique molecular identifier (UMI) tagging to track individual samples with single molecule real time (SMRT) technology on the PacBio SEQUEL system (Hebert et al., 2018). This new system ramps up the throughput from 96-sample batches using Sanger sequencing up to 10,000 samples per SEQUEL run. For example, the International Barcodes of Life (iBOL) consortium has released more than 2.6 million DNA barcode sequences from 500,000 species as a part of the BARCODE 500K project (available from https://www.boldsystems.org). Most recently, the current BIOSCAN project is expected to generate DNA barcode sequences for more than 2 million species (Hobern and Hebert, 2019; Hobern, 2020).
The fields of microbial ecology and animal biodiversity each came up with their own solution to a shared problem: How do you consistently label sequences from specimens that cannot be identified to the species rank? In mycology, internal transcribed spacer region of ribosomal DNA (ITS rDNA) sequences are clustered into species hypotheses (SHs) that are given a numeric identifier and can be used as a common label for sequences that cannot be identified to the species rank (Koljalg et al., 2013). In the field of COI barcoding, the barcode index number (BIN) serves a similar purpose (Ratnasingham and Hebert, 2013). Specialized databases such as BOLD for COI mtDNA and UNITE for ITS rDNA barcodes house reference sequences and their corresponding BINs or SHs that attempt to approximate species units (Ratnasingham and Hebert, 2007, 2013; Koljalg et al., 2013). In the future, it is possible that BINs could be adapted to include high quality metabarcode (environmental) sequences lacking a physical specimen in the way that fungal species hypotheses (SHs) currently do (Kõljalg et al., 2019; Nilsson et al., 2019).
To transition from sampling individuals (DNA barcoding) to whole communities (DNA metabarcoding) requires the use of “culture-free” and “capture-free” approaches based on targeting environmental DNA (Box 3). DNA metabarcoding is a technique similar to the culture independent marker gene sequencing routinely used in the microbial and fungal ecology literature. The term DNA metabarcoding, however, also implies species-level taxonomic assignment (Taberlet et al., 2012b). Species level resolution of metabarcodes, however, may not be possible if there are gaps in the reference sequence database, the chosen marker lacks species-level resolution (Hajibabaei et al., 2011; Hajibabaei, 2012), or if the metabarcode sequences are too short to provide enough variable characters for a confident assignment (Porter and Hajibabaei, 2018a). In the microbial literature, it is accepted that 16S rRNA gene sequences may only provide genus level taxonomic assignments (Wang et al., 2007). Popular bioinformatic pipelines used in the microbial ecology and microbiome literature, such as QIIME, produce rank-flexible taxonomic assignments (Caporaso et al., 2010). In the DNA barcoding and metabarcoding literature, this type of rank flexible taxonomic assignment was specifically termed “metasystematics” (Hajibabaei, 2012).
From microbes to macrofauna, DNA metabarcoding can be conducted without having to isolate or identify individuals using morphological characters and leverages the sequence and taxonomic information contained in reference databases built from DNA barcodes (Hajibabaei et al., 2011; Taberlet et al., 2012b; Yu et al., 2012). Often, metabarcodes range from about 200–400 bp to correspond to the length supported by current high throughput sequencing platforms such as the Illumina MiSeq (Hajibabaei et al., 2011; Taberlet et al., 2012b). For some applications, such as with ancient DNA, even shorter regions may be targeted (D’Costa et al., 2011). In this paper, we focus on how metabarcodes are generated, analyzed, and identified. We ask three questions: (1) Why do we cluster metabarcode reads? (2) Does metabarcode cluster type affect the results of biodiversity analyses? (3) What resources are available for metabarcode identification?
Why Do We Cluster Metabarcode Reads?
If the DNA metabarcode sequences themselves provide the finest level of resolution, why do many metabarcode bioinformatic pipelines include a clustering step (Box 4)? First, clustering metabarcode sequences allows users to reduce the size of the data files and facilitate downstream processing. Second, sequence clustering may absorb artifactual sequences caused by PCR or sequencing error. This clustering step was needed because the early methods of denoising were computationally intensive and difficult to implement on large datasets (Reeder and Knight, 2009). Current denoising methods are incorporated into several existing programs and pipelines such as DADA2, USEARCH, VSEARCH, and Deblur (Callahan et al., 2016; Edgar, 2016; Rognes et al., 2016; Amir et al., 2017; Nearing et al., 2018). Reads may be clustered to approximate species units. In the field of microbial ecology, it was shown that if a phylogenetic species definition requires at least 70% or greater DNA similarity, this corresponds to ∼97% sequence similarity in the 16S rRNA gene region (Stackebrandt and Goebel, 1994). A recent study, however, suggests that 99–100% thresholds may be more appropriate (Edgar, 2018b). In current fungal ecology, 97–99% cutoffs for the ITS rDNA are sometimes used to approximate species units (Koljalg et al., 2013). In COI metabarcoding studies, a variety of sequence similarity cutoffs have been used ranging from 95–100% to maximize genetic diversity recovered while controlling for the effect of sequence errors, resulting in species-like groupings (Elbrecht et al., 2017; Braukmann et al., 2019; Tapolczai et al., 2019). In many cases, a 97% sequence similarity cutoff is used because existing bioinformatic pipelines were originally developed to process microbial rRNA gene sequences, and this threshold is often a default value. In all cases, use of a single sequence similarity threshold, such as 97% OTUs, may not reproduce species units across all taxa defined by traditional species concepts or across the variety of markers used for metabarcoding today.
BOX 2. Mini-barcodes for difficult samples.
Mini-barcodes can be thought of as partial DNA barcodes where very short regions about 100–200 bp in length are generated from individual specimens (Hajibabaei et al., 2006). These minimalist barcodes are ideal for identifying very old or poorly preserved specimens or highly processed material (e.g., food products) where DNA is very degraded and longer barcode sequences are difficult to amplify (Hajibabaei et al., 2006; Shokralla et al., 2015a). In the original study that describes a minimalist barcode, a dataset of over 200 Australian fish species and four species-rich lepidopteran genera show that 109–218 bp regions of COI mtDNA had sufficient variation to allow for identification (Hajibabaei et al., 2006).
Mini-barcodes, and even metabarcodes, can also be generated from sample preservative such as ethanol (Hajibabaei et al., 2012; Erdozain et al., 2019). In one of the first studies describing this non-destructive technique, DNA was isolated from mescal, a liquor containing the larva of the Agave butterfly, and a sequence from the family that includes the Agave butterfly was successfully recovered (Shokralla et al., 2010). The optimization of non-destructive DNA barcoding to identify single specimens and entire communities from sample preservative continues (Shokralla et al., 2010; Hajibabaei et al., 2012; Erdozain et al., 2019; Marquina et al., 2019; Gauthier et al., 2020; Zenker et al., 2020).
BOX 3. Environmental DNA.
Environmental DNA (eDNA) refers to DNA that can be extracted from environmental samples, without having to isolate individual organisms (Taberlet et al., 2012a). In the microbial and fungal literature, “culture-free” methods were used to extract eDNA directly from, for example, soil or water without having to isolate, culture, and identify individual strains (Pace et al., 1986; Handelsman, 2004). The term “bulk” was used to refer to a bulk environmental sample such as soil or water. The advantage of “culture-free” methods was the avoidance of known culture-bias such as in the “great plate count anomaly” described from microbial studies (Staley and Konopka, 1985). More recently in animal-focused studies, “capture-free” methods using eDNA have been adopted to facilitate the detection of organisms in the environment (Darling, 2019). In animal-focused studies, eDNA methods allow for the detection of organisms that are difficult to catch using traditional methods, especially if they are rare.
The term “extracellular DNA” should not be confused with eDNA as we use the term here. In some of the modern eDNA literature, extracellular DNA has been targeted to improve the chances of recovering enough DNA to detect non-microbial organisms such as plants and invertebrates from soil or water. Extracellular DNA can adsorb to sand, clay, silt, or organic compounds such as humic acids. It has been shown that extracellular DNA is more resistant to DNase digestion and adsorbed DNA may persist longer than free-DNA in the environment (Romanowski et al., 1991; Nielsen et al., 2007; Pietramellara et al., 2009). It has also been suggested that focusing metabarcoding on extracellular DNA allows for more efficient detection of non-microbial organisms compared with using methods that extract both intra- and extra-cellular DNA from environmental samples that are dominated by microbial DNA (Taberlet et al., 2012c). In the eDNA literature, water samples are filtered to isolate the extracellular DNA used to indirectly monitor fish and other aquatic animals using metabarcoding or species-specific qPCR (Hänfling et al., 2016; Hernandez et al., 2020). The focus on extracellular DNA for animal-focused metabarcoding can be contrasted with that in the microbial soil ecology literature where DNA adsorbed to particles has been termed “relic DNA.” Such relic DNA has been considered problematic as it may obscure estimates of microbial diversity (Carini et al., 2016).
In eDNA studies, a further distinction is also often made between environmental DNA comprised of degraded extracellular DNA or DNA from mixed community samples (Deiner et al., 2017). Such mixed community samples are sometimes referred to as “bulk” tissue samples that are comprised of whole organisms such as those collected from traps or nets (Taberlet et al., 2012b; Yu et al., 2012; Creer et al., 2016). For example, the arthropods collected from a Malaise trap or kick-net sample can be homogenized together, whole community DNA can be extracted, then one or more primer sets are used for metabarcoding (Hajibabaei et al., 2011; Gibson et al., 2014; Barsoum et al., 2019).
The terminology used in microbial versus animal metabarcoding studies needs to be understood from the history of the field and context in terms of the targeted organisms to avoid misunderstandings.
BOX 4. A general bioinformatic pipeline for metabarcode clusters based on operational taxonomic units or exact sequence variants.
DNA metabarcodes are often generated using paired-end Illumina sequencing. Forward and reverse reads are paired, then the ends of the sequence matching the primers are removed. In some pipelines, primers are trimmed first, then forward and reverse reads are paired. Each of these steps may require the user to set a minimum Phred quality score cutoff as well as a cutoff for the number of mismatches tolerated.
At this point, sequence files belonging to each sample are often pooled together for a “global” analysis. Dereplication involves obtaining just the unique sequences from the set. The number of reads matching each unique sequence is retained as this information is needed for both the clustering and denoising methods described below. The output is usually sorted by decreasing read abundance, but other sort orders are possible. Because many clustering methods are “greedy” to improve computation time, changing the input order of the sequences can change the composition of the resulting OTUs.
The operational taxonomic unit (OTU) clustering part of the pipeline is shown in blue. An identity threshold is chosen, for example, 0.97, to cluster sequences with at least 97% sequence similarity. Steps to remove putative chimeric sequences and rare sequences that may contain sequence errors will also be conducted at this step. In pipelines run in USEARCH or VSEARCH, each OTU is represented by a single centroid sequence in any future analyses (Edgar, 2013; Rognes et al., 2016). To create an OTU × sample table containing read numbers, primer-trimmed paired sequences can be aligned to each OTU centroid sequence in the database. This step may require numerous parameters to be chosen such as the identity threshold, for example, 0.97, to retain sequences with at least 97% sequence similarity to an OTU centroid sequence.
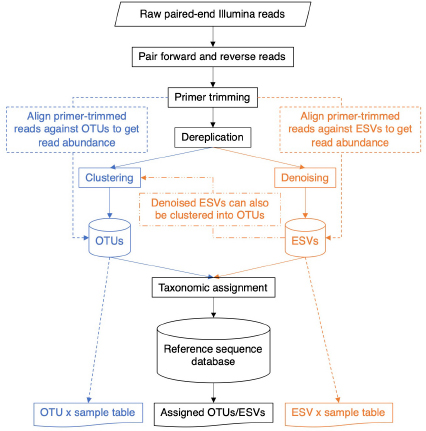
The exact sequence variant (ESV) denoising pipeline is shown in orange. In USEARCH or VSEARCH, the UNOISE3 algorithm performs denoising (Edgar, 2016) by clustering identical sequences together, similar to using an identity threshold of 1.0 to cluster sequences that have 100% sequence similarity. During this process, sequences with predicted sequence errors, putative PhiX carry-over from Illumina sequencing, putative chimeric sequences, and rare sequences are removed. Each denoised ESV is represented by a single sequence in any future analysis. To create an ESV x sample table containing read numbers, primer-trimmed paired sequences can be aligned to each unique ESV sequence in the database. This step may require numerous parameters to be chosen such as the identity threshold of 1.0 to retain sequences with at least 100% sequence similarity to a denoised ESV sequence.
Several metabarcode denoising programs have been compared and the USEARCH UNOISE3 algorithm was shown to be the fastest and DADA2 was found to generate the greatest number of ESVs (Callahan et al., 2016; Nearing et al., 2018). USEARCH is proprietary software with a free 32-bit version available and DADA2 is open source software. VSEARCH is another useful open source software program that allows you to use as much memory as your system supports to facilitate large analyses, and it can also run the UNOISE3 algorithm.
Metabarcode identification can be performed a number of ways using similarity-, phylogeny-, or composition-based methods (Porter and Hajibabaei, 2018c). One most popular method for high-throughput identification of large batches of COI metabarcodes is to perform BLAST comparisons against the GenBank nucleotide or other custom databases. We have developed the COI classifier v4 that uses a method initially developed to taxonomically assign rRNA gene sequences. This naive Bayesian classifier was trained on a curated set of COI sequences from BOLD and GenBank to make rapid, accurate taxonomic assignments (Altschul et al., 1997; Wang et al., 2007; Porter and Hajibabaei, 2018a). Recently, a python package called BOLDigger has been developed to help automate batch query submissions to the BOLD identification engine and can be used to identify COI, ITS, rbcL, and matK sequences (Buchner and Leese, 2020). For each of these methods, there are trade-offs in terms of ease of use, speed, and rigor. Users should carefully consider the output: Similarity-based methods provide a measure of how similar a query sequence is to a target sequence whereas taxonomic assignment methods provide a statistical measure of confidence for a taxonomic placement at each rank. Each of these approaches relies on comparing unknown metabarcode sequences against a reference sequence database of known sequences. The quality, coverage, and availability of these reference sequences can be quite varied for COI and other popular metabarcode markers and is discussed below (also see Table 1).
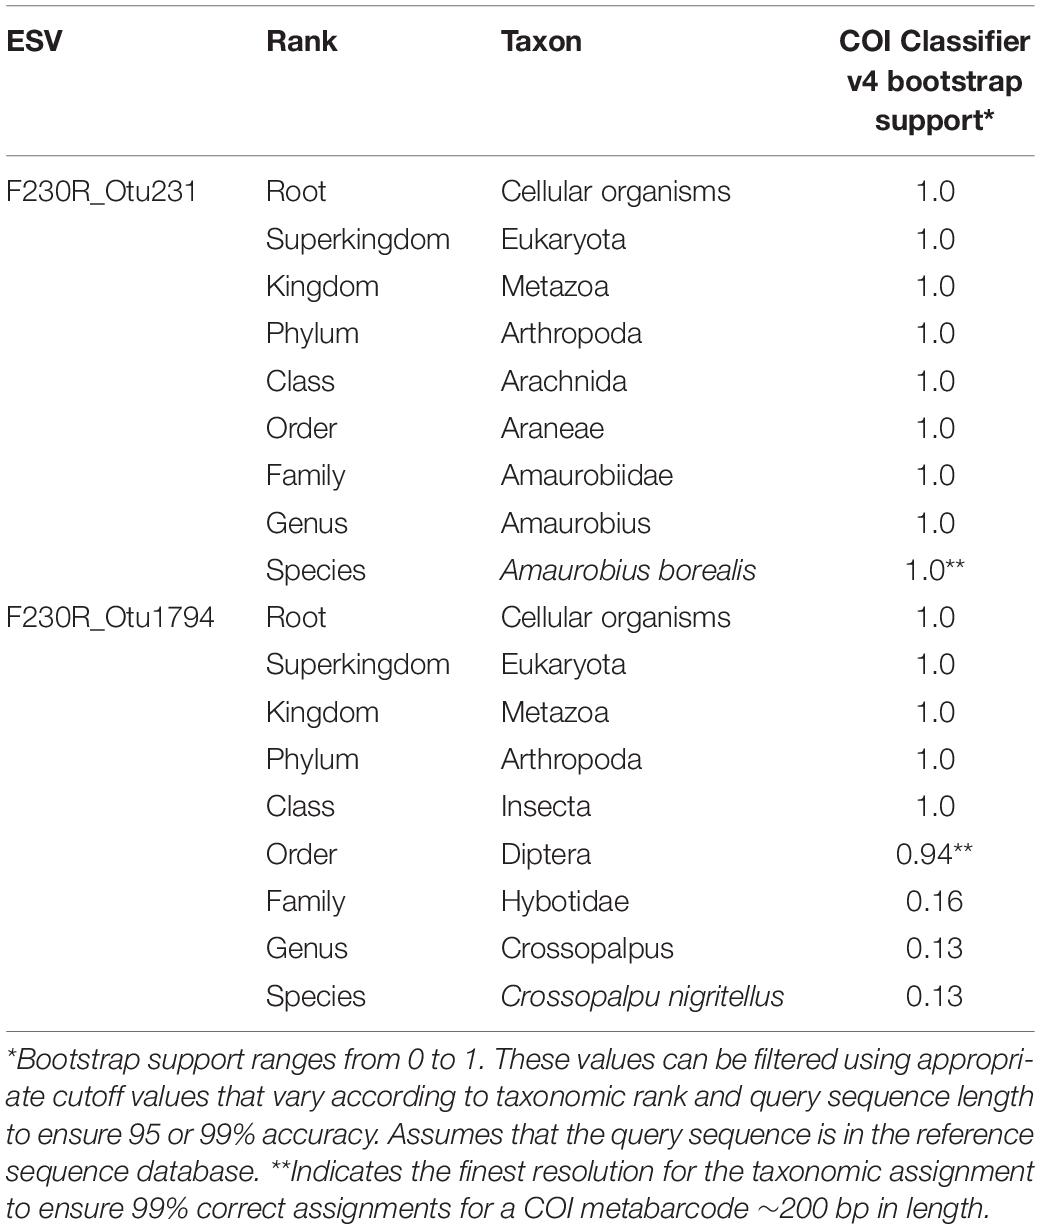
Table 1. Taxonomic assignment using the COI classifier produces a measure of statistical support at each rank.
The reasons for clustering metabarcodes may vary, but the result are two types of metabarcode clusters, operational taxonomic units (OTUs) or exact sequence variants (ESVs). OTUs, or molecular OTUs (mOTUs), represent a cloud of similar sequences whose composition may vary depending on the order of the sequences being clustered, making them difficult to reproduce and compare across studies (He et al., 2015). Any single OTU is usually represented by a single sequence, such as the centroid, and the remaining sequences in the OTU are disregarded in further analyses obscuring the underlying nucleotide variation within any single OTU. On the other hand, exact sequences variants (ESVs), also known as amplicon sequence variants (ASVs) (Callahan et al., 2017), zero-radius OTUs (Edgar, 2016), or simply error-corrected OTUs defined by 100% sequence identity, each represent sequence variation down to single-nucleotide resolution. To ensure high quality ESVs, steps need to be taken to remove artifactual sequences such as putative chimeras, sequences with predicted errors, and contaminants (Callahan et al., 2016; Edgar, 2016). We make the case here that ESVs are appropriate for analyzing metabarcodes from any taxon, from microbes to arthropods, using any marker from rRNA genes to COI. The advantages of using ESVs includes improved taxonomic resolution down to single nucleotides as well as improved reproducibility and comparability across studies that use the same marker (Callahan et al., 2017). In theory, ESVs are comparable to haplotypes used commonly in population genetics and phylogeography (Callahan et al., 2017) and are already starting to be treated as such in the COI metabarcoding literature (Elbrecht et al., 2018). In terms of reproducibility and comparability, it is relatively straightforward to align new reads using a 100% sequence similarity threshold to an ESV reference database. It is more complicated to align new reads to an OTU reference database because an arbitrary similarity threshold needs to be chosen or to regenerate OTUs from scratch since greedy algorithms are affected by sequence input order and may not generate OTUs with the same composition as before (He et al., 2015). For studies that require species estimates, fungal ITS or animal COI ESVs can be aligned to ITS SHs or COI BINs using a meaningful threshold for sequence similarity, say 97% sequence similarity. In the fungal literature, ESVs and OTUs were both shown to recover similar ecological patterns (Glassman and Martiny, 2018). In this paper, we show how the analysis of COI metabarcode clusters based on ESVs and OTUs affects biodiversity analyses (see next section).
After choosing whether metabarcode clusters will be based on OTUs or ESVs, it will be necessary to decide on which approach to take for taxonomically assigning or identifying the clusters. For assessing biodiversity, there is no need to limit analyses to only the portion of the dataset confidently identified to species. Instead, we recommend that metabarcode clusters are annotated to the most specific taxonomic rank possible. For example, the taxonomic lineage “Cellular Organisms; Eukaryota; Metazoa; Arthropoda; Arachnida; Araneae; Amarobiidae; Amarobius; Amarobius borealis; F230R_Otu231” represents an OTU identified to the species rank, Amarobius borealis; and the taxonomic lineage “Cellular Organisms; Eukaryota; Metazoa; Arthropoda; Insecta; Diptera; F230R_Otu1794” represents an OTU identified to the order rank. Using a taxonomic assignment method such as the COI Classifier v4, instead of a similarity-based method, can help to delimit the finest level of resolution that can be made with confidence (Table 1; Porter and Hajibabaei, 2018a). Filtering for bootstrap support values that exceed cutoff values can also help reduce the rate of false positive taxonomic assignments (Porter and Hajibabaei, 2018a). This may be an important consideration in cases where the cost of making a false-positive assignment is high, such as where falsely detecting an invasive species could be a cause for alarm. Methods that use a naive Bayesian classifier such as the RDP classifier, phylogenetic-based taxonomic assignment such as SAP, Bayesian multinomial regression such as PROTAX, or non-Bayesian k-mer based methods such as SINTAX each produce measures of confidence for taxonomic assignments for each rank (Wang et al., 2007; Munch et al., 2008; Huson et al., 2016; Somervuo et al., 2016). Some methods even take into consideration species that exist but may not have a reference sequence, new species, and mislabeled sequences (Somervuo et al., 2016, 2017).
How Does Cluster Method Choice Affect Diversity Analyses?
For biodiversity analyses, the choice between using ESVs or OTUs can affect recovered alpha diversity/richness (Hajibabaei et al., 2019). We reanalyzed the data from a study that used COI metabarcoding to assess invertebrates directly from forest soils and directly compared the data reanalyzed two ways: using denoised ESVs and using denoised ESVs clustered into OTUs with 97% sequence similarity (Porter et al., 2019; Box 4). Taxonomic assignments were made using a naive Bayesian classifier trained using a COI reference set (Wang et al., 2007; Porter and Hajibabaei, 2018a). Using this method, we were able to filter for taxonomic assignments to ensure 95% accuracy at the species rank and 99% accuracy at all other ranks. As expected, we detected greater number of unique ESVs (3,357) than OTUs (2,078) (Figure 1). We also, however, found a similar distribution in taxonomic assignment resolution with almost half the clusters being identified to species, and just over half resolved to more inclusive ranks from genus to order. In the original study, analyzing the data with ESVs or OTUs did not make a difference to our final conclusions, so the final data was presented using ESVs.
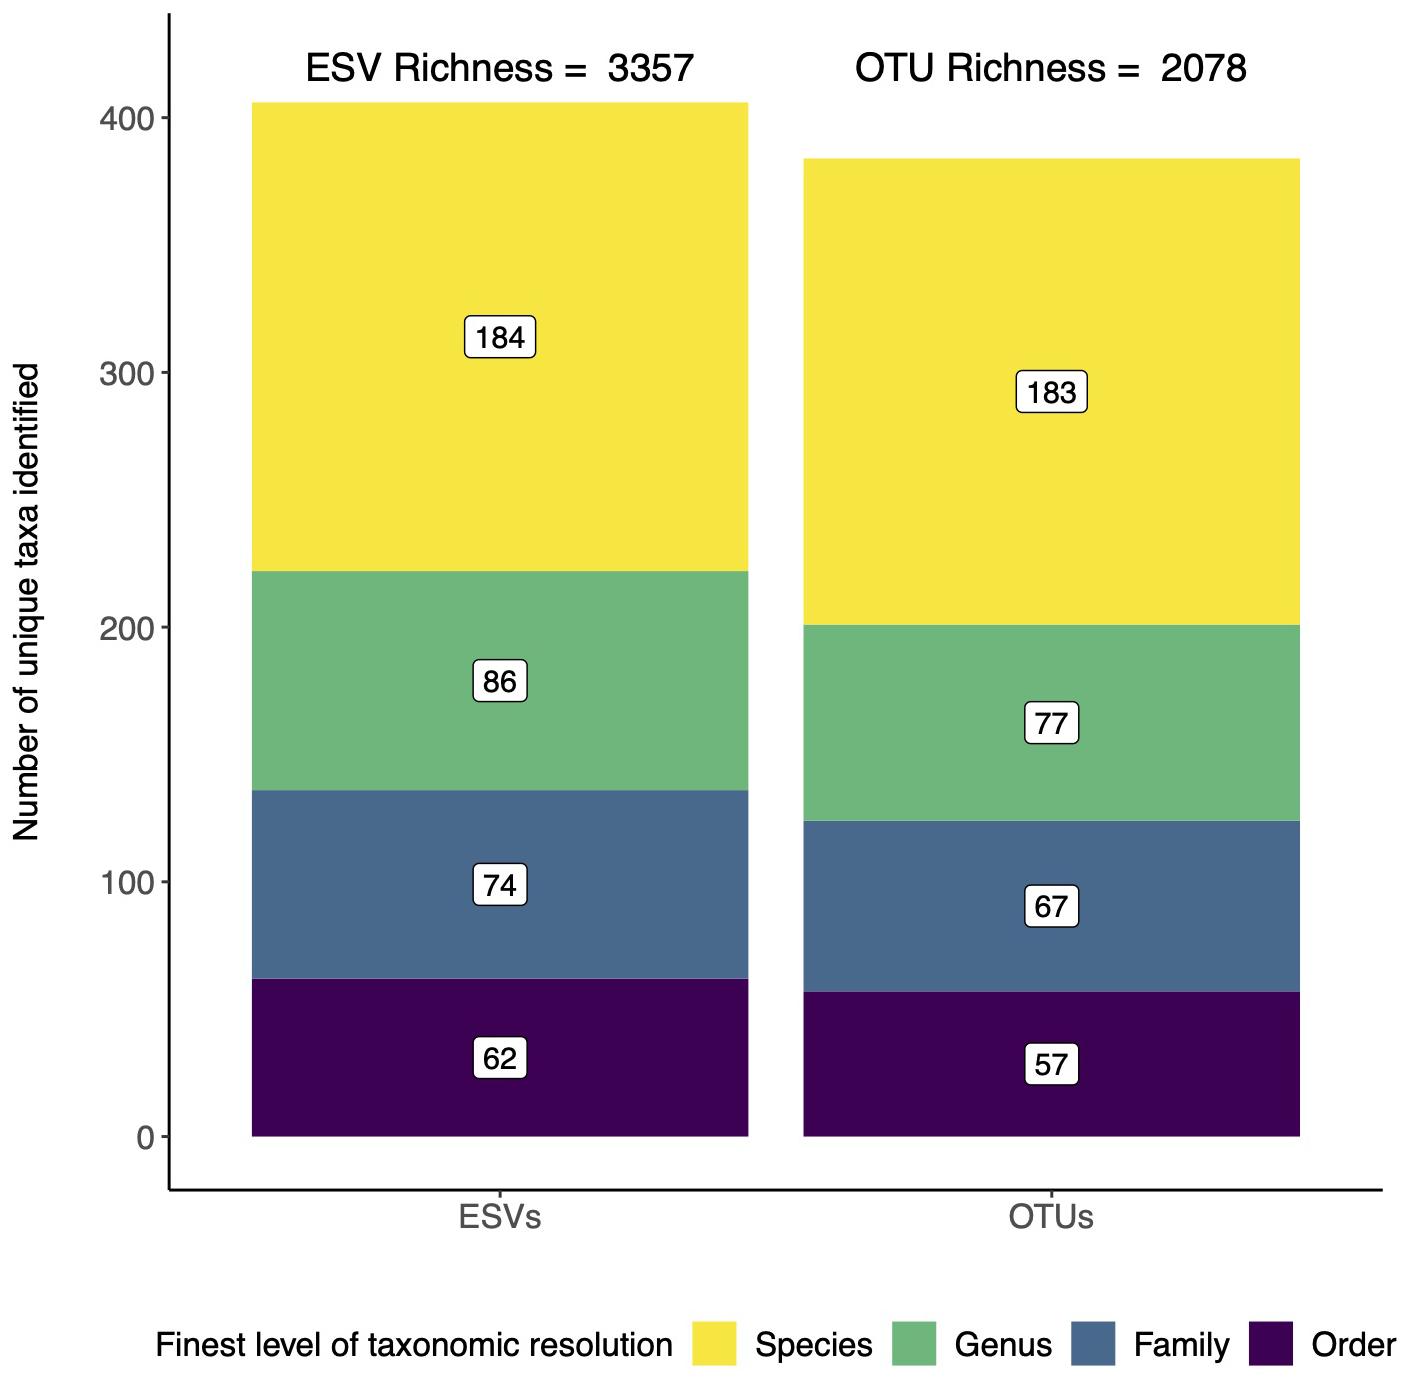
Figure 1. ESVs detect more unique taxa than OTUs, but both reveal similar patterns in taxonomic resolution. Data is from a study that assessed arthropod diversity using COI metabarcoding of forest soil (Porter et al., 2019). The data was analyzed twice, first using denoised exact sequence variants (ESVs) and second using denoised ESVs that were clustered into operational taxonomic units (OTUs) based on 97% sequence similarity.
We also assessed whether community composition patterns were affected by the use of ESVs or OTUs (Figure 2). The top 10 most abundant taxa are found in similar proportions whether the data are analyzed according to ESVs or OTUs. Again, in the original study, the analysis of ESVs or OTUs showed similar patterns and the final results were shown using ESVs. The taxonomic resolution of these results are typical of most studies, where many sequence clusters cannot yet be assigned to the species rank with confidence, and indicate where to target additional barcoding efforts. This is especially important for geographic locations that are poorly sampled, where diversity is high, and where the reference database is incomplete.
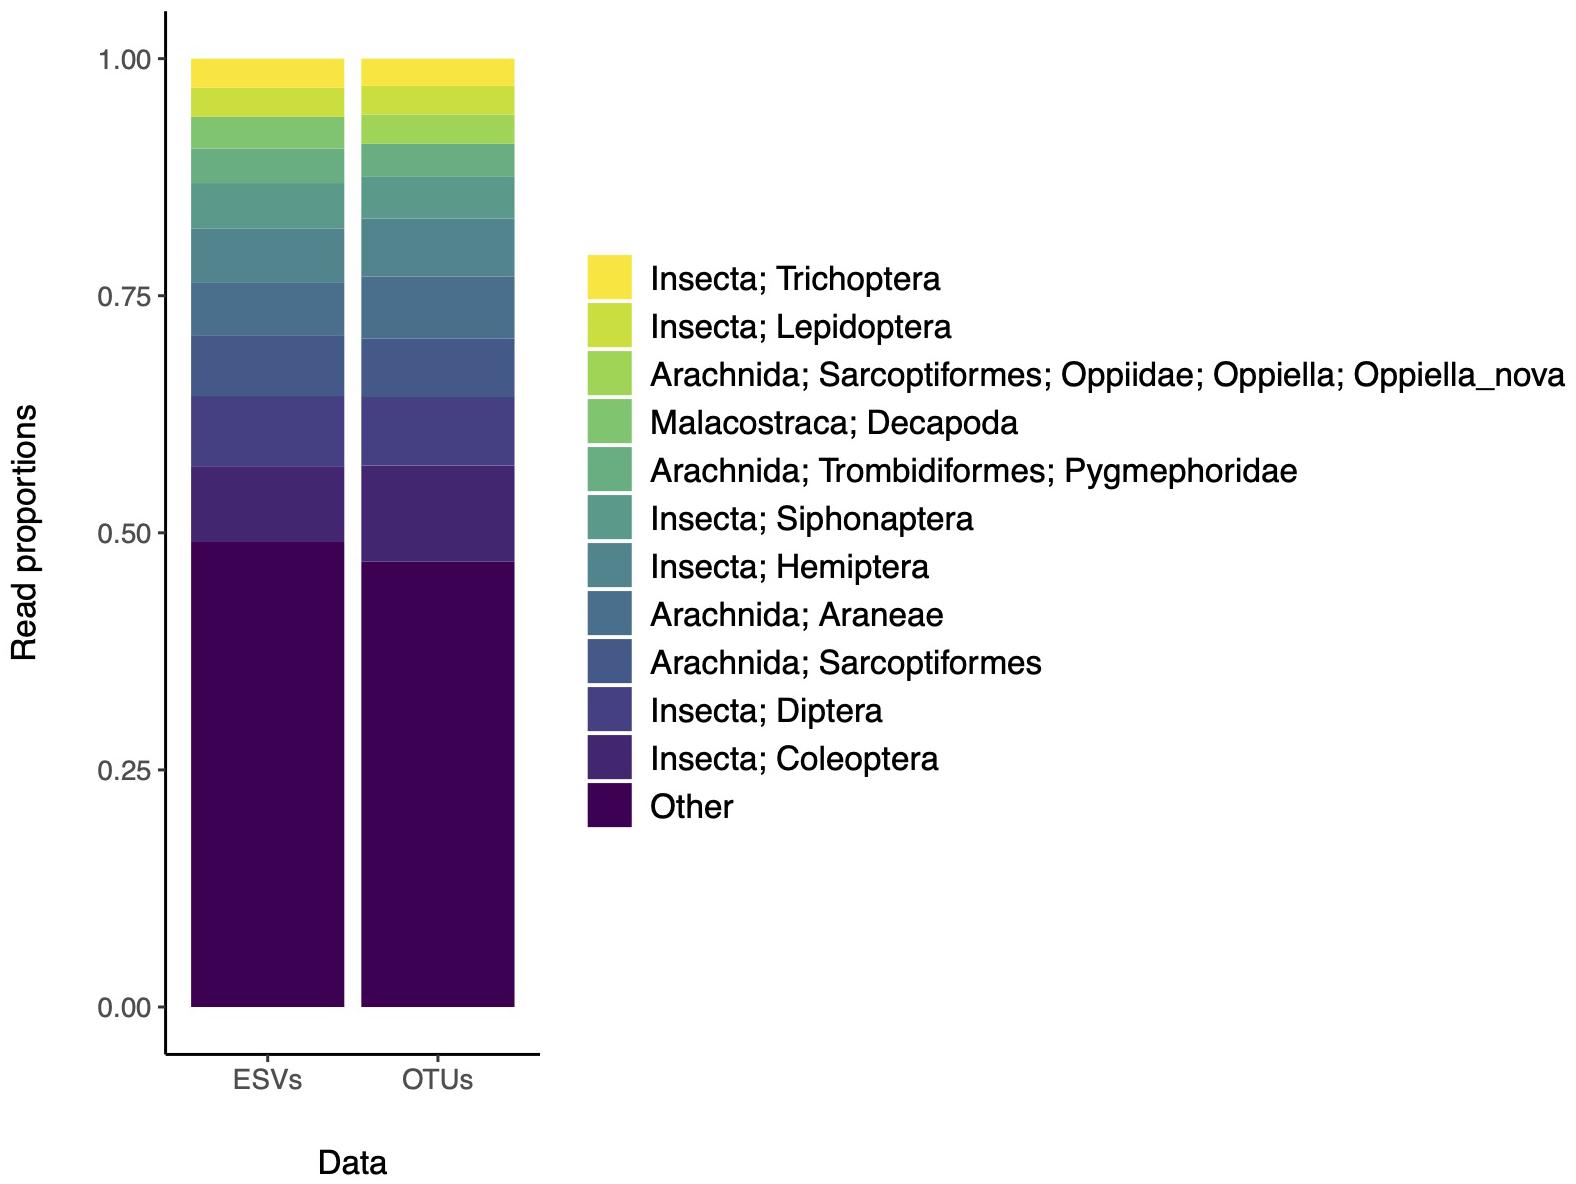
Figure 2. The most abundant recovered taxa based on ESVs or OTUs are similar. Data is from a study that assessed arthropod diversity using COI metabarcoding of forest soil (Porter et al., 2019). The top 10 most abundant taxa are color coded according to the legend. Remaining clusters are binned into the “Other” category.
Both richness and community composition can be assessed based on metabarcoding data generated using a single primer set, but how would these results be affected if the primers were found to be biased in some way? Some of the early microbiome literature used only a single primer set to produce single amplicon datasets, and this has facilitated large scale studies and brought a measure of standardization to the field (Gilbert et al., 2014; Thompson et al., 2017). There are many examples, however, showing the effect of primer bias for a variety of commonly used metabarcoding primers (Hong et al., 2009; Bellemain et al., 2010; Clarke et al., 2014; Gibson et al., 2014; Elbrecht et al., 2019; Hajibabaei et al., 2019). There is also difficulty in designing “universal” COI primers to capture broad swaths of phylogenetic diversity and a switch to a multi-marker approach has been proposed for assessing animal diversity (Deagle et al., 2014). In the microbiome literature, there has been a shift to the use of PCR-free metagenomic methods to both avoid PCR-bias as well as to aid in quantitative assessments (Nayfach and Pollard, 2016). PCR-free methods have also been proposed to study terrestrial arthropod biodiversity, but these approaches are not often used due to cost and technical challenges for application in large scale studies (Zhou et al., 2013; Shokralla et al., 2016). For now, the most cost-effective approach to capture a wide array of phylogenetic diversity using COI metabarcoding is to use multiple primers sets.
To look at the effect of primer bias, we reanalyzed the data from a study that used 6 different COI metabarcode amplicons to sample arthropods from freshwater kick net samples (Hajibabaei et al., 2019). This study includes two COI amplicons that we have routinely used in our own work to survey freshwater macroinvertebrates, BR5 (B/ArR5) and F230R (LCO1490/230_R) (Folmer et al., 1994; Hajibabaei et al., 2012; Gibson et al., 2014, 2015); a primer set designed for marine taxa but has been shown to perform well for detecting arthropods in other environments, ml-jg (mlCOIintF/jgHCO2198) (Geller et al., 2013; Leray et al., 2013); as well as a few other recently published primer sets that look promising for macroinvertebrate biomonitoring, BF1R2 (BF2/BR2), BF2R2 (BF2/BR2) (Elbrecht and Leese, 2017), and fwh1 (fwhF1/fwhR1) (Vamos et al., 2017). Taxonomic assignments were carried out as described above using the naive Bayesian classifier and summarized to the family rank where possible. Read number was normalized across each amplicon using rarefaction to account for differences in library size. We compared the results for each COI amplicon and found similarities among taxa represented by the greatest number of reads and many differences among taxa represented by fewer reads (Figure 3). Binary data was also used to create a Jaccard dissimilarity matrix to generate the UPGMA dendrogram clustering the COI amplicons. Community dissimilarities across amplicons ranged from 32 to 56%, with the community detected by ml-jg and BF1R2 being the most similar. The number of unique taxa detected by each amplicon ranged from 44 to 65, with the highest number of unique taxa detected by BF1R2. The total number of unique taxa detected by all 6 COI amplicons was 109. It is clear from our example that taxa represented by the greatest number of reads tend to be similar across amplicons, but combining the results from multiple amplicons improves the overall recovery of the greatest diversity of taxa. In the original study, we showed that using at least two COI amplicons from this set of six could detect most species, genera, and families. Previous work has used in silico PCR using ITS primers to detect fungi (Bellemain et al., 2010) and mock community studies in bacterial (Brooks et al., 2015) and terrestrial arthropod communities (Elbrecht et al., 2019) to demonstrate the effect of PCR bias. Here we show the effect of primer bias on a real community with realistic complexity and template background.
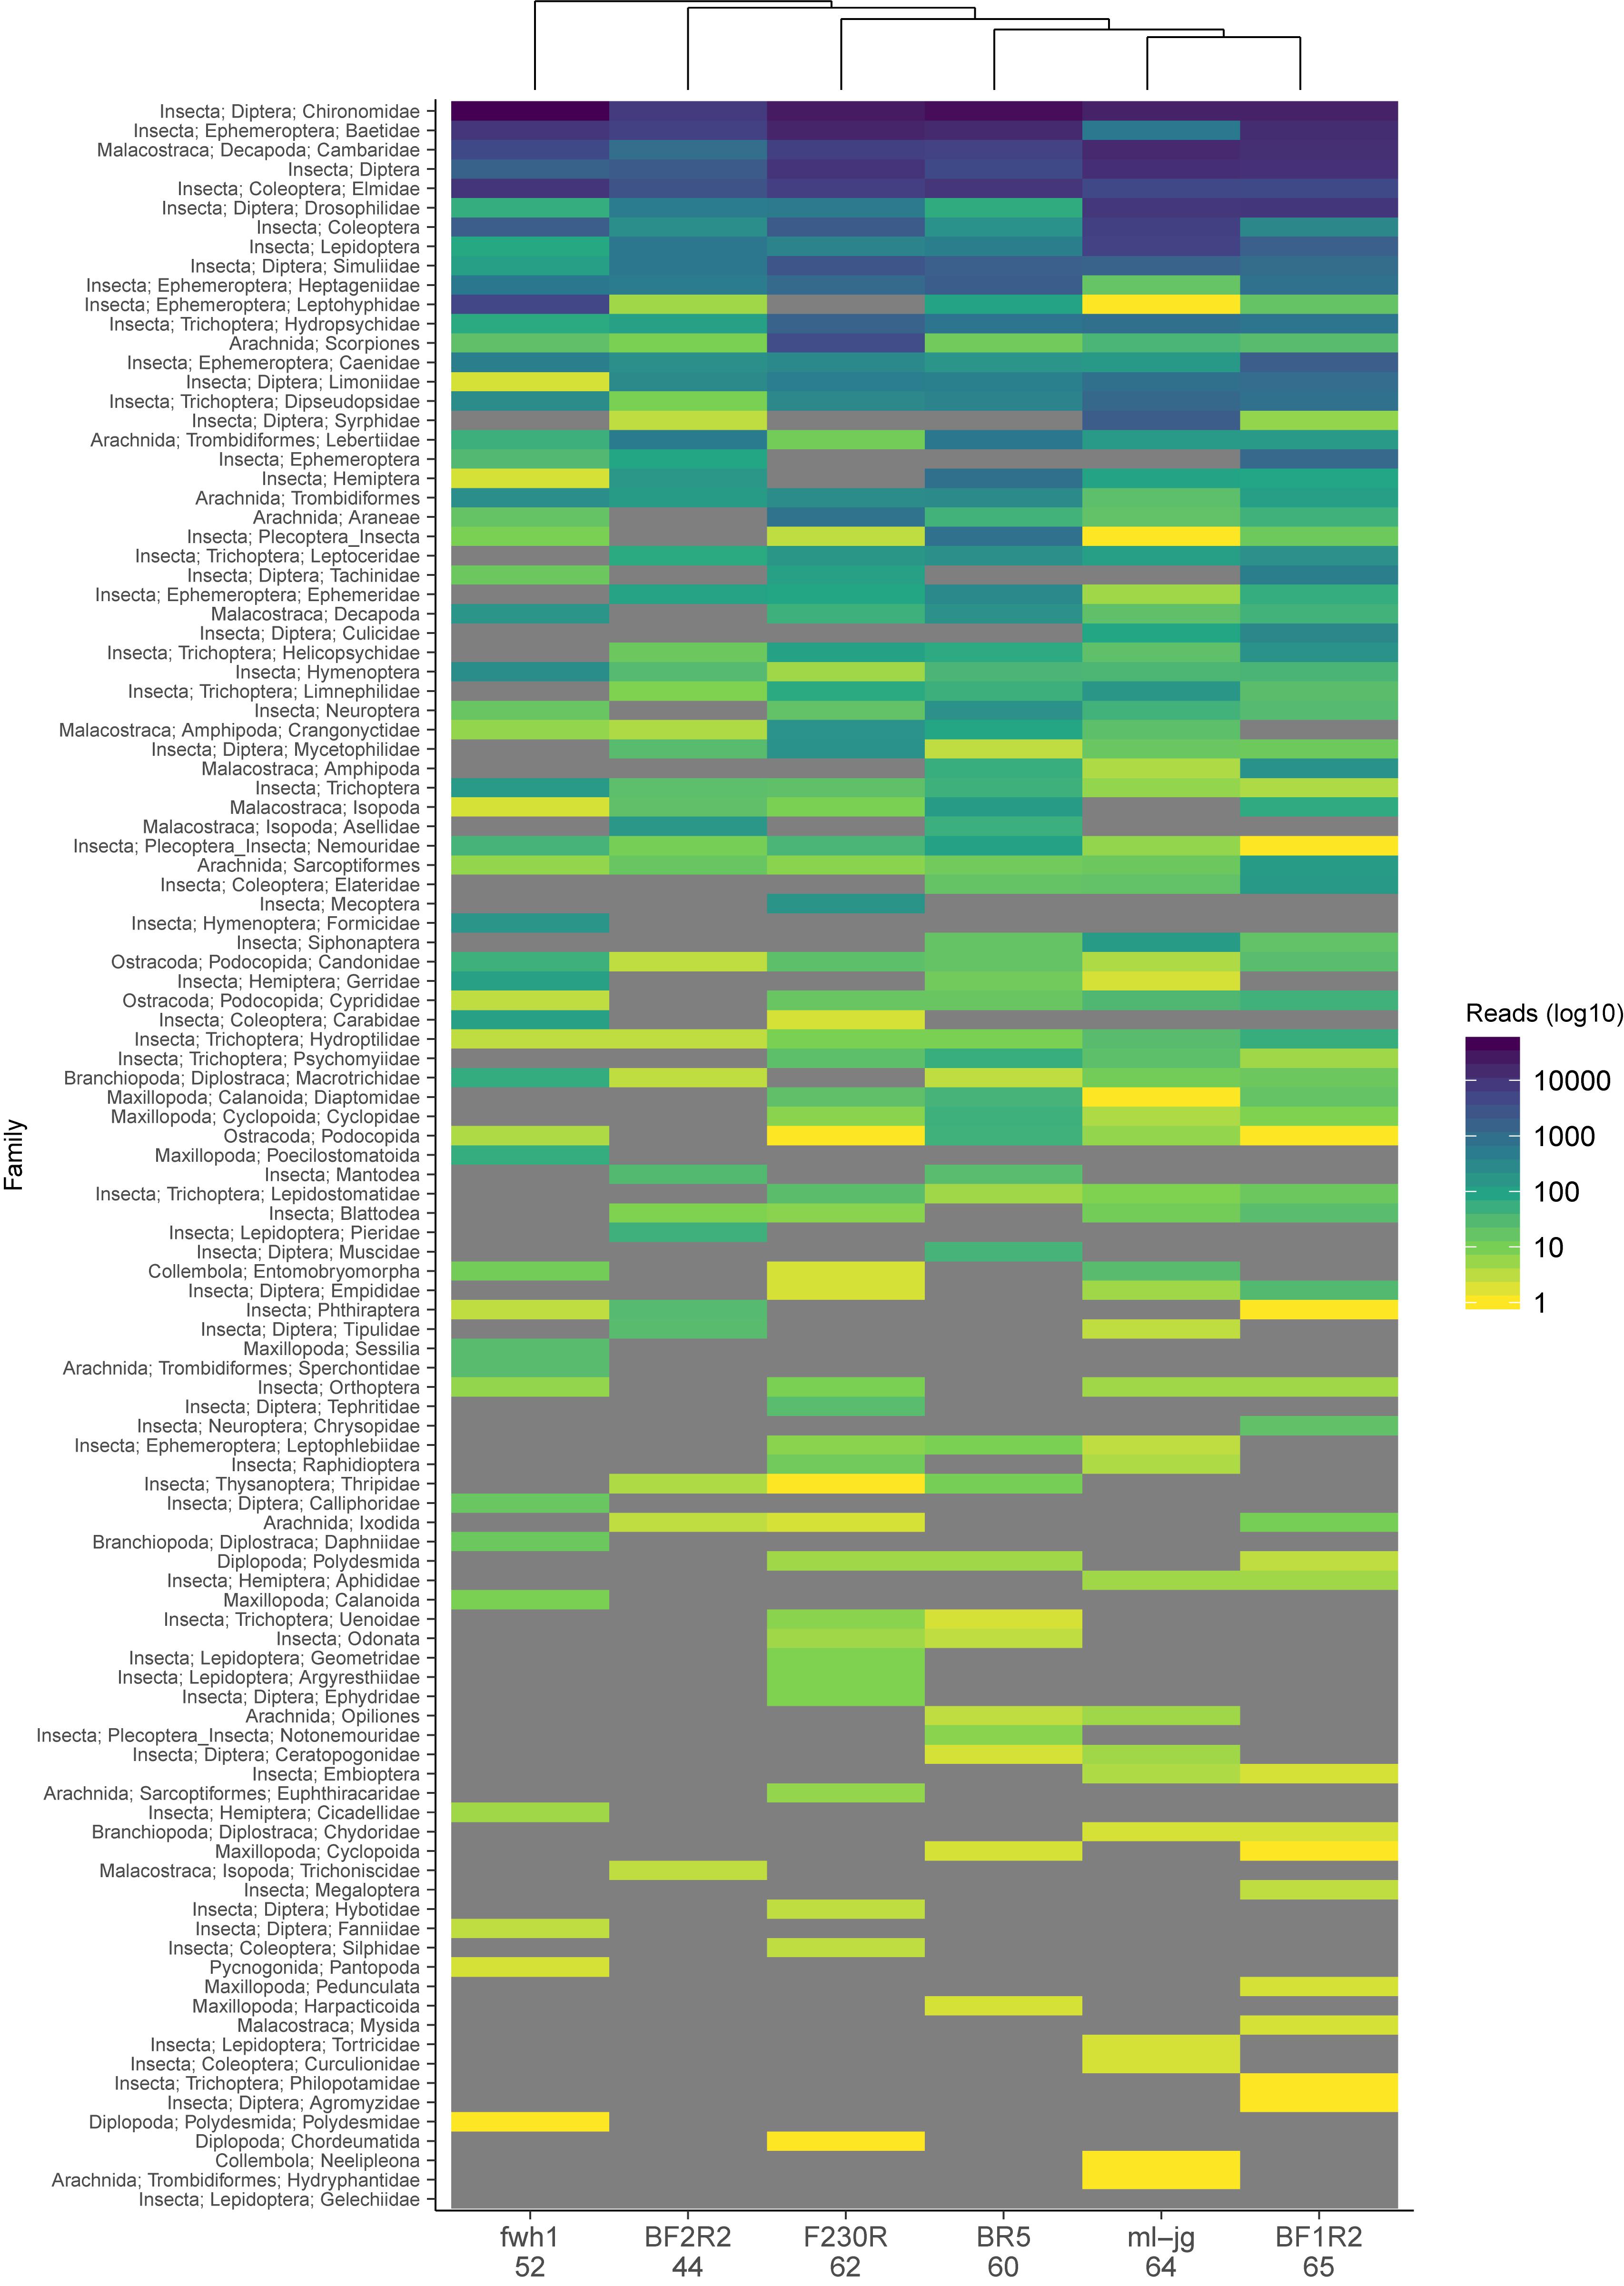
Figure 3. Observed community composition can vary based on choice of COI amplicon. Data is from a study that assessed arthropod diversity using COI metabarcoding of 6 amplicons from freshwater kick net samples (Hajibabaei et al., 2019). Number of unique taxa detected from each primer set is indicated below the COI amplicon name on the x-axis. Results are based on ESVs whose taxonomic assignments have been summarized to the family rank where possible on the y-axis and ordered by decreasing read number (see legend). A UPGMA dendrogram is shown above the heatmap, indicating which amplicons recover communities that are most similar to each other. Fields in “gray” indicate that zero reads were detected.
We have shown that alpha diversity, richness, is sensitive both to choice of metabarcode cluster type and primer choice, but what does this mean for beta diversity? For arthropods sampled using COI metabarcoding from freshwater or soil samples, beta diversity assessments have been shown to be robust to both variations in primer choice and sampling method (Hajibabaei et al., 2019; Porter et al., 2019). Does this hold true for differences in clustering strategy and resolution of the matrix? In our research we have found that beta diversity estimates are robust to the use of either ESVs or OTUs (Figure 4). The difference between ordinations based on ESVs and OTUs is minimal, and the site and soil layer groupings are visually distinct using either sequence cluster type. In the original study, clustering patterns observed from NMDS plots and permutational analysis of variance (PERMANOVA) results were not affected by the analysis of ESVs or OTUs. As a result, we prefer the use of ESVs over OTUs to improve reproducibility, facilitate comparisons across studies, and permit within-species analyses.
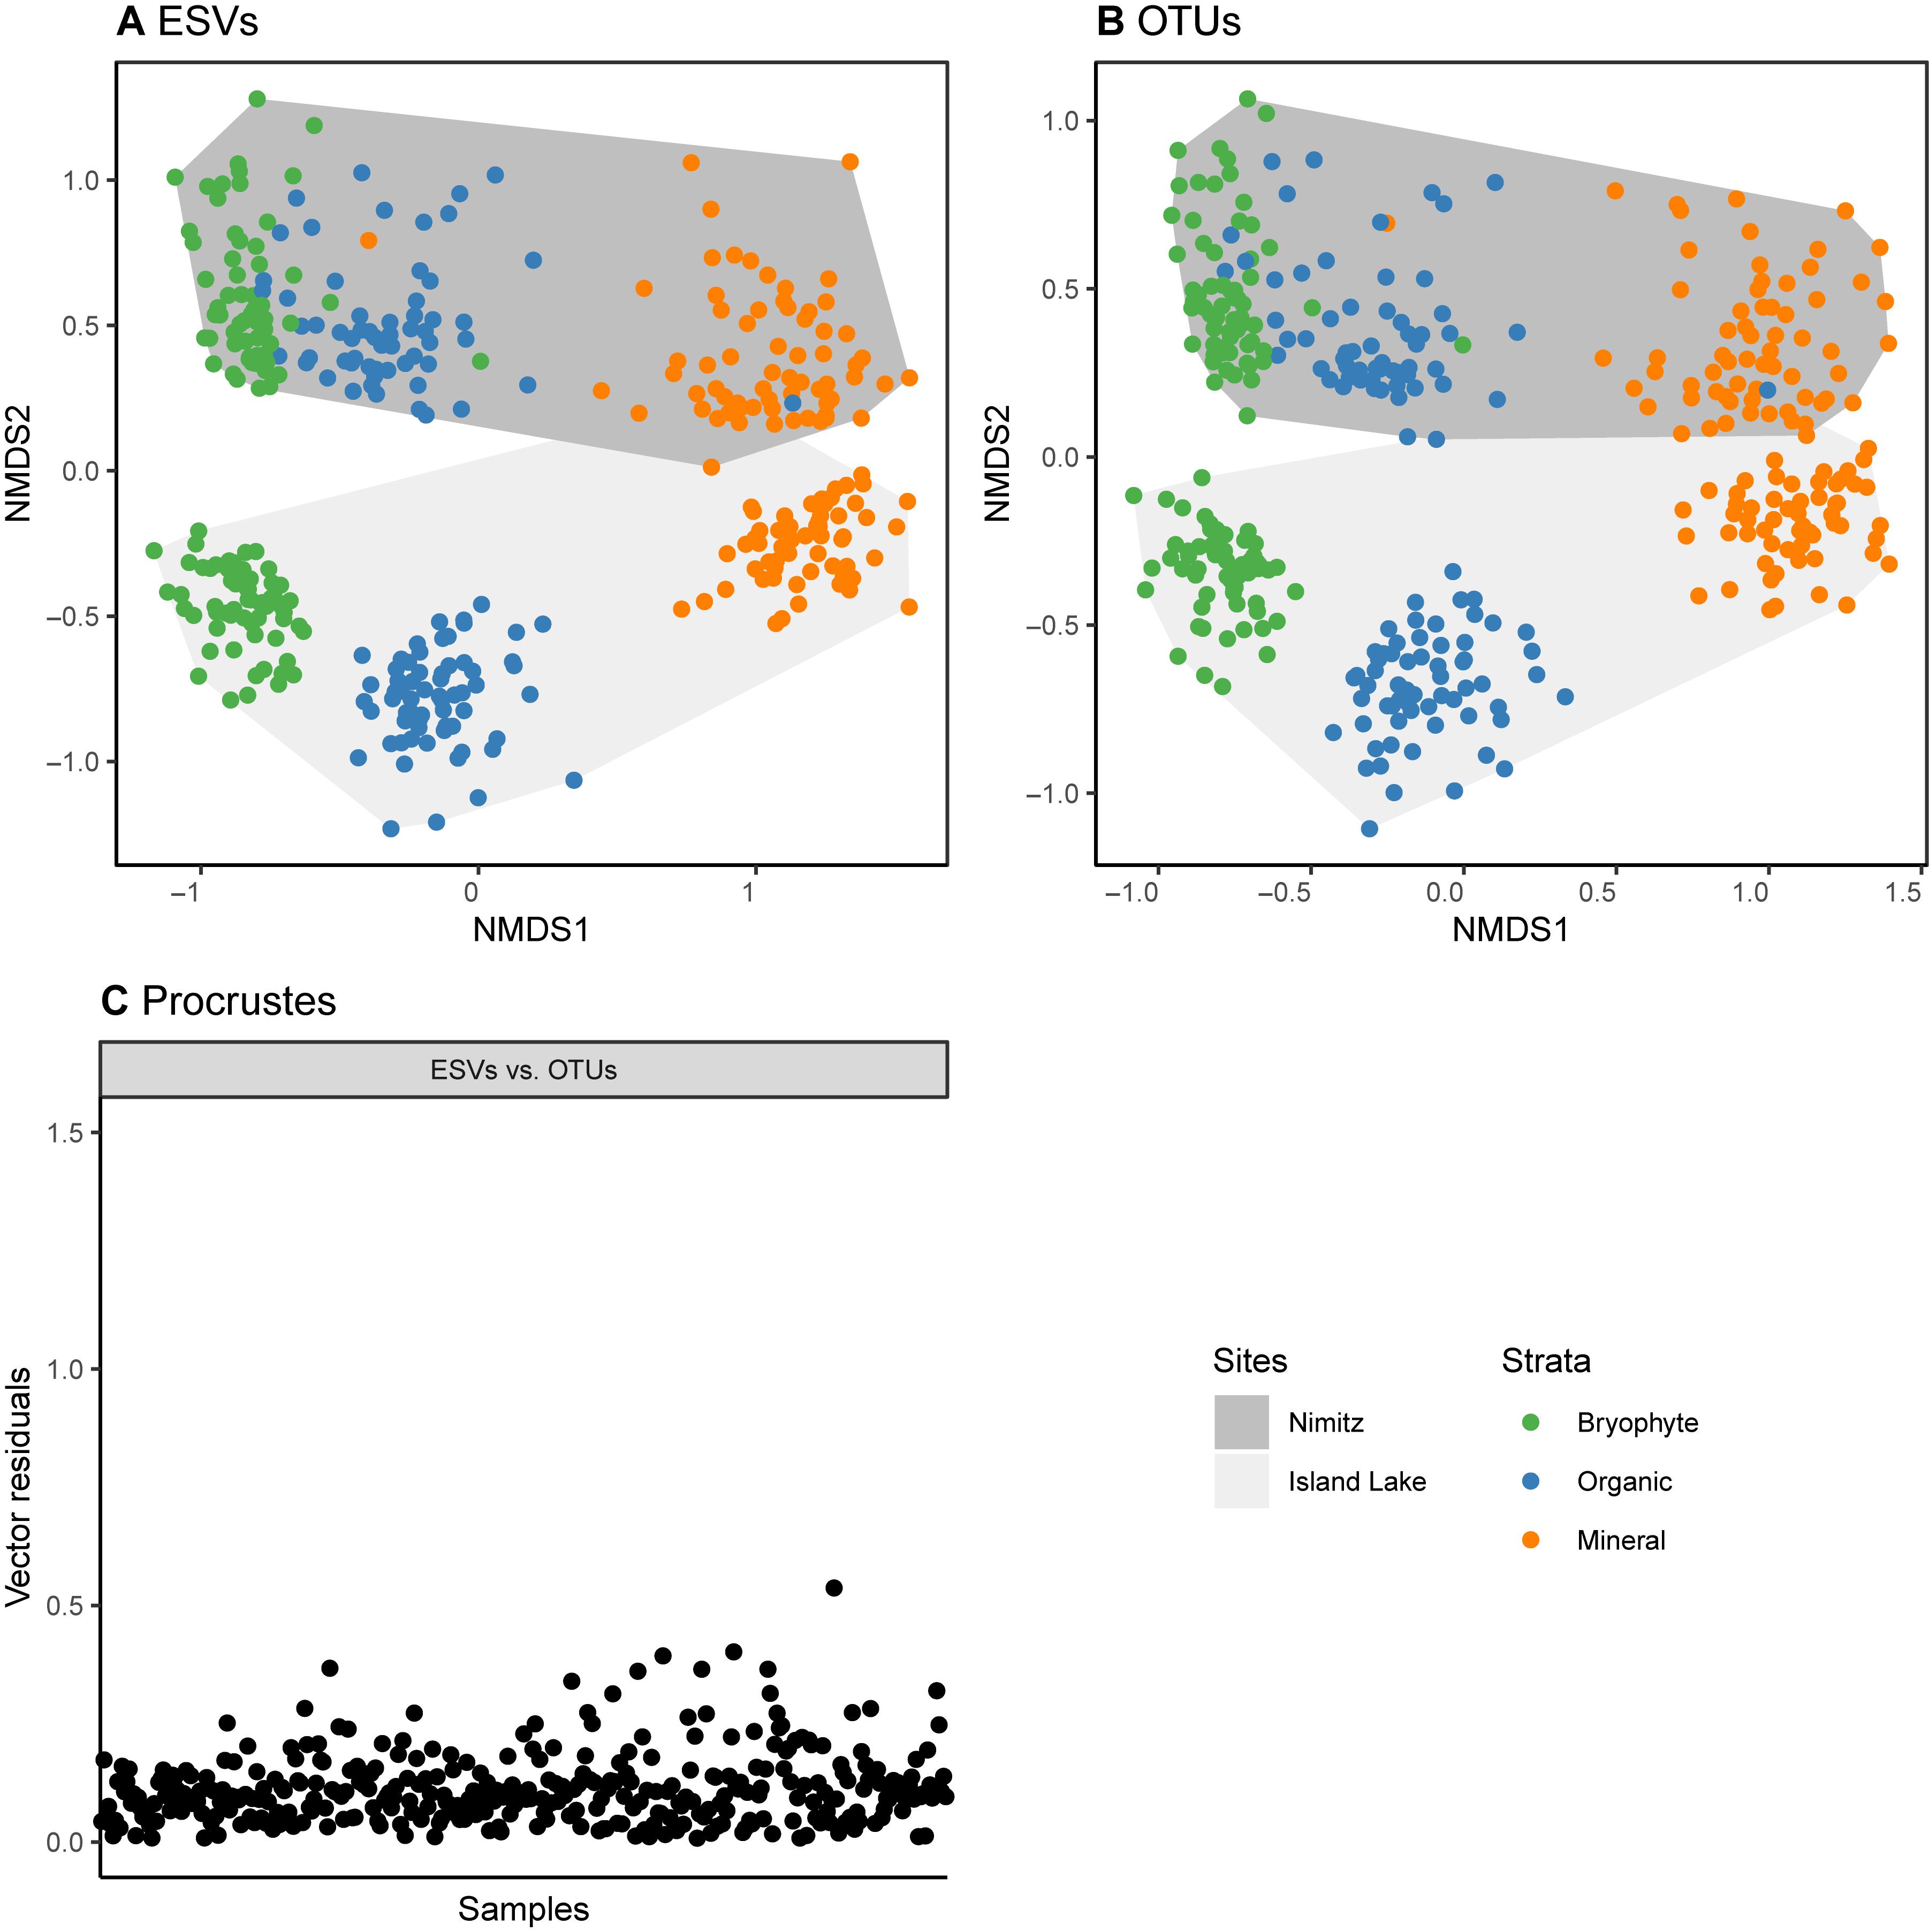
Figure 4. Sample sites and soil strata are similarly distinguished using either ESV or OTU clusters. Data is from a study that assessed arthropod diversity using COI metabarcoding from forest soil (Porter et al., 2019). Parts (A,B) show that non-metric multidimensional scaling plots based on binary Bray Curtis (Sorensen) dissimilarities. A Procrustes analysis (least squares orthogonal mapping) was used in part to assess differences in the ordinations based on the analysis of ESVs and OTUs. The vector residuals plotted in (C) show the differences between the original ESV ordination and the OTU ordination. Smaller residuals indicate smaller differences between the ordinations.
How Can We Leverage Taxonomic Coverage Across Reference Databases?
The composition, quality, and completeness of reference sequences databases determines our ability to identify unknown specimens using DNA barcodes and metabarcodes. BOLD has become the canonical COI reference sequence database, with official DNA barcode sequences available for download through data releases available from https://www.boldsystems.org/index.php/datarelease. The BOLD system also contains sequences mined from GenBank as well as private data that is available for comparison when using the BOLD identification engine (Ratnasingham and Hebert, 2007). Recently an R package was released that facilitates mining BOLD data; however, it can still be challenging to retrieve large amounts of data at one time, for example, the entire reference database of all arthropoda (Chamberlain, 2019). The NCBI nucleotide database, GenBank, has accumulated over 2.5 million COI sequences since the advent of the DNA barcoding initiative in 2003 (Hebert et al., 2003; Benson et al., 2012; Porter and Hajibabaei, 2018b). Since BOLD has a policy of depositing DNA barcodes in GenBank, much of the public BOLD data is also available through GenBank. Neither BOLD nor GenBank, however, is entirely complete, and each database provides complementary taxonomic coverage as has been shown for Canadian freshwater invertebrates (Curry et al., 2018). Combining these databases would improve both sequence and taxonomic coverage. Making the merged reference data available in plain text formats would make it relatively straightforward to reformat so they can be used as the basis for alternative taxonomic assignment tools such as those that provide rank-flexible statistical measures of confidence. For example, the BOLD_NCBI_Merger script provides a means to combine data from BOLD and the NCBI nucleotide database for use with MEGAN (Huson et al., 2016; Macher et al., 2017). Our own approach has been to update the underlying reference sequence database used by the COI classifier v4 to combine data from BOLD and GenBank, and it is available from https://github.com/terrimporter/CO1Classifier (Wang et al., 2007; Porter and Hajibabaei, 2018a). We demonstrate the improved taxonomic composition when COI reference sequences from the BOLD data releases are combined with COI sequences mined from GenBank (Figure 5). The combined reference set is available as a FASTA file as are the trained files needed to use these reference sets with the naive Bayesian classifier.
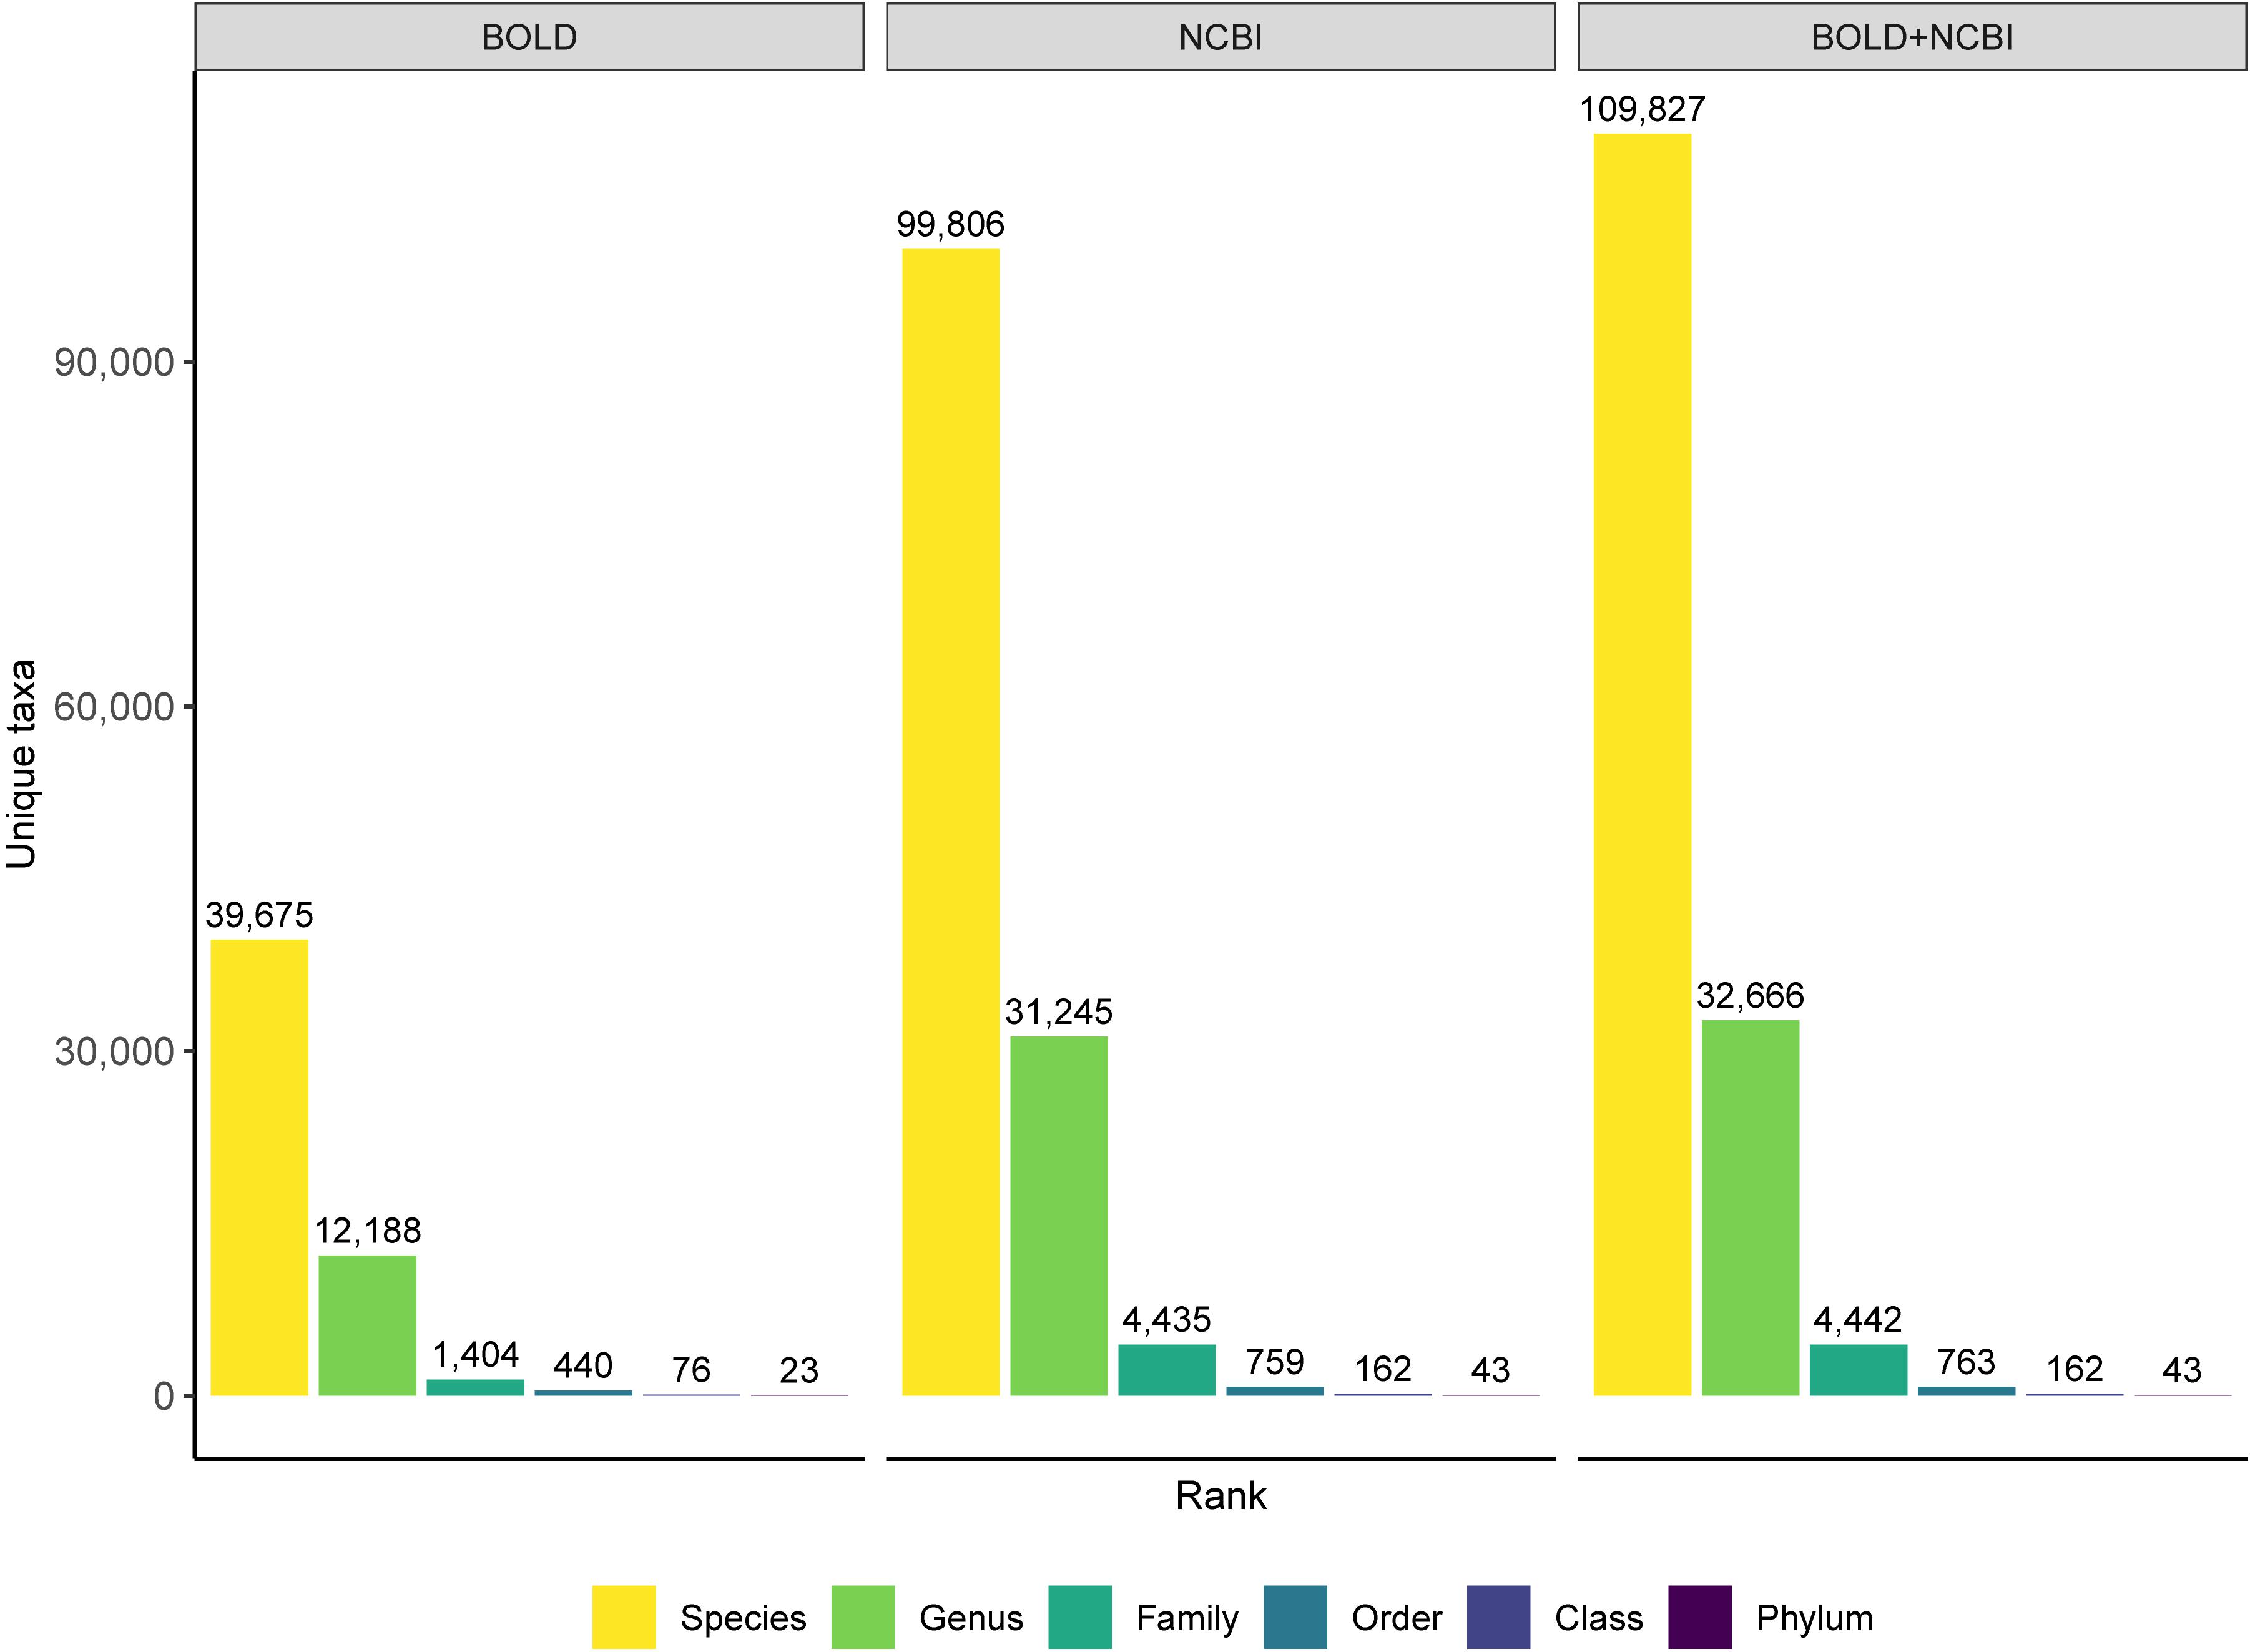
Figure 5. Merging COI sequences from the BOLD and NCBI nucleotide database improves taxonomic coverage. Comparison of high-quality eukaryote COI reference sequences at a variety of ranks. Data is based on the BOLD data releases (no more than 3 Ns in the barcode sequence and at least 500 bp long), the NCBI nucleotide database accessed April 2019 (no Ns, at least 500 bp long, human and bacterial contaminants removed), and the combined database released in the CO1 Classifier v4 that merges data from BOLD and GenBank.
We have mainly focused on using a single marker, such as COI for animal metabarcoding, but the field has progressed such that investigators are now using multi-marker approaches (Drummond et al., 2015) to conduct food web studies or comprehensive biodiversity monitoring across phylogenetically diverse taxa. As such, we should be aware of tools available for analyzing other widely used metabarcoding markers (Table 2). The largest source for reference sequence information is through the International Nucleotide Sequence Database Collaboration (INSDC) comprised of the NCBI (GenBank, Short Read Archive), EMBL-EBI, and DDJB. In North America, most users are familiar with GenBank, a repository for marker gene sequences (also see European Nucleotide Archive and DDJB), and the Short Read Archive (SRA) where raw metabarcode reads are stored. For COI barcodes, public data in BOLD is automatically transferred to GenBank, and additional barcode sequences are retrieved from GenBank to complement the BOLD database. Multi-marker or genome projects focused on particular taxonomic groups are also valuable sources of reference sequence information. For example, DNA barcodes found to be most useful for diatom identification includes 18S, 28S rDNA, internal transcribed spacer 2 (ITS2), rbcL cpDNA, and COI mtDNA and are available through the Diat.barcode library (Chaumeil et al., 2018; Rimet et al., 2019). Additionally, though COI DNA barcodes are readily available for fish identification (Becker et al., 2011; Weigand et al., 2019), 12S mtDNA has a history of use for vertebrate detection (Kitano et al., 2007; Sato et al., 2018). Throughout the course of our own work, we have mined existing databases and created our own curated reference sets reformatted to work with a naive Bayesian classifier to make rank-flexible taxonomic assignments with a statistical measure of confidence (Table 3). Each of these curated datasets are also available as FASTA files. These resources show how the field of eukaryote metabarcoding is diversifying to use multiple markers and support a variety of taxonomic assignment methods.
Table 2. Reference sequence databases useful for taxonomically assigning metabarcodes.
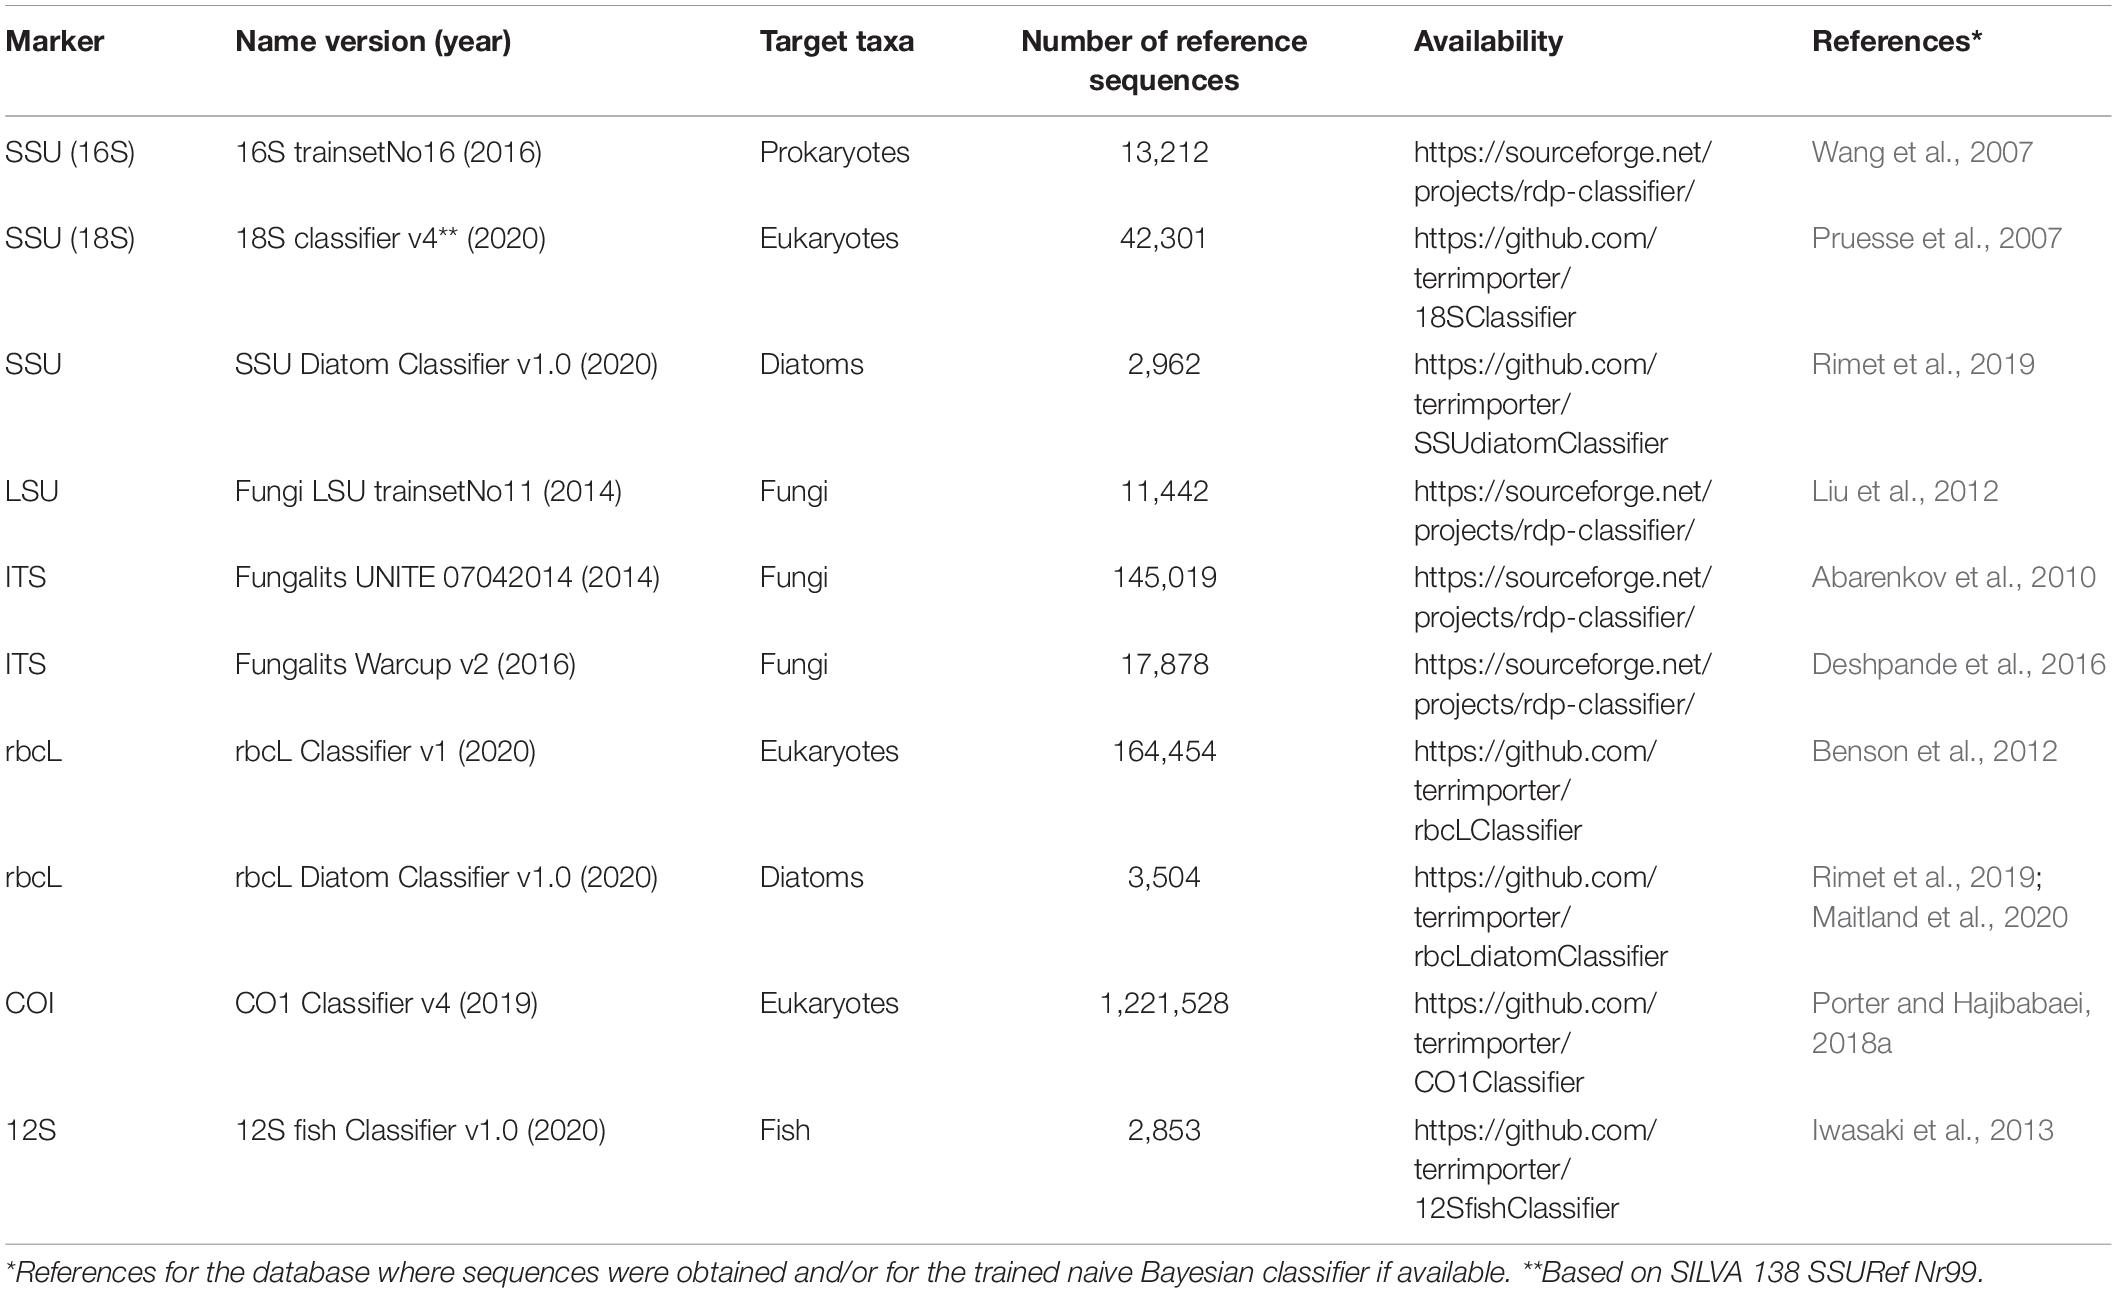
Table 3. Curated reference sequence databases specifically formatted to work with the RDP naive Bayesian classifier.
Choosing a database for any given DNA barcode or marker often comes down to one’s preferred species concept, database coverage, as well as the availability and ease-of-use of related tools. The NCBI database is the primary source of raw sequence data for most of the databases listed in Table 2. What makes each of the rRNA gene databases unique, however, is that they filter the data using their own quality control standards, and they follow their own taxonomic roadmap (Balvočiūtë and Huson, 2017). For example, a phylogenetic species concept is often preferred in microbial ecology where taxa are challenging to study and describe using traditional methods and undescribed environmental diversity is exceedingly high. In this case, both Greengenes and SILVA assume that trees based on available SSU sequences reflect evolutionary relatedness, and any taxonomic inconsistencies are resolved to make classification consistent with phylogeny. The RDP, however, follows Bergey’s classification system (Cole et al., 2014). When the goal is to identify unknown environmental sequences from metabarcode sequences, the so-called “dark taxa,” the microbial and fungal communities have come up with their own methods. For prokaryotes, the GTDB includes metagenome assembled genomes (MAGs) represented in their database (Chaumeil et al., 2019). The RDP, SILVA, and Greengenes databases each contain many environmental sequences for comparison, but the taxonomic assignment can be based on different criteria using an algorithm (RDP) or phylogenetic placement and manual curation (SILVA, Greengenes). For fungi, the UNITE database has made a concerted effort to incorporate fungal dark taxa in their SHs and have introduced Taxon Hypotheses (THs) to allow for the communication of SHs using different classification schemes at the same time (Nilsson et al., 2019). If a fungal or animal study requires species estimates, then using a database that attempts to approximate species using fungal SHs or animal COI BINs may be preferred. For studies where few taxa can be confidently identified, using a large database that includes environmental sequences will provide the most coverage, and using a method that provides a statistical measure of confidence can allow the user to adjust for the recovery of false negatives or false positives according to the study aims (Edgar, 2018a).
Concluding Remarks
Over the last 15 years the use of standardized DNA-based biodiversity markers such as DNA barcodes has become a routine practice in various scientific and socioeconomic endeavors. A much wider spatiotemporal biodiversity perspective is now achievable through bulk analysis of metabarcodes. Our ability to fully identify metabarcodes from particularly diverse taxonomic groups or samples may be currently limited, but with continued DNA barcoding efforts these databases are expected to become more representative over time. Insufficiently identified sequence clusters, those not confidently identified to the species rank, can still be used for biodiversity analyses including richness assessment, community composition, and beta diversity assessments. For improved reproducibility, comparison across studies, and nucleotide-level resolution, we encourage the use of ESV level analyses. For studies that require species estimates, we suggest aligning ESVs to fungal ITS SHs or animal COI BINs which both attempt to approximate species units. If representative BIN sequences were made available in an easily parsed format, this would allow taxonomic assignments to be made using tools outside the BOLD system built-in barcode identification engine and would allow inclusion in metabarcode bioinformatic pipelines that are already widely used for analyzing large metabarcode datasets. COI metabarcoding offers a sophisticated toolset and reference databases suitable for large scale studies; as such, it is now firmly established as a marker for animals in molecular ecological and biodiversity studies.
Data Availability Statement
Code used to generate figures is available on GitHub from https://github.com/terrimporter/PorterHajibabaei2020_ESVs_vs_OTUs.
Author Contributions
MH conceived of the idea. TP and MH wrote and edited the manuscript. TP generated the figures. Both authors contributed to the article and approved the submitted version.
Conflict of Interest
The authors declare that the research was conducted in the absence of any commercial or financial relationships that could be construed as a potential conflict of interest.
Acknowledgments
We would like to thank the Hajibabaei group for their support and collaboration. This study is funded by the Government of Canada through Genome Canada and Ontario Genomics.
References
Abarenkov, K., Nilsson, R. H., Larsson, K.-H., Alexander, I. J., Eberhardt, U., Erland, S., et al. (2010). The UNITE database for molecular identification of fungi – recent updates and future perspectives. New Phytol. 186, 281–285. doi: 10.1111/j.1469-8137.2009.03160.x
Altschul, S. F., Madden, T. L., Schaffer, A. A., Zhang, J., Zhang, Z., Miller, W., et al. (1997). Gapped BLAST and PSI-BLAST: a new generation of protein database search programs. Nucleic Acids Res. 25, 3389–3402. doi: 10.1093/nar/25.17.3389
Amir, A., McDonald, D., Navas-Molina, J. A., Kopylova, E., Morton, J. T., Zech Xu, Z., et al. (2017). Deblur rapidly resolves single-nucleotide community sequence patterns. mSystems 2:e00191-16. doi: 10.1128/mSystems.00191-16
Ankenbrand, M. J., Keller, A., Wolf, M., Schultz, J., and Förster, F. (2015). ITS2 database V: twice as much. Mol. Biol. Evol. 32, 3030–3032. doi: 10.1093/molbev/msv174
Balvočiūtë, M., and Huson, D. H. (2017). SILVA, RDP, Greengenes, NCBI and OTT — how do these taxonomies compare? BMC Genomics 18:114. doi: 10.1186/s12864-017-3501-4
Banchi, E., Ametrano, C. G., Greco, S., Stanković, D., Muggia, L., and Pallavicini, A. (2020). PLANiTS: a curated sequence reference dataset for plant ITS DNA metabarcoding. Database 2020:baz155. doi: 10.1093/database/baz155
Barsoum, N., Bruce, C., Forster, J., Ji, Y.-Q., and Yu, D. W. (2019). The devil is in the detail: metabarcoding of arthropods provides a sensitive measure of biodiversity response to forest stand composition compared with surrogate measures of biodiversity. Ecol. Indic. 101, 313–323. doi: 10.1016/j.ecolind.2019.01.023
Basset, Y., Cizek, L., Cuénoud, P., Didham, R. K., Guilhaumon, F., Missa, O., et al. (2012). Arthropod diversity in a tropical forest. Science 338, 1481–1484. doi: 10.1126/science.1226727
Becker, S., Hanner, R., and Steinke, D. (2011). Five years of FISH-BOL: brief status report. Mitochondrial DNA 22, 3–9. doi: 10.3109/19401736.2010.535528
Bell, K. L., Loeffler, V. M., and Brosi, B. J. (2017). An rbcL reference library to aid in the identification of plant species mixtures by DNA metabarcoding. Appl. Plant Sci. 5:1600110. doi: 10.3732/apps.1600110
Bellemain, E., Carlsen, T., Brochmann, C., Coissac, E., Taberlet, P., and Kauserud, H. (2010). ITS as an environmental DNA barcode for fungi: an in silico approach reveals potential PCR biases. BMC Microbiol. 10:189. doi: 10.1186/1471-2180-10-189
Benson, D. A., Cavanaugh, M., Clark, K., Karsch-Mizrachi, I., Lipman, D. J., Ostell, J., et al. (2012). GenBank. Nucleic Acids Res. 41, D36–D42. doi: 10.1093/nar/gks1195
Blackwell, M. (2011). The Fungi: 1, 2, 3 …5.1 million species? Am. J. Bot. 98, 426–438. doi: 10.3732/ajb.1000298
Braukmann, T. W. A., Ivanova, N. V., Prosser, S. W. J., Elbrecht, V., Steinke, D., Ratnasingham, S., et al. (2019). Metabarcoding a diverse arthropod mock community. Mol. Ecol. Resour. 19, 711–727. doi: 10.1111/1755-0998.13008
Brooks, J. P., Edwards, D. J., Harwich, M. D., Rivera, M. C., Fettweis, J. M., Serrano, M. G., et al. (2015). The truth about metagenomics: quantifying and counteracting bias in 16S rRNA studies. BMC Microbiol. 15:66. doi: 10.1186/s12866-015-0351-6
Buchner, D., and Leese, F. (2020). BOLDigger – a Python package to identify and organise sequences with the Barcode of Life Data systems. Metabarcoding Metagenomics 4:e53535. doi: 10.3897/mbmg.4.53535
Callahan, B. J., McMurdie, P. J., and Holmes, S. P. (2017). Exact sequence variants should replace operational taxonomic units in marker-gene data analysis. ISME J. 11, 2639–2643. doi: 10.1038/ismej.2017.119
Callahan, B. J., McMurdie, P. J., Rosen, M. J., Han, A. W., Johnson, A. J. A., and Holmes, S. P. (2016). DADA2: high-resolution sample inference from Illumina amplicon data. Nat. Methods 13, 581–583. doi: 10.1038/nmeth.3869
Caporaso, J. G., Kuczynski, J., Stombaugh, J., Bittinger, K., Bushman, F. D., Costello, E. K., et al. (2010). QIIME allows analysis of highthroughput community sequencing data. Nat. Methods 7, 335–336. doi: 10.1038/nmeth.f.303
Carini, P., Marsden, P. J., Leff, J. W., Morgan, E. E., Strickland, M. S., and Fierer, N. (2016). Relic DNA is Abundant in Soil and Obscures Estimates of Soil Microbial Diversity. Available online at: http://biorxiv.org/lookup/doi/10.1101/043372 (accessed July 6, 2016).
Chamberlain, S. (2019). bold: Interface to Bold Systems API. Available online at: https://CRAN.R-project.org/package=bold (accessed July 23, 2020).
Chaumeil, P., Fischer-Le Saux, M., Frigerio, J.-M., Grenier, E., Rimet, F., Streito, J.-C., et al. (2018). R-Syst: A Network Providing Curated Molecular Databases and Data Analysis Tools for Taxonomy and Systematics (Prokaryotes and Eucaryotes). Available online at: https://doi.org/10.15454/OEDAUS.
Chaumeil, P.-A., Mussig, A. J., Hugenholtz, P., and Parks, D. H. (2019). GTDB-Tk: a toolkit to classify genomes with the Genome Taxonomy Database. Bioinformatics btz848. doi: 10.1093/bioinformatics/btz848 [Epub ahead of print].
Clarke, L. J., Soubrier, J., Weyrich, L. S., and Cooper, A. (2014). Environmental metabarcodes for insects: in silico PCR reveals potential for taxonomic bias. Mol. Ecol. Resour. 14, 1160–1170. doi: 10.1111/1755-0998.12265
Cochrane, G., Karsch-Mizrachi, I., Takagi, T., and Sequence Database Collaboration, I. N. (2016). The international nucleotide sequence database collaboration. Nucleic Acids Res. 44, D48–D50. doi: 10.1093/nar/gkv1323
Cole, J. R., Wang, Q., Fish, J. A., Chai, B., McGarrell, D. M., Sun, Y., et al. (2014). Ribosomal database project: data and tools for high throughput rRNA analysis. Nucleic Acids Res. 42, D633–D642. doi: 10.1093/nar/gkt1244
Creer, S., Deiner, K., Frey, S., Porazinska, D., Taberlet, P., Thomas, W. K., et al. (2016). The ecologist’s field guide to sequence-based identification of biodiversity. Methods Ecol. Evol. 7, 1008–1018. doi: 10.1111/2041-210X.12574
Curry, C. J., Gibson, J. F., Shokralla, S., Hajibabaei, M., and Baird, D. J. (2018). Identifying North American freshwater invertebrates using DNA barcodes: are existing COI sequence libraries fit for purpose? Freshw. Sci. 37, 178–189. doi: 10.1086/696613
Darling, J. A. (2019). How to learn to stop worrying and love environmental DNA monitoring. Aquat. Ecosyst. Health Manage. 22, 440–451. doi: 10.1080/14634988.2019.1682912
D’Costa, V. M., King, C. E., Kalan, L., Morar, M., Sung, W. W. L., Schwarz, C., et al. (2011). Antibiotic resistance is ancient. Nature 477, 457–461. doi: 10.1038/nature10388
Deagle, B. E., Jarman, S. N., Coissac, E., Pompanon, F., and Taberlet, P. (2014). DNA metabarcoding and the cytochrome c oxidase subunit I marker: not a perfect match. Biol. Lett. 10:20140562. doi: 10.1098/rsbl.2014.0562
Deiner, K., Bik, H. M., Mächler, E., Seymour, M., Lacoursière-Roussel, A., Altermatt, F., et al. (2017). Environmental DNA metabarcoding: transforming how we survey animal and plant communities. Mol. Ecol. 26, 5872–5895. doi: 10.1111/mec.14350
DeSantis, T. Z., Hugenholtz, P., Larsen, N., Rojas, M., Brodie, E. L., Keller, K., et al. (2006). Greengenes, a chimera-checked 16S rRNA gene database and workbench compatible with ARB. Appl. Environ. Microbiol. 72, 5069–5072. doi: 10.1128/AEM.03006-05
Deshpande, V., Wang, Q., Greenfield, P., Charleston, M., Porras-Alfaro, A., Kuske, C. R., et al. (2016). Fungal identification using a Bayesian classifier and the Warcup training set of internal transcribed spacer sequences. Mycologia 108, 1–5. doi: 10.3852/14-293
Drummond, A. J., Newcomb, R. D., Buckley, T. R., Xie, D., Dopheide, A., Potter, B. C., et al. (2015). Evaluating a multigene environmental DNA approach for biodiversity assessment. GigaScience 4:46. doi: 10.1186/s13742-015-0086-1
Ebach, M. C., Valdecasas, A. G., and Wheeler, Q. D. (2011). Impediments to taxonomy and users of taxonomy: accessibility and impact evaluation. Cladistics 27, 550–557. doi: 10.1111/j.1096-0031.2011.00348.x
Edgar, R. C. (2013). UPARSE: highly accurate OTU sequences from microbial amplicon reads. Nat. Methods 10, 996–998. doi: 10.1038/nmeth.2604
Edgar, R. C. (2016). UNOISE2: improved error-correction for Illumina 16S and ITS amplicon sequencing. bioRxiv [Preprint]. doi: 10.1101/081257
Edgar, R. C. (2018a). Accuracy of taxonomy prediction for 16S rRNA and fungal ITS sequences. PeerJ 6:e4652. doi: 10.7717/peerj.4652
Edgar, R. C. (2018b). Updating the 97% identity threshold for 16S ribosomal RNA OTUs. Bioinformatics. 34, 2371–2375. doi: 10.1093/bioinformatics/bty113
Elbrecht, V., Braukmann, T. W. A., Ivanova, N. V., Prosser, S. W. J., Hajibabaei, M., Wright, M., et al. (2019). Validation of COI metabarcoding primers for terrestrial arthropods. PeerJ 7:e7745. doi: 10.7717/peerj.7745
Elbrecht, V., and Leese, F. (2017). Validation and development of COI metabarcoding primers for freshwater macroinvertebrate bioassessment. Front. Environ. Sci. 5:11. doi: 10.3389/fenvs.2017.00011
Elbrecht, V., Vamos, E. E., Meissner, K., Aroviita, J., and Leese, F. (2017). Assessing strengths and weaknesses of DNA metabarcoding-based macroinvertebrate identification for routine stream monitoring. Methods Ecol. Evol. 8, 1265–1275. doi: 10.1111/2041-210X.12789
Elbrecht, V., Vamos, E. E., Steinke, D., and Leese, F. (2018). Estimating intraspecific genetic diversity from community DNA metabarcoding data. PeerJ 6:e4644. doi: 10.7717/peerj.4644
Erdozain, M., Thompson, D. G., Porter, T. M., Kidd, K. A., Kreutzweiser, D. P., Sibley, P. K., et al. (2019). Metabarcoding of storage ethanol vs. conventional morphometric identification in relation to the use of stream macroinvertebrates as Ecol. Indic. in forest management. Ecol. Indic. 101, 173–184. doi: 10.1016/j.ecolind.2019.01.014
Folmer, O., Black, M., Hoeh, W., Lutz, R., and Vrijenhoek, R. (1994). DNA primers for amplification of mitochondrial cytochrome c oxidase subunit I from diverse metazoan invertebrates. Mol. Mar. Biol. Biotechnol. 3, 294–299.
Gauthier, M., Konecny-Dupré, L., Nguyen, A., Elbrecht, V., Datry, T., Douady, C., et al. (2020). Enhancing DNA metabarcoding performance and applicability with bait capture enrichment and DNA from conservative ethanol. Mol. Ecol. Resour. 20, 79–96. doi: 10.1111/1755-0998.13088
Geller, J., Meyer, C., Parker, M., and Hawk, H. (2013). Redesign of PCR primers for mitochondrial cytochrome c oxidase subunit I for marine invertebrates and application in all-taxa biotic surveys. Mol. Ecol. Resour. 13, 851–861. doi: 10.1111/1755-0998.12138
Gibson, J., Shokralla, S., Curry, C., Baird, D. J., Monk, W. A., King, I., et al. (2015). Large-scale biomonitoring of remote and threatened ecosystems via high-throughput sequencing. PLoS One 10:e0138432. doi: 10.1371/journal.pone.0138432
Gibson, J., Shokralla, S., Porter, T. M., King, I., van Konynenburg, S., Janzen, D. H., et al. (2014). Simultaneous assessment of the macrobiome and microbiome in a bulk sample of tropical arthropods through DNA metasystematics. Proc. Natl. Acad. Sci. U.S.A. 111, 8007–8012. doi: 10.1073/pnas.1406468111
Gilbert, J. A., Jansson, J. K., and Knight, R. (2014). The Earth Microbiome project: successes and aspirations. BMC Biol. 12:69. doi: 10.1186/s12915-014-0069-1
Glassman, S. I., and Martiny, J. B. (2018). Ecological patterns are robust to use of exact sequence variants versus operational taxonomic units. mSphere 3:e00148-18. doi: 10.1101/283283
Guillou, L., Bachar, D., Audic, S., Bass, D., Berney, C., Bittner, L., et al. (2012). The Protist Ribosomal Reference database (PR2): a catalog of unicellular eukaryote Small Sub-Unit rRNA sequences with curated taxonomy. Nucleic Acids Res. 41, D597–D604. doi: 10.1093/nar/gks1160
Hajibabaei, M. (2012). The golden age of DNA metasystematics. Trends Genet. 28, 535–537. doi: 10.1016/j.tig.2012.08.001
Hajibabaei, M., deWaard, J. R., Ivanova, N. V., Ratnasingham, S., Dooh, R. T., Kirk, S. L., et al. (2005). Critical factors for assembling a high volume of DNA barcodes. Philos. Trans. R. Soc. B 360, 1959–1967. doi: 10.1098/rstb.2005.1727
Hajibabaei, M., Porter, T. M., Wright, M., and Rudar, J. (2019). COI metabarcoding primer choice affects richness and recovery of indicator taxa in freshwater systems. PLoS One 14:e0220953. doi: 10.1371/journal.pone.0220953
Hajibabaei, M., Shokralla, S., Zhou, X., Singer, G. A. C., and Baird, D. J. (2011). Environmental barcoding: a next-generation sequencing approach for biomonitoring applications using river benthos. PLoS One 6:e17497. doi: 10.1371/journal.pone.0017497
Hajibabaei, M., Smith, M. A., Janzen, D. H., Rodriguez, J. J., Whitfield, J. B., and Hebert, P. D. N. (2006). A minimalist barcode can identify a specimen whose DNA is degraded: BARCODING. Mol. Ecol. Notes 6, 959–964. doi: 10.1111/j.1471-8286.2006.01470.x
Hajibabaei, M., Spall, J. L., Shokralla, S., and van Konynenburg, S. (2012). Assessing biodiversity of a freshwater benthic macroinvertebrate community through non-destructive environmental barcoding of DNA from preservative ethanol. BMC Ecol. 12:28. doi: 10.1186/1472-6785-12-28
Handelsman, J. (2004). Metagenomics: application of genomics to uncultured microorganisms. Microbiol. Mol. Biol. Rev. 68, 669–685. doi: 10.1128/mmbr.68.4.669-685.2004
Hänfling, B., Lawson Handley, L., Read, D. S., Hahn, C., Li, J., Nichols, P., et al. (2016). Environmental DNA metabarcoding of lake fish communities reflects long-term data from established survey methods. Mol. Ecol. 25, 3101–3119. doi: 10.1111/mec.13660
He, Y., Caporaso, J. G., Jiang, X.-T., Sheng, H.-F., Huse, S. M., Rideout, J. R., et al. (2015). Stability of operational taxonomic units: an important but neglected property for analyzing microbial diversity. Microbiome 3:20. doi: 10.1186/s40168-015-0081-x
Hebert, P. D. N., Braukmann, T. W. A., Prosser, S. W. J., Ratnasingham, S., deWaard, J. R., Ivanova, N. V., et al. (2018). A Sequel to Sanger: amplicon sequencing that scales. BMC Genomics 19:219. doi: 10.1186/s12864-018-4611-3
Hebert, P. D. N., Cywinska, A., Ball, S. L., and deWaard, J. R. (2003). Biological identifications through DNA barcodes. Proc. R. Soc. B Biol. Sci. 270, 313–321. doi: 10.1098/rspb.2002.2218
Hernandez, C., Bougas, B., Perreault-Payette, A., Simard, A., Côté, G., and Bernatchez, L. (2020). 60 specific eDNA qPCR assays to detect invasive, threatened, and exploited freshwater vertebrates and invertebrates in Eastern Canada. Environ. DNA. 2, 373–386. doi: 10.1002/edn3.89
Hobern, D., and Hebert, P. (2019). BIOSCAN - revealing eukaryote diversity, dynamics, and interactions. Biodivers. Inf. Sci. Stand. 3:e37333. doi: 10.3897/biss.3.37333
Hobern, D. G. (2020). BIOSCAN: DNA Barcoding to accelerate taxonomy and biogeography for conservation and sustainability. Genome. doi: 10.1139/gen-2020-0009 [Epub ahead of print].
Hong, S., Bunge, J., Leslin, C., Jeon, S., and Epstein, S. S. (2009). Polymerase chain reaction primers miss half of rRNA microbial diversity. ISME J. 3, 1365–1373. doi: 10.1038/ismej.2009.89
Huson, D. H., Beier, S., Flade, I., Górska, A., El-Hadidi, M., Mitra, S., et al. (2016). MEGAN community edition - interactive exploration and analysis of large-scale microbiome sequencing data. PLoS Comput. Biol. 12:e1004957. doi: 10.1371/journal.pcbi.1004957
Iwasaki, W., Fukunaga, T., Isagozawa, R., Yamada, K., Maeda, Y., Satoh, T. P., et al. (2013). MitoFish and MitoAnnotator: a mitochondrial genome database of fish with an accurate and automatic annotation pipeline. Mol. Biol. Evol. 30, 2531–2540. doi: 10.1093/molbev/mst141
Kitano, T., Umetsu, K., Tian, W., and Osawa, M. (2007). Two universal primer sets for species identification among vertebrates. Int. J. Legal Med. 121, 423–427. doi: 10.1007/s00414-006-0113-y
Kõljalg, U., Abarenkov, K., Nilsson, R. H., Larsson, K.-H., and Taylor, A. F. S. (2019). The UNITE database for molecular identification and for communicating fungal species. Biodivers. Inf. Sci. Stand. 3:e37402. doi: 10.3897/biss.3.37402
Koljalg, U., Nilsson, R. H., Abarenkov, K., Tedersoo, L., Taylor, A. F. S., Bahram, M., et al. (2013). Towards a unified paradigm for sequence-based identification of fungi. Mol. Ecol. 22, 5271–5277.
Leray, M., Yang, J. Y., Meyer, C. P., Mills, S. C., Agudelo, N., Ranwez, V., et al. (2013). A new versatile primer set targeting a short fragment of the mitochondrial COI region for metabarcoding metazoan diversity: application for characterizing coral reef fish gut contents. Front. Zool. 10:34. doi: 10.1186/1742-9994-10-34
Liu, K.-L., Porras-Alfaro, A., Kuske, C. R., Eichorst, S. A., and Xie, G. (2012). Accurate, rapid taxonomic classification of fungal large-subunit rRNA Genes. Appl. Environ. Microbiol. 78, 1523–1533. doi: 10.1128/AEM.06826-11
Lozupone, C. A., and Knight, R. (2007). Global patterns in bacterial diversity. Proc. Natl. Acad. Sci. U.S.A. 104, 11436–11440. doi: 10.1073/pnas.0611525104
Macher, J.-N., Macher, T.-H., and Leese, F. (2017). Combining NCBI and BOLD databases for OTU assignment in metabarcoding and metagenomic datasets: the BOLD_NCBI _Merger. Metabarcoding Metagenomics 1:e22262. doi: 10.3897/mbmg.1.22262
Maitland, V. C., Robinson, C. V., Porter, T. M., and Hajibabaei, M. (2020). Freshwater diatom biomonitoring through benthic kick-net metabarcoding. bioRxiv [Preprint]. doi: 10.1101/2020.05.25.115089
Marquina, D., Esparza-Salas, R., Roslin, T., and Ronquist, F. (2019). Establishing arthropod community composition using metabarcoding: surprising inconsistencies between soil samples and preservative ethanol and homogenate from Malaise trap catches. Mol. Ecol. Resour. 19, 1516–1530. doi: 10.1111/1755-0998.13071
McDonald, D., Price, M. N., Goodrich, J., Nawrocki, E. P., DeSantis, T. Z., Probst, A., et al. (2012). An improved Greengenes taxonomy with explicit ranks for ecological and evolutionary analyses of bacteria and archaea. ISME J. 6, 610–618. doi: 10.1038/ismej.2011.139
Munch, K., Boomsma, W., Huelsenbeck, J., Willerslev, E., and Nielsen, R. (2008). Statistical assignment of DNA sequences using bayesian phylogenetics. Syst. Biol. 57, 750–757. doi: 10.1080/10635150802422316
Nayfach, S., and Pollard, K. S. (2016). Toward accurate and quantitative comparative metagenomics. Cell 166, 1103–1116. doi: 10.1016/j.cell.2016.08.007
Nearing, J. T., Douglas, G. M., Comeau, A. M., and Langille, M. G. I. (2018). Denoising the Denoisers: an independent evaluation of microbiome sequence error-correction approaches. PeerJ 6:e5364. doi: 10.7717/peerj.5364
Nielsen, K. M., Johnsen, P. J., Bensasson, D., and Daffonchio, D. (2007). Release and persistence of extracellular DNA in the environment. Environ. Biosaf. Res. 6, 37–53. doi: 10.1051/ebr:2007031
Nilsson, R. H., Larsson, K.-H., Taylor, A. F. S., Bengtsson-Palme, J., Jeppesen, T. S., Schigel, D., et al. (2019). The UNITE database for molecular identification of fungi: handling dark taxa and parallel taxonomic classifications. Nucleic Acids Res. 47, D259–D264. doi: 10.1093/nar/gky1022
Pace, N. R., Stahl, D. A., Lane, D. J., and Olsen, G. J. (1986). “The analysis of natural microbial populations by ribosomal RNA sequences,” in Advances in Microbial Ecology Advances in Microbial Ecology, ed. K. C. Marshall (Boston, MA: Springer), 1–55. doi: 10.1007/978-1-4757-0611-6_1
Parks, D. H., Chuvochina, M., Chaumeil, P.-A., Rinke, C., Mussig, A. J., and Hugenholtz, P. (2020). A complete domain-to-species taxonomy for Bacteria and Archaea. Nat. Biotechnol. [Epub ahead of print].
Pietramellara, G., Ascher, J., Borgogni, F., Ceccherini, M. T., Guerri, G., and Nannipieri, P. (2009). Extracellular DNA in soil and sediment: fate and ecological relevance. Biol. Fertil. Soils 45, 219–235. doi: 10.1007/s00374-008-0345-8
Porter, T. M., and Hajibabaei, M. (2018a). Automated high throughput animal CO1 metabarcode classification. Sci. Rep. 8:4226.
Porter, T. M., and Hajibabaei, M. (2018b). Over 2.5 million COI sequences in GenBank and growing. PLoS One 13:e0200177. doi: 10.1101/353904
Porter, T. M., and Hajibabaei, M. (2018c). Scaling up: a guide to high-throughput genomic approaches for biodiversity analysis. Mol. Ecol. 27, 313–338. doi: 10.1111/mec.14478
Porter, T. M., Morris, D. M., Basiliko, N., Hajibabaei, M., Doucet, D., Bowman, S., et al. (2019). Variations in terrestrial arthropod DNA metabarcoding methods recovers robust beta diversity but variable richness and site indicators based on exact sequence variants. Sci. Rep. 9:18218.
Pruesse, E., Quast, C., Knittel, K., Fuchs, B. M., Ludwig, W., Peplies, J., et al. (2007). SILVA: a comprehensive online resource for quality checked and aligned ribosomal RNA sequence data compatible with ARB. Nucleic Acids Res. 35, 7188–7196. doi: 10.1093/nar/gkm864
Ratnasingham, S., and Hebert, P. D. (2007). BOLD: the barcode of life data system (http://www.barcodinglife.org). Mol. Ecol. Notes 7, 355–364. doi: 10.1111/j.1471-8286.2007.01678.x
Ratnasingham, S., and Hebert, P. D. N. (2013). A DNA-based registry for all animal species: the barcode index number (BIN) system. PLoS One 8:e66213. doi: 10.1371/journal.pone.0066213
Reeder, J., and Knight, R. (2009). The ‘rare biosphere’: a reality check. Nat. Methods 6, 636–637. doi: 10.1038/nmeth0909-636
Rimet, F., Gusev, E., Kahlert, M., Kelly, M. G., Kulikovskiy, M., Maltsev, Y., et al. (2019). Diat.barcode, an open-access curated barcode library for diatoms. Sci. Rep. 9:15116. doi: 10.1038/s41598-019-51500-6
Rognes, T., Flouri, T., Nichols, B., Quince, C., and Mahé, F. (2016). VSEARCH: a versatile open source tool for metagenomics. PeerJ 4:e2584. doi: 10.7717/peerj.2584
Romanowski, G., Lorenz, M. G., and Wackernagel, W. (1991). Adsorption of plasmid DNA to mineral surfaces and protection against DNase I. Appl. Environ. Microbiol. 57, 1057–1061. doi: 10.1128/AEM.57.4.1057-1061.1991
Sato, Y., Miya, M., Fukunaga, T., Sado, T., and Iwasaki, W. (2018). MitoFish and MiFish Pipeline: a mitochondrial genome database of fish with an analysis pipeline for environmental DNA Metabarcoding. Mol. Biol. Evol. 35, 1553–1555. doi: 10.1093/molbev/msy074
Shokralla, S., Gibson, J., King, I., Baird, D., Janzen, D., Hallwachs, W., et al. (2016). Environmental DNA barcode sequence capture: targeted, PCR-free sequence capture for biodiversity analysis from bulk environmental samples. bioRxiv [Preprint]. doi: 10.1101/087437
Shokralla, S., Hellberg, R. S., Handy, S. M., King, I., and Hajibabaei, M. (2015a). A DNA mini-barcoding system for authentication of processed fish products. Sci. Rep. 5:15894. doi: 10.1038/srep15894
Shokralla, S., Porter, T. M., Gibson, J. F., Dobosz, R., Janzen, D. H., Hallwachs, W., et al. (2015b). Massively parallel multiplex DNA sequencing for specimen identification using an Illumina MiSeq platform. Sci. Rep. 5:9687. doi: 10.1038/srep09687
Shokralla, S., Singer, G., and Hajibabaei, M. (2010). Direct PCR amplification and sequencing of specimens’ DNA from preservative ethanol. Biotechniques 48, 233–234. doi: 10.2144/000113362
Somervuo, P., Koskela, S., Pennanen, J., Henrik Nilsson, R., and Ovaskainen, O. (2016). Unbiased probabilistic taxonomic classification for DNA barcoding. Bioinformatics 32, 2920–2927. doi: 10.1093/bioinformatics/btw346
Somervuo, P., Yu, D. W., Xu, C. C. Y., Ji, Y., Hultman, J., Wirta, H., et al. (2017). Quantifying uncertainty of taxonomic placement in DNA barcoding and metabarcoding. Methods Ecol. Evol. 8, 398–407. doi: 10.1111/2041-210X.12721
Stackebrandt, E., and Goebel, B. M. (1994). Taxonomic note: a place for DNA-DNA Reassociation and 16S rRNA sequence analysis in the present species definition in bacteriology. Int. J. Syst. Evol. Microbiol. 44, 846–849. doi: 10.1099/00207713-44-4-846
Staley, J. T., and Konopka, A. (1985). Measurement of in situ activities of nonphotosynthetic microorganisms in aquatic and terrestrial habitats. Annu. Rev. Microbiol. 39, 321–346.
Taberlet, P., Coissac, E., Hajibabaei, M., and Rieseberg, L. H. (2012a). Environmental DNA. Mol. Ecol. 21, 1789–1793.
Taberlet, P., Coissac, E., Pompanon, F., Brochmann, C., and Willerslev, E. (2012b). Towards next-generation biodiversity assessment using DNA metabarcoding. Mol. Ecol. 21, 2045–2050.
Taberlet, P., Prud’Homme, S. M., Campione, E., Roy, J., Miquel, C., Shehzad, W., et al. (2012c). Soil sampling and isolation of extracellular DNA from large amount of starting material suitable for metabarcoding studies: EXTRACTION OF EXTRACELLULAR DNA FROM SOIL. Mol. Ecol. 21, 1816–1820. doi: 10.1111/j.1365-294X.2011.05317.x
Tapolczai, K., Vasselon, V., Bouchez, A., Stenger-Kovács, C., Padisák, J., and Rimet, F. (2019). The impact of OTU sequence similarity threshold on diatom-based bioassessment: a case study of the rivers of Mayotte (France, Indian Ocean). Ecol. Evol. 9, 166–179. doi: 10.1002/ece3.4701
Tedersoo, L., Bahram, M., Polme, S., Koljalg, U., Yorou, N. S., Wijesundera, R., et al. (2014). Global diversity and geography of soil fungi. Science 346:1256688. doi: 10.1126/science.1256688
Thompson, L. R., Sanders, J. G., McDonald, D., Amir, A., Ladau, J., Locey, K. J., et al. (2017). A communal catalogue reveals Earth’s multiscale microbial diversity. Nature 551, 457–463. doi: 10.1038/nature24621
Vamos, E., Elbrecht, V., and Leese, F. (2017). Short COI markers for freshwater macroinvertebrate metabarcoding. Metabarcoding Metagenomics 1:e14625. doi: 10.3897/mbmg.1.14625
Wang, Q., Garrity, G. M., Tiedje, J. M., and Cole, J. R. (2007). Naive bayesian classifier for rapid assignment of rRNA sequences into the new bacterial taxonomy. Appl. Environ. Microbiol. 73, 5261–5267. doi: 10.1128/AEM.00062-07
Weigand, H., Beermann, A. J., Čiampor, F., Costa, F. O., Csabai, Z., Duarte, S., et al. (2019). DNA barcode reference libraries for the monitoring of aquatic biota in Europe: Gap-analysis and recommendations for future work. Sci. Total Environ. 678, 499–524. doi: 10.1101/576553
Yilmaz, P., Parfrey, L. W., Yarza, P., Gerken, J., Pruesse, E., Quast, C., et al. (2014). The SILVA and “All-species Living Tree Project (LTP)” taxonomic frameworks. Nucleic Acids Res. 42, D643–D648. doi: 10.1093/nar/gkt1209
Yu, D. W., Ji, Y., Emerson, B. C., Wang, X., Ye, C., Yang, C., et al. (2012). Biodiversity soup: metabarcoding of arthropods for rapid biodiversity assessment and biomonitoring: biodiversity soup. Methods Ecol. Evol. 3, 613–623. doi: 10.1111/j.2041-210X.2012.00198.x
Zenker, M. M., Specht, A., and Fonseca, V. G. (2020). Assessing insect biodiversity with automatic light traps in Brazil: pearls and pitfalls of metabarcoding samples in preservative ethanol. Ecol. Evol. 10, 2352–2366. doi: 10.1002/ece3.6042
Keywords: exact sequence variant, amplicon sequence variant, operational taxonomic unit, DNA barcode, mini-barcode, metabarcode, taxonomic assignment
Citation: Porter TM and Hajibabaei M (2020) Putting COI Metabarcoding in Context: The Utility of Exact Sequence Variants (ESVs) in Biodiversity Analysis. Front. Ecol. Evol. 8:248. doi: 10.3389/fevo.2020.00248
Received: 13 December 2019; Accepted: 07 July 2020;
Published: 11 August 2020.
Edited by:
David S. Thaler, Biozentrum, Universität Basel, SwitzerlandReviewed by:
Andrew Dopheide, Manaaki Whenua Landcare Research, New ZealandHelena Kristiina Wirta, University of Helsinki, Finland
Copyright © 2020 Porter and Hajibabaei. This is an open-access article distributed under the terms of the Creative Commons Attribution License (CC BY). The use, distribution or reproduction in other forums is permitted, provided the original author(s) and the copyright owner(s) are credited and that the original publication in this journal is cited, in accordance with accepted academic practice. No use, distribution or reproduction is permitted which does not comply with these terms.
*Correspondence: Mehrdad Hajibabaei, mhajibab@uoguelph.ca