Soil Moisture Analysis by Means of Multispectral Images According to Land Use and Spatial Resolution on Andosols in the Colombian Andes


Abstract
:
1. Introduction
2. Materials and Methods
2.1. Study Area
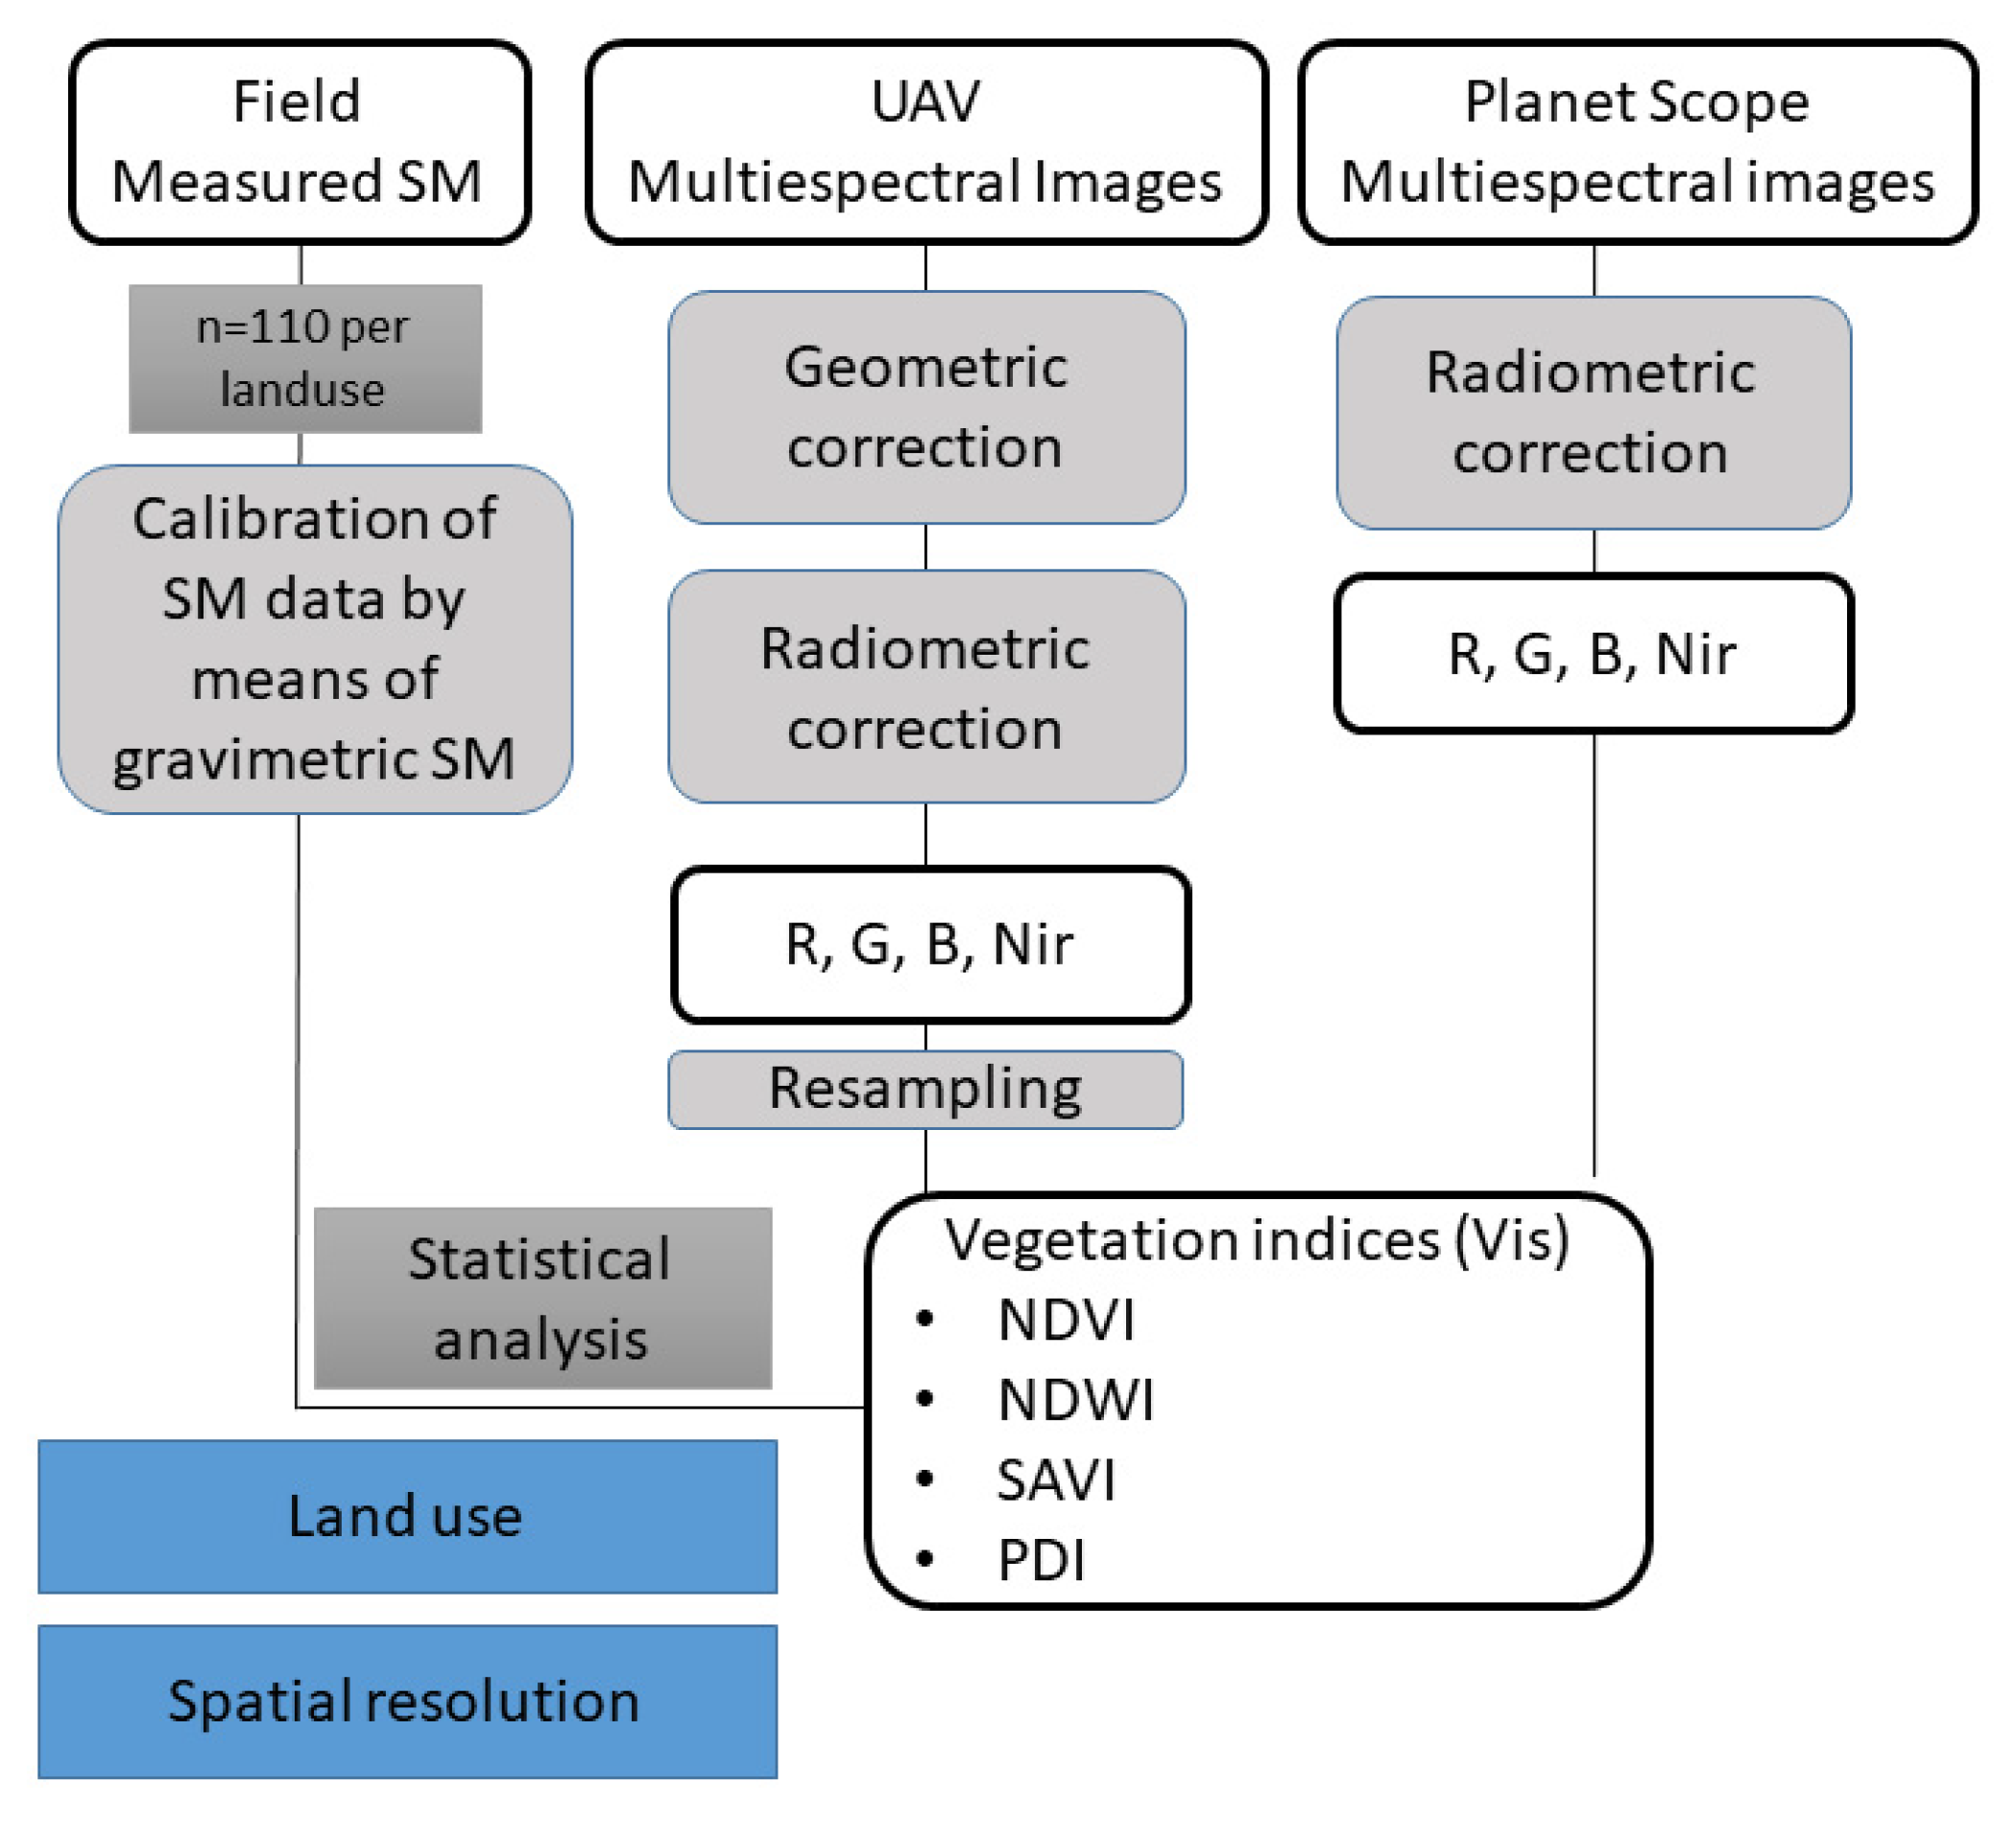
2.2. Procedure
3. Results
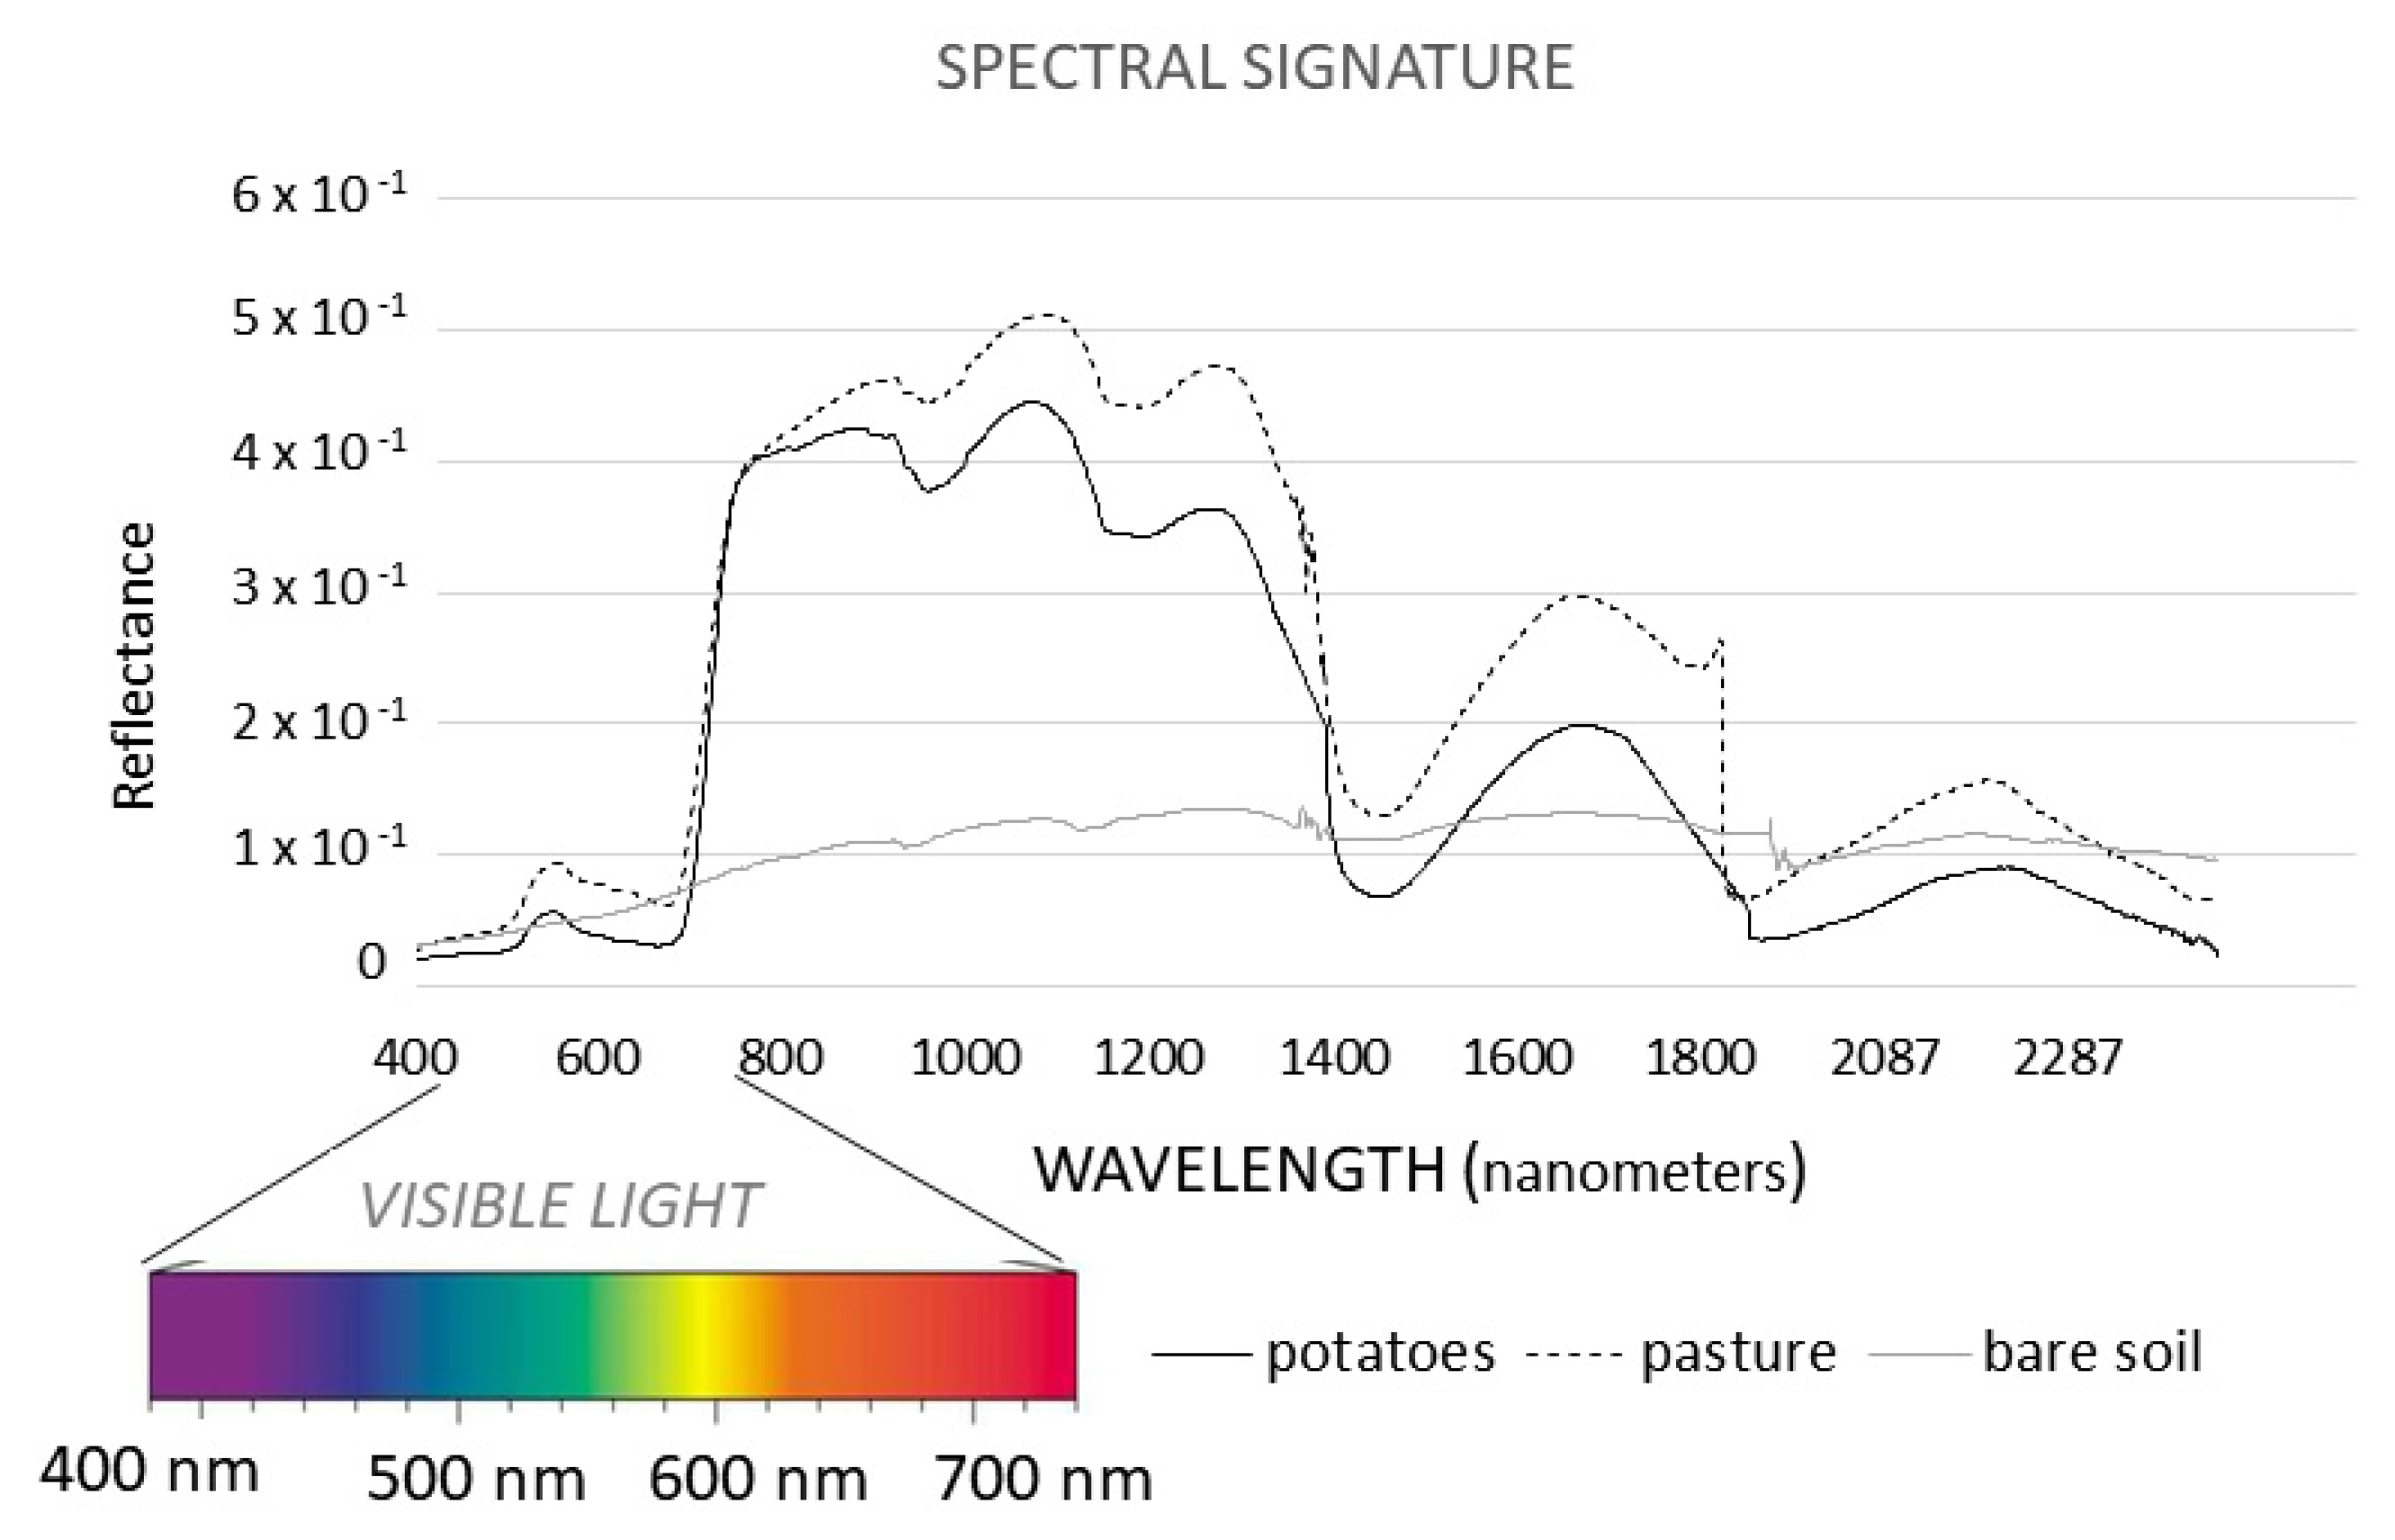
3.1. Pedo-Hydrological Characterization of the Study Area
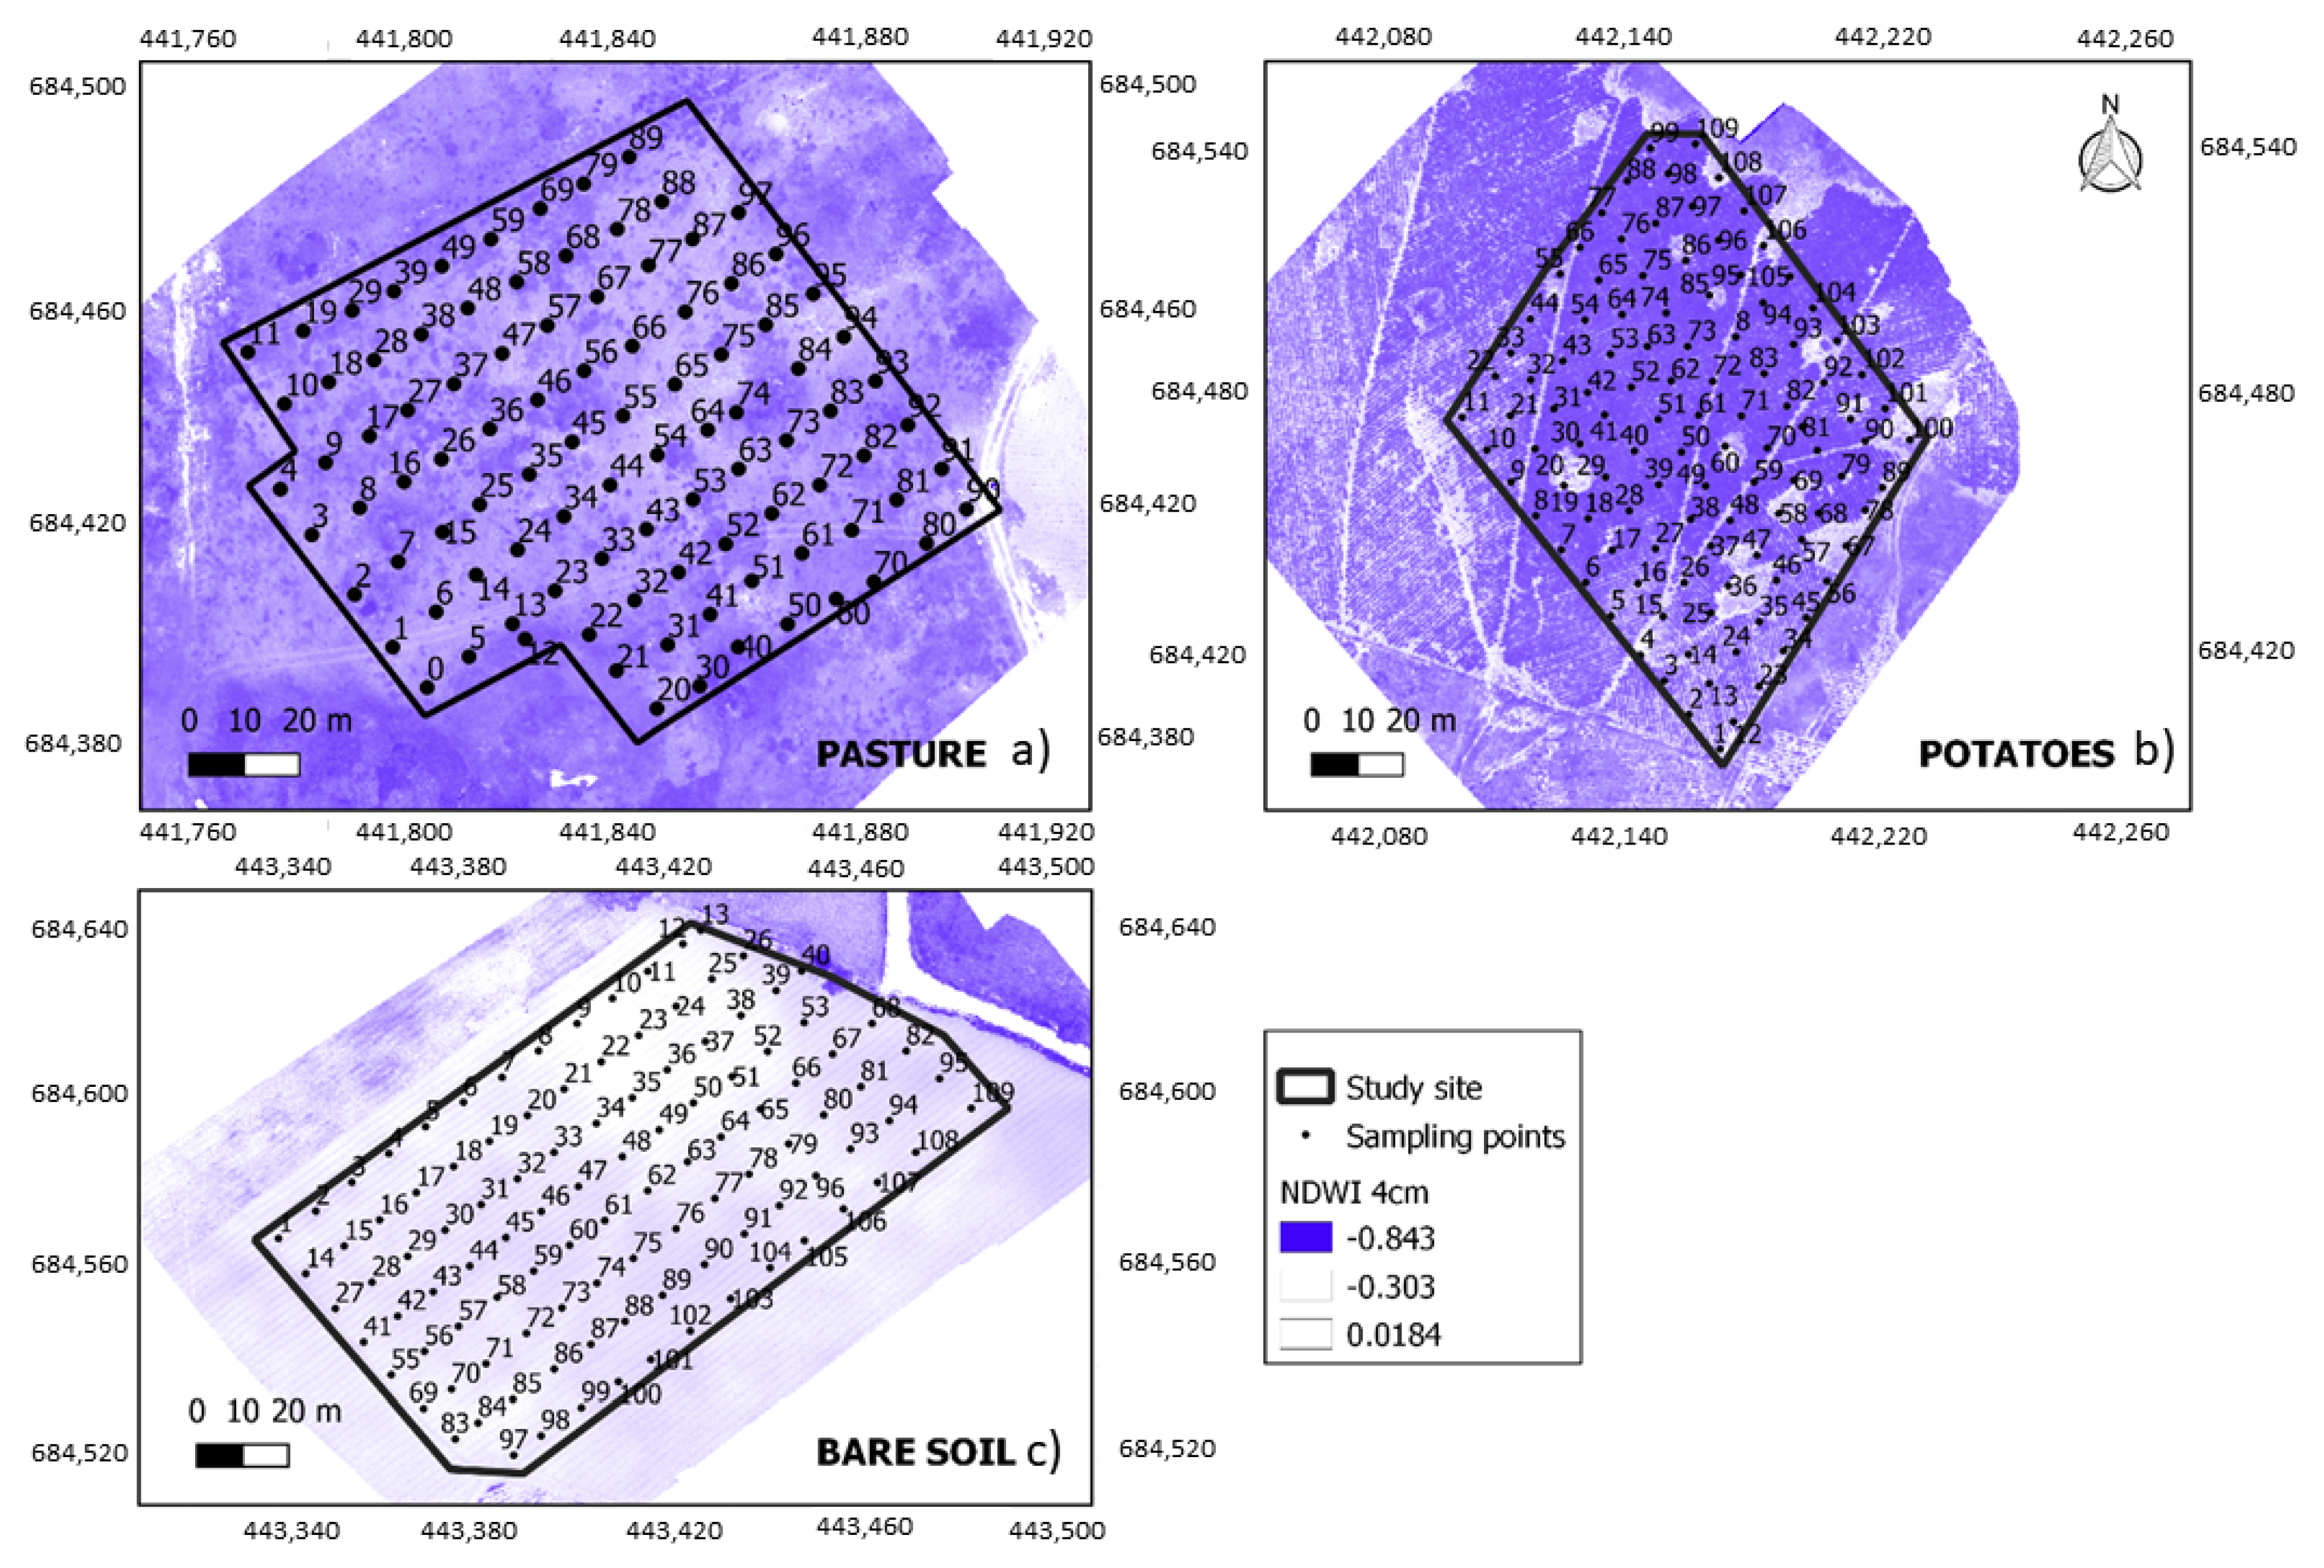
3.2. The PDI According the Spatial Resolution
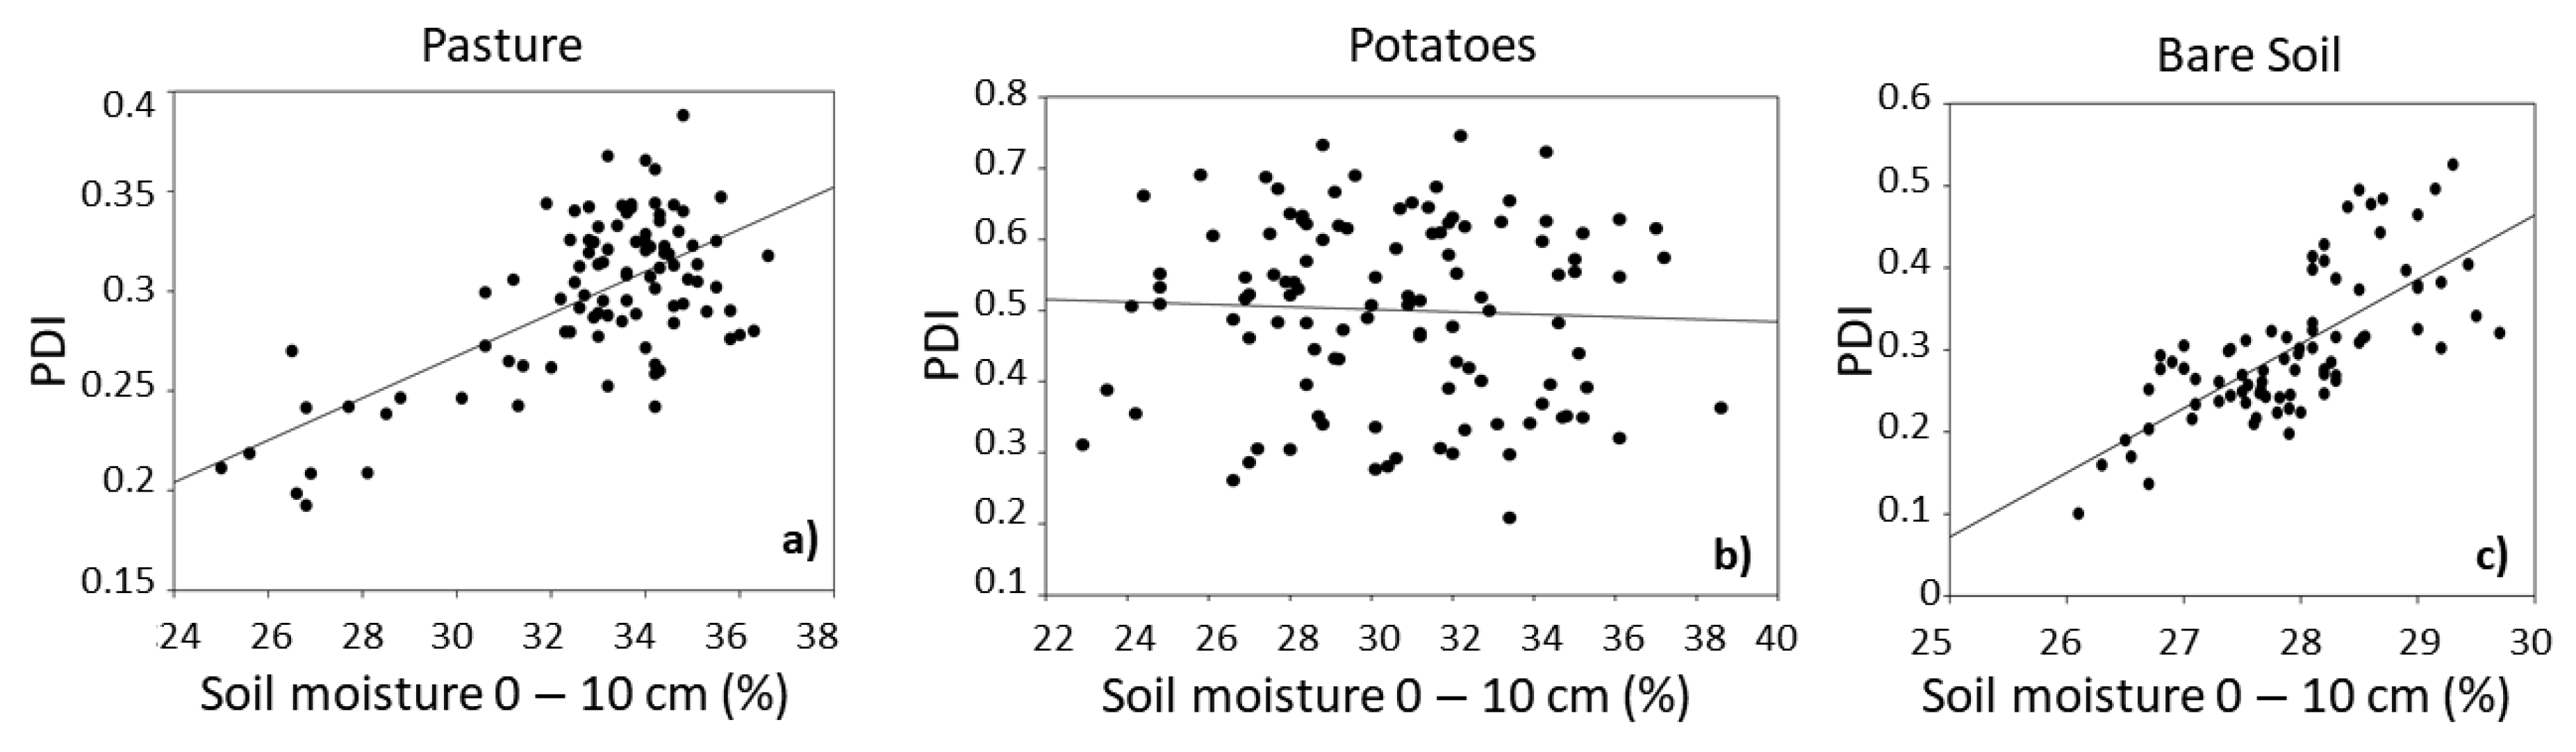
3.3. Soil Moisture vs. Vegetation Indices
4. Discussion
5. Conclusions
Author Contributions
Funding
Acknowledgments
Conflicts of Interest
References
- Li, S.; Pezeshki, S.R.; Goodwin, S. Effects of soil moisture regimes on photosynthesis and growth in cattail (Typha latifolia). Acta Oecologica 2004, 25, 17–22. [Google Scholar] [CrossRef]
- Wright, C.; Kagawa-Viviani, A.; Gerlein-Safdi, C.; Mosquera, G.M.; Poca, M.; Tseng, H.; Chun, K.P. Advancing ecohydrology in the changing tropics: Perspectives from early career scientists. Ecohydrology 2018, 11, 112–125. [Google Scholar] [CrossRef]
- Firman Ghazali, M.; Wikantika, K.; Budi Harto, A.; Kondoh, A. Generating soil salinity, soil moisture, soil pH from satellite imagery and its analysis. Inf. Process. Agric. 2019. [Google Scholar] [CrossRef]
- Esquivel, A.; Llanos-Herrera, L.; Agudelo, D.; Prager, S.D.; Fernandes, K.; Rojas, A.; Valencia, J.J.; Ramirez-Villegrasa, J. Predictability of seasonal precipitation across major crop growing areas in Colombia. Clim. Serv. 2018, 12, 36–47. [Google Scholar] [CrossRef]
- Wigmore, O.; Marka, B.; McKenzie, J.; Baraerd, M.; Lautze, L. Sub-metre mapping of surface soil moisture in proglacial valleys of the tropical Andes using a multispectral unmanned aerial vehicle. Remote. Sens. Environ. 2019, 222, 104–118. [Google Scholar] [CrossRef]
- Entekhabi, D.; Nioku, E.G.; O’Neill, P.E.; Kellogg, K.H.; Crow, W.T.; Edelstein, W.N.; Entin, J.K.; Goodman, S.D.; Jackson, T.J.; Johnson, J.; et al. The Soil Moisture Active Passive (SMAP) Mission. Proc. IEEE 2010, 98, 704–716. [Google Scholar] [CrossRef]
- Gruber, A.; De Lannoy, G.; Albergel, C.; Al-Yaari, A.; Brocca, L.; Calvet, J.C.; Colliander, A.; Cosh, M.; Crow, W.; Dorigo, W.; et al. Validation practices for satellite soil moisture retrievals: What are (the) errors? Remote Sens. Environ. 2020, 244, 111806. [Google Scholar] [CrossRef]
- Albergel, C.; de Rosnay, P.; Gruhier, C.; Muñoz-Sabater, J.; Hasenauer, S.; Isaksen, L.; Kerr, Y.; Wagner, W. Evaluation of remotely sensed and modelled soil moisture products using global ground-based in situ observations. Remote Sens. Environ. 2020, 118, 215–226. [Google Scholar] [CrossRef]
- Wang, L.; Qu, J.J. Satellite remote sensing applications for surface soil moisture monitoring: A review. Front. Earth Sci. China 2009, 3, 237–247. [Google Scholar] [CrossRef]
- Lievens, H.; Martens, B.; Verhoest, N.E.C.; Hahn, S.; Reichle, R.H.; Miralles, D.G. Assimilation of global radar backscatter and radiometer brightness temperature observations to improve soil moisture and land evaporation estimates. Remote Sens. Environ. 2017, 18, 194–210. [Google Scholar] [CrossRef]
- He, Y.; Weng, Q. High Spatial Resolution Remote Sensing. Data, Analysis and Applications 2018. Taylor & Francis Series in Imaging Science; CRC Press: New York, NY, USA, 2018; ISBN 9781498761682. [Google Scholar]
- Gruber, A.; Scanlon, T.; van der Schalie, R.; Wagner, W.; Dorigo, W. Evolution of the ESA CCI Soil Moisture climate data records and their underlying merging methodology. Earth Syst. Sci. Data 2019, 11, 717–739. [Google Scholar] [CrossRef] [Green Version]
- Vicente-Serrano, S.; Begueria, S.; Lorenzo, J.; Camarero, J.; Lopez.Moreno, J.; Azorin-Molina, C.; Revuelto, J.; Moran-Tejeda, E.; Sanchez-Lorenzo, A. Performance of Drought Indices for Ecological, Agricultural, and Hydrological Applications. Earth Interact. 2012, 16, 1–27. [Google Scholar] [CrossRef] [Green Version]
- Jelev, G.; Dimitrov, P.; Kamenova, I.; Ilieva, I.; Roumenina, E.; Filchev, L.; Gikov, A.; Banov, M.; Krasteva, V.; Kolchakov, V.; et al. Using UAV Spectral Vegetation Indices for Estimation and Mapping of Biophysical Variables in Winter Wheat. In Digital Earth Observation, Proceedings of the 39th European Association of Remote Sensing Laboratories Symposium & 43rd General Assembly, Salzburg, Austria, 1–4 July 2019; Riedler, B., Lettner, S., Lang, S., Tiede, D., Eds.; University of Salzburg: Salzburg, Austria, 2019. [Google Scholar]
- Gago, J.; Douthe, C.; Coopman, R.E.; Gallego, P.P.; Ribas-Carbo, M.; Flexas, J.; Escalona, J.; Medrano, H. UAVs challenge to assess water stress for sustainable agriculture. Agric. Water Manag. 2015, 153, 9–19. [Google Scholar] [CrossRef]
- Montoani Silva, B.; Godinho Silva, S.H.; de Oliveira, G.H.; Caspar Rosa Peters, P.H.; Reis dos Santos, W.J.; CuriI, N. Soil Moisture Assessed by Digital Mapping Techniques and Its Field Validation. Ciênc. Agrotec. 2014, 38, 140–148. [Google Scholar] [CrossRef] [Green Version]
- Sørensen, R.; Zinko, U.; Seibert, J. On the calculation of the topographic wetness index: Evaluation of different methods based on field observations. Hydrol. Earth Syst. Sci. 2006, 10, 101–112. [Google Scholar] [CrossRef] [Green Version]
- Shafian, S.; Maas, S. Index of Soil Moisture Using Raw Landsat Image Digital Count Data in Texas High Plains. Remote Sens. 2015, 7, 2352–2372. [Google Scholar] [CrossRef] [Green Version]
- Wang, L.; Qu, J.J.; Hao, X.; Zhu, Q. Sensitivity studies of the moisture effects on MODIS SWIR reflectance and vegetation water indices. Int. J. Remote Sens. 2008, 29, 7065–7075. [Google Scholar] [CrossRef]
- Fabre, S.; Briottet, X.; Lesaignoux, A. Estimation of Soil Moisture Content from the Spectral Reflectance of Bare Soils in the 0.4–2.5 μm Domain. Sensors (Basel) 2015, 15, 3262–3281. [Google Scholar] [CrossRef]
- Lobell, D.B.; Asner, G.P. Moisture Effects On Soil Reflectance. Soil Sci. Soc. Am. J. 2002, 66, 722–727. [Google Scholar] [CrossRef]
- Amani, M.; Parsian, S.; MirMazloumi, S.M.; Aieneh, O. Two new soil moisture indices based on the NIR-red triangle space of Landsat-8 data. Int. J. Appl. Earth Obs. Geoinf. 2016, 50, 176–186. [Google Scholar] [CrossRef]
- Mohseni, F.; Mokhtarzade, M. A new soil moisture index driven from an adapted long-term, temperature-vegetation scatter plot using MODIS data. J. Hydrol. 2020, 581. [Google Scholar] [CrossRef]
- McFeeter, S.K. The use of the Normalized Difference Water Index (NDWI) in the delineation of open water features. Int. J. Remote Sens. 1996, 17, 7. [Google Scholar] [CrossRef]
- Gao, A. NDWI—A normalized difference water index for remote sensing of vegetation liquid water from space. Remote Sens. Environ. 1996, 58, 257–266. [Google Scholar] [CrossRef]
- Xu, H. Modification of normalised difference water index (NDWI) to enhance open water features in remotely sensed imagery. Int. J. Remote Sens. 2006, 27, 3025–3033. [Google Scholar] [CrossRef]
- Chen, X.; Guo, Z.; Chen, J.; Yang, W.; Yao, Y.; Zhang, C.; Cui, X.; Cao, X. Replacing the Red Band with the Red-SWIR Band (0.74ρred+0.26ρswir) Can Reduce the Sensitivity of Vegetation Indices to Soil Background. Remote Sens. 2019, 11, 851. [Google Scholar] [CrossRef] [Green Version]
- Qi, J.; Chehbouni, A.; Huete, A.R.; Kerr, Y.H.; Sorooshian, S.A. Modified soil adjusted vegetation index. Remote Sens. Environ. 1994, 48, 119–126. [Google Scholar] [CrossRef]
- Jeihounia, M.; Alavipanah, S.K.; Toomaniana, A.; Jafarzadeh, A.A. Digital mapping of soil moisture retention properties using solely satellite based data and data mining techniques. J. Hydrol. 2019, 585, 124786. [Google Scholar] [CrossRef]
- Nemani, R.; Pierce, L.; Running, S.; Goward, S. Developing satellite-derived estimates of surface moisture status. J. Appl. Meteorol. 1993, 32, 548–557. [Google Scholar] [CrossRef] [Green Version]
- Sadeghi, M.; Babaeian, E.; Tuller, M.; Jones, S.B. The optical trapezoid model: A novel approach to remote sensing of soil moisture applied to Sentinel-2 and Landsat-8 observations. Remote Sens. Environ. 2017, 198, 52–68. [Google Scholar] [CrossRef] [Green Version]
- Ghulam, A.; Qin, Q.; Zhan, Z. Designing of the perpendicular drought index. Environ. Geol. 2007, 52, 1045–1052. [Google Scholar] [CrossRef]
- Salazar, M.P. Water Distribution and Drainage Systems of Aburrá Valley, Colombia—Empresas Públicas de Medellín, E.S.P. Procedia Eng. 2017, 186, 1877–7058. [Google Scholar]
- Casamitjana, M.; Loaiza, J.C. Propiedades físicas e hidrológicas en suelos derivados de cenizas volcánicas. In Movimientos en Masa; Casamitjana, Sidle, Eds.; Fondo Editorial EIA: Medellín, Colombia, 2019; ISBN 978-958-52367-0-7. [Google Scholar]
- Abera, G.; Wolde-Meskel, A. Soil properties [35and soil organic carbon stocks of tropical andosol under different land uses. Open J. Soil Sci. 2013, 3, 153–162. [Google Scholar] [CrossRef] [Green Version]
- Farhan, I.; Al-Bakri, J. Detection of a Real Time Remote Sensing Indices and Soil Moisture for Drought Monitoring and Assessment in Jordan. Open J. Geol. 2019, 9, 1048–1068. [Google Scholar] [CrossRef] [Green Version]
- West, H.; Quinn, N.; Horswell, M.; White, P. Assessing Vegetation Response to Soil Moisture Fluctuation under Extreme Drought Using Sentinel-2. Water 2018, 10, 838. [Google Scholar] [CrossRef] [Green Version]
- Zhang, J.; Zhang, Q.; Bao, A.; Wang, Y. A New Remote Sensing Dryness Index Based on the Near-Infrared and Red Spectral Space. Remote Sens. 2019, 11, 456. [Google Scholar] [CrossRef] [Green Version]
- Chi, Y.; Sun, Y.; Sun, Y.; Liu, S.; Fu, Z. Multi-temporal characterization of land surface temperature and its relationships with normalized difference vegetation index and soil moisture content in the Yellow River Delta, China. Glob. Ecol. Conserv. 2020, 23, e01092. [Google Scholar] [CrossRef]
- Luo, W.; Xianli, X.; Wen, X.; Wen, L.; Meixian, L.; Zhenwei, L.; Tao, P.; Chaohao, X.; Yaohuam, Z.; Ronfei, Z. UAV based soil moisture remote sensing in a karst mountainous catchment. CATENA 2019, 174, 478–489. [Google Scholar] [CrossRef]


| Soil Profile | x | y | pH (0–10 cm) | Soil Texture (0–10 cm) | NaF Reaction | Depth A Profile | Depth Volcanic Ashes | Kfs | Infiltration T10 |
|---|---|---|---|---|---|---|---|---|---|
| 1 | 841,661.7 | 1,174,433.7 | 5.1 | Loam | Moderate | 47 | 125 | 0.01574 | 39.3 |
| 2 | 841,812.6 | 1,174,370.8 | 5.2 | Silty loam | Strong | 34 | 106 | 0.01168 | 15 |
| 3 | 840,311.1 | 1,176,556.6 | 5.9 | Loam | Strong | 44 | 72 | 0.01815 | 7.33 |
| 4 | 840,298.9 | 1,176,382.1 | 5.5 | Loam | Strong | 44 | 150 | 0.00406 | 16.39 |
| 5 | 841,312.4 | 1,176,329.7 | 5.6 | Loam | Strong | 33 | 100 | 0.00899 | 134.33 |
| 6 | 841,552.3 | 1,176,249.2 | 5.3 | Loam | Strong | 26 | 120 | 0.015583 | 44.67 |
| 7 | 841,476.8 | 1,176,338.2 | 5 | Loam | Strong | 26 | 92 | 0.032536 | 123.33 |
| Land Use | NIR – Red Equation | M | PDI – SM (R2) |
|---|---|---|---|
| Pastures | y = −0.4276x + 0.5824 | −0.4276 | 0.4392 |
| Potatoes | y = −3.9215x + 0.65 | −3.9215 | 0.002 |
| Bare soil | y = 0.5921x + 0.165 | 0.5921 | 0.5062 |
| Land Use | NIR – Red Equation (R2) | M | PDI – SM (R2) |
|---|---|---|---|
| Pastures | y = 0.9083x + 4.2942(R² = 0.214) | 0.9083 | R² = 0.141 |
| Potatoes | y = −1.3897x + 6.562(R² = 0.322) | −1.3897 | R² = 0.0191 |
| Bare Soil | y = 1.6884x − 1.8164 (R² = 0.465) | 1.6884 | R² = 0.1137 |
| Spatial Resolution | Pastures | Potatoes | Bare Soil | |||||||||
|---|---|---|---|---|---|---|---|---|---|---|---|---|
| NDVI | NDWI | SAVI | PDI | NDVI | NDWI | SAVI | PDI | NDVI | NDWI | SAVI | PDI | |
| 4 | 0.02 (0.77) | −0.04 (0.67) | −0.11 (0.28) | 0.42 (1.649 × 10⁻⁵)▲▲ | 0.11 (0.24) | 0.21 (0.02)▲ | 0.07 (0.44) | 0.002 (0.34) | −0.22 (0.03)▲ | 0.34 (0.0002)▲▲ | 0.19 (0.04)▲ | 0.14 (0.02)▲ |
| 12 | 0.02 (0.85) | −0.002 (0.97) | 0.06 (0.55) | 0.26 (0.007)▲▲ | 0.11 (0.28) | 0.20 (0.03)▲ | 0.11 (0.23) | 0.074 (0.47) | −0.21 (0.04)▲ | 0.39 (2.21 × 10⁻⁵)▲▲ | −0.16 (0.09) | 0.19 (0.04)▲ |
| 40 | 0.007 (0.94) | −0.01 (0.89) | −0.17 (0.10) | 0.37 (0.0001)▲▲ | 0.15 (0.11) | 0.21 (0.02)▲ | 0.13 (0.16) | 0.13 (0.16) | −0.11 (0.25) | −0.02(0.79) | −0.19 (0.03)▲ | 0.16 (0.09) |
| 100 | 0.01 (0.91) | −0.01 (0.90) | −0.12 (0.25) | 0.37 (0.0001)▲▲ | 0.15 (0.11) | 0.20 (0.03)▲ | 0.15 (0.10) | 0.13 (0.17) | −0.05 (0.55) | 0.29 (0.002)▲▲ | −0.04 (0.64) | 0.005 (0.09) |
| 300 | 0.004 (0.96) | −0.02 (0.83) | 0.26 (0.01) | 0.36 (0.0002)▲▲ | 0.06 (0.51) | 0.11 (0.02)▲ | 0.09 (0.33) | 0.10 (0.29) | −0.16 (0.36) | 0.23 (0.01)▲ | −0.07 (0.41) | 0.08 (0.36) |
| 300sat | 0.597 (0.0001)▲▲ | −0.08 (0.40) | 0.10 (0.39) | −0.31 (0.19) | 0.19 (0.04)▲ | 0.23 (0.01)▲ | 0.23 (0.54) | 0.13 (0.19) | −0.38 (5.6 × 10⁻⁵)▲▲ | 0.43 (9.16 × 10⁻⁶)▲▲ | −0.23 (0.01)▲ | 0.11 (0.54) |
© 2020 by the authors. Licensee MDPI, Basel, Switzerland. This article is an open access article distributed under the terms and conditions of the Creative Commons Attribution (CC BY) license (http://creativecommons.org/licenses/by/4.0/).
Share and Cite
Casamitjana, M.; Torres-Madroñero, M.C.; Bernal-Riobo, J.; Varga, D. Soil Moisture Analysis by Means of Multispectral Images According to Land Use and Spatial Resolution on Andosols in the Colombian Andes. Appl. Sci. 2020, 10, 5540. https://doi.org/10.3390/app10165540
Casamitjana M, Torres-Madroñero MC, Bernal-Riobo J, Varga D. Soil Moisture Analysis by Means of Multispectral Images According to Land Use and Spatial Resolution on Andosols in the Colombian Andes. Applied Sciences. 2020; 10(16):5540. https://doi.org/10.3390/app10165540
Chicago/Turabian StyleCasamitjana, Maria, Maria C. Torres-Madroñero, Jaime Bernal-Riobo, and Diego Varga. 2020. "Soil Moisture Analysis by Means of Multispectral Images According to Land Use and Spatial Resolution on Andosols in the Colombian Andes" Applied Sciences 10, no. 16: 5540. https://doi.org/10.3390/app10165540