Numerical Investigation of Methodologies for Cavitation Suppression Inside Globe Valves


1
SUFA Technology Industry Co., Ltd., CNNC, Suzhou 215129, China
2
Institute of Process Equipment, College of Energy Engineering, Zhejiang University, Hangzhou 310027, China
*
Author to whom correspondence should be addressed.
Appl. Sci. 2020, 10(16), 5541; https://doi.org/10.3390/app10165541
Submission received: 20 July 2020
/
Revised: 3 August 2020
/
Accepted: 7 August 2020
/
Published: 11 August 2020
(This article belongs to the Special Issue New Advances of Cavitation Instabilities)
Abstract
:Cavitation inside globe valves, which is a common phenomenon if there is a high-pressure drop, is numerically investigated in this study. Firstly, the cavitation phenomenon in globe valves with a different number of cages is compared. When there is no valve cage, cavitation mainly appears at the valve seat, the bottom of the valve core, and the downstream pipelines. By installing a valve cage, cavitation bubbles can be restricted around the valve cage protecting the valve body from being damaged. Secondly, the effects of the outlet pressure, the working temperature, and the installation angle of two valve cages in a two-cage globe valve are studied to find out the best method to suppress cavitation, and cavitation number is utilized to evaluate cavitation intensity. Results show that cavitation intensity inside globe valves can be reduced by increasing the valve outlet pressure, decreasing the working temperature, or increasing the installation angle. Results suggest that increasing the outlet pressure is the most efficient way to suppress cavitation intensity in a globe valve, and the working temperature has a minimal effect on cavitation intensity.
1. Introduction
For the valves applied in the industrial pipelines, there is often a reduction of the flow channel around the valve seat or the valve plug, where the liquid pressure may fall below the saturated vapor pressure and the cavitation phenomenon may occur. Hence cavitation is one of the reasons that can lead to valve failure if a valve is not designed appropriately [1].
Valves play important roles in many working scenarios, and common applications include flow, pressure, and temperature control; common valves including ball valves [2], control valves [3], and globe valves [4], etc. are summarized and shown in Table 1. Works about valves mainly focus on the flow characteristics and structure optimization. Qian et al. [5] investigated the acoustic power with different thermal conditions in a temperature and pressure regulation valve. Fratini and Pasta [6] investigated the effects of the residual stress on the fatigue crack. Wang et al. [7] designed a new spool structure and various pressure and valve openings were investigated to find out their effects on the stability of the flow field. Lin et al. [8] studied the two-phase flow characteristics of a gate valve and the effects of size and numbers of the particles on erosion were analyzed. Jin et al. [9] and Qian et al. [10,11,12] applied the Tesla valves in the hydrogen decompression process and the flow characteristics and the aerodynamic noise of a single and a multi-stage Tesla valve was investigated. Fan et al. [13] focused on the contaminated friction of a spool valve. Qian et al. [3] investigated the flow characteristics of a feed-water valve with different structures of the throttling window. Yan et al. [14] focused on the erosion in a servo valve. Pasta et al. [15] and Rinaudo et al. [16] investigated the hemodynamics in biomedical heart valves and the results could be helpful for the clinical diagnosis. Zhang et al. [17] studied the effects of the damping sleeve on the flow force of an on-off valve. Zhong et al. [18] proposed a two-level fuzzy control algorithm based on the calculated flow rate feedback from the spool displacement to realize high precision flow control.
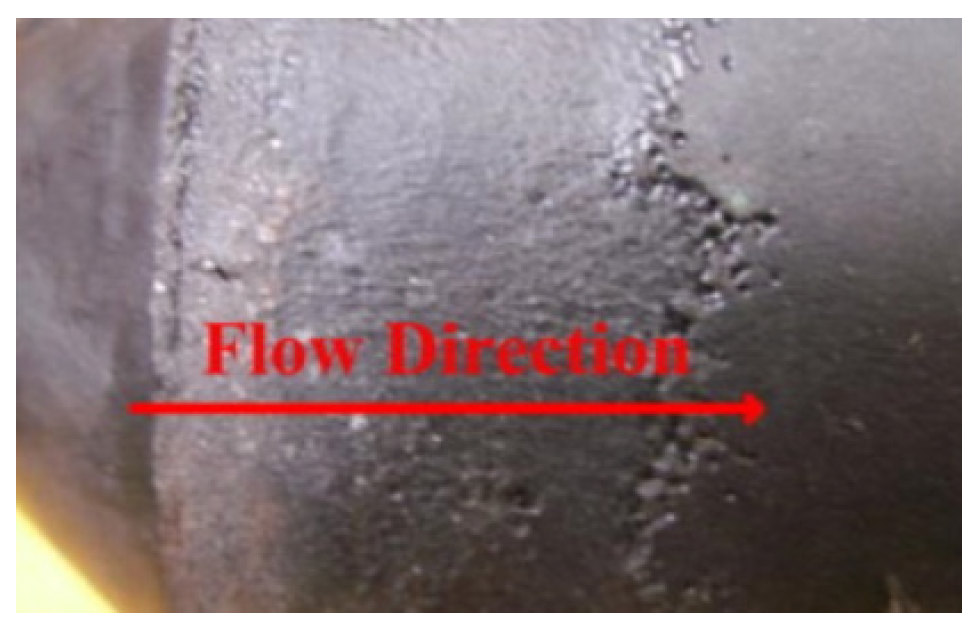
Cavitation that appears in the valve can lead to self-excited noise, cavitation erosion, and system jam, etc. [19,20], and it may even cause severe damage to the valve spool as shown in Figure 1 [21]. To date, more and more works focusing on the cavitation problem in various kinds of valves can be found, and an experimentally verified computational fluid dynamics (CFD) method is becoming a popular tool [22,23]. Wen et al. [24] studied the velocity of a needle valve motion on cavitation using the dynamic grid overlapping techniques and a visual experimental platform. Li et al. [25] focused on the cavitation in bileaflet mechanical heart valves and their results showed that it was induced by the high closing velocity and water hammer effect. Jin et al. [26,27] investigated the cavitation in a globe valve and a sleeve regulating valve, and the effects of the valve core shape and the inlet velocity were obtained. Liu et al. [28] studied the effects of inlet pressure on cavitation location and area in a regulating valve, and Qiu et al. [29] focused the effects of valve opening and pressure drop of a sleeve regulating valve. Liu et al. [30] investigated the cavitation erosion in a butterfly valve with various inlet pressure and valve opening angles. Jin et al. [31] numerically analyzed the cavitating flow in microchannels and the effects of the diameter ratio and pressure drop were discussed. Zhang [32] studied the flow characteristics of a cone throttle valve under cavitation, and the cavitation luminescence was used to help relative experiments. Yuan et al. [33] compared the compressible and incompressible method, and their results showed that the compressible method could provide more precise results.
To suppress or prevent the occurrence of cavitation, valve structure optimization, adding outlet pressure, or adding stage/anti-cavitation trims is inevitable. Yaghoubi et al. [4] numerically studied the effects of the numbers of valve trims on cavitation intensity, and their results showed that the numbers of valve trims should be below two. Xu et al. [34] performed structure optimization of the valve port in a relief valve to reduce cavitation intensity. Shi et al. [35] utilized a drainage device to suppress the cavitation in a throttle valve, and cavitation intensity could be reduced with appropriate inlet and outlet pressure. Lee et al. [36] optimized the structure of the bottom plug in a three-way reversing valve to suppress valve cavitation. Chern et al. [37] found that by adding a valve cage, cavitation could be limited to the region close to the valve cage, and the valve body could be protected from damage resulting from valve cavitation.
Globe valves are widely used in nuclear and thermal power stations, or in petrochemical fields, where there is often a high-pressure drop condition resulting in cavitation inside globe valves [37]. In this paper, a globe valve with two valve cages is proposed to suppress valve cavitation, and each cage has 20 evenly distributed slender orifices. Firstly, the flow characteristics of the globe valve with and without valve cage are compared to investigate cavitation distribution and cavitation intensity. Then the effects of the working temperature and the valve outlet pressure on cavitation intensity for the globe valve with two valve cages are studied. At last, the effects of the installation angle of two valve cages are analyzed and the most efficient method to reduce cavitation intensity is found out.
2. Numerical Methods
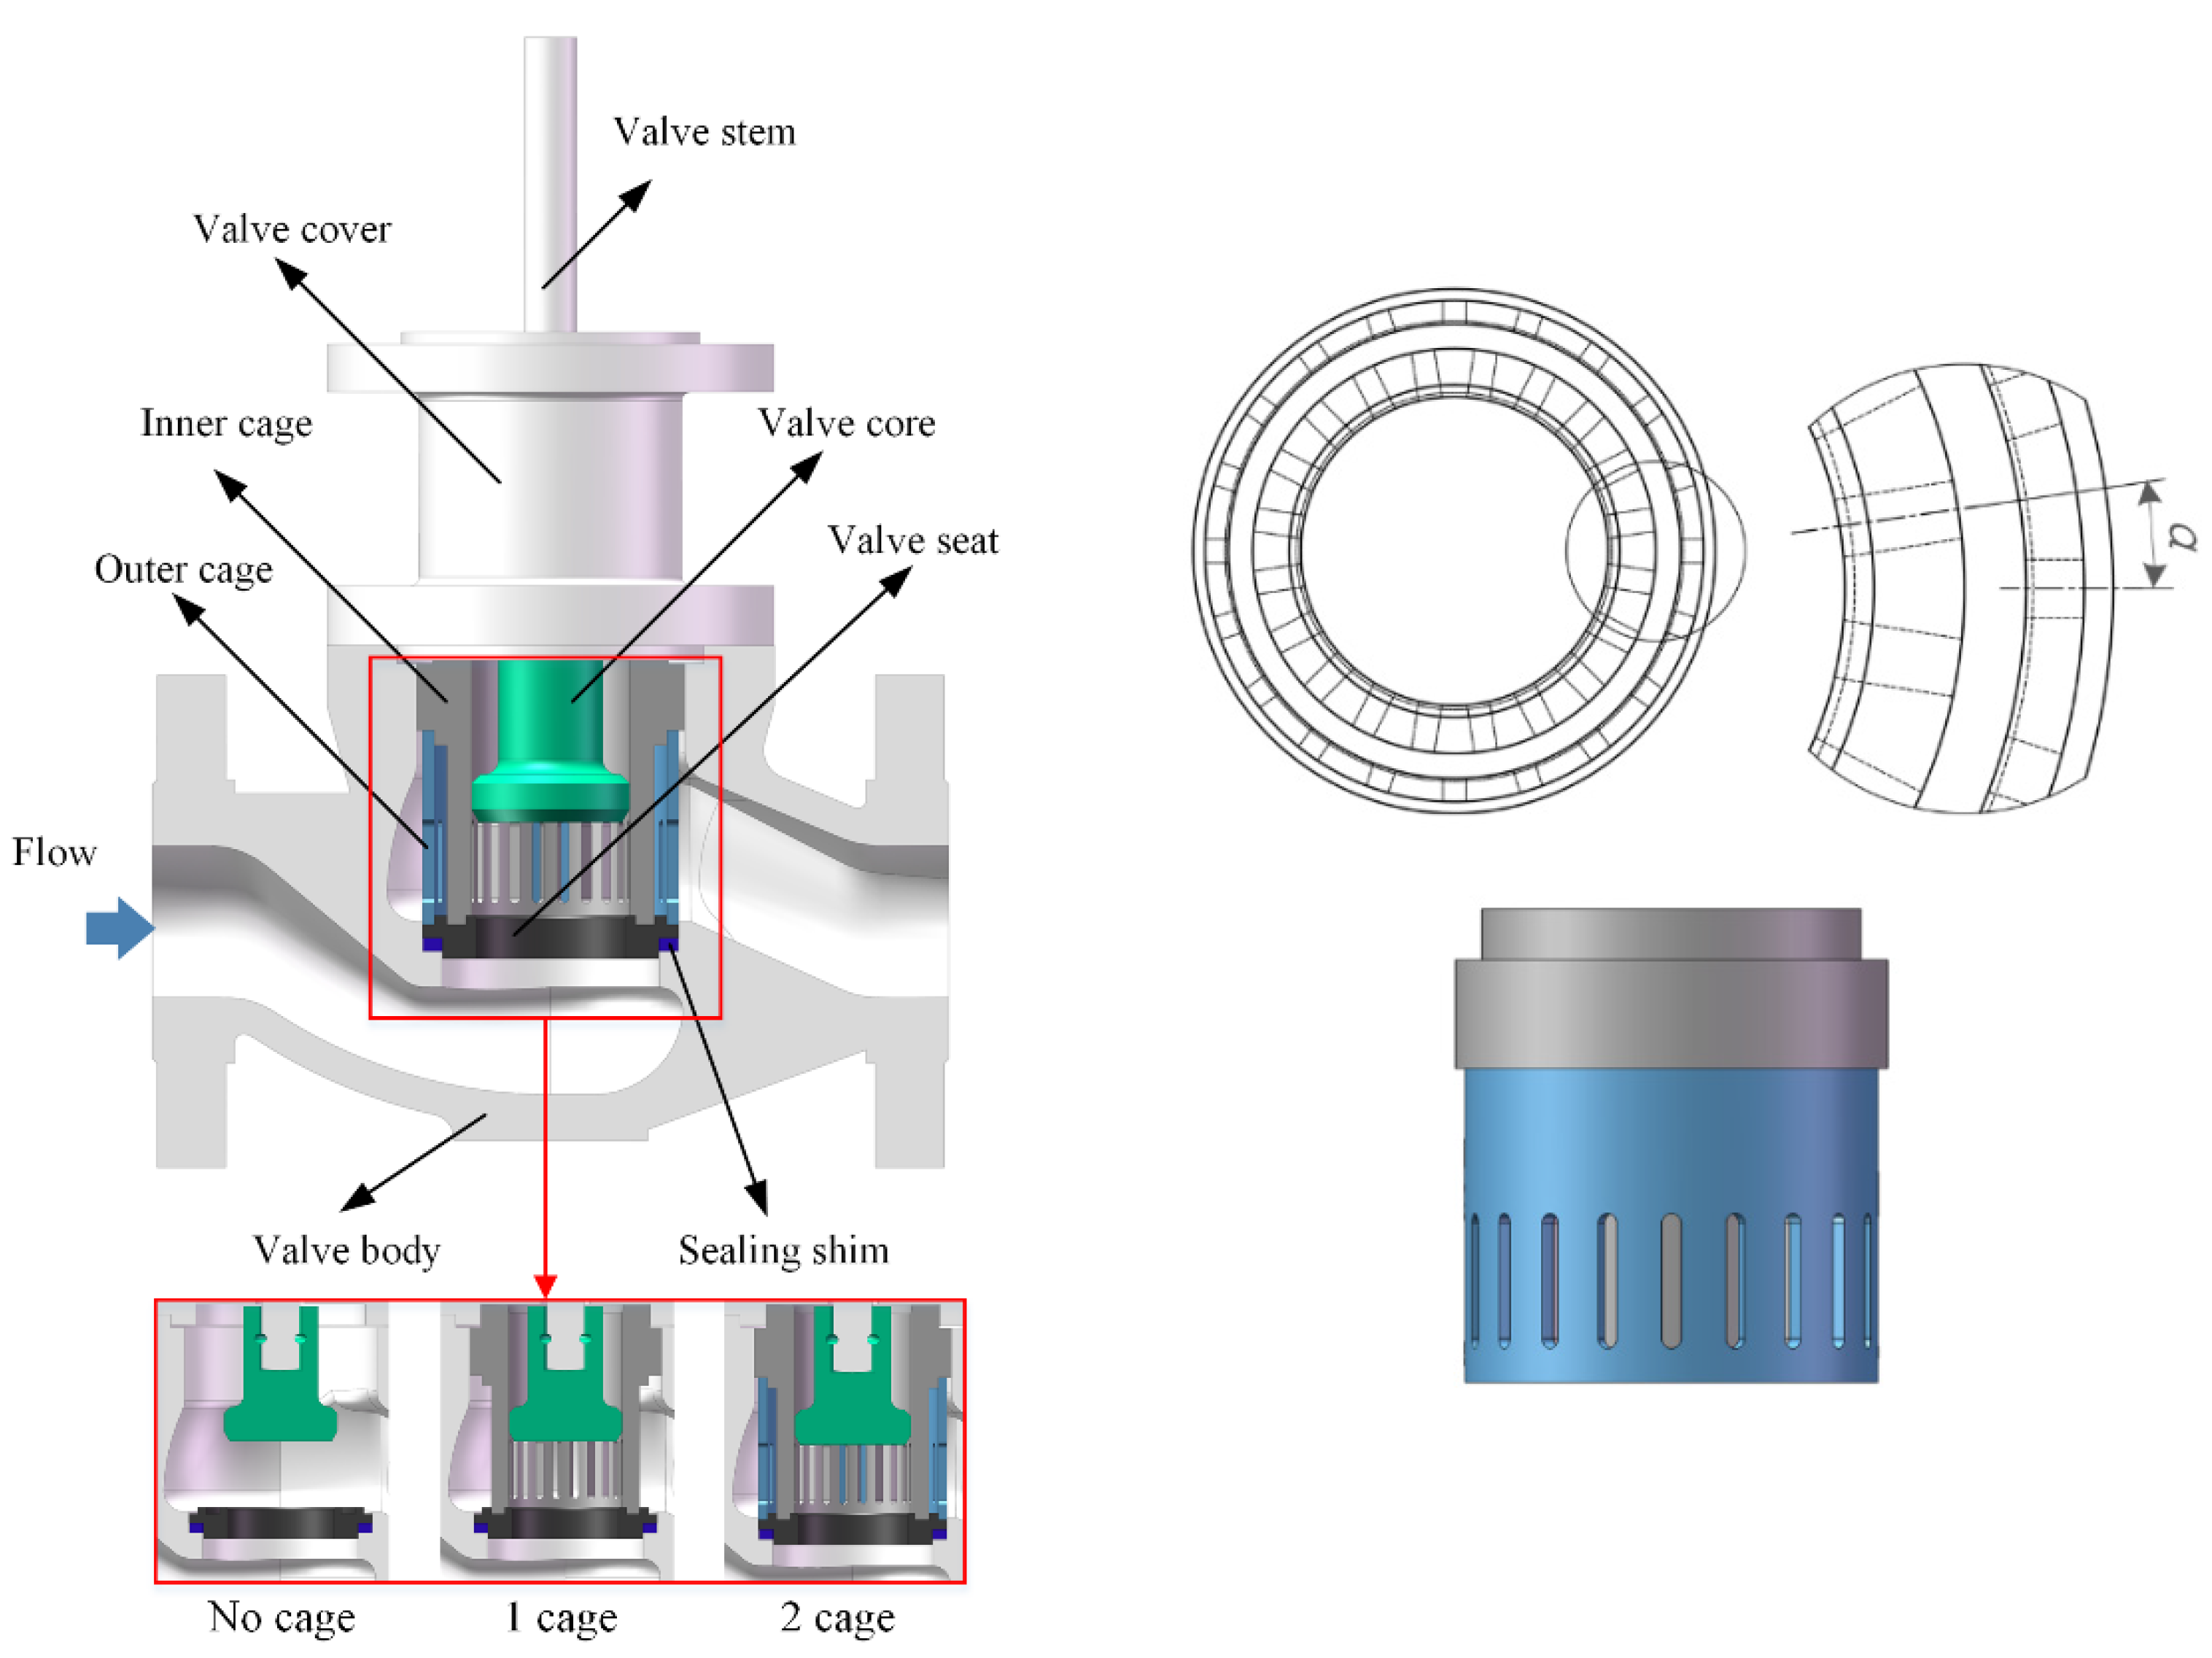
The structure of the investigated globe valve is shown in Figure 2; here the globe valve with a different number of cages and the geometry of the cage are displayed. The two-stage globe valve is self-designed to be used in the pipe system with a high-pressure drop, and the model is created using commercial software SOLIDWORKS. The nominal pipe diameter of the globe valve, D, is 50 mm, and the entrance pipe length is 3 D and the downstream pipe length is 8 D. The throttling orifices on each cage are the same and are evenly distributed along the circumference. The throttling orifices on two cages can either be installed aligned or be installed with an installation angle, α, as shown in Figure 2.
Fluid flow through the two-cage globe valve with a fully opened state is numerically solved. Liquid water and water vapor under different temperatures are considered as the incompressible working fluid, and the properties of the working fluid are shown in Table 2. The continuity and the momentum equations are solved using commercial software ANSYS Fluent, and the governing equations and the equations of the Realizable k-ε turbulence model can be found in the previous work [26]. The cavitation model proposed by Zwart et al. [38] is used and the equations describing cavitation are shown below.
here α is vapor volume fraction, subscript v stands for vapor phase, ρ stands for density, u stands for velocity, Re and Rc are related to the growth and collapse of the vapor bubbles, RB, Fvap, and Fcond are model constant. During the simulation, the pressure-based SIMPLE (Semi-Implicit Method for Pressure Linked Equations) algorithm is utilized, and the second-order upwind discretization scheme is applied. The residuals are set as 0.001 and the area-weighted inlet velocity is monitored, and the solution is considered as converged if the residual is below 0.001 and the inlet velocity is constant.
Pressure inlet and pressure outlet are applied as the main boundary conditions. The inlet pressure is 1.17 MPa, and the outlet pressure varies from 0.1 to 0.25 MPa. The no-slip wall with the scalable wall function is used. The temperature variation is neglected during the simulation.
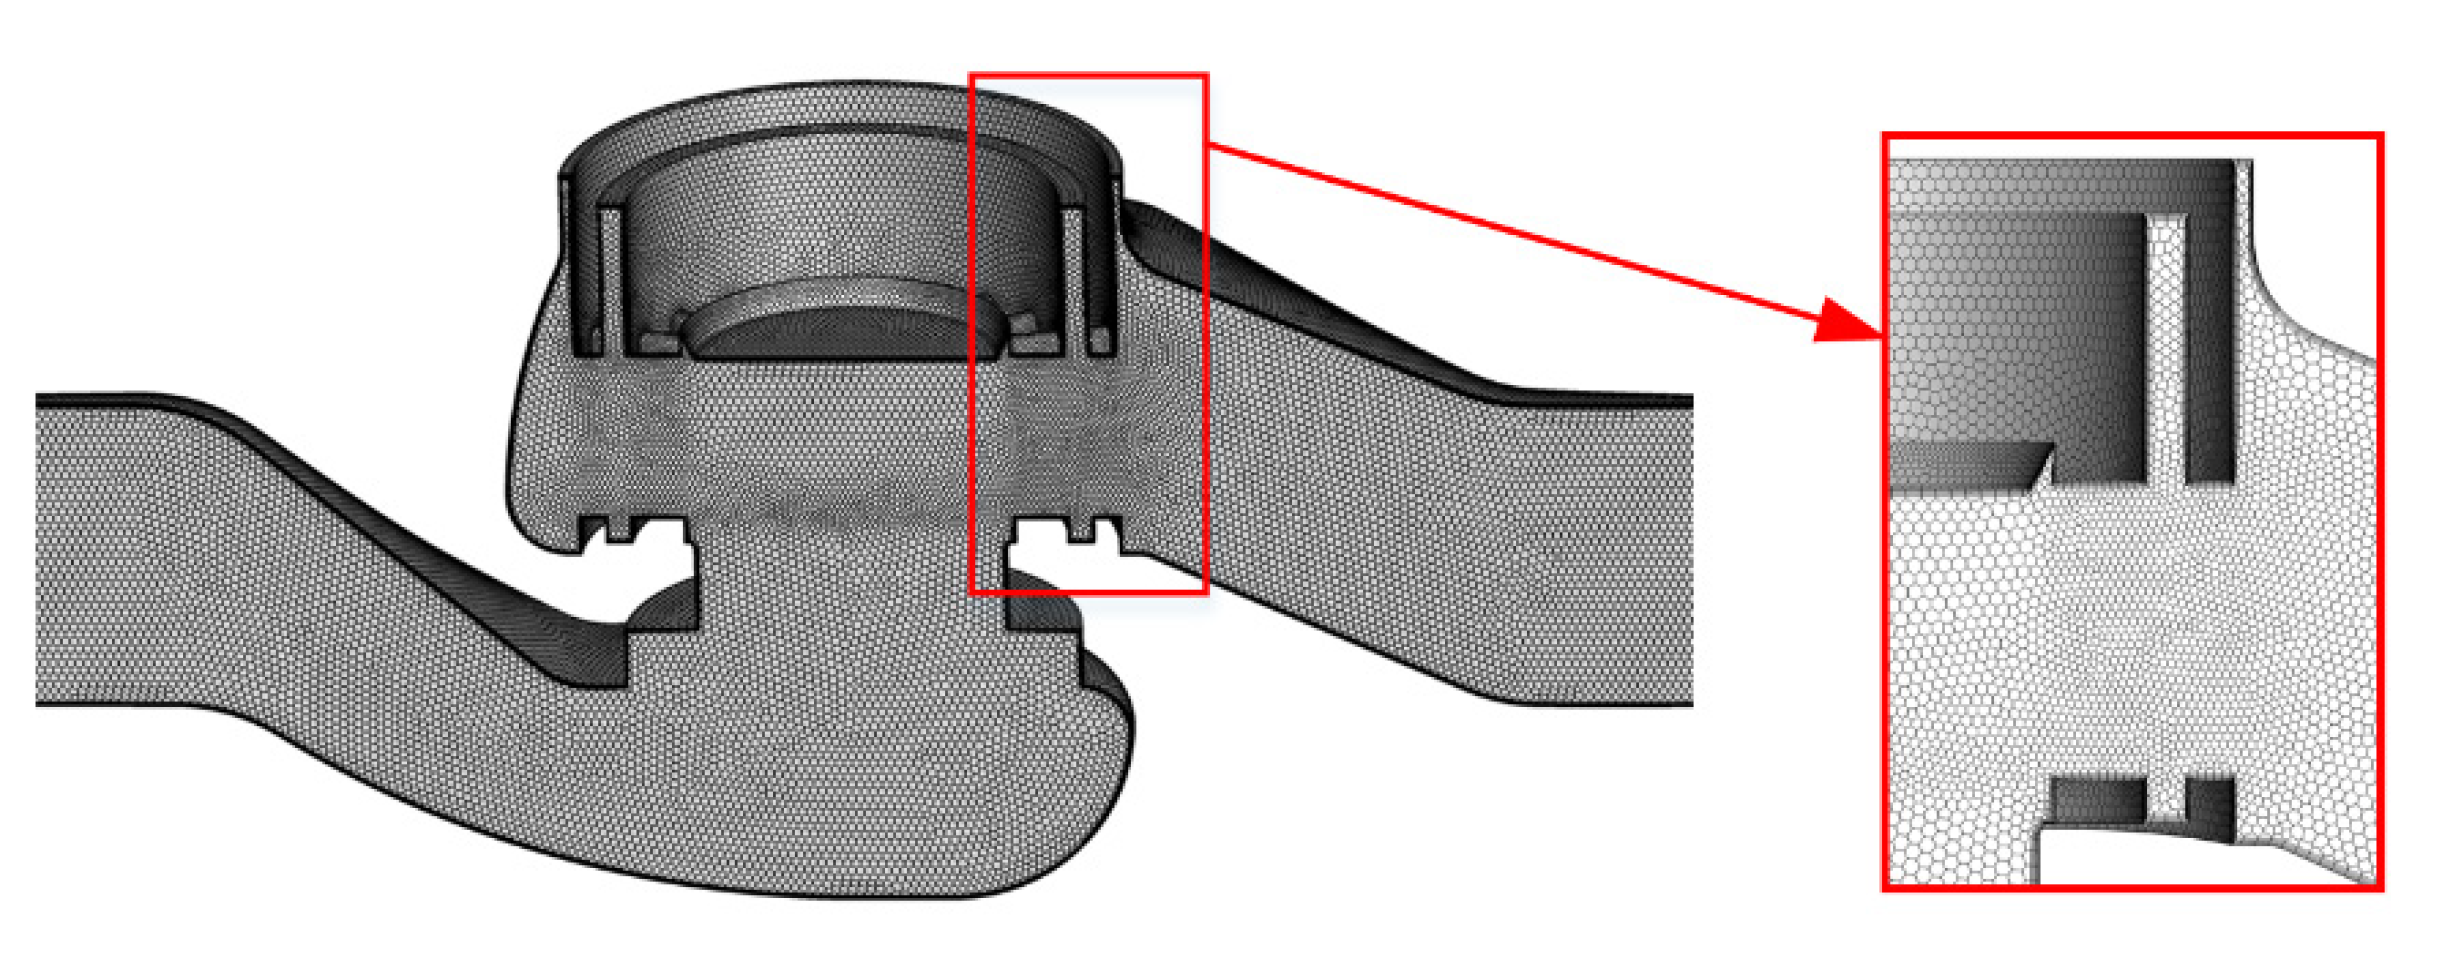
A polyhedral mesh with boundary layer is utilized in this study, and the zone near the throttling window of the cage is refined. Figure 3 shows the mesh of the investigated two-cage globe valve. Mesh independence is done with a different number of grid cells when the outlet pressure is 0.25 MPa and the temperature is 80 °C. The inlet velocity and pressure drop are compared and shown in Table 3, and it is clear that the results are close when the cell number is 824,206 and 1,550,930, thus 824,206 cells are adopted eventually.
3. Results and Discussion
The globe valve with and without cages is compared in this study, and the installation angle between two cages, the outlet pressure, and the working temperature are investigated. Flow on the middle plane of the valve body including the velocity and pressure distributions and the streamlines are analyzed to help understanding the cavitation phenomenon. Cavitation number, loss coefficient, and induced water vapor volume are quantitatively studied and compared.
3.1. Comparison of Cavitation in Globe Valves with and without Cages
When there is a large pressure drop, local pressure is very likely to drop under the saturated vapor pressure. Here, the globe valve without a cage, the globe valve with one cage and the globe valve with two cages are simply compared to find out the effects of the cage. The outlet pressure is chosen as 0.1 MPa and the working temperature is 80 °C.
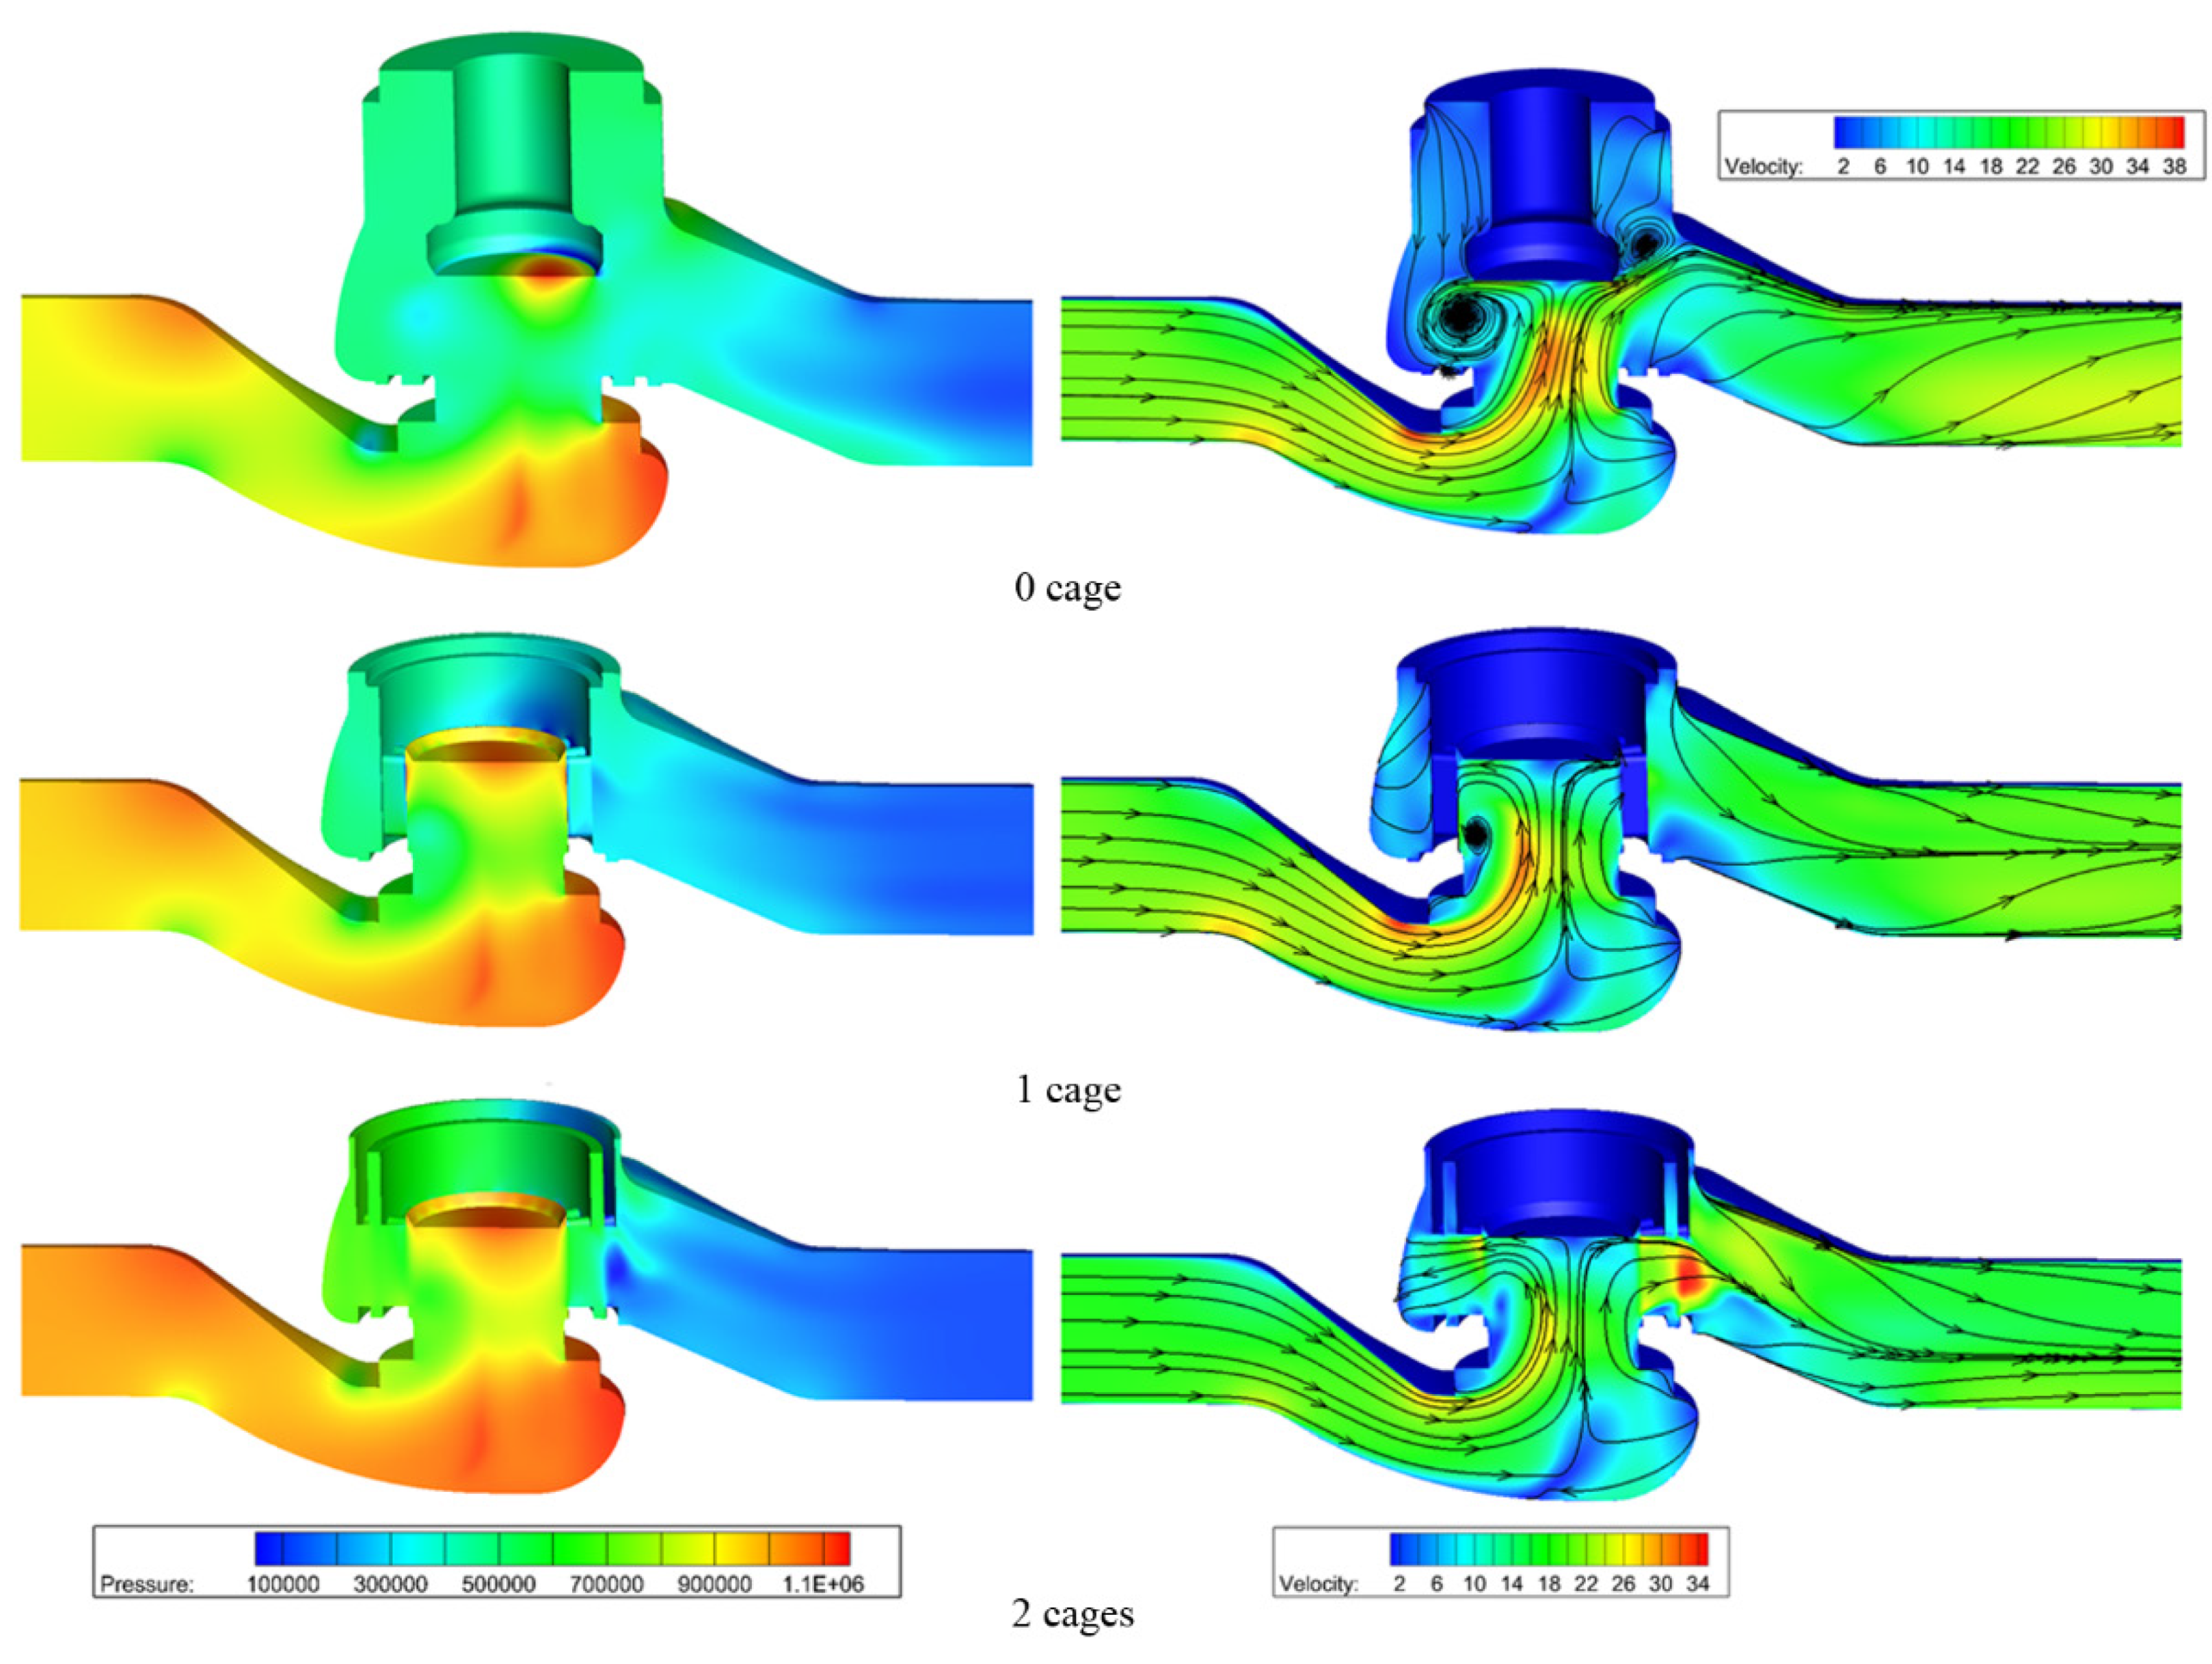
The velocity and pressure distributions in the globe valve with a different number of cages are shown in Figure 4, and an obvious difference in the velocity and pressure distributions can be found between different globe valves. The Reynolds number is around 7 × 10⁵, which means the flow regime is turbulent. At the bottom of the valve body, there is a high-pressure and low-velocity zone, which results from the sudden change of the flow direction. When there is no cage, most water flows directly toward the valve downstream, resulting in a small high-pressure zone at the bottom of the valve core closing to the valve outlet. While cages are added, the valve resistance increases, and the pressure distribution at the valve core bottom becomes more even. From Figure 4, it can also be found that the cage number has little influence on the streamline distribution once the cage is added.
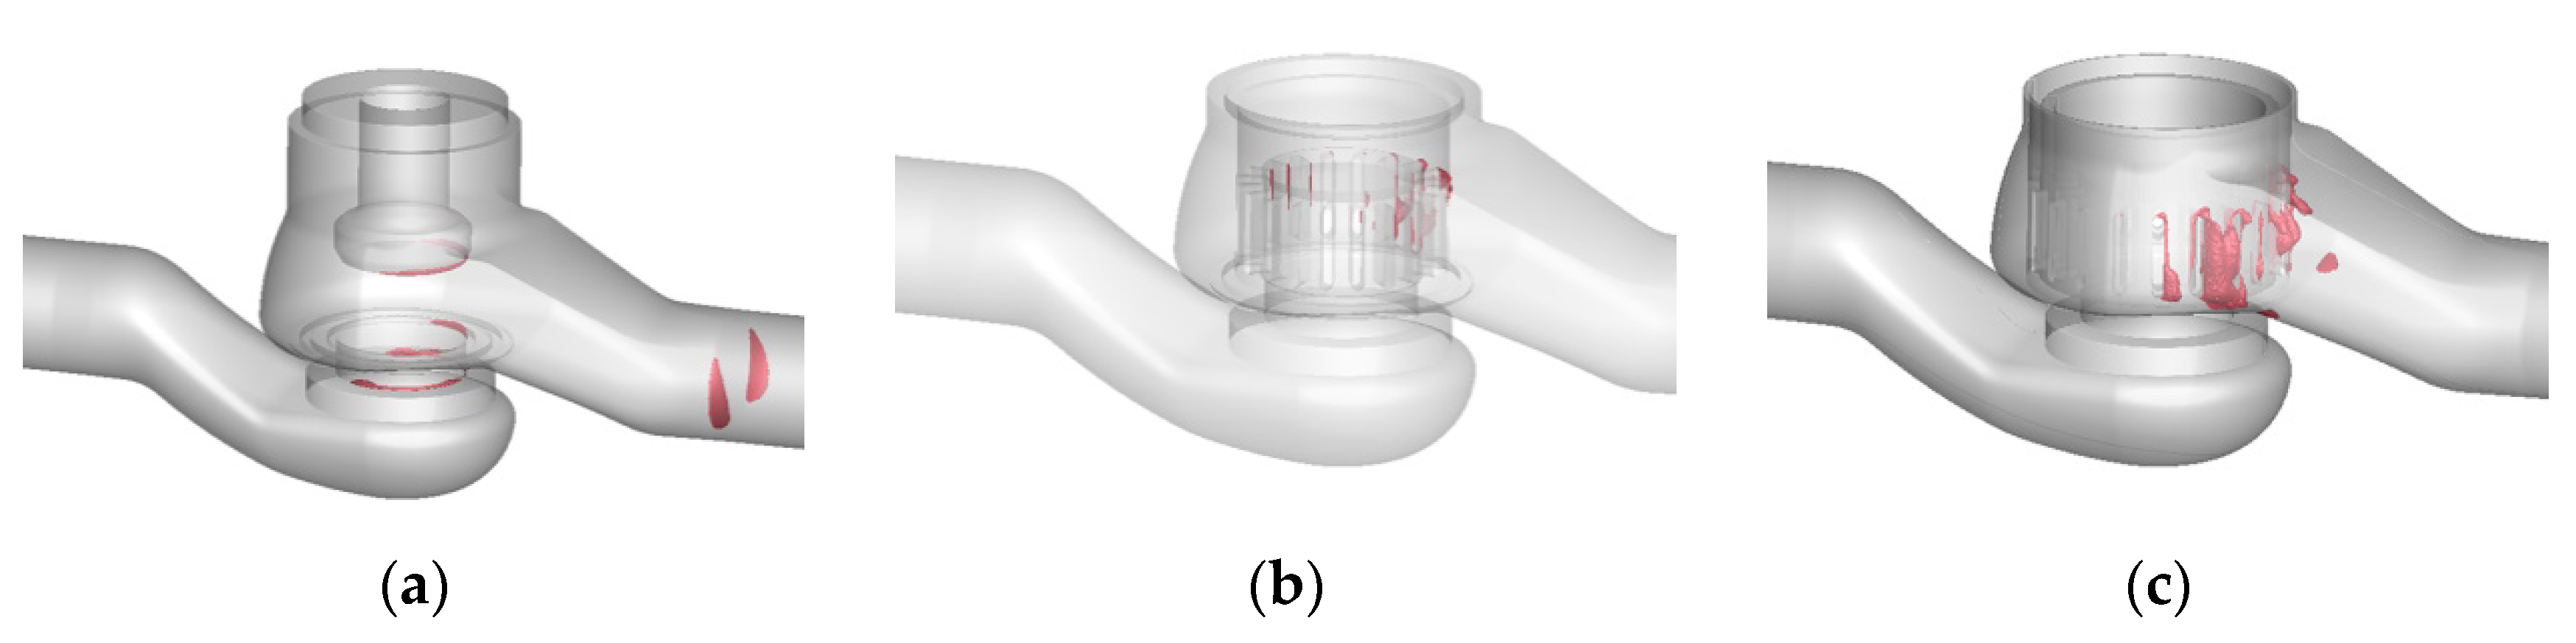
When water vapor volume fraction is above 0.1, the water vapor volume distribution in different globe valves is compared qualitatively [4,37] and shown in Figure 5. It is clear that cavitation caused water vapor mainly congregates around the valve seat and the bottom of the valve core if there is no cage, but the water vapor only appears at the location near the valve outlet, which is because of the high velocity and low pressure as shown in Figure 4. Besides, a relatively large water vapor volume can be found at the location where the valve body and the downstream pipe connect. When a cage is added, the region where water vapor appears varies and is limited close to the cage itself, which protects the valve body from being damaged. When two cages are added, the region where cavitation appears reduces further but is still near the two cages.
To compare cavitation intensity in a globe valve with a different number of cages, dimensionless cavitation number σ is used. The expression of the cavitation number is shown below.
here po is the pressure at valve outlet, pv is the saturated vapor pressure, ρ is the density of water, v is the velocity at the valve outlet.
The loss coefficient ξ is also calculated to analyze the flow characteristics of different globe valves. The expression of the loss coefficient is shown below.
here pi is the pressure at valve inlet.
The comparison of the cavitation number and the loss coefficient between different globe valves is shown in Figure 6. It can be found that the cavitation number and the loss coefficient increase with the increase in the valve cage number, which means that cavitation intensity can be suppressed by adding a valve cage in a globe valve. In Figure 5, it is noticed that the water vapor volume in the globe valve with two cages is higher than other globe valves. The reason is that when the total pressure in the valve inlet is the same, the velocity inside the globe valve with two cages is lower due to high resistance, which leads to a higher static pressure at valve inlet. Thus, the actual water vapor volume is higher in the globe valve with two cages. Together with Figure 5 and Figure 6, it can also be found that the cavitation number is useful when deciding the cavitation intensity in valves.
3.2. Effects of the Working Temperature and Outlet Pressure
When the outlet pressure and the working temperature vary, the total pressure drop or the saturated vapor pressure changes, thus leading to the variation of cavitation intensity. In this section, the effects of the working temperature and the outlet pressure are studied and compared.
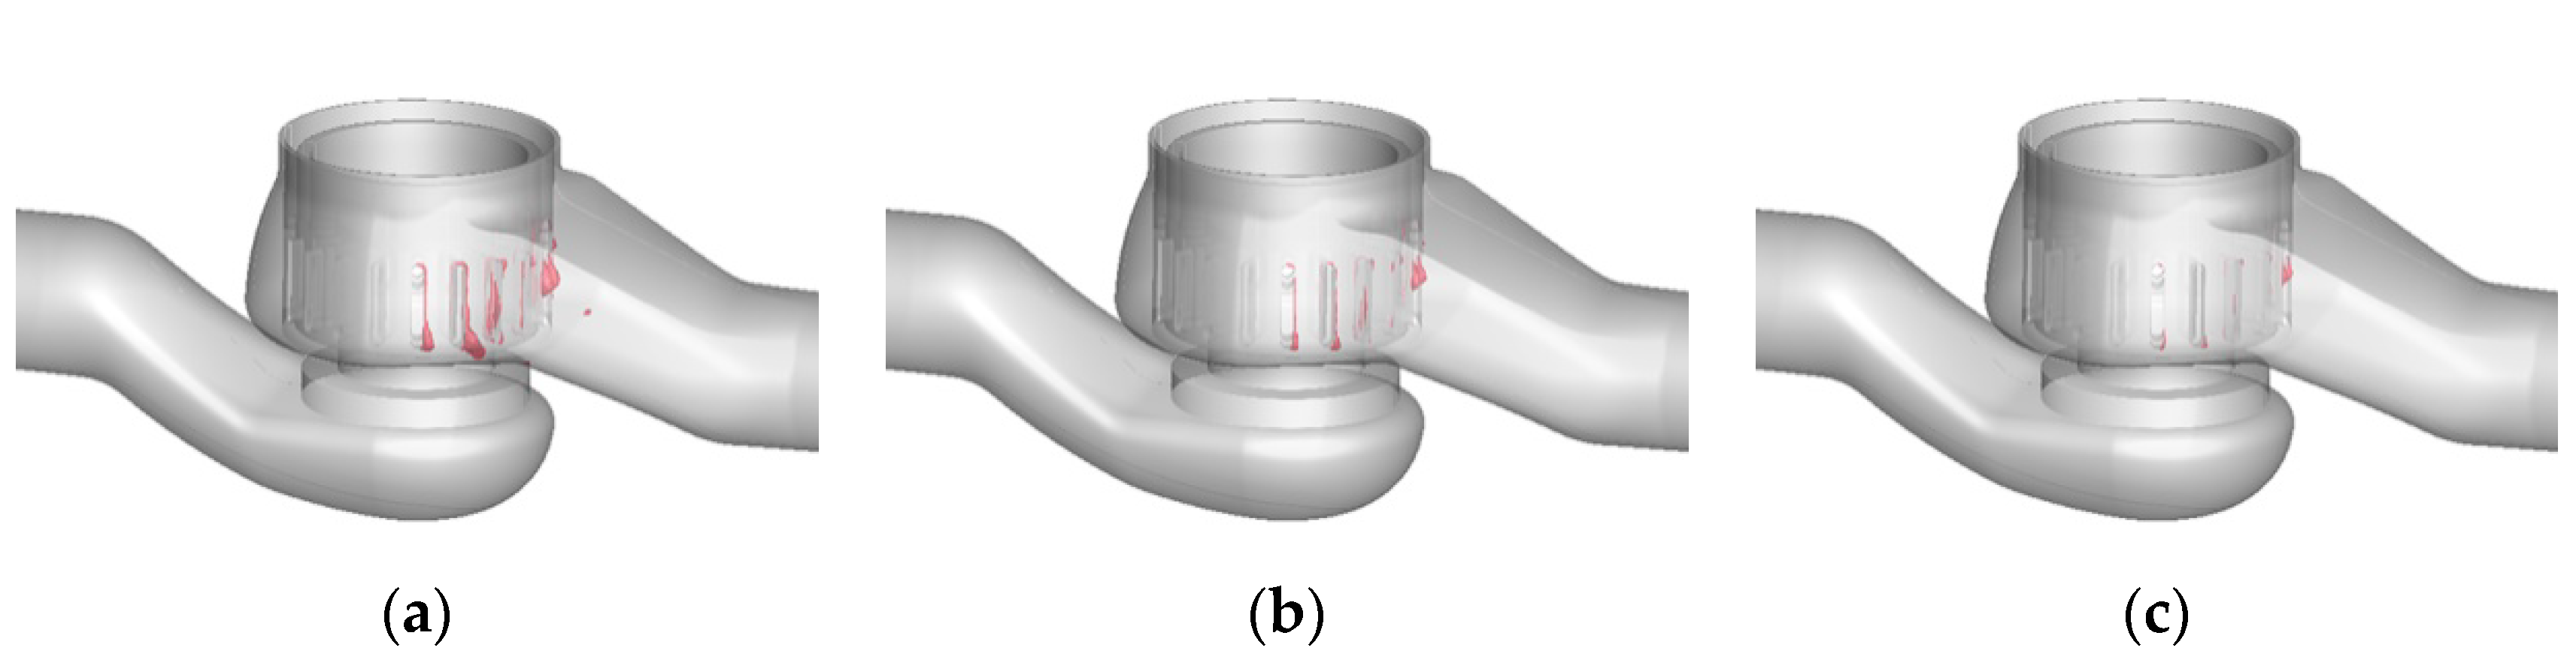
Figure 7 and Figure 8 show the water vapor volume distribution in the two-cage globe valve under different outlet pressures and different working temperatures. The working temperature for Figure 7 is 80 °C, and the outlet pressure for Figure 8 is 0.1 MPa. The water vapor volume decreases with the increase in the outlet pressure or the decrease in the working temperature. Based on the water vapor volume distributions, one can find that increased outlet pressure has more positive effects on cavitation intensity than the working temperature.
To investigate the effects of the outlet pressure and the working temperature quantitatively, the cavitation number and the loss coefficient are compared in Figure 9, where the straight line stands for cavitation number, and the dash line stands for the loss coefficient. It can be found that the cavitation number increases with the increase in the outlet pressure and the decrease in the working temperature, which is consistent with the above results. Cavitation number almost has a linear relationship with the outlet pressure. When the outlet pressure increases by 0.05 MPa, the cavitation number increases nearly by 0.4. While the increment of the cavitation number decreases with the decrease in the working temperature. When the working temperature decreases from 80 °C to 60 °C, the average increment of cavitation number is 0.134, and the average increment of cavitation number is 0.0538 if the working temperature decreases from 40 °C to 20 °C.
The loss coefficient barely changes with varying outlet pressure which is because the loss coefficient is affected by the pressure difference between the valve inlet and valve outlet shown in Equation (5). However, with the increase in the working temperature, the loss coefficient decreases firstly then increases rapidly, and when the working temperature is 80 °C, the loss coefficient has the maximum value. The difference of the loss coefficient may be caused by the cavitation phenomenon inside valves.
In the numerical simulation applied in this study, the finite volume method is used. Thus, the water vapor volume in valves can be calculated based on the water vapor fraction and the discrete volume, and the expression is shown below.
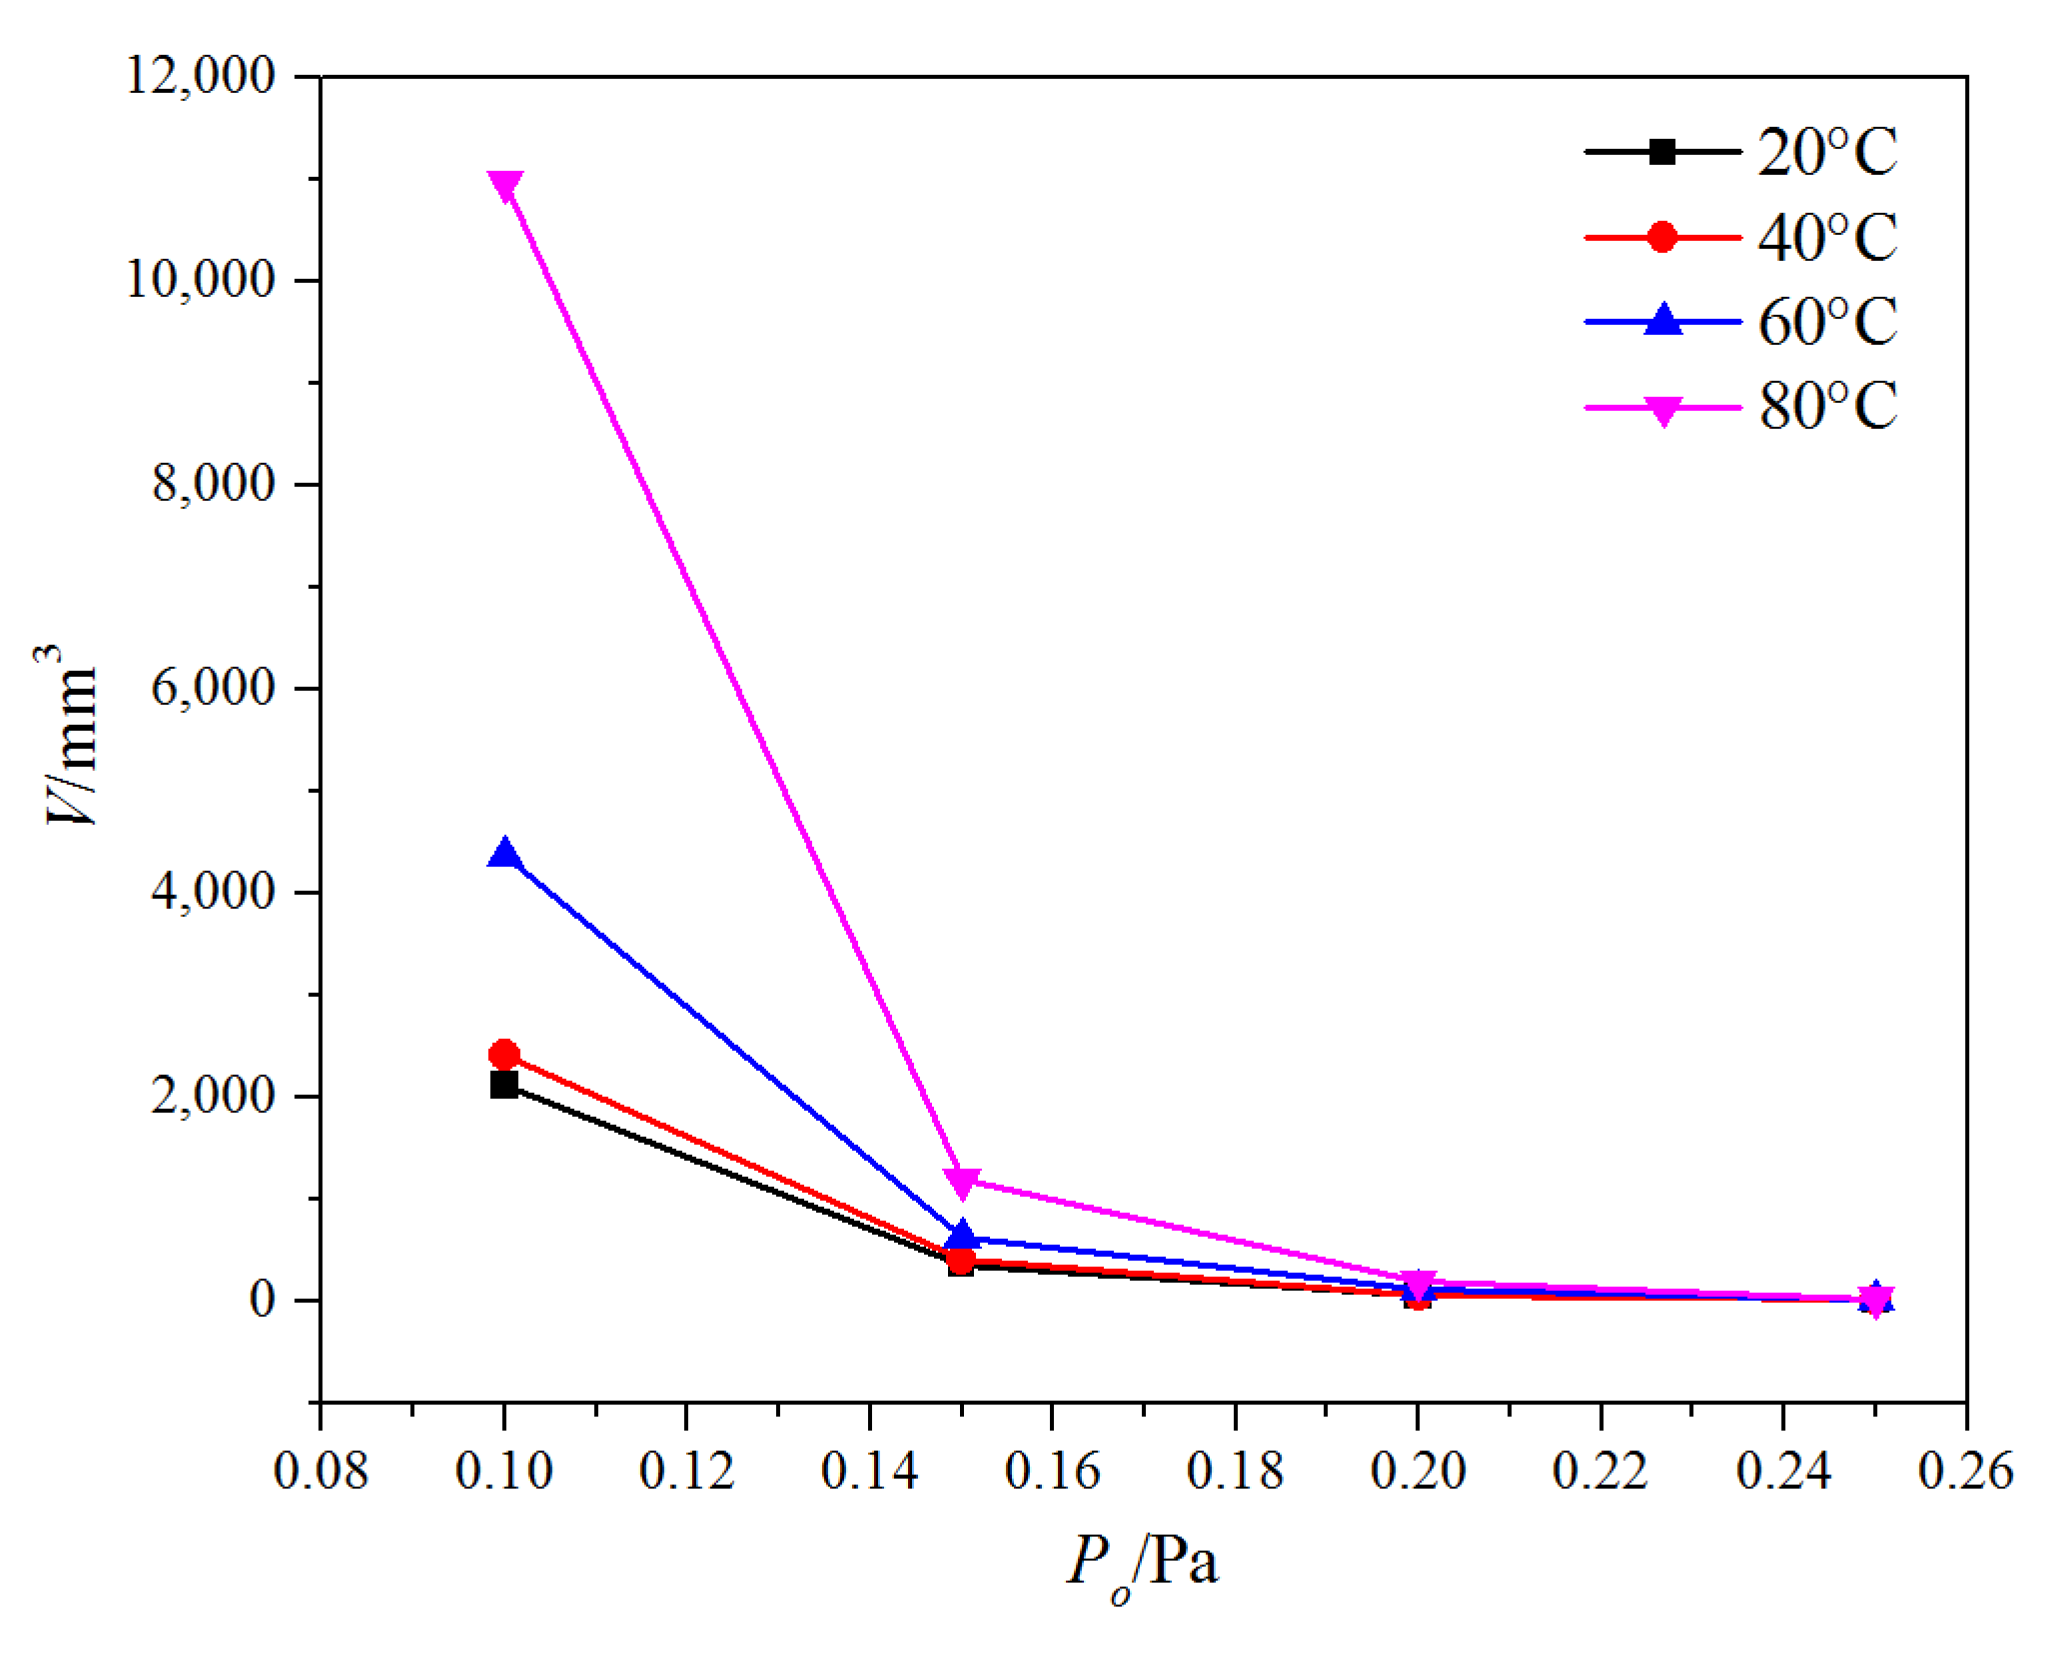
here V stands for the total water vapor volume in a valve, n stands for the total number of the discrete volume, dV stands for the volume of a discrete volume, αv stands for the water vapor fraction in a discrete volume. The water vapor volume in the investigated two-cage globe valve under different outlet pressures and the different working temperatures is shown in Figure 10. It can be found that when the outlet pressure is larger than 0.2 MPa, the variation of water vapor volume under different working temperatures is small. While the outlet pressure is smaller than 0.2 MPa, the water vapor volume increases with the increase in the working temperature and the outlet pressure, and the higher the working temperature, the greater the influence of the outlet pressure on water vapor volume. Together with Figure 8, it can be concluded that increase in the outlet pressure is more effective in suppressing the cavitation than the decrease in the working temperature.
3.3. Effects of the Installation Angle
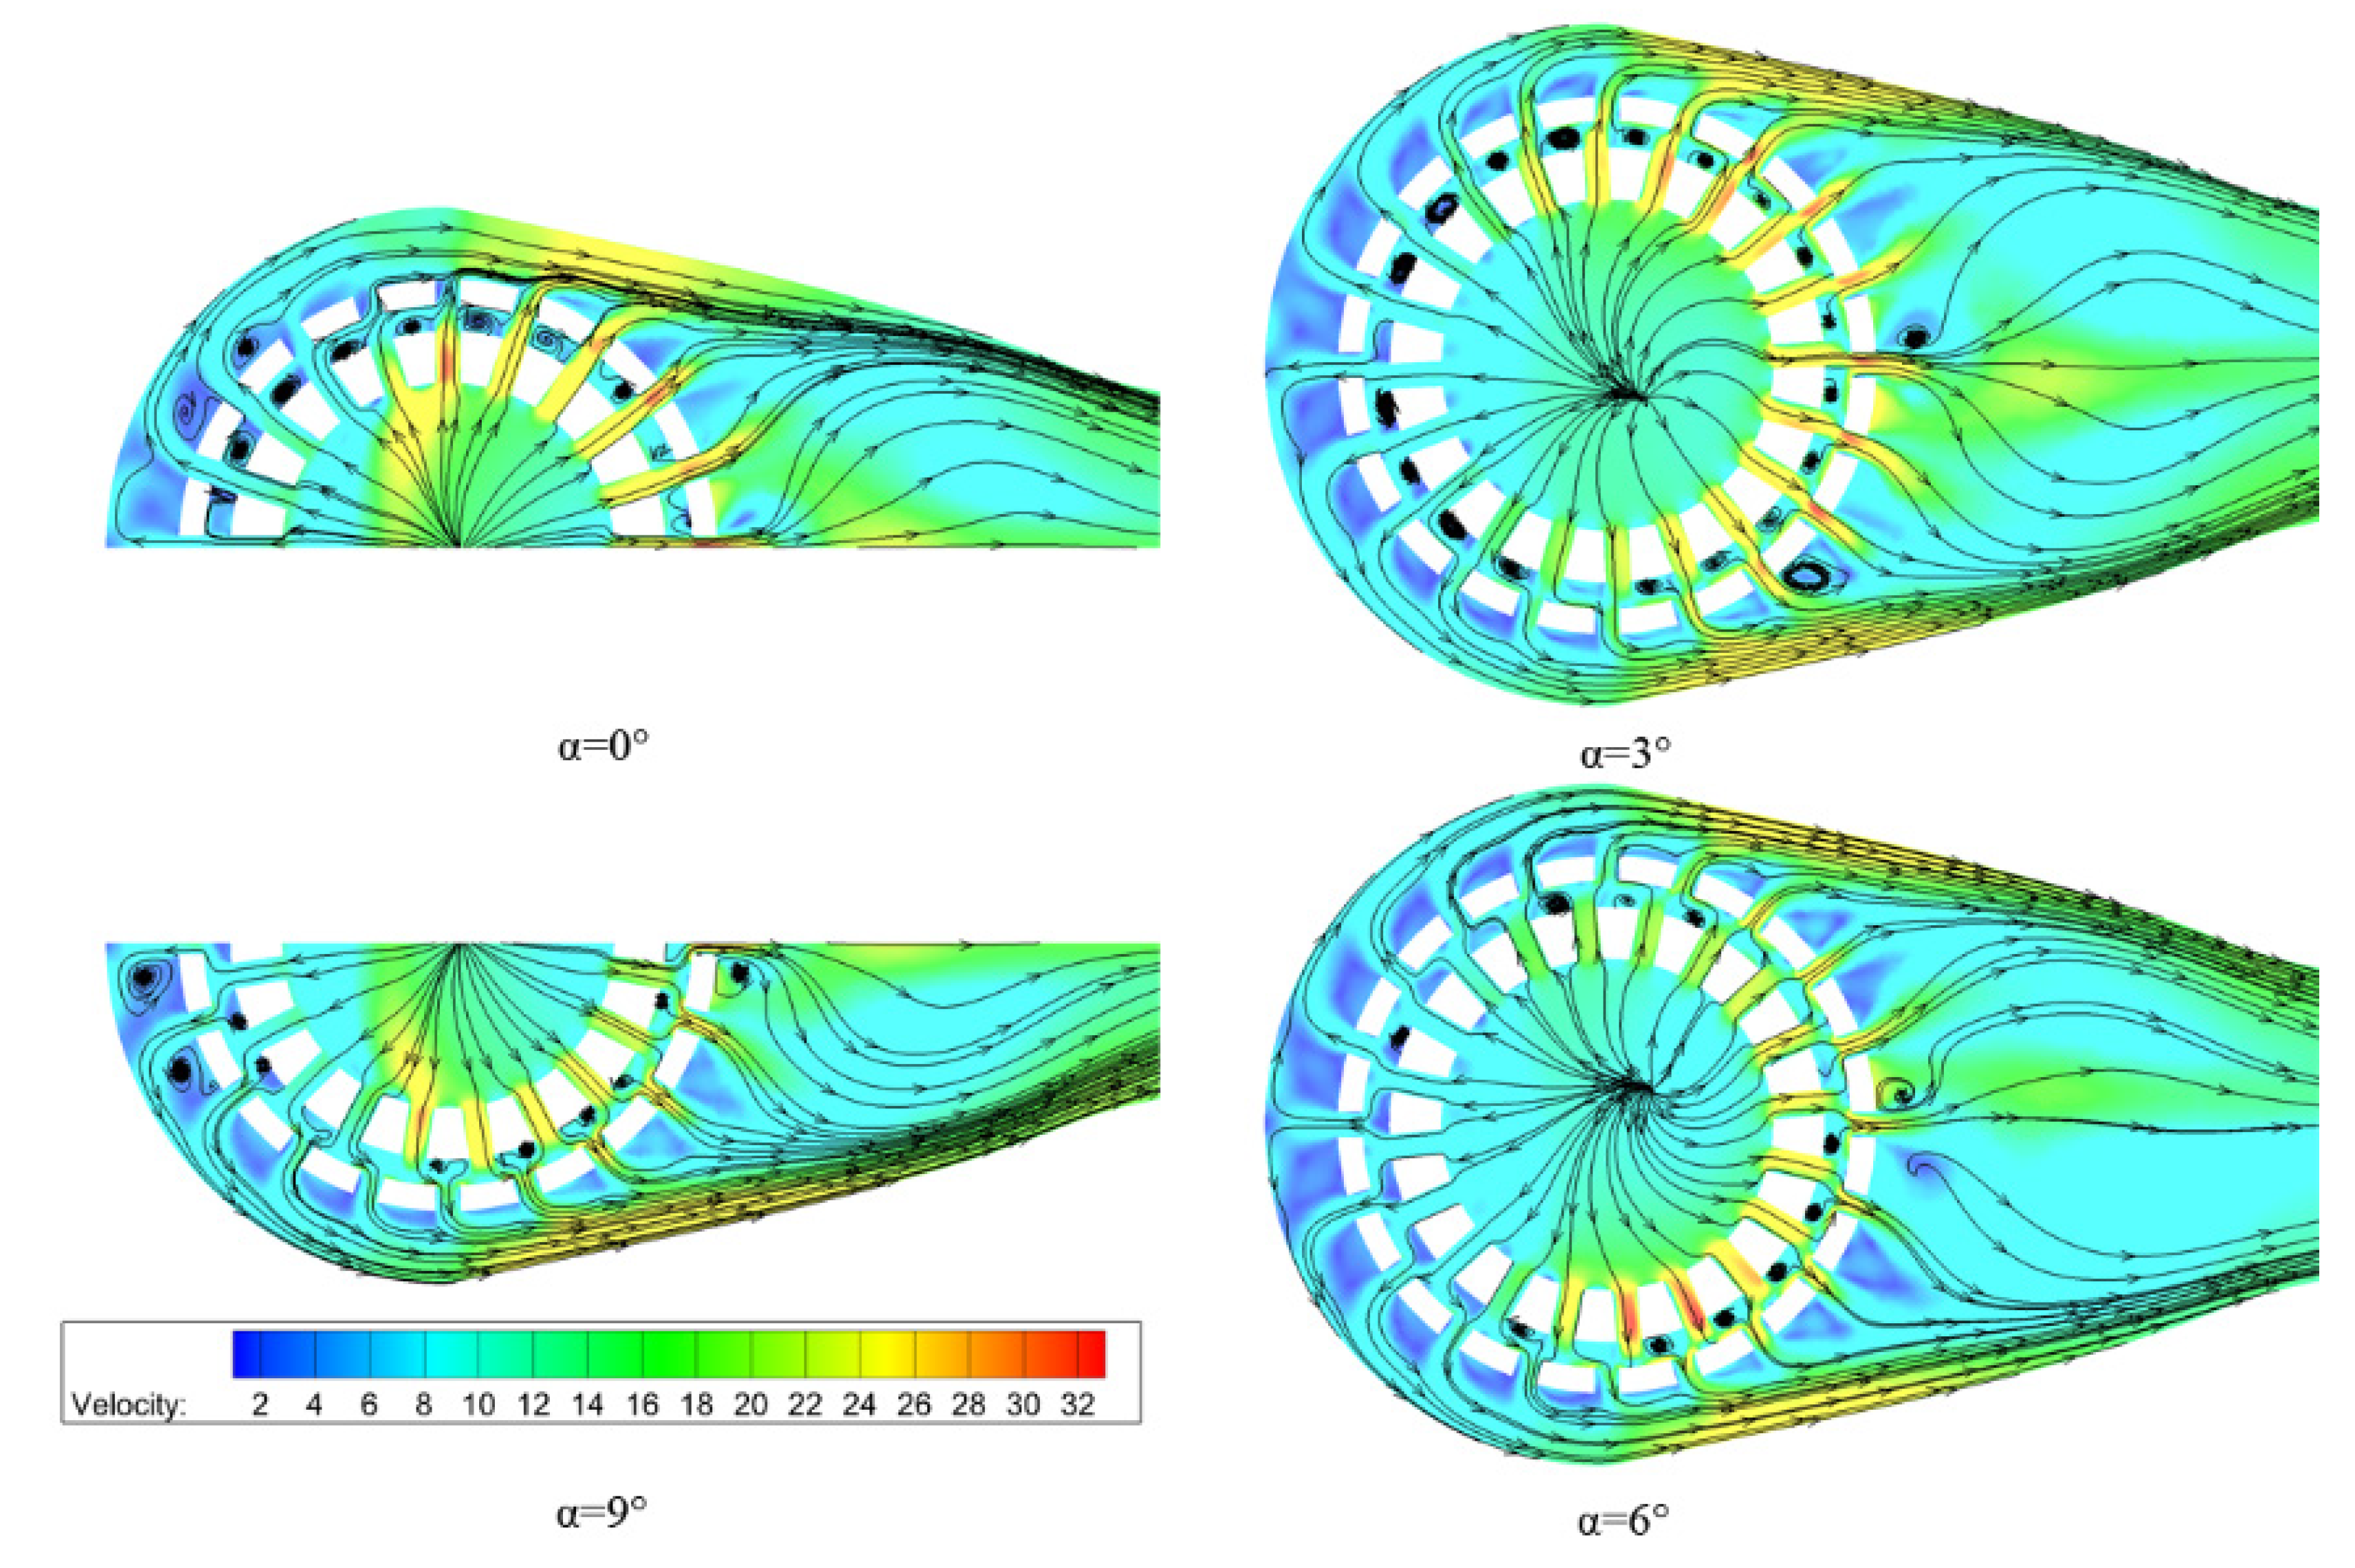
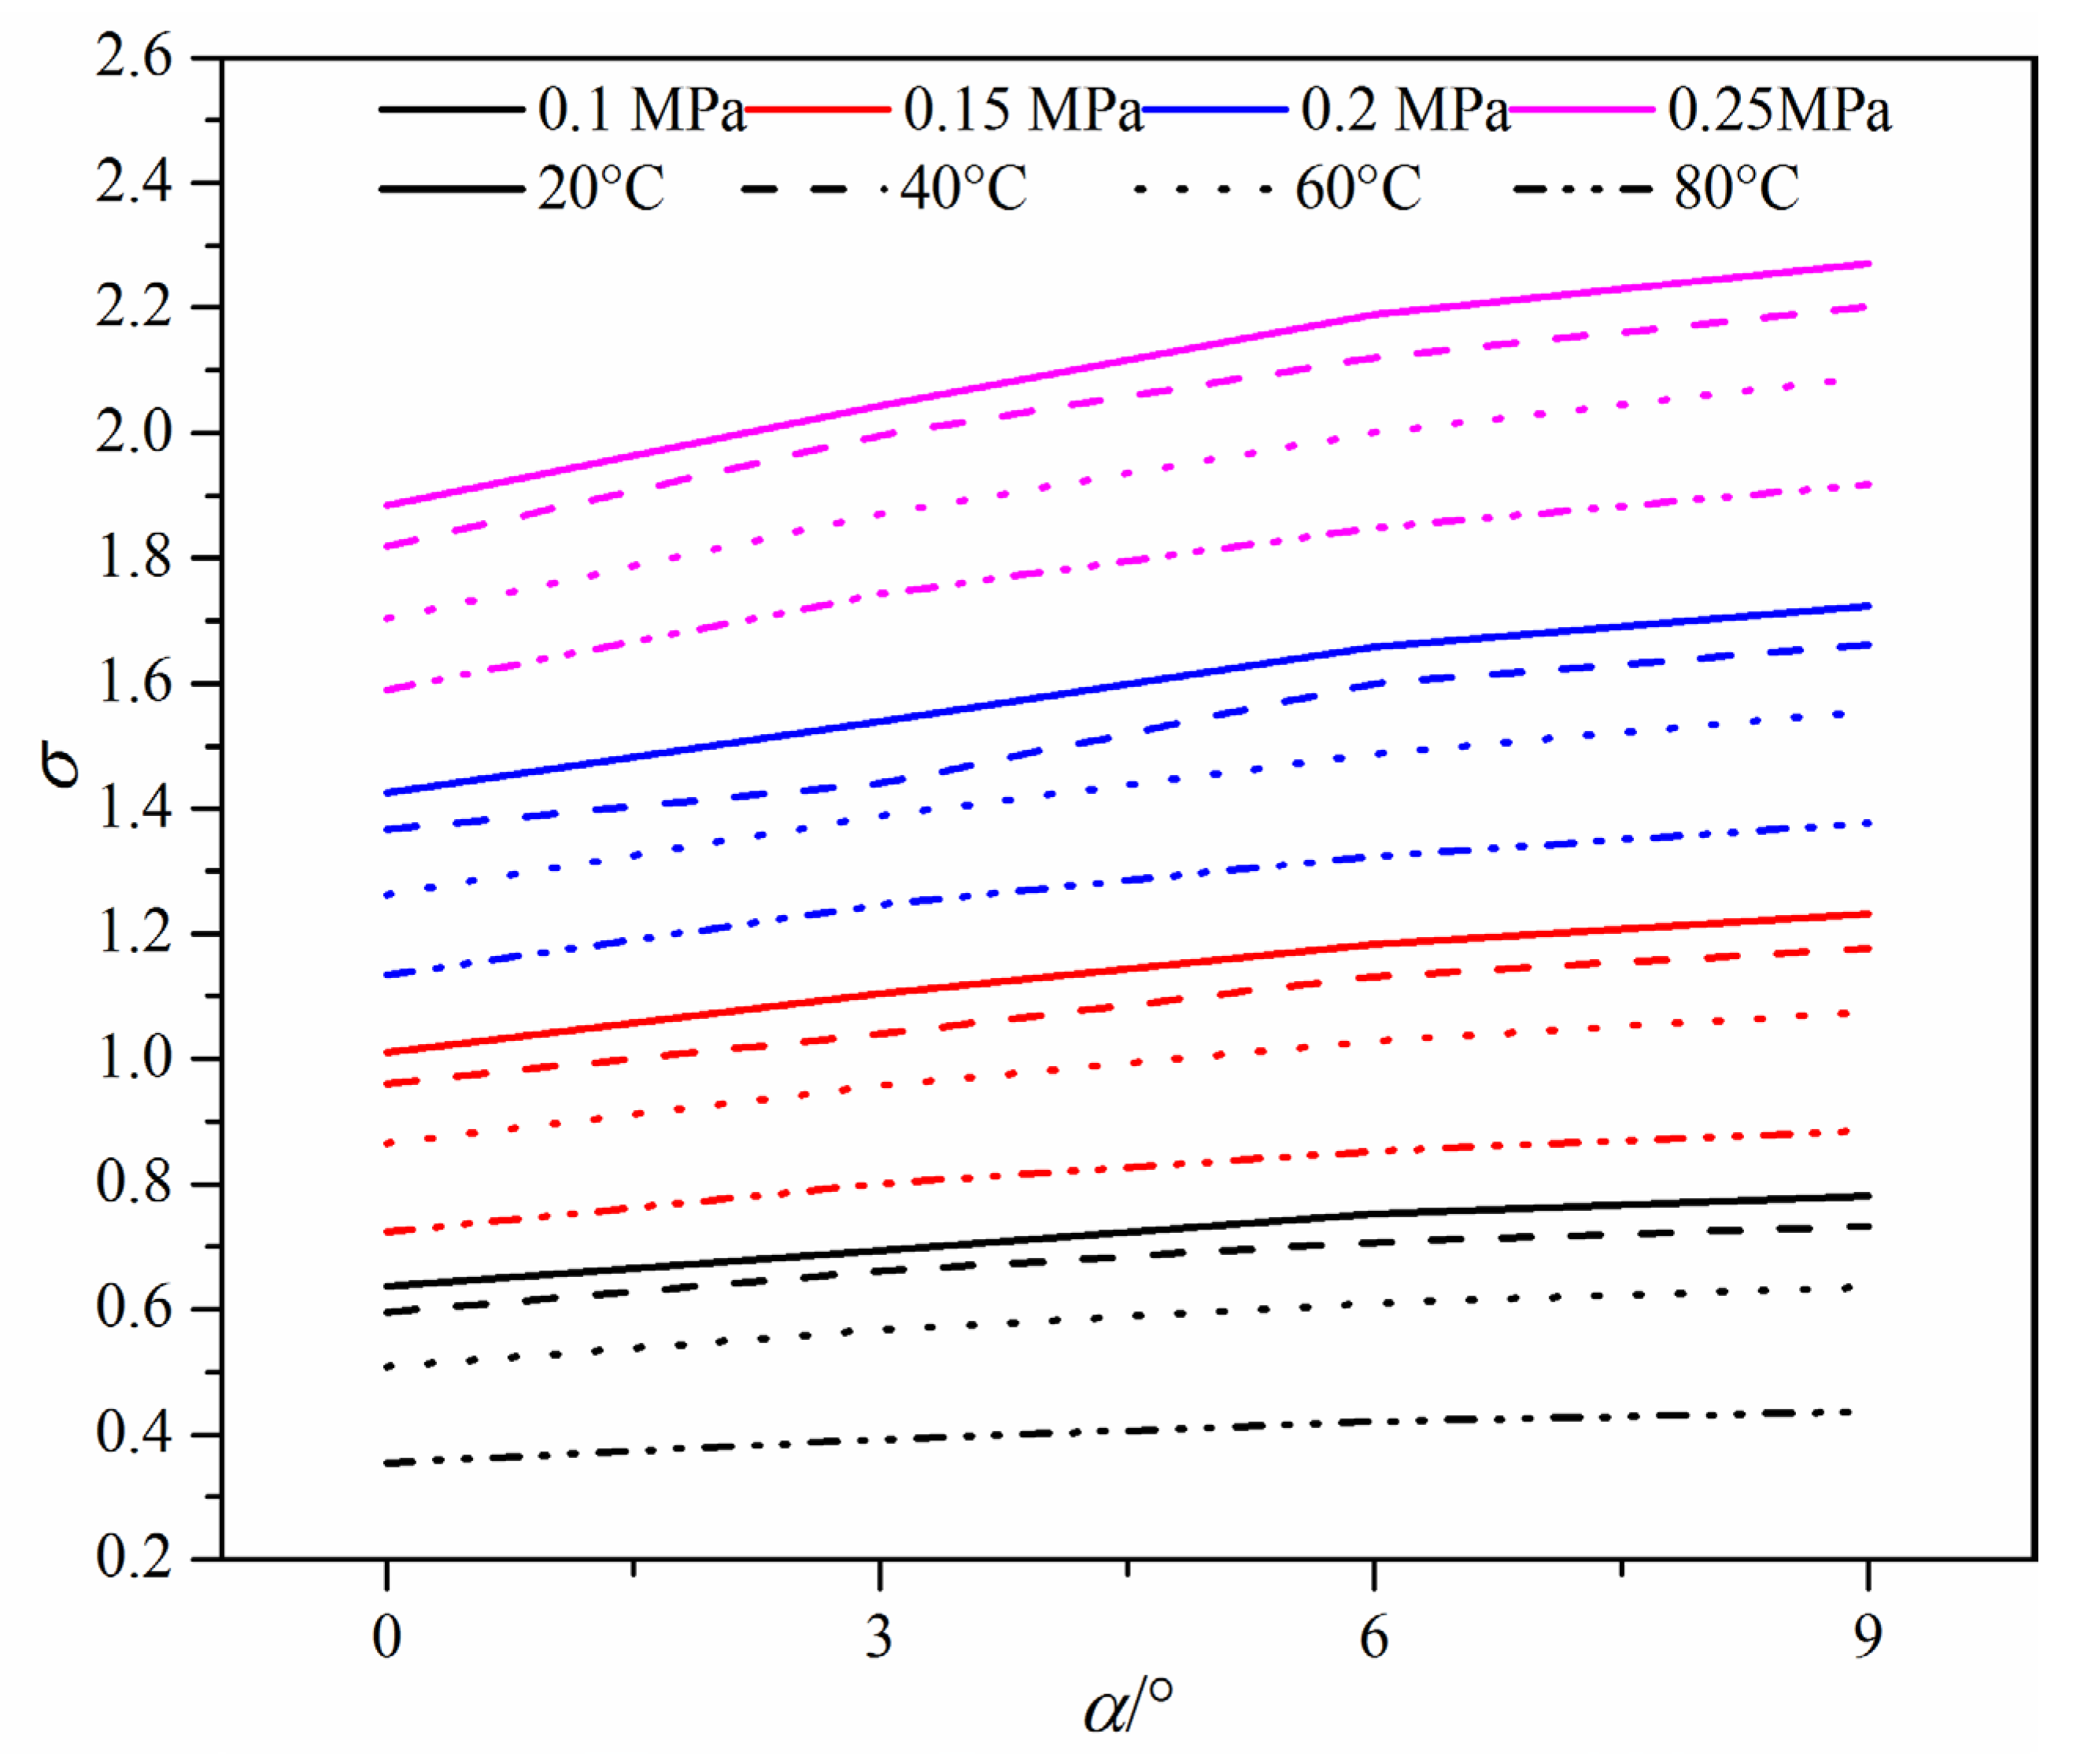
When there are two cages inside a globe valve, the installation angle between the two cages influences the flow resistance, thus affecting the cavitation intensity. For the investigated two-cage globe valve, the number of the throttling window on each cage is 20, thus the installation angle from 0° to 9° is investigated. Figure 11 shows the streamline on a cross-section in the two-cage globe valve under different installation angles. It can be seen that when the installation is 0°, most water flows directly from the inner cage to the outer cage, resulting in small flow resistance. With the increase in the installation angle, water comes from the inner cage and collides with the outer cage, and then changes flow direction two times before finally flowing to the valve downstream, resulting in larger flow resistance.
Figure 12 shows the loss coefficient in two-cage globe valves under different installation angles. It can be found that under different installation angles, the effects of the working temperature on the loss coefficient are the same with the above analysis, and the loss coefficient has the maximum value when the working temperature is 80 °C. Besides, with the increase in the installation angle, the loss coefficient becomes dependent on the outlet pressure even under the same working temperature, and the larger the outlet pressure, the smaller the loss coefficient. Together with Figure 11 and Figure 12, it can also be concluded that the larger the installation angle, the larger the flow resistance, which means the smaller the cavitation intensity.
Cavitation number in two-cage globe valves with different installation angles is shown in Figure 13, it can be found that with the increase in the outlet pressure and the decrease in the working temperature, cavitation number increases, which is consistent with the above results. With the increase in the installation angle, the cavitation number also increases, which means cavitation intensity in two-cage globe valves with a large installation angle is small. The increment of cavitation number decreases with the decrease in the outlet pressure but barely changes with the variation of the working temperature. When the outlet pressure is 0.25 MPa, the increment of cavitation number is about 0.39 (the installation angle varies from 0° to 9°), but the increment of cavitation number is only 0.144 when the outlet pressure is 0.1 MPa. Based on the results analyzed in Section 3.2, the most effective method to suppress cavitation intensity in the two-cage globe valve is by increasing the outlet pressure.
4. Conclusions
Cavitation phenomenon and cavitation intensity in a two-cage globe valve are investigated in this study using the computational fluid dynamics method. A comparison of the water vapor volume distribution caused by cavitation for a globe valve with a different number of cages is made, and cavitation can be restricted around the valve cage and the valve body damage can be suppressed by adding a cage in the valve body, and cavitation intensity decreases with the increase in valve cage number. The effects of the valve cage with 20 slender orifices, the outlet pressure, and the working temperature on cavitation intensity and loss coefficient inside the investigated two-cage globe valve are studied, and cavitation number and water vapor volume are chosen to stand for the cavitation intensity. With the increasing outlet pressure and the installation angle, or the decreasing working temperature, cavitation number increases which means cavitation intensity decreases. When cavitation occurs, the loss coefficient firstly decreases with the increase in the working temperature, and then rapidly increases, while the loss coefficient barely changes with varying outlet pressure but increases with the increasing installation angle. Besides, among three focused parameters, reducing the outlet pressure can remarkably decrease the cavitation intensity compared to the others and the working temperature has minimal effects on cavitation intensity.
Author Contributions
Conceptualization, J.-y.L. and Z.-x.G.; methodology, J.-y.L.; software, Z.-x.G.; validation, J.-y.L.; formal analysis, Z.-x.G.; resources, H.W. and Z.-j.J.; writing—original draft preparation, J.-y.L. and Z.-x.G.; writing—review and editing, Z.-x.G.; supervision, J.-y.L. All authors have read and agreed to the published version of the manuscript.
Funding
This research received no external funding.
Conflicts of Interest
The authors declare no conflict of interest. The funders had no role in the design of the study; in the collection, analyses, or interpretation of data; in the writing of the manuscript, or in the decision to publish the results.
References
- Qian, J.; Gao, Z.; Hou, C.; Jin, Z. A comprehensive review of cavitation in valves: Mechanical heart valves and control valves. Bio-Des. Manuf. 2019, 2, 119–136. [Google Scholar] [CrossRef]
- Cui, B.; Lin, Z.; Zhu, Z.; Wang, H.; Ma, G. Influence of opening and closing process of ball valve on external performance and internal flow characteristics. Exp. Therm. Fluid Sci. 2017, 80, 193–202. [Google Scholar] [CrossRef]
- Qian, J.; Wu, J.; Gao, Z.; Jin, Z. Effects of throttling window on flow rate through feed-water valves. ISA Trans. 2020. [Google Scholar] [CrossRef]
- Yaghoubi, H.; Madani, S.A.H.; Alizadeh, M. Numerical study on cavitation in a globe control valve with different numbers of anti-cavitation trims. J. Cent. South Univ. 2018, 25, 2677–2687. [Google Scholar] [CrossRef]
- Qian, J.; Chen, M.; Jin, Z.; Chen, L.; Sundén, B. A numerical study of heat transfer effects and aerodynamic noise reduction in superheated steam flow passing a temperature and pressure regulation valve. Numer. Heat Transf. Part A 2020, 77, 873–889. [Google Scholar] [CrossRef]
- Fratini, L.; Pasta, S. Residual stresses in friction stir welded parts of complex geometry. Int. J. Adv. Manuf. Technol. 2012, 59, 547–557. [Google Scholar] [CrossRef]
- Wang, X.; Li, W.; Li, C.; Peng, Y. Structure optimization and flow field simulation of plate type high speed on-off valve. J. Cent. South Univ. 2020, 27, 1557–1571. [Google Scholar] [CrossRef]
- Lin, Z.; Sun, X.; Yu, T.; Zhang, Y.; Li, Y.; Zhu, Z. Gas–solid two-phase flow and erosion calculation of gate valve based on the CFD-DEM model. Powder Technol. 2020, 366, 395–407. [Google Scholar] [CrossRef]
- Jin, Z.; Gao, Z.; Chen, M.; Qian, J. Parametric study on Tesla valve with reverse flow for hydrogen decompression. Int. J. Hydrog. Energy 2018, 43, 8888–8896. [Google Scholar] [CrossRef]
- Qian, J.; Chen, M.; Liu, X.; Jin, Z. A numerical investigation of the flow of nanofluids through a micro Tesla valve. J. Zhejiang Univ. Sci. A 2019, 20, 50–60. [Google Scholar] [CrossRef]
- Qian, J.; Wu, J.; Gao, Z.; Wu, A.; Jin, Z. Hydrogen decompression analysis by multi-stage Tesla valves for hydrogen fuel cell. Int. J. Hydrog. Energy 2019, 44, 13666–13674. [Google Scholar] [CrossRef]
- Qian, J.; Chen, M.; Gao, Z.; Jin, Z. Mach number and energy loss analysis inside multi-stage Tesla valves for hydrogen decompression. Energy 2019, 179, 647–654. [Google Scholar] [CrossRef]
- Fan, S.; Xu, R.; Ji, H.; Yang, S.; Yuan, Q. Experimental Investigation on Contaminated Friction of Hydraulic Spool Valve. Appl. Sci. 2019, 9, 5230. [Google Scholar] [CrossRef] [Green Version]
- Yan, H.; Li, J.; Cai, C.; Ren, Y. Numerical Investigation of Erosion Wear in the Hydraulic Amplifier of the Deflector Jet Servo Valve. Appl. Sci. 2020, 10, 1299. [Google Scholar] [CrossRef] [Green Version]
- Pasta, S.; Gentile, G.; Raffa, G.M.; Bellavia, D.; Chiarello, G.; Liotta, R.; Luca, A.; Scardulla, C.; Pilato, M. In silico shear and intramural stresses are linked to aortic valve morphology in dilated ascending aorta. Eur. J. Vasc. Endovasc. Surg. 2017, 54, 254–263. [Google Scholar] [CrossRef]
- Rinaudo, A.; D’Ancona, G.; Lee, J.J.; Pilato, G.; Amaducci, A.; Baglini, R.; Follis, F.; Pilato, M.; Pasta, S. Predicting outcome of aortic dissection with patent false lumen by computational flow analysis. Cardiovasc. Eng. Technol. 2014, 5, 176–188. [Google Scholar] [CrossRef]
- Zhang, J.; Wang, D.; Xu, B.; Gan, M.; Pan, M.; Yang, H. Experimental and numerical investigation of flow forces in a seat valve using a damping sleeve with orifices. J. Zhejiang Univ. Sci. A 2018, 19, 417–430. [Google Scholar] [CrossRef]
- Zhong, Q.; Zhang, B.; Bao, H.; Hong, H.; Ma, J.; Ren, Y.; Yang, H.; Fung, R. Analysis of pressure and flow compound control characteristics of an independent metering hydraulic system based on a two-level fuzzy controller. J. Zhejiang Univ. Sci. A 2019, 20, 184–200. [Google Scholar] [CrossRef]
- Saha, B.K.; Peng, J.; Li, S. Numerical and experimental investigations of cavitation phenomena inside the pilot stage of the deflector jet servo-valve. IEEE Access 2020, 8, 64238–64249. [Google Scholar] [CrossRef]
- Kim, H.; Kim, S. Optimization of pressure relief valve for pipeline system under transient induced cavitation condition. Urban Water J. 2019, 16, 718–726. [Google Scholar] [CrossRef]
- Yi, J.; Hu, H.; Zheng, Y.; Zhang, Y. Experimental and computational failure analysis of a high pressure regulating valve in a chemical plant. Eng. Fail. Anal. 2016, 70, 188–199. [Google Scholar] [CrossRef]
- Zhang, X.; Zhang, T.; Hou, Y.; Zhu, K.; Huang, Z.; Wu, K. Local loss model of dividing flow in a bifurcate tunnel with a small angle. J. Zhejiang Univ. Sci. A 2019, 20, 21–35. [Google Scholar] [CrossRef]
- Liu, G.; Lin, Y.; Guan, G.; Yu, Y. Numerical research on the anti-sloshing effect of a ring baffle in an independent type C LNG tank. J. Zhejiang Univ. Sci. 2018, 19, 758–773. [Google Scholar] [CrossRef]
- Wen, H.; Ma, J.; Jiang, G.; Lee, Y. Effect of needle valve motion on cavitation and gas ingestion at end of injection. Combust. Sci. Technol. 2020. [Google Scholar] [CrossRef]
- Li, W.; Gao, Z.; Jin, Z.; Qian, J. Transient study of flow and cavitation inside a bileaflet mechanical heart valve. Appl. Sci. 2020, 10, 2548. [Google Scholar] [CrossRef] [Green Version]
- Jin, Z.; Gao, Z.; Qian, J.; Wu, Z.; Sunden, B. A parametric study of hydrodynamic cavitation inside globe valves. ASME J. Fluids Eng. 2018, 140, 031208. [Google Scholar] [CrossRef]
- Jin, Z.; Qiu, C.; Jiang, C.; Wu, J.; Qian, J. Effect of valve core shapes on cavitation flow through a sleeve regulating valve. J. Zhejiang Univ. Sci. A 2020, 21, 1–14. [Google Scholar] [CrossRef]
- Liu, X.; Wu, Z.; Li, B.; Zhao, J.; He, J.; Li, W.; Zhang, C.; Xie, F. Influence of inlet pressure on cavitation characteristics in regulating valve. Eng. Appl. Comput. Fluid Mech. 2020, 14, 299–310. [Google Scholar] [CrossRef]
- Qiu, C.; Jiang, C.; Zhang, H.; Wu, J.; Jin, Z. Pressure drop and cavitation analysis on sleeve regulating valve. Processes 2019, 7, 829. [Google Scholar] [CrossRef] [Green Version]
- Liu, B.; Zhao, J.; Qian, J. Numerical analysis of cavitation erosion and particle erosion in butterfly valve. Eng. Fail. Anal. 2017, 80, 312–324. [Google Scholar] [CrossRef]
- Jin, Z.; Gao, Z.; Li, X.; Qian, J. Cavitating Flow through a Micro-Orifice. Micromachines 2019, 10, 191. [Google Scholar] [CrossRef] [PubMed] [Green Version]
- Zhang, J. Flow characteristics of a hydraulic cone-throttle valve during cavitation. Ind. Lubr. Tribol. 2019, 71, 1186–1193. [Google Scholar] [CrossRef]
- Yuan, C.; Song, J.; Liu, M. Comparison of compressible and incompressible numerical methods in simulation of a cavitating jet through a poppet valve. Eng. Appl. Comput. Fluid Mech. 2019, 13, 67–90. [Google Scholar] [CrossRef]
- Xu, H.; Wang, H.; Hu, M.; Jiao, L.; Li, C. Optimal design and experimental research of the anti-cavitation structure in the water hydraulic relief valve. J. Pressure Vessel Technol. 2018, 140, 051601. [Google Scholar] [CrossRef]
- Weijie, S.; Shuping, C.; Xiaohui, L.; Zuti, Z.; Yuquan, Z. Experimental research on the cavitation suppression in the water hydraulic throttle valve. J. Pressure Vessel Technol. 2017, 139, 051302. [Google Scholar] [CrossRef]
- Lee, M.G.; Lim, C.S.; Han, S.H. Shape design of the bottom plug used in a 3-way reversing valve to minimize the cavitation effect. Int. J. Precis. Eng. Manuf. 2016, 17, 401–406. [Google Scholar] [CrossRef]
- Chern, M.; Hsu, P.; Cheng, Y.; Tseng, P.; Hu, C. Numerical Study on Cavitation Occurrence in Globe Valve. J. Energy Eng. 2013, 139, 25–34. [Google Scholar] [CrossRef]
- Zwart, P.J.; Gerber, A.G.; Belamri, T. A Two-Phase Flow Model for Predicting Cavitation Dynamics. In Proceedings of the ICMF International Conference on Multiphase Flow, Firenze, Italy, 22–27 May 2004; p. 152. [Google Scholar]
Figure 1.
Damage of the valve plug results from cavitation erosion [21]-Copyright 2016, Elsevier.
Figure 1.
Damage of the valve plug results from cavitation erosion [21]-Copyright 2016, Elsevier.

Figure 2.
Structure of the investigated globe valve.

Figure 3.
Mesh of the two-cage globe valve.

Figure 4.
Velocity and pressure distributions for the globe valve with a different number of cages.

Figure 5.
Water vapor volume distribution for globe valve with a different number of cages: (a) no cage; (b) 1 cage; (c) 2 cages.
Figure 5.
Water vapor volume distribution for globe valve with a different number of cages: (a) no cage; (b) 1 cage; (c) 2 cages.

Figure 6.
Comparison of cavitation number and loss coefficient for the globe valve with a different number of cages.
Figure 6.
Comparison of cavitation number and loss coefficient for the globe valve with a different number of cages.

Figure 7.
Water vapor distribution in two-cage globe valve with different outlet pressure: (a) 0.15 MPa; (b) 0.20 MPa; (c) 0.25 MPa.
Figure 7.
Water vapor distribution in two-cage globe valve with different outlet pressure: (a) 0.15 MPa; (b) 0.20 MPa; (c) 0.25 MPa.

Figure 8.
Water vapor volume distribution in two-cage globe valve with different working temperature: (a) 20 °C; (b) 40 °C; (c) 60 °C.
Figure 8.
Water vapor volume distribution in two-cage globe valve with different working temperature: (a) 20 °C; (b) 40 °C; (c) 60 °C.

Figure 9.
Cavitation number and loss coefficient of two-cage globe valve with different outlet pressure and working temperature.
Figure 9.
Cavitation number and loss coefficient of two-cage globe valve with different outlet pressure and working temperature.

Figure 10.
Water vapor volume in the two-cage globe valve with different outlet pressure and working temperature.
Figure 10.
Water vapor volume in the two-cage globe valve with different outlet pressure and working temperature.

Figure 11.
Streamline on a cross-section for the two-cage globe valve with different installation angles.
Figure 11.
Streamline on a cross-section for the two-cage globe valve with different installation angles.

Figure 12.
Loss coefficient in the two-cage globe valve with different installation angles.

Figure 13.
Cavitation number in the two-cage globe valve with different installation angles.


Table 1.
Common valves applied in different industries.
| Valve Type | Ball Valve [2] 1 | Control Valve | Globe Valve |
|---|---|---|---|
| Structure |  |  |  |
1 Reproduced from reference [2]. Copyright 2017, Elsevier.
Table 2.
Properties of water and water vapor.
| 20 °C | 40 °C | 60 °C | 80 °C | ||
|---|---|---|---|---|---|
| Water | Density/kg·m−3 | 998.16 | 992.18 | 983.17 | 971.78 |
| Viscosity/pa·s | 0.0010016 | 0.0006529 | 0.000466 | 0.000354 | |
| Water vapor | Density/kg·m−3 | 0.0173 | 0.05124 | 0.1304 | 0.294 |
| Viscosity/pa·s | 9.78 × 10⁻⁶ | 1.03 × 10⁻⁵ | 1.09 × 10⁻⁵ | 1.16 × 10⁻⁵ | |
| Saturated pressure/Pa | 2339 | 7384 | 19945.8 | 47414.7 | |
Table 3.
Grid independence check.
| Cells Number | Pressure Drop/Pa | Error/% | Velocity/m·s−1 | Error/% |
|---|---|---|---|---|
| 453,437 | 884,382.9 | 1.15% | 16.48 | −3.5% |
| 824,206 | 874,309.2 | - | 17.08 | - |
| 1,550,930 | 868,852.6 | −0.62% | 17.39 | 1.8% |
© 2020 by the authors. Licensee MDPI, Basel, Switzerland. This article is an open access article distributed under the terms and conditions of the Creative Commons Attribution (CC BY) license (http://creativecommons.org/licenses/by/4.0/).
Share and Cite
MDPI and ACS Style
Li, J.-y.; Gao, Z.-x.; Wu, H.; Jin, Z.-j. Numerical Investigation of Methodologies for Cavitation Suppression Inside Globe Valves. Appl. Sci. 2020, 10, 5541. https://doi.org/10.3390/app10165541
AMA Style
Li J-y, Gao Z-x, Wu H, Jin Z-j. Numerical Investigation of Methodologies for Cavitation Suppression Inside Globe Valves. Applied Sciences. 2020; 10(16):5541. https://doi.org/10.3390/app10165541
Chicago/Turabian StyleLi, Jun-ye, Zhi-xin Gao, Hui Wu, and Zhi-jiang Jin. 2020. "Numerical Investigation of Methodologies for Cavitation Suppression Inside Globe Valves" Applied Sciences 10, no. 16: 5541. https://doi.org/10.3390/app10165541
Note that from the first issue of 2016, this journal uses article numbers instead of page numbers. See further details here.