Fatigue Testing of Shear Reinforcement in Prestressed Concrete T-Beams of Bridges

Institute of Structural Concrete, RWTH Aachen University, 52074 Aachen, Germany
*
Author to whom correspondence should be addressed.
Appl. Sci. 2020, 10(16), 5560; https://doi.org/10.3390/app10165560
Submission received: 1 July 2020
/
Revised: 2 August 2020
/
Accepted: 4 August 2020
/
Published: 11 August 2020
(This article belongs to the Special Issue Recent Advances in Testing and Modelling Reinforced Concrete Structures)
Abstract
:In the recent years, bridges, as an important part of the national and international infrastructure, had to comply with stricter requirements due to increased heavy load traffic. Many of these bridge structures built in the 1960s and 1970s often contain less web reinforcement than the modern required minimum web reinforcement. In this context, the shear resistance under cyclic loading is of special interest. For this reason, experimental tests were conducted on prestressed concrete beams with and without shear reinforcement at the Institute of Structural Concrete of RWTH Aachen University to investigate the shear fatigue strength. This paper describes the recent tests on ten T-shaped prestressed beams with web reinforcement. The specimens were able to resist more load cycles than predicted by the approaches implemented in the Eurocodes for bridges. Based on the test results, design models for shear under cyclic loading should be reviewed and improved, especially regarding the assessment of existing structures.
1. Introduction
Bridges are an important part of the national and international infrastructure. Due to higher traffic volume, especially concerning heavy load traffic, the requirements on bridge structures have increased significantly in recent years [1,2,3,4]. While prestressed bridges were designed based on approaches using principle stresses as design criterion in the past, verifications based on truss models have been common practice since the 1980s. Numerous German bridges were designed and built in the 1960s and 1970s for lower load classes [5]. Therefore, many existing bridges exhibit a deficit in shear strength, applying the current standards (e.g., Eurocode 2 [6,7,8,9]) because of the lower required shear reinforcement of previous design rules [10,11]. The verification of shear resistance under cyclic loading has been required for concrete bridges in Germany since 2003 by introducing the DIN Fachbericht 102 [12], which is based on Eurocode 2 [13]. Hence, a guideline to assess the load bearing capacity of existing bridges [14,15] was introduced and has been continuously refined—e.g., in [16,17,18,19,20,21,22]. The second amendment is already in progress [23]. The key element of this assessment guideline is a stepwise verification procedure, which is similar to the level-of-approximation approach of fib Model Code 2010 [24]. This procedure accounts for the characteristics of older bridges and enables a more refined determination of the structural capacity. Independent of this German guideline and its refinement, research is currently being conducted all over the world on the load-bearing capacity of concrete bridges and individual structural parts, especially under fatigue loading [25,26,27,28,29,30,31,32,33,34,35].
However, in numerous cases, the resistance under shear and torsion, as well as fatigue loads, cannot be verified [36,37,38], although the webs of these prestressed bridges do not reveal any shear cracks. A further refinement of the shear assessment under static and fatigue loading can reduce the need for strengthening measures or restrictions of usage significantly and will extend the service life of existing bridge structures.
To investigate the cyclic shear capacity of prestressed concrete beams with and without shear reinforcement, experimental tests on 43 beams have been carried out until now [39,40,41,42,43] at the Institute of Structural Concrete of RWTH Aachen University. The main parameters of the investigation were shear reinforcement ratio, degree of prestressing and the cyclic part of the shear force. Beside the number of cycles until failure, the redistribution of shear stresses and forces in the shear reinforcement was the most important aspect of the investigations. The definition of cross-section geometry, shear reinforcement ratio, degree of prestressing and the load levels for the test specimen was based on an evaluation of typical existing federal highway bridges in Germany built between 1960 and 1970.
The previous tests on prestressed I-beams without shear reinforcement have indicated that an abrupt shear failure occurs without announcement due to the development of an inclined crack. In contrast, fatigue failure on prestressed T-beams without shear reinforcement is announced by the slow development of flexural shear cracks. Due to the missing shear reinforcement, however, the failure is still abrupt [39,41]. In the tests on prestressed I-beams with shear reinforcement, it was observed that the fatigue failure occurred progressively. Due to the successive failure of individual stirrups and the redistribution to adjacent stirrups, as well as the gradual increase in crack width and deflection, the shear failure was well announced [40,41,42,43]. All beams, both with and without shear reinforcement, had in common that the resistible number of load cycles until the failure of each beam was clearly underestimated by Eurocode 2 [6,7,8,9]. These results have already been included in the guideline to assess the load bearing capacity of existing bridges [14,15].
This paper presents fatigue tests on 10 T-shaped single span beams with shear reinforcement to complement the previous findings on I-beams with shear reinforcement to another cross-section. The experimental load cycles are compared to the current German approach for cyclic shear loads, which is based on Eurocode 2 (compression strut inclination θ accounting for a concrete contribution by aggregate interlock, bilinear S–N curve according to [7]). The purpose of all investigations was to describe the load-bearing behavior of profiled prestressed concrete beams during fatigue failure of the shear reinforcement under cyclic loading. Beside the determination of the number of load cycles to shear failure, the announcement behavior prior to failure was a significant aspect. The results of the research project can be used for both the assessment of existing bridges and for the design of new prestressed concrete structures.
2. Experimental Investigations
2.1. Test Specimens
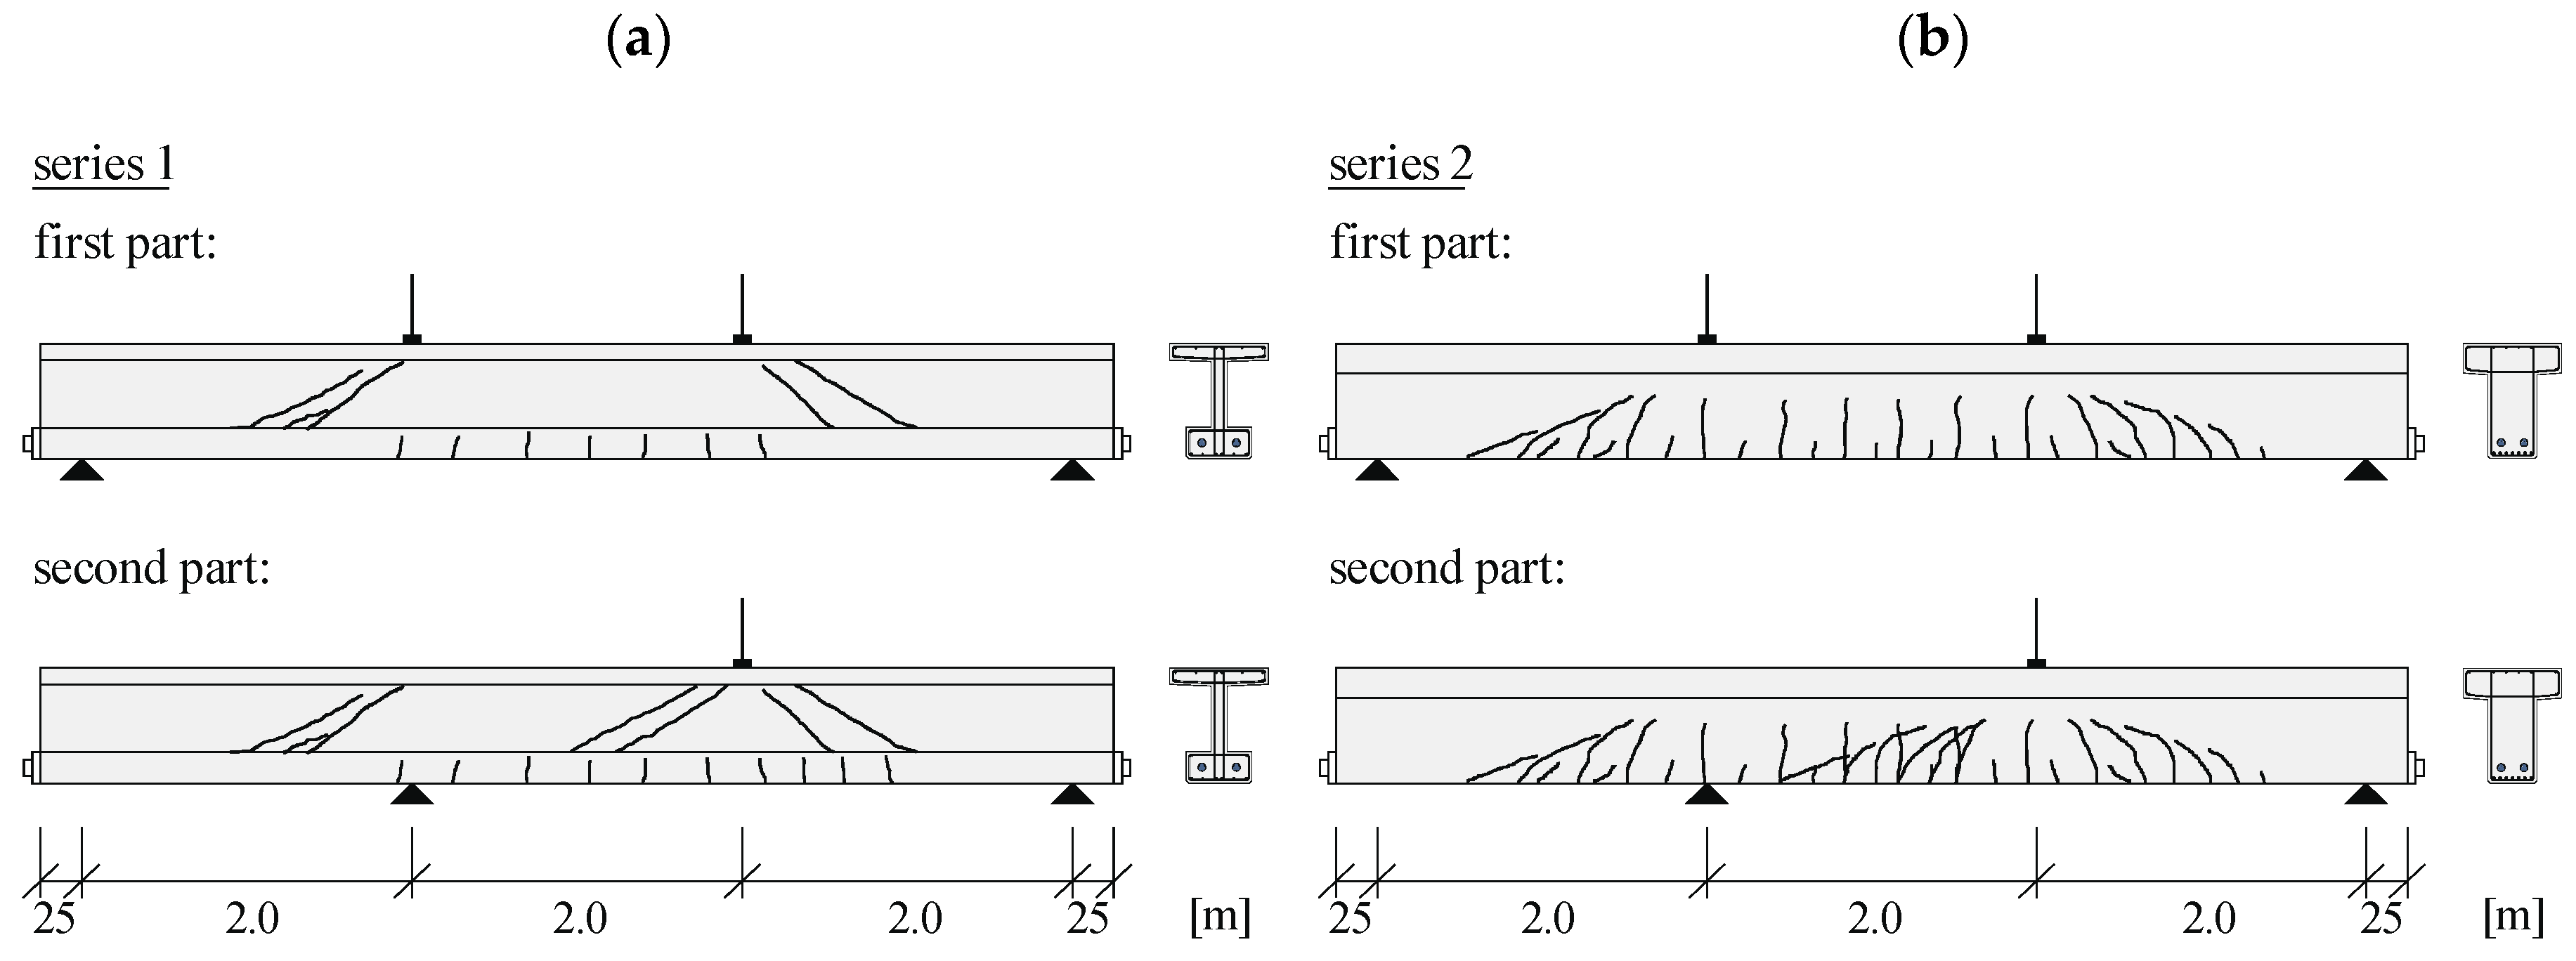
Considering the cross-section geometry, the experimental investigations of prestressed concrete beams with shear reinforcement can be divided into two test series (Figure 1). The first series with I-shaped beams (I-beams) was designed to exhibit shear failure with diagonal cracking in the web independent of flexural cracks. The results are presented in [40,42,43]. In order to take into account the influence of flexural cracking on the shear capacity, a further series of T-shaped cross-sections (T-beams) was investigated. With these beams, the shear cracks arise from flexural cracks on the lower surface of the cross-section in the shear-loaded area.
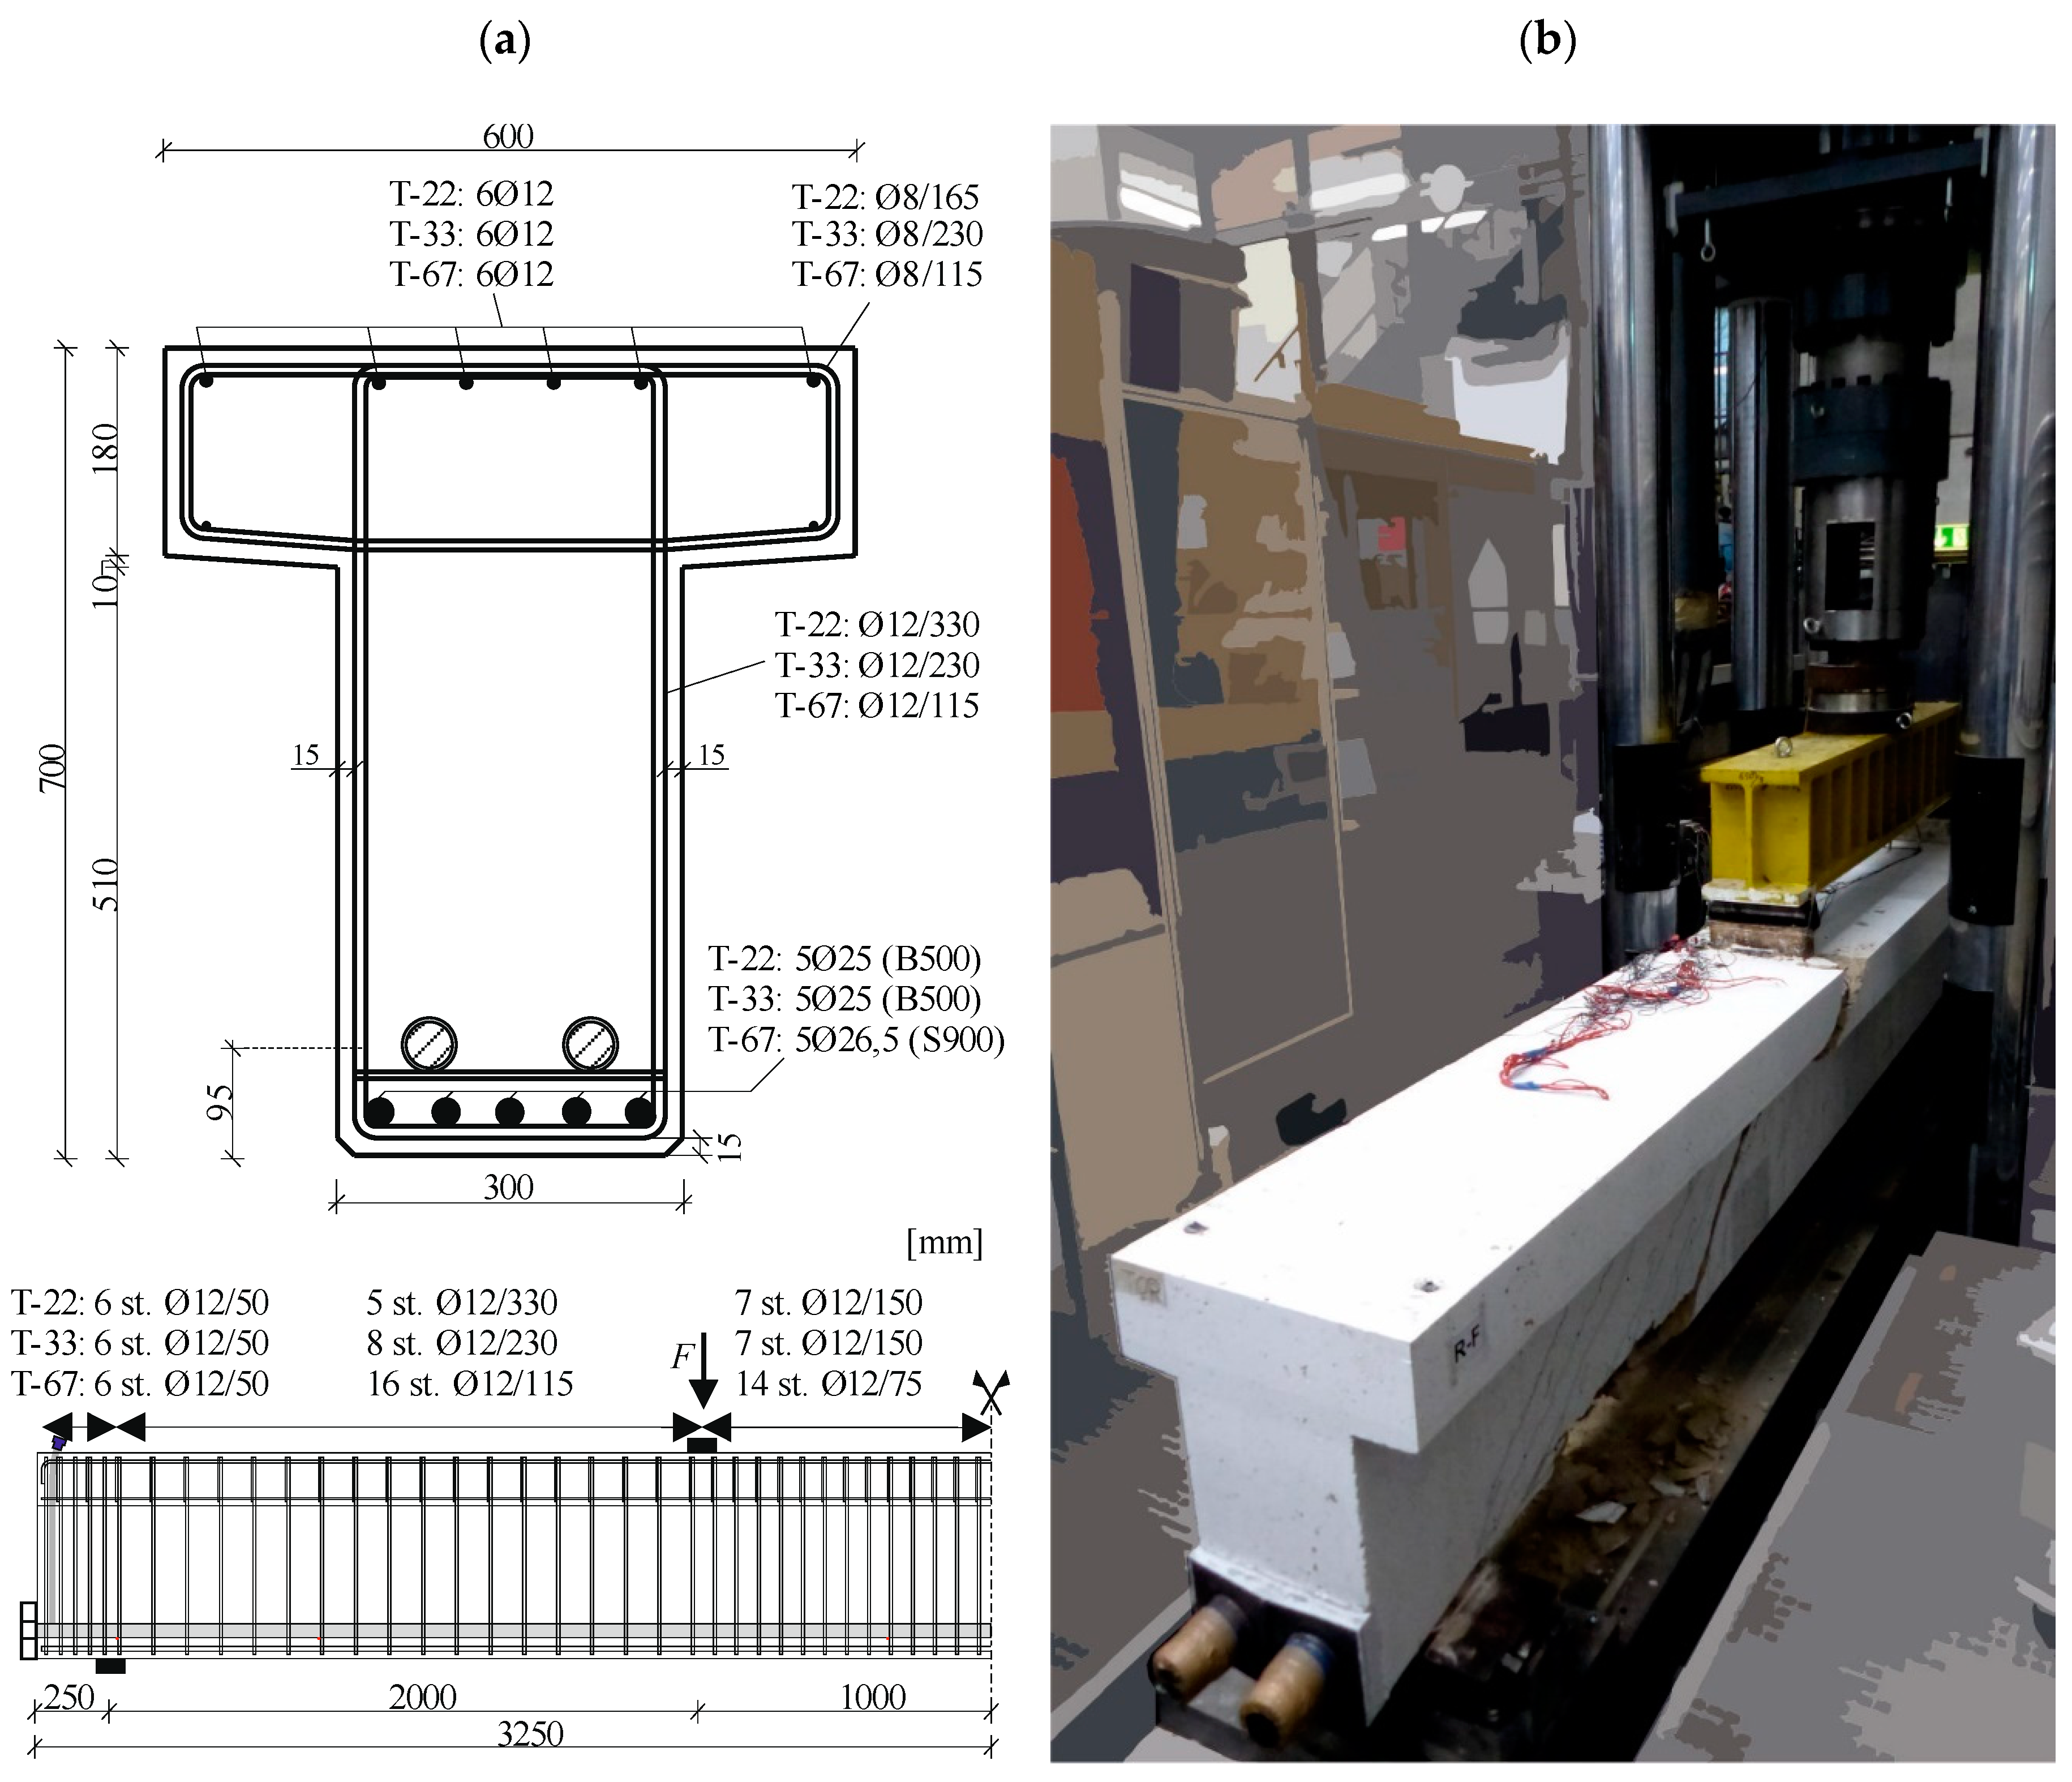
The T-beams with a web width of bw = 0.3 m had a height of 0.7 m and a length of 6.5 m (Figure 2). The shear reinforcement ratios (ρw = asw/bw with asw as the area of shear reinforcement within one meter (cm2/m)) in the web of the shear span varied between ρw = 0.22% and ρw = 0.67% using closed stirrups Ø12 with a steel grade B500. Within one beam, both shear spans featured the same shear reinforcement ratio. The steel properties, determined by axial tension tests on single bars taken from the same batch, are shown in Table 1. In the middle part of the beam and at the support, the distance between the stirrups was reduced to avoid a premature failure in these areas. The flexural reinforcement consisted of 5Ø25 (B500) or 5Ø26.5 (high strength steel S900/1100 [44]).
With an axial distance of 9.5 cm from the bottom side of the beam, two straight tendons (each 3Ø0.6” (1.4 cm2)) were arranged for post-tensioning (St 1570/1770, fp0.1k = 1500 N/mm2). After the subtraction of all losses, the prestressing force for the beams varied between 330 kN and 500 kN (Table 1). The mean strengths of the ready mixed concrete during the test period were in a range of 32 and 48 N/mm2 over all tests with a small variation over the test period of each beam (Table 2).
2.2. Test Setup and Test Procedure
At the beginning of each test, the beams with a span of 6.5 m were loaded statically in a four-point bending test (Figure 1) until a flexural crack developed to a first initial shear crack on both sides in the shear span. This allowed for the investigation of the shear fatigue resistance of the truss model consisting of stirrups and concrete struts. Afterwards, the planned cyclic loading with upper shear force Vmax and lower shear force Vmin (Table 2) was applied until a cyclic shear failure in one shear span occurred or the cyclic loading was stopped after a large number of cycles. Depending on the load amplitude (Vmax-Vmin) and the deformation caused by crack growth and thereof induced reduction in stiffness, the beams were tested at a frequency between 0.5 Hz and 3.0 Hz. All tests were performed force controlled. This guaranteed that the planned cyclic loads, according to Table 2 were applied, even if the stiffness of the beam decreased. The first part of cyclic testing was four-point bending, which is indicated by “a” in the beam numbering (Table 2). For the second part, the test setup was altered into a three-point loading (Figure 1) with a reduced span in order to continue the test to generate a second shear failure in the less deteriorated shear span with an unchanged shear slenderness. The second part of cyclic test is indicated by “b” in the beam numbering. Basically, the range of upper and lower shear force was kept constant throughout the test, except in test T-33-1, where upper and lower shear force had to be increased in order to create a fatigue failure. As test T-22-1 did not fail after nearly 7.4 million load cycles, the test was stopped, and the residual static shear capacity was determined. The cyclic load combinations were defined based on EC 2 [8,9]. The test loads and the resisted cycles are summarized in Table 2. Vmax and Vmin indicate the upper and lower applied shear force, respectively. Only after the fatigue failure of several stirrups in the shear span did the shear cracks propagate into the upper flange near the loading point, leading to the final failure of the compression zone (Figure 3).
3. Test Results
Prior to the cyclic loading, an initial static load was applied to create a shear crack pattern, which could occur at the serviceability limit state. The cyclic loading led to an elongation and widening of the initial cracks as well as the development of further shear cracks. Consequently, the stirrups in the web were activated to carry shear forces, causing a gradual fatigue damage of the reinforcement. After the failure of each stirrup the shear forces were redistributed to adjacent stirrups and/or a direct concrete compression strut. At the same time, the vertical deflection of the beam also increased. As a typical example for the tests, the behavior of specimen T-33-2 is described in more detail hereafter.
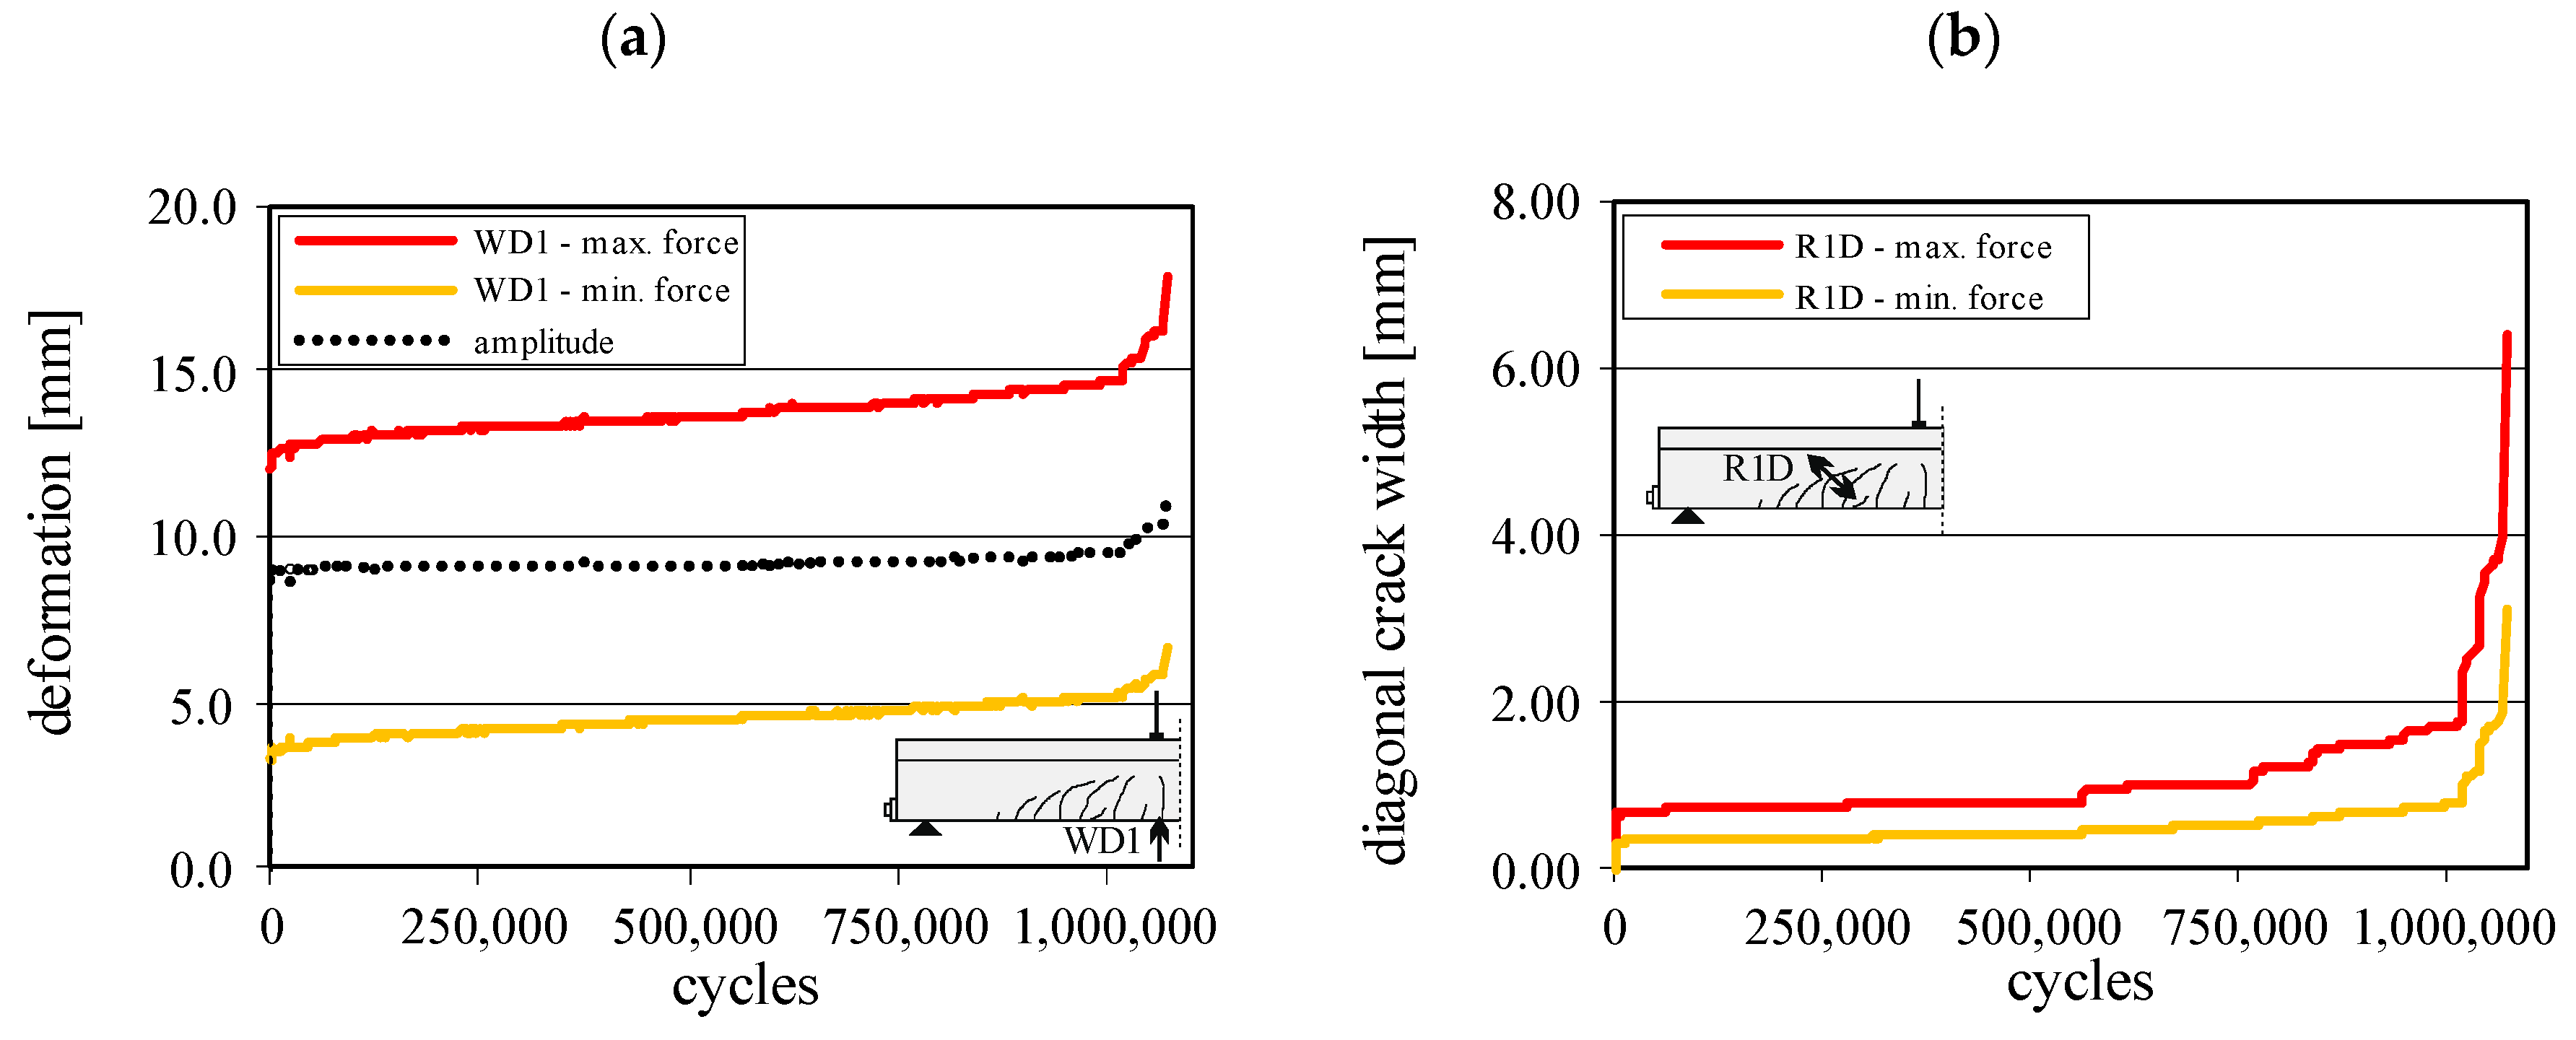
At the beginning of the cyclic loading, the deformation increased significantly because new cracks occurred, and existing cracks widened (Figure 4a). After some thousand load cycles, the deflection gradient decreased, and an internal equilibrium was found by activating a truss model consisting of stirrups and concrete struts. At this stage, the stirrups in the area of the cracks exhibited an almost constant stress range.
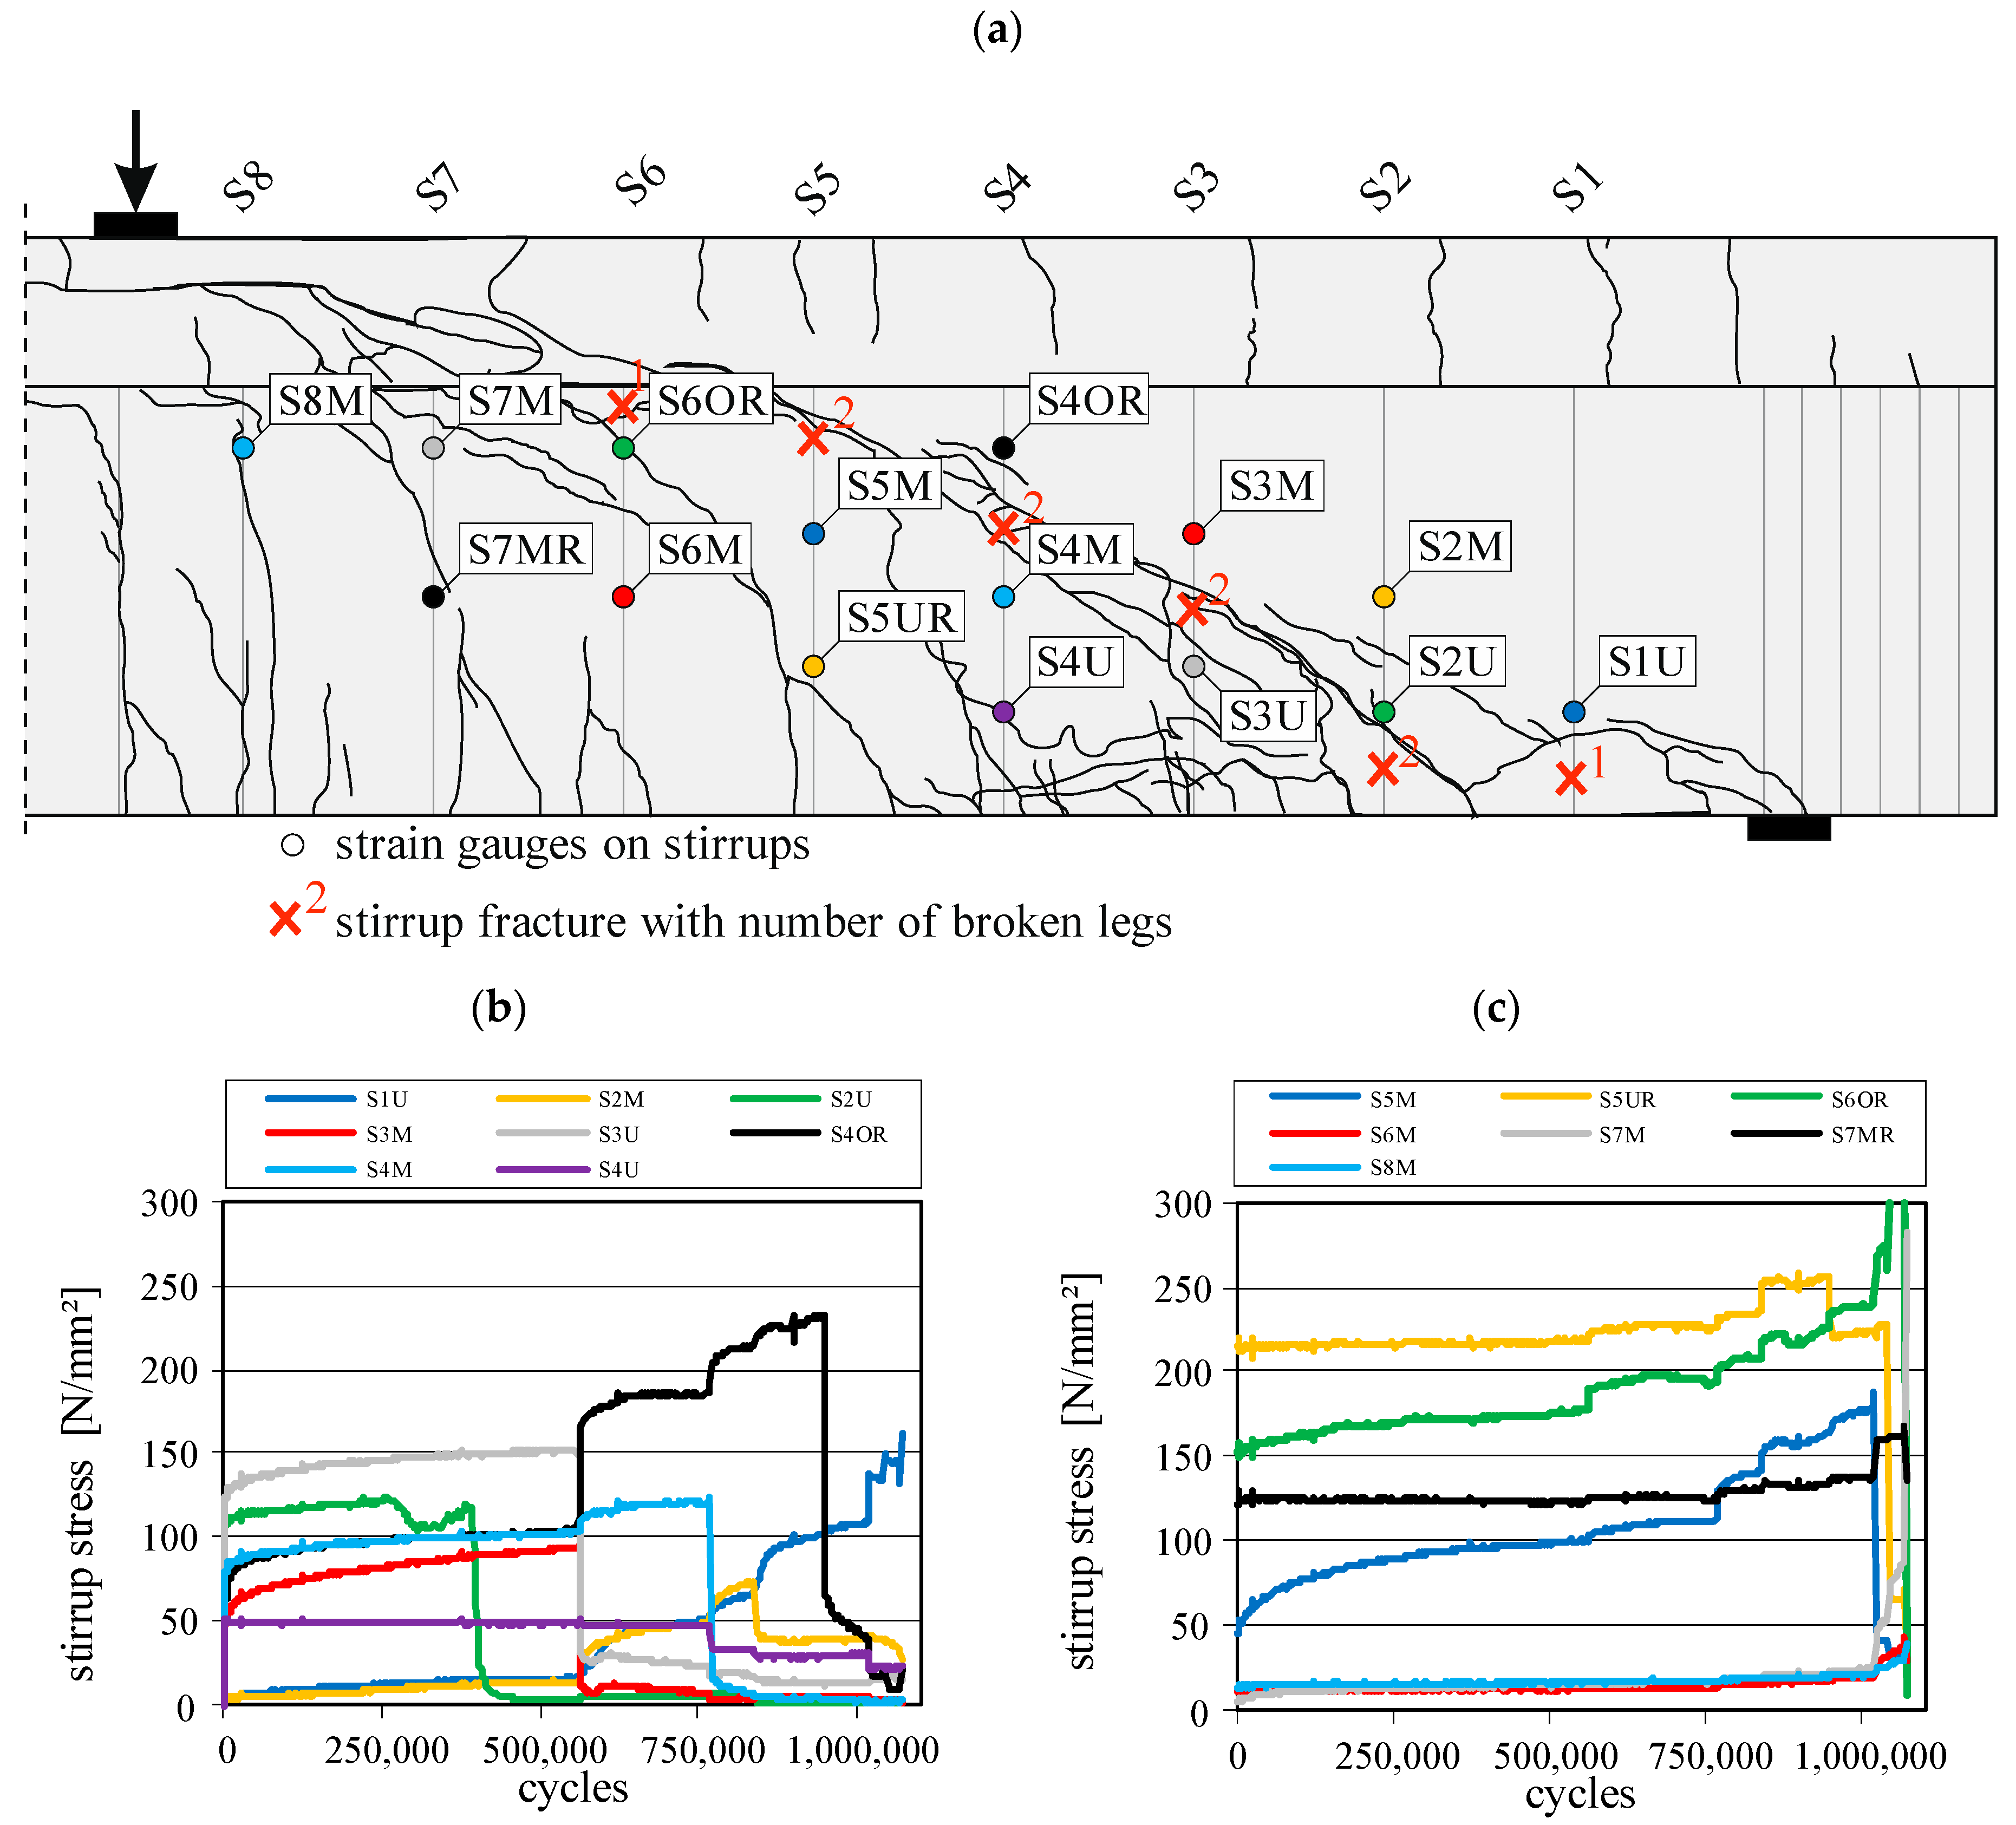
After about 550,000 load cycles, a disproportional increase in crack width was measured by an inductive displacement transducer (R1D, Figure 4b). The increase can be explained in more detail by means of strain gauge measurements on the stirrups. With the stress–strain relation of the reinforcement the corresponding stirrup stresses were determined from the steel strains at upper and lower load. A pronounced yielding, as it is known from static tests, was not observed. Figure 5 shows the measured steel stresses of selected stirrups under upper load. At about 375,000 load cycles, a sudden decrease in steel stress under the upper load was observed for the measuring point S2U, which was induced by fatigue failure of stirrup S2. At 550,000 cycles, the stirrup S3 also broke (Figure 5; measuring point S3U), explaining the increase in crack width. The forces of the internal model were redistributed, so that the adjacent stirrups exhibited higher tensile stresses. The highest increase was measured in strain gauge S4OR on stirrup S4. Almost simultaneously, the steel stress in stirrups S1 (S1U) and S2 (S2M) increased. This indicates an upcoming rearrangement of the truss model into a direct compression strut from load introduction to support. At this time, the truss model in the range of stirrup S5 and S6, also with increased stirrup stresses, was still intact.
This chain reaction proceeded faster with increasing fatigue fractures during cyclic loading, until the crack clearly propagated into the upper flange at about 1.01 million cycles. At the same time, the stirrup stress of stirrup S5 decreased abruptly. Consequently, the crack widths and vertical deformations increased significantly until the end of the test. At about 1.07 million cycles, the final failure of the compression zone occurred (Figure 3) and the first part of the test was stopped. The second part of the test was continued with the unimpaired shear span of the beam as a three-point bending test with a span of 4.0 m. The shear span with fatigue failure was positioned beyond the shifted support and acted as a cantilever (Figure 1). For the second part of the test, the same cyclic shear forces and the same a/d ratio (shear slenderness) were applied until fatigue failure after a total of 1.37 million load cycles.
After the second part of test, the concrete of the webs was removed at the intersection of cracks and stirrup reinforcement in order to visually check the stirrups for fractures. In Figure 5a the positions where stirrup fractures were detected are marked by “x”. The corresponding number indicates whether one or both legs of the closed stirrups were broken. In the shear span shown here, almost all stirrups were broken at both legs.
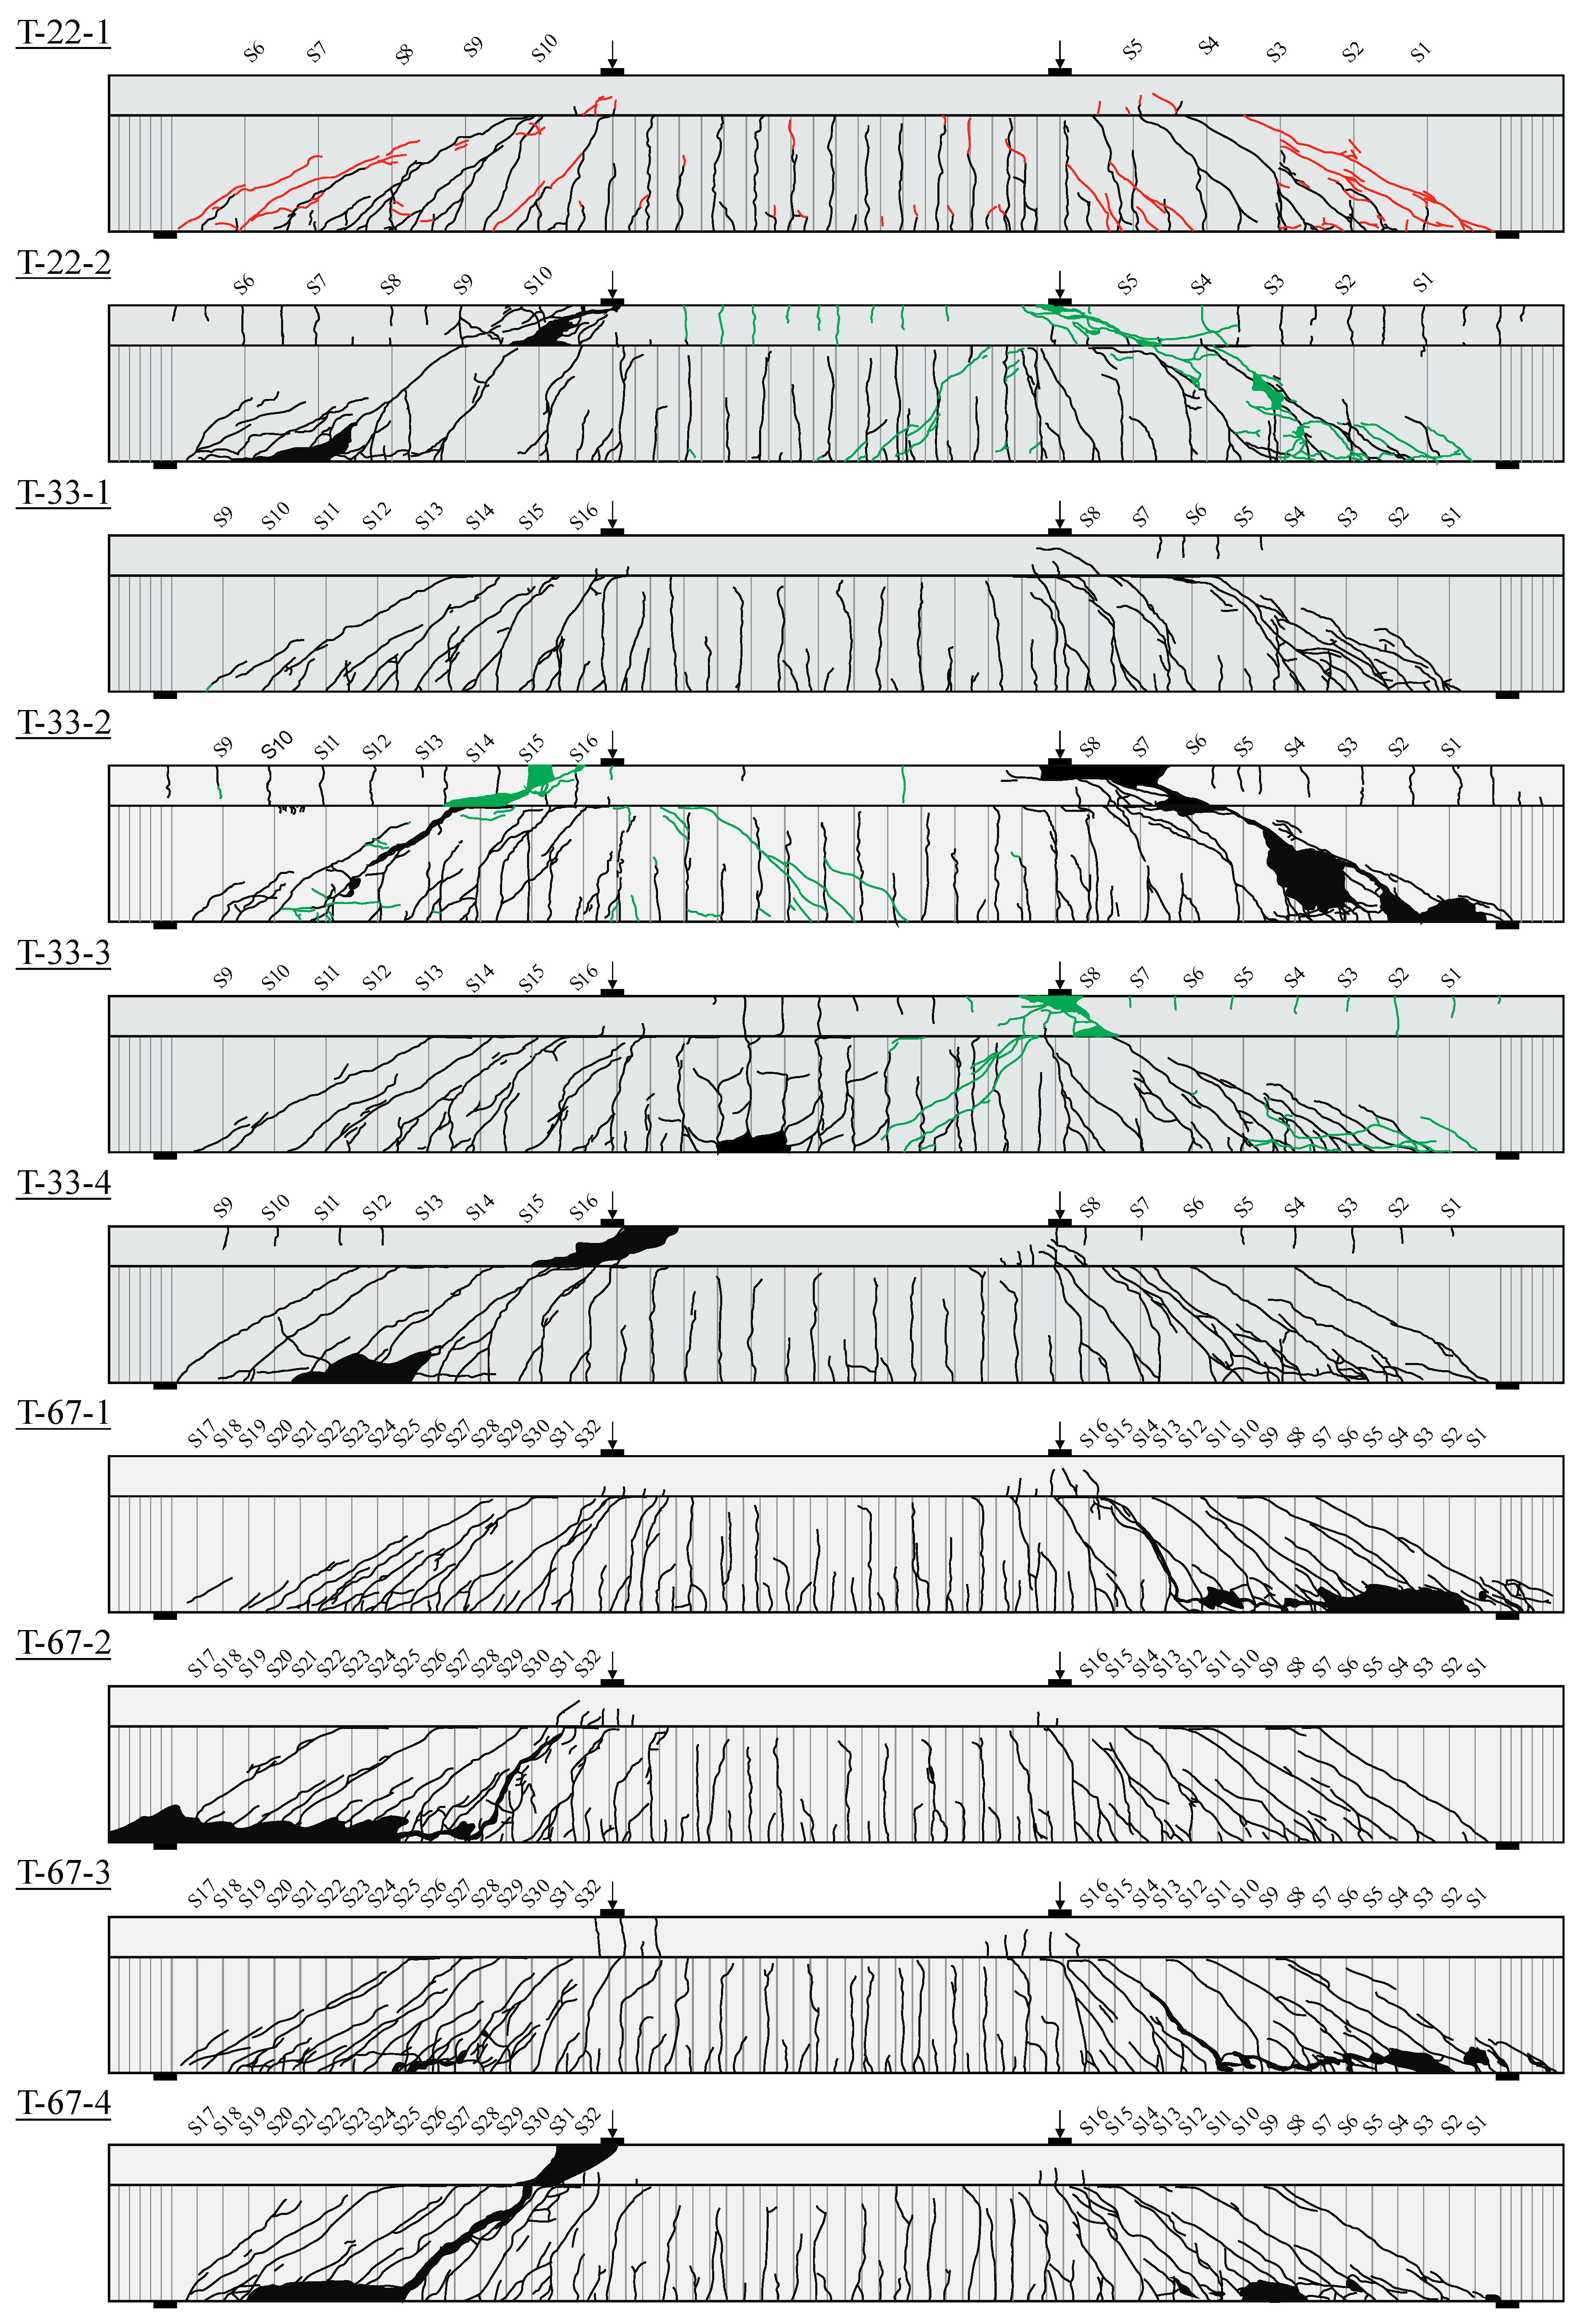
The behavior exemplarily described for beam T-33-2 was typical for all test beams. After the concrete tensile strength had been degraded by the cyclic loading, existing cracks widened and elongated and new cracks developed. Due to shear cracking, the stirrups exhibited cyclic stress ranges. Once the fatigue strength of the reinforcing steel was reached, a fatigue failure of a stirrup leg occurred, which led to a redistribution of the shear forces within the shear span. Adjacent stirrups obtained higher stress levels and stress ranges, which either accelerated their fatigue failure or caused a rupture by exceeding the residual tensile strength. Because of the shear crack pattern, which developed successively and randomly, the stirrups did not exhibit the same stress range and same stress level over the whole test period despite the applied constant shear loads. The stress ranges of the stirrups increased stepwise with each failure of a stirrup leg. After reaching pronounced shear cracks and several stirrup ruptures, the original truss model changed to a direct compression strut system between load application and support. Figure 6 shows the final crack patterns of all T-beams.
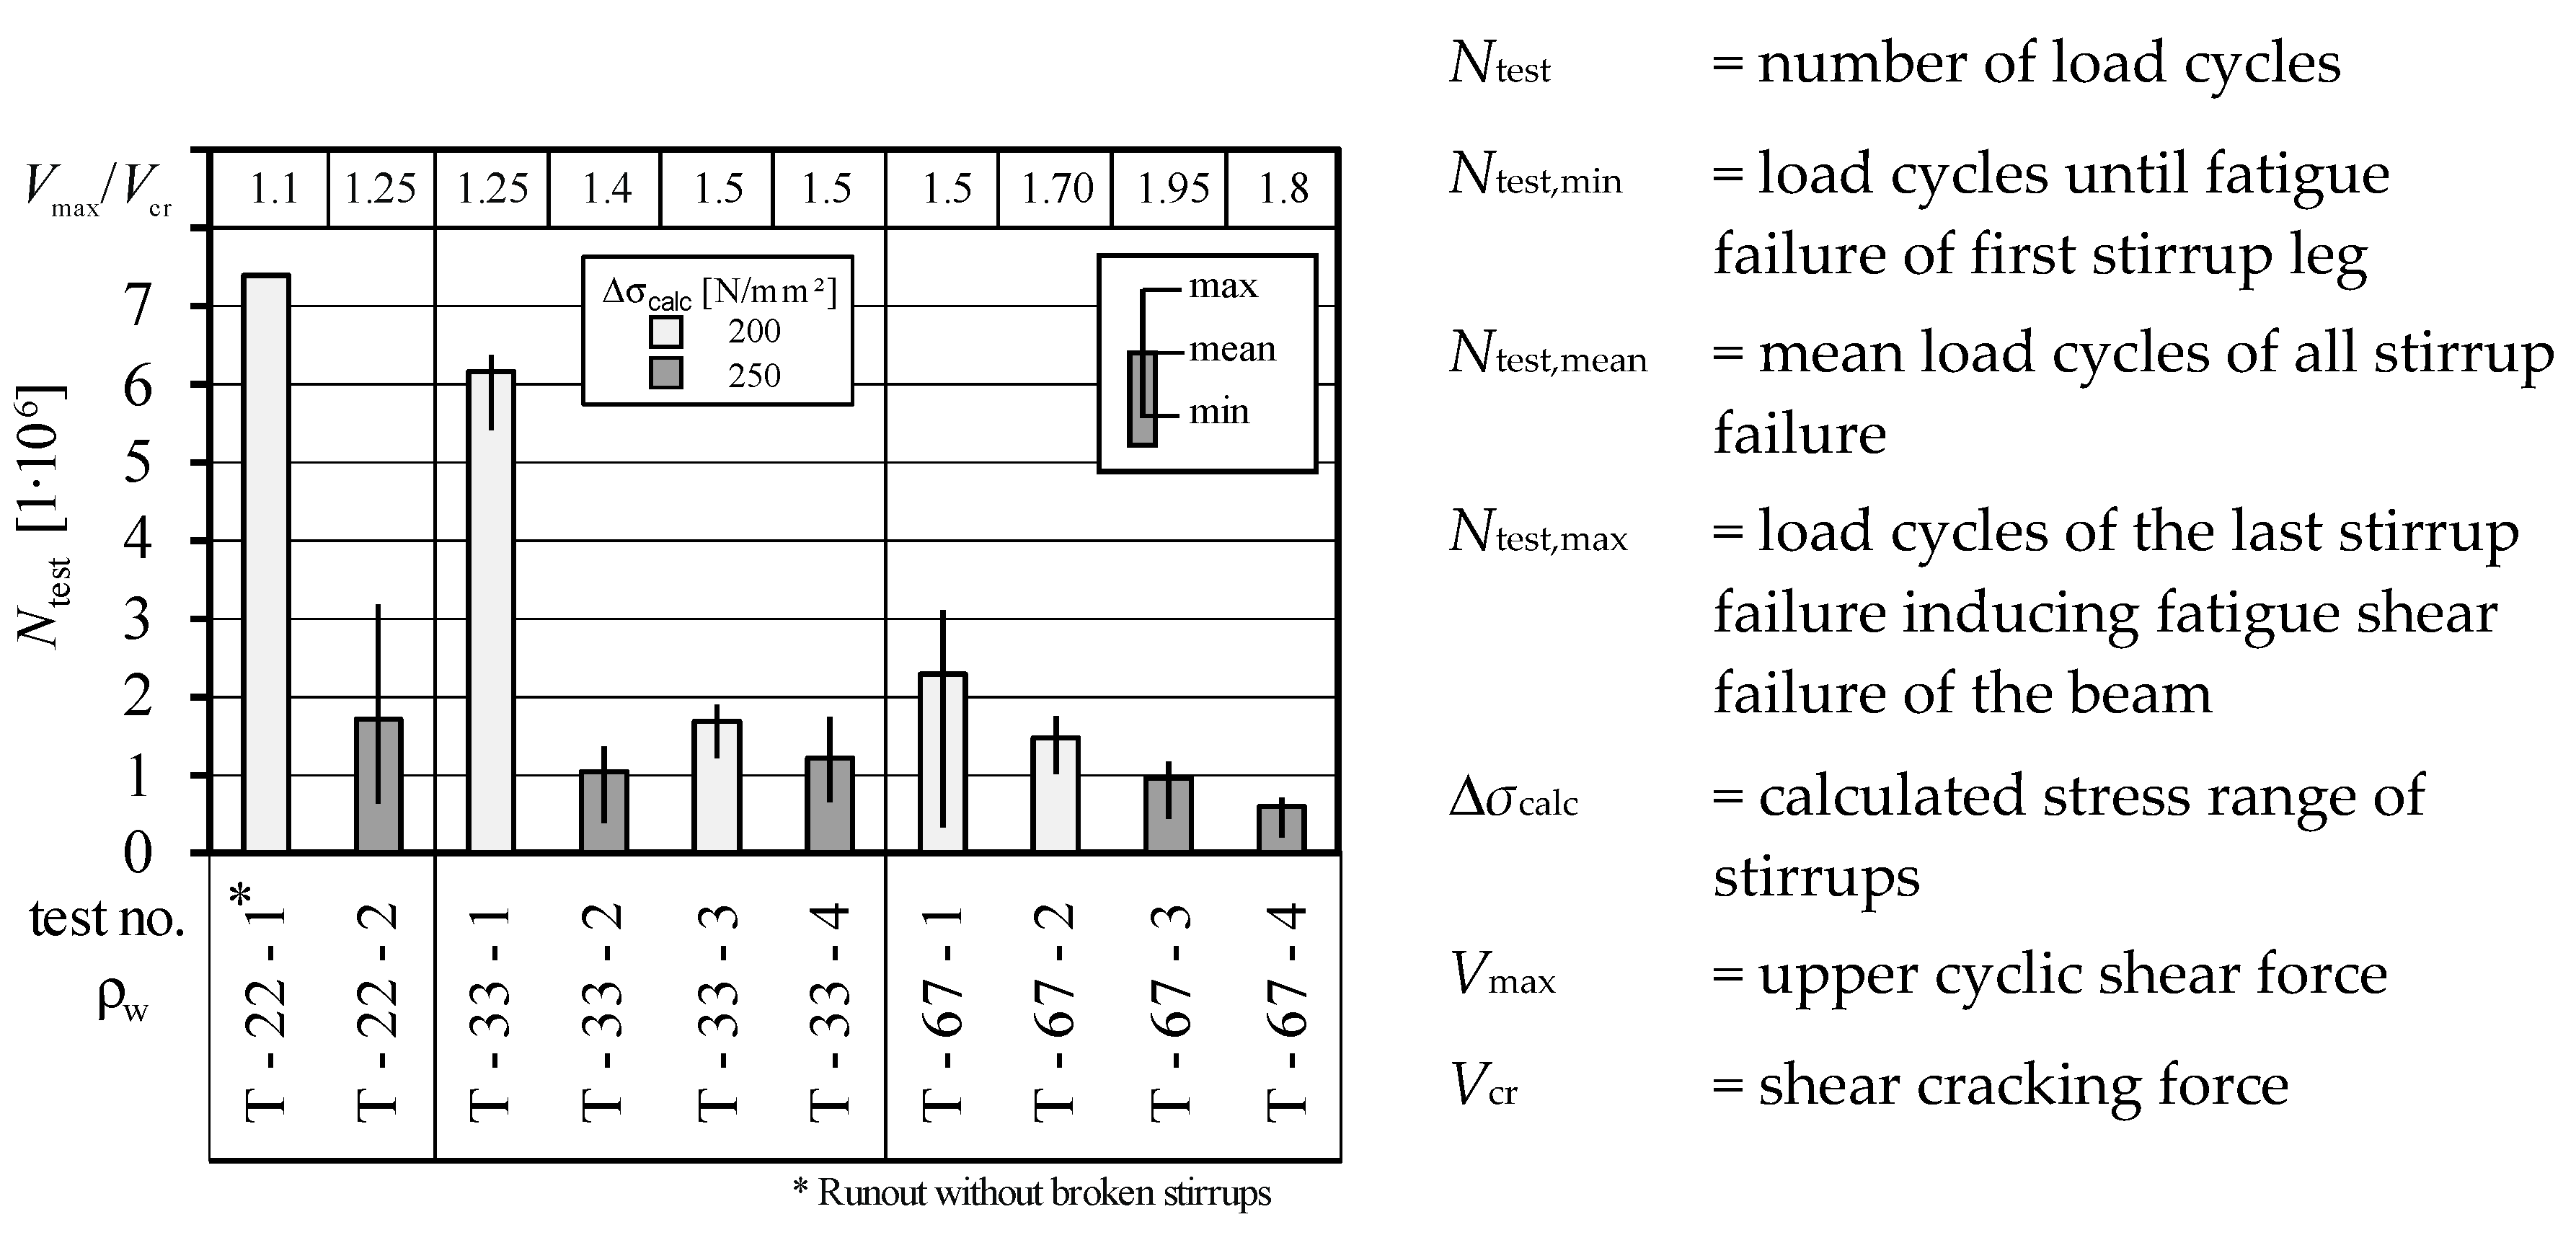
In Figure 7 the resisted load cycles of all tests are summarized, considering the shear reinforcement ratio ρw (0.22%; 0.33%; 0.67%), calculated stress range of stirrups Δσcalc (200 N/mm2, 250 N/mm2) and the upper shear force related to the shear cracking force Vmax/Vcr. Based on the cyclic shear force range in the tests ΔVtest, the stress ranges Δσcalc were calculated according to Equation (1), assuming a strut inclination of θfat according to Equation (3). In general, the stirrups failed earlier with increasing stress range and/or increasing upper load.
The load cycles listed in Table 2 and the maximum values in Figure 7 represent the point of final shear fatigue failure of the beam after several stirrups had failed already in advance. Based on the evaluation of the measured stirrup legs, the resisted number of load cycles of each stirrup and its strain during the test can be determined in more detail. The boxplot in Figure 7 shows the range between minimum and maximum number of load cycles until the failure of a single stirrup leg (thin line) and the mean value of all stirrup leg failures (box). The top line in the diagram indicates that the upper shear forces Vmax during cyclic testing varied between 110% and 195% of the shear cracking load Vcr. In test T-33-2, with a calculated stress range of Δσcalc = 250 N/mm2, the first fatigue failure of stirrup occurred after 375,000 load cycles, the last one after 1,370,000 loads, leading to the final shear fatigue failure of the beam. The mean resisted load cycles of all stirrups was 1,040,800 cycles. In total, 6 of 8 stirrups had to fail over a period of 1.07 million load cycles, before the final shear failure of one shear span occurred. In the other shear span, 5 of 8 stirrups had to fail for final shear failure after 1.37 million load cycles. In other words, the loss of some stirrups does not cause the shear failure of a prestressed beam. The development of a crack pattern and growth of crack widths announces the final failure in an acceptable way. In test T-22-1 with a pronounced shear crack pattern under static preloading, the first stirrup did not fail after more than seven million load cycles. For this reason, the test was stopped and the number of load cycles at that time was used for the mean value Ntest.
4. Comparison with Existing Approaches
To check the accuracy of the current approach of Eurocode 2 (EC 2) [6,7,8,9] for shear fatigue of beams with stirrups the measured number of cycles until failure of the stirrups Ntest was compared with the calculated number of cycles until failure Ncalc. For this, a compression strut inclination according to Equations (2) and (3) was used as a basis for determining the stress range under cyclic loading (Equation (1)). The stress in the shear reinforcement under maximum and minimum load calculated with θfat must not exceed the yield strength, and the respective stress range Δσ has to be lower than the fatigue resistance—e.g., ΔσRsk.
While, according to Eurocode 2, the angle θ of the concrete strut to the beam axis (Figure 8a) can be chosen within a range of 21° to 45°, in the German National Annex θ is determined accounting for a concrete contribution by aggregate interlock. Therefore, the angle θ, according to [6] in conjunction with [7], depends on the compressive stress of concrete due to prestressing σcp and the ratio of concrete contribution VRd,cc to applied shear force VEd (Equation (2)). While for buildings, according to [7], θ may vary between 18° and 45°, the German design rules for concrete bridges [9] define a lower limit for the strut inclination of 30°. Δσcalc for each test is given in Figure 7. With this, Ncalc was determined, on the one hand, for an S–N curve (Figure 8b), specified in EC 2 NA(D) [7] (ΔσRsk(N*) = 175 N/mm2; N* = 106; k1 = 5; k2 = 9) and, on the other hand, for an S–N curve according to Maurer et al. [45] (ΔσRsk(N*) = 195 N/mm2; N* = 106; k1 = 4.1; k2 = 7.2), which was derived for reinforcing steel embedded in concrete. Both S–N curves are bilinear with a change of inclination at ΔσRsk and N* = 106 load cycles. The inclination of the S–N curve is defined by the stress gradients k1 for N ≤ N* and k2 for N ≥ N*.
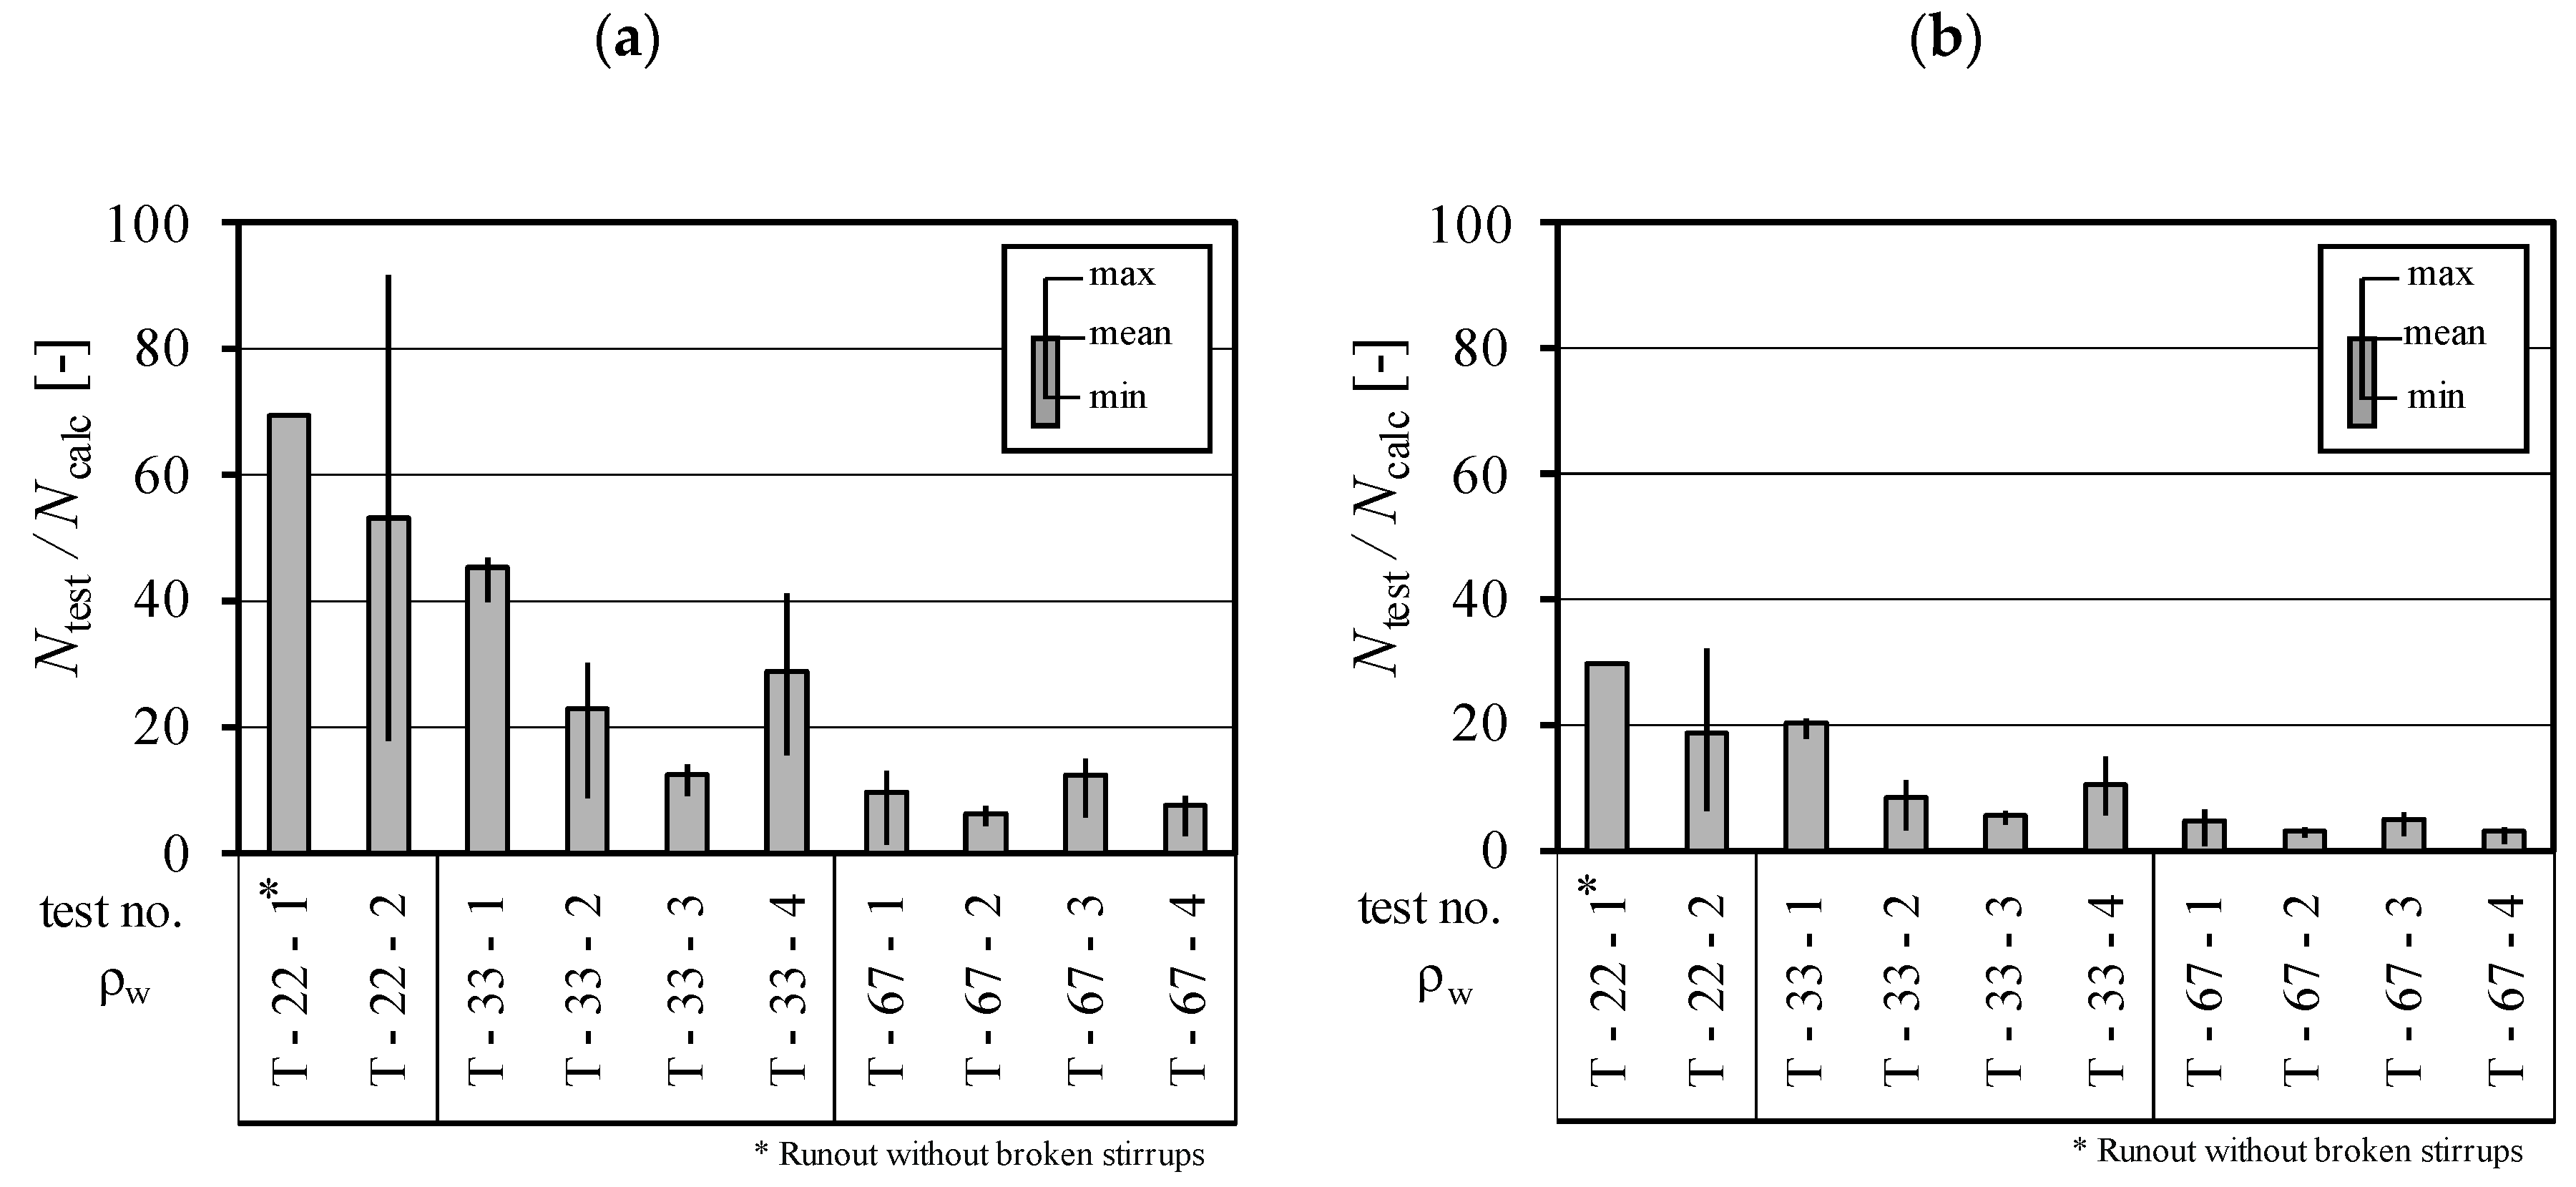
The calculation based on the S–N curve, according to Eurocode 2, clearly underestimates the resisted cycles of the tested stirrups (Figure 9a), especially for low shear reinforcement ratios. The mean value of experimental load cycles was at least six times higher than the calculated number of cycles—in some tests up to almost seventy times. The ratio of test T-22-1 is estimated conservatively, based on the number of cycles when the test was stopped without the fatigue failure of any stirrup. The application of the S–N curve, according to [45], reveals a better agreement with ratios of Ntest/Ncalc varying between approximately 3 and 29 (Figure 9b).
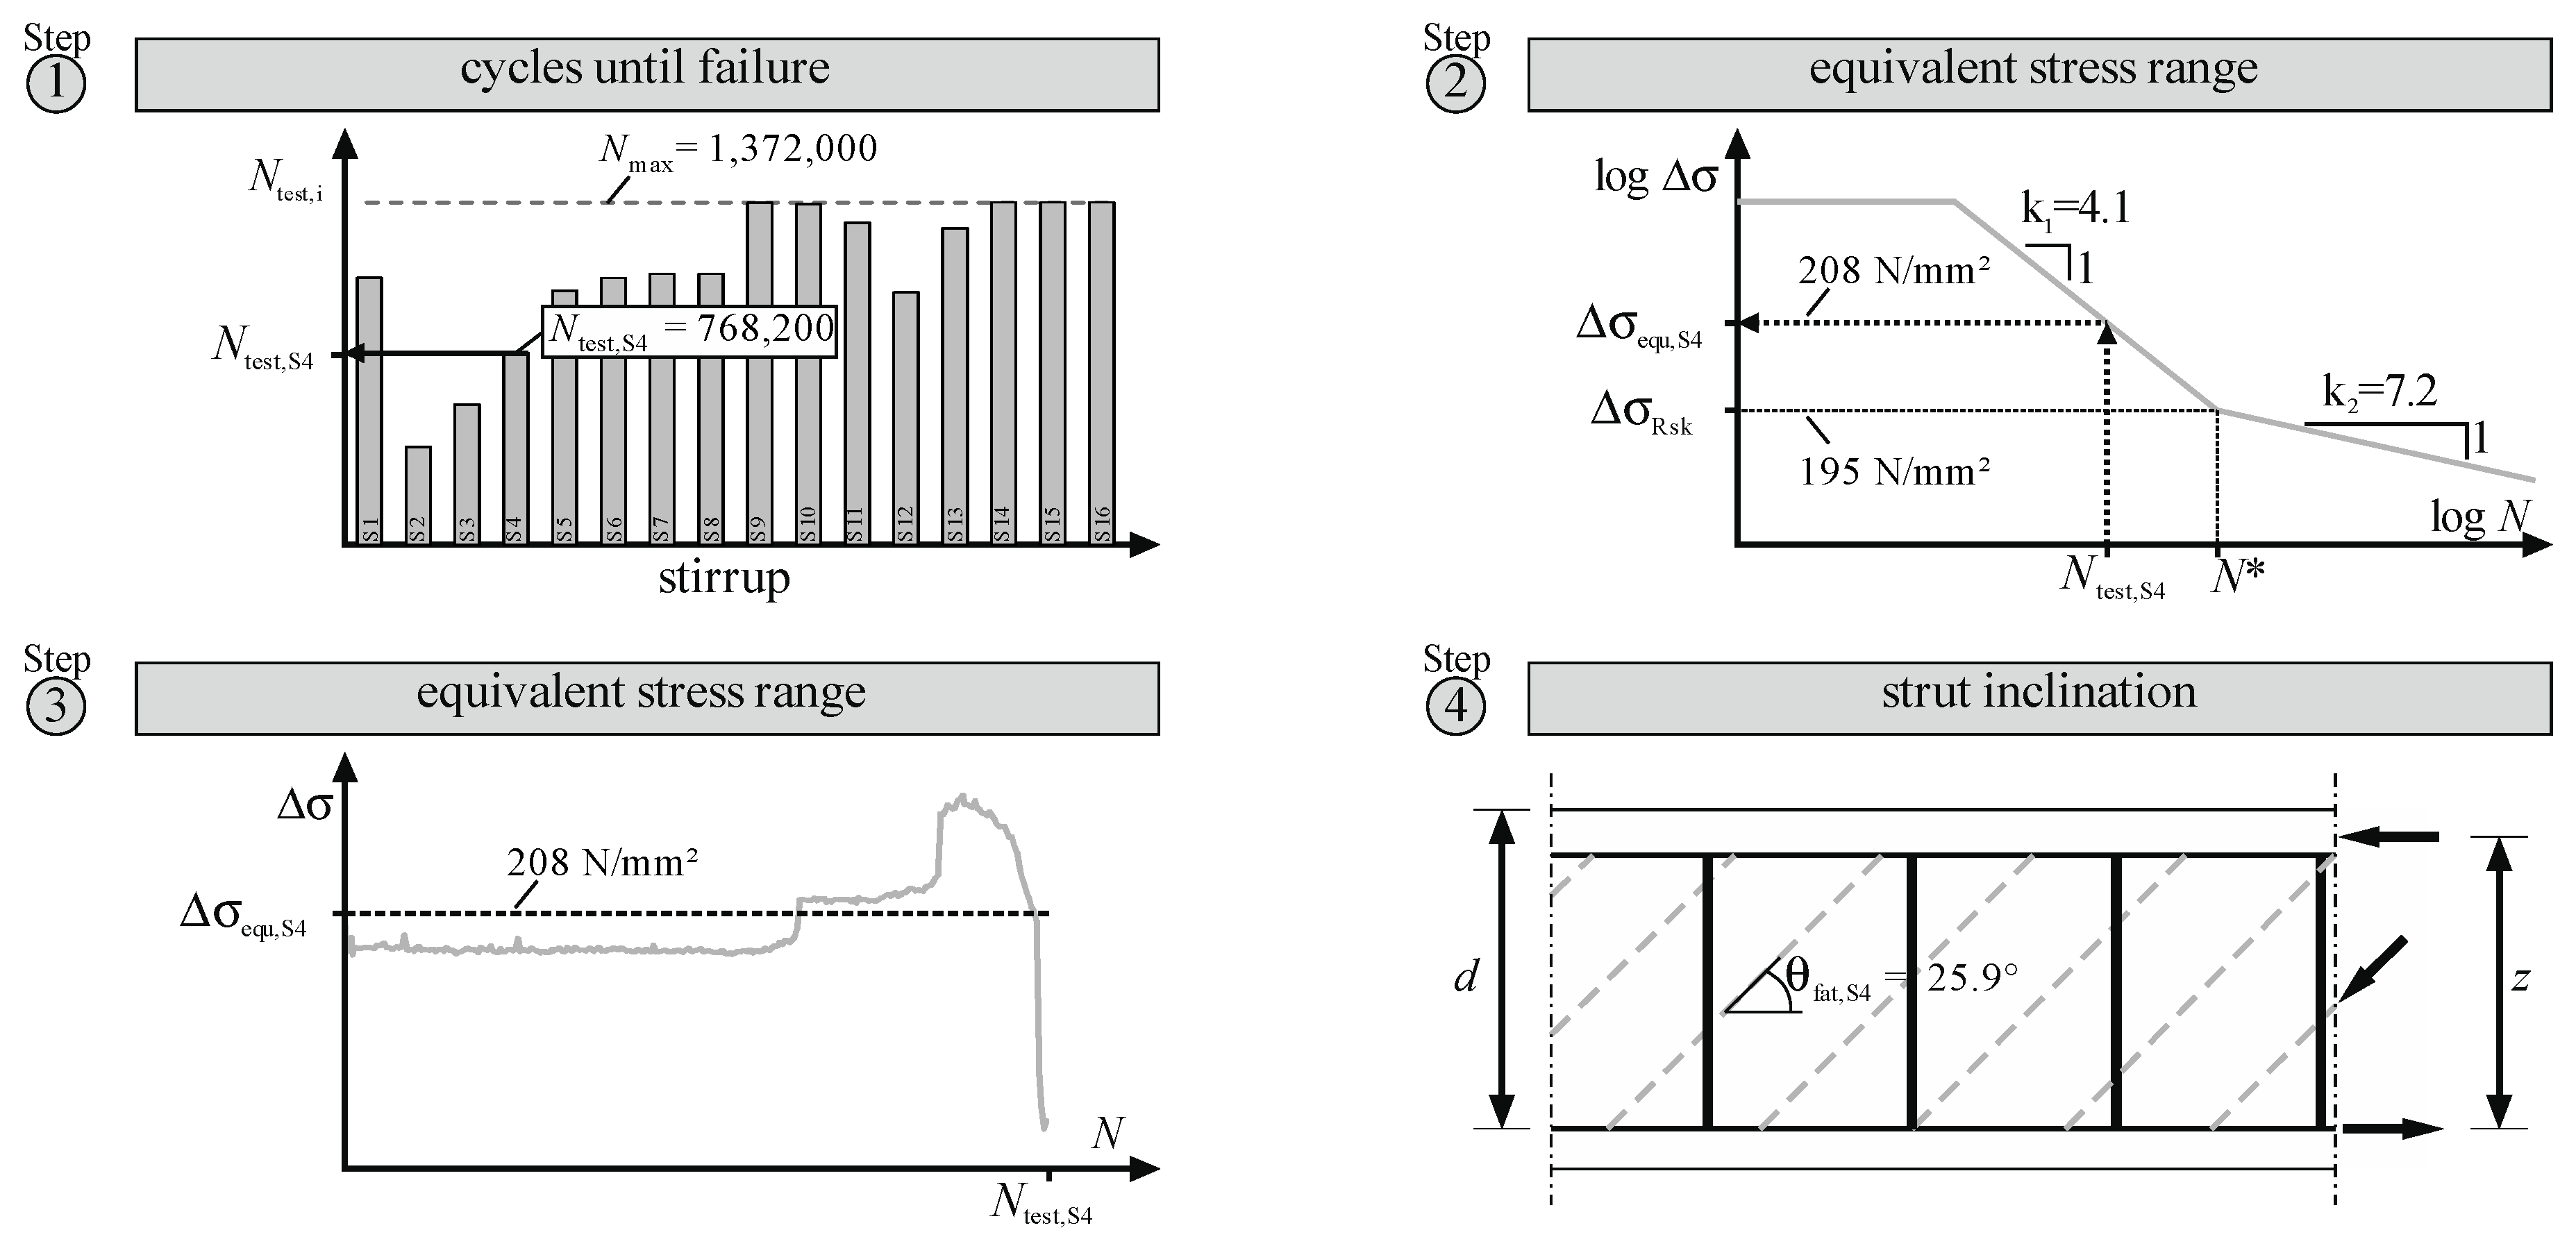
The large difference between observed and calculated load cycles is mainly caused by the overestimation of the calculated stress ranges applying the increased strut inclination for fatigue θfat, according to Equation (3). Therefore, the tests were additionally evaluated using a method proposed in [40,46] with an improved approach to determine the strut angle under cyclic loading. The method is based on an evaluation of the determined number of cycles to failure for each measured leg of the shear reinforcement. The procedure is shown in Figure 10.
In Step 1, the number of cycles to failure of each individual stirrup Ntest,i is determined (Section 3). Subsequently, the equivalent stress range Δσequ,i corresponding to a damage of 1.0 according to the Palmgren–Miner Rule [6] is calculated from the number of cycles to failure by applying an S–N curve (Step 2). Here, the S–N curve, according to [45], was applied due to its better consistence with the test results (Figure 9). Accordingly, the variable stress range is transformed into a constant stress Δσequ (Step 3), leading to the same damage. Using Equation (4), derived from Equation (1), in Step 4, the corresponding strut angles under cyclic loading θfat,test were determined utilizing the shear range ΔVtest from the test and the previously determined equivalent stress range Δσequ.
For the stirrup legs, which did not fail in the test, the number of load cycles at test stop was assumed to be the respective number of cycles to failure. If several failures occurred at one stirrup leg, the respective smaller number of cycles to failure was used to determine θfat,test and the time of the second stirrup failure was neglected.
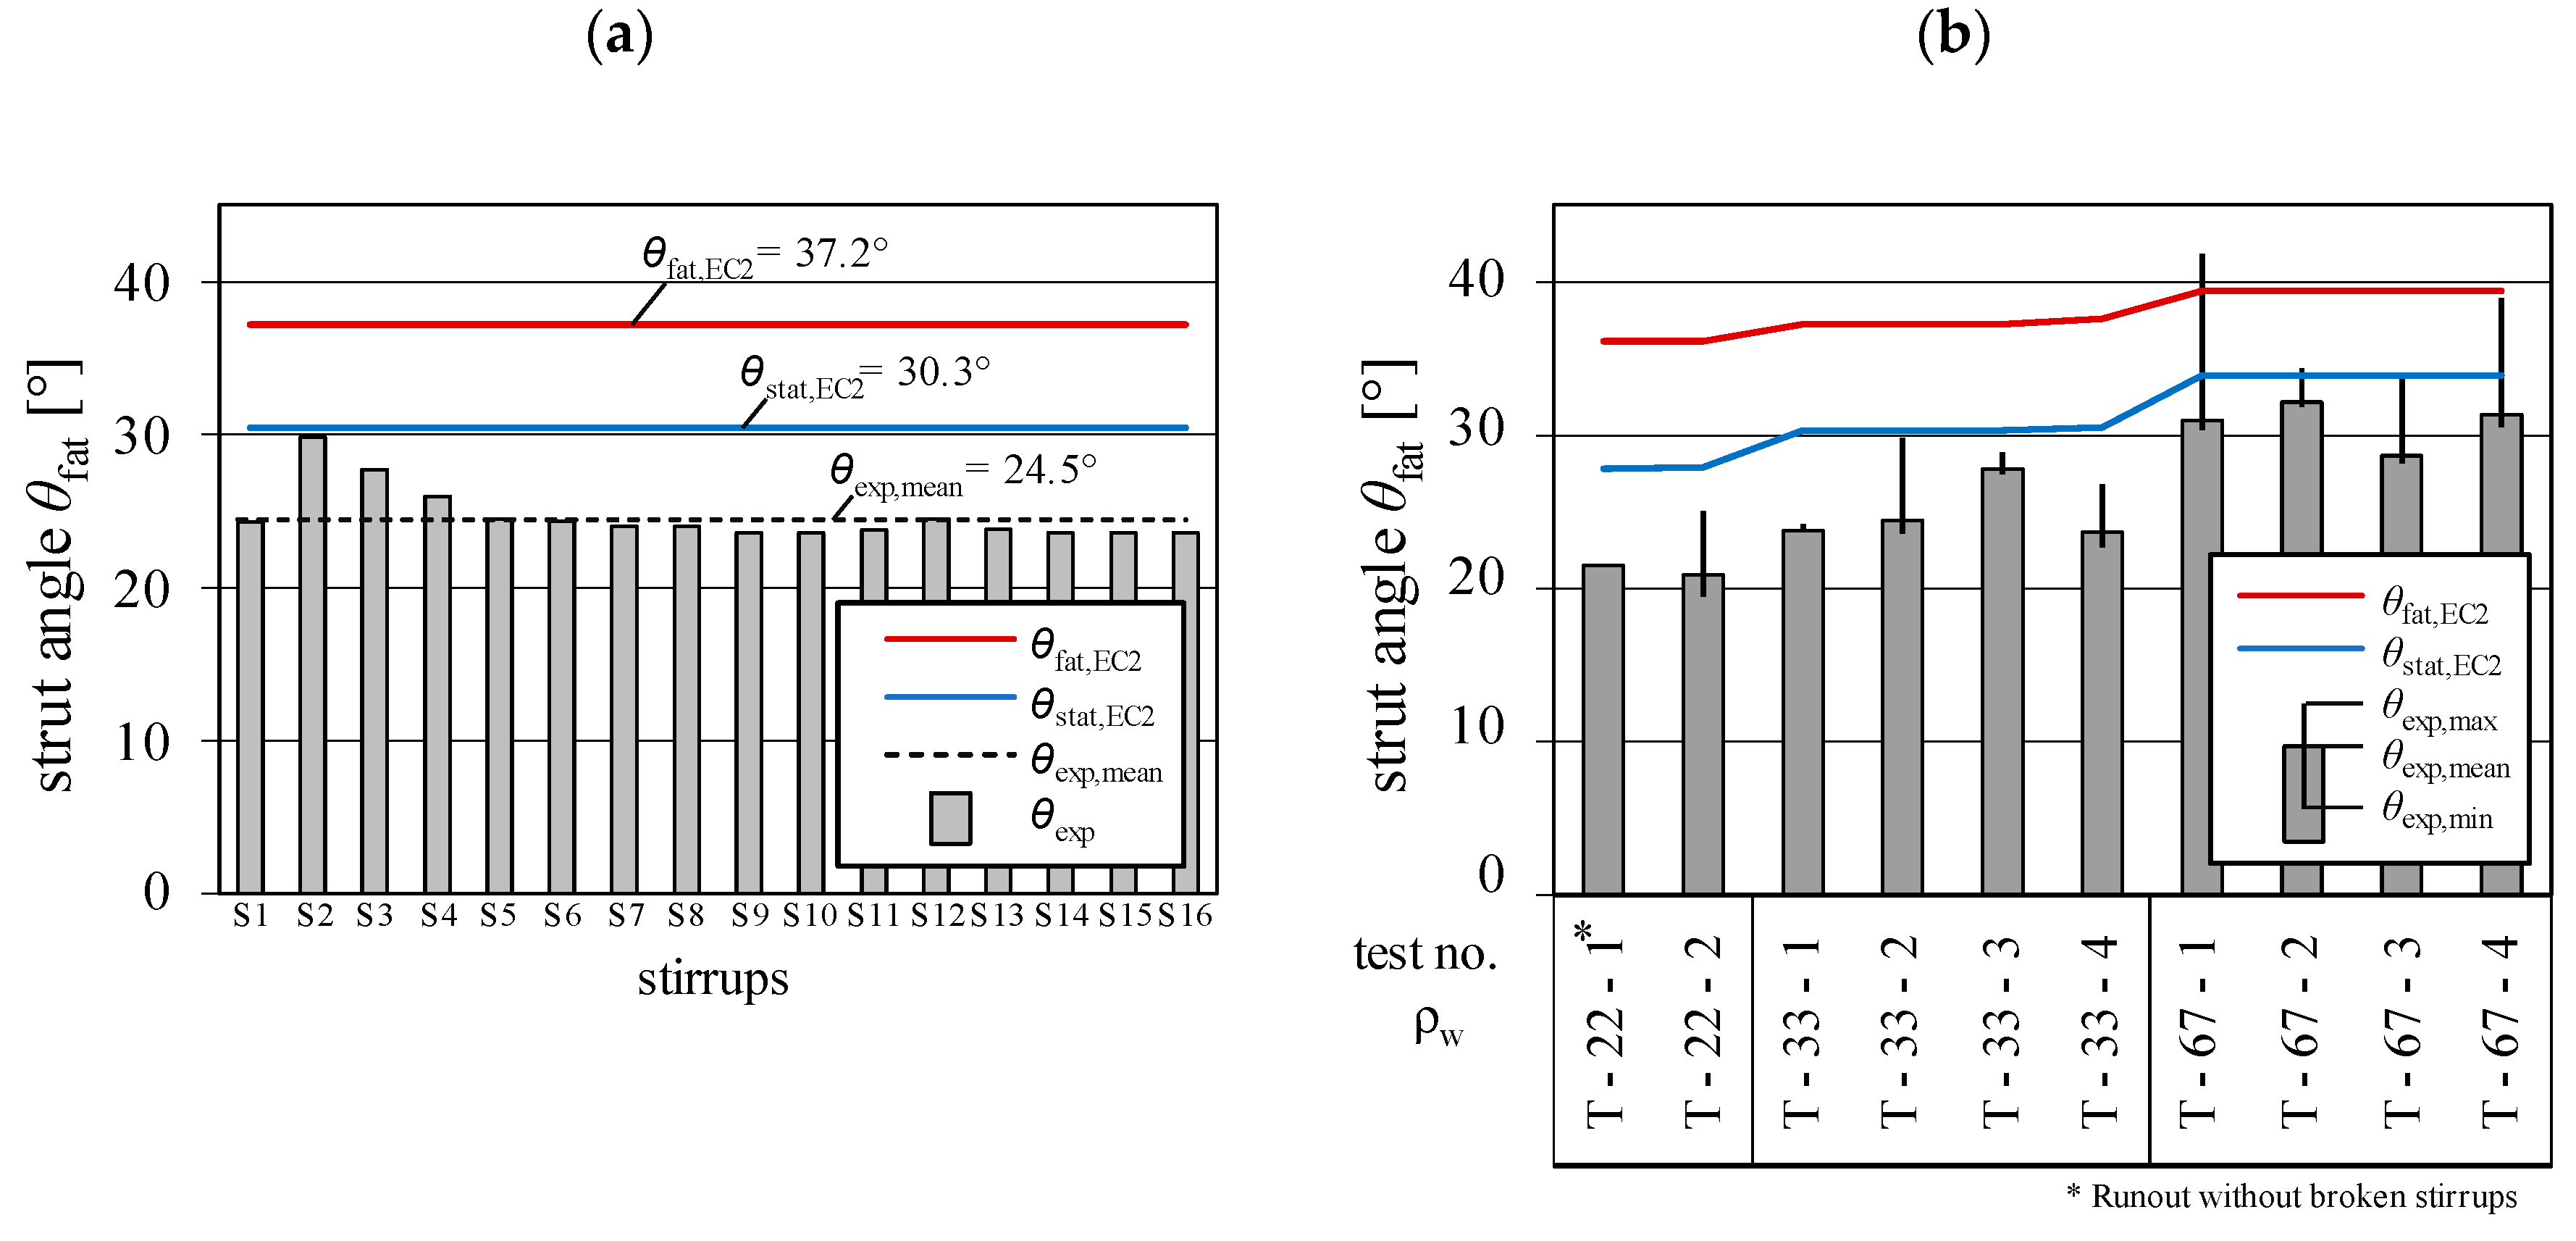
Figure 11a shows the resulting strut angles in test T-33-2 for each stirrup. The strut inclination recalculated from the equivalent stress range of each stirrup leg varied between 23.6° and 29.8° with a mean value of 24.5°. The strut angle for fatigue θfat according to Equation (6.65) in EC 2 [6], corresponding to Equation (5) in this paper, amounts to 37.2° and determines a too-steep strut inclination, overestimating the stress range of the stirrups under fatigue loading. As cyclic loading is expected to reduce the concrete contribution of aggregate interlock due to the local crushing of the crack surfaces, the stress of the shear reinforcement may increase [47]. In the fatigue design of shear reinforcement, this is considered by increasing the angle θ, determined in the ultimate limit state (ULS) design under static loading, according to Equation (3). On the other hand, the cyclic loading takes place on load level below the characteristic load and is not increased by partial safety factors, as in ULS. To balance these crosscurrent effects, Teworte and Hegger [17,40,46] proposed to calculate the stirrups stress range under cyclic loading for prestressed I-beams with shear reinforcement ratios up to 0.35%, based on the assumption:
In [43], this proposal was extended up to shear reinforcement ratios ρw = 0.67%. This assumption of Equation (6) results in a compression strut angle of 30.3° for beam T-33-2, which is on the safe side, as θstat,EC2 is higher than the recalculated compression strut angles from the test, which varied between θexp,min = 23.6° and θexp,max = 29.8°, with a mean value of θexp,mean = 24.5°.
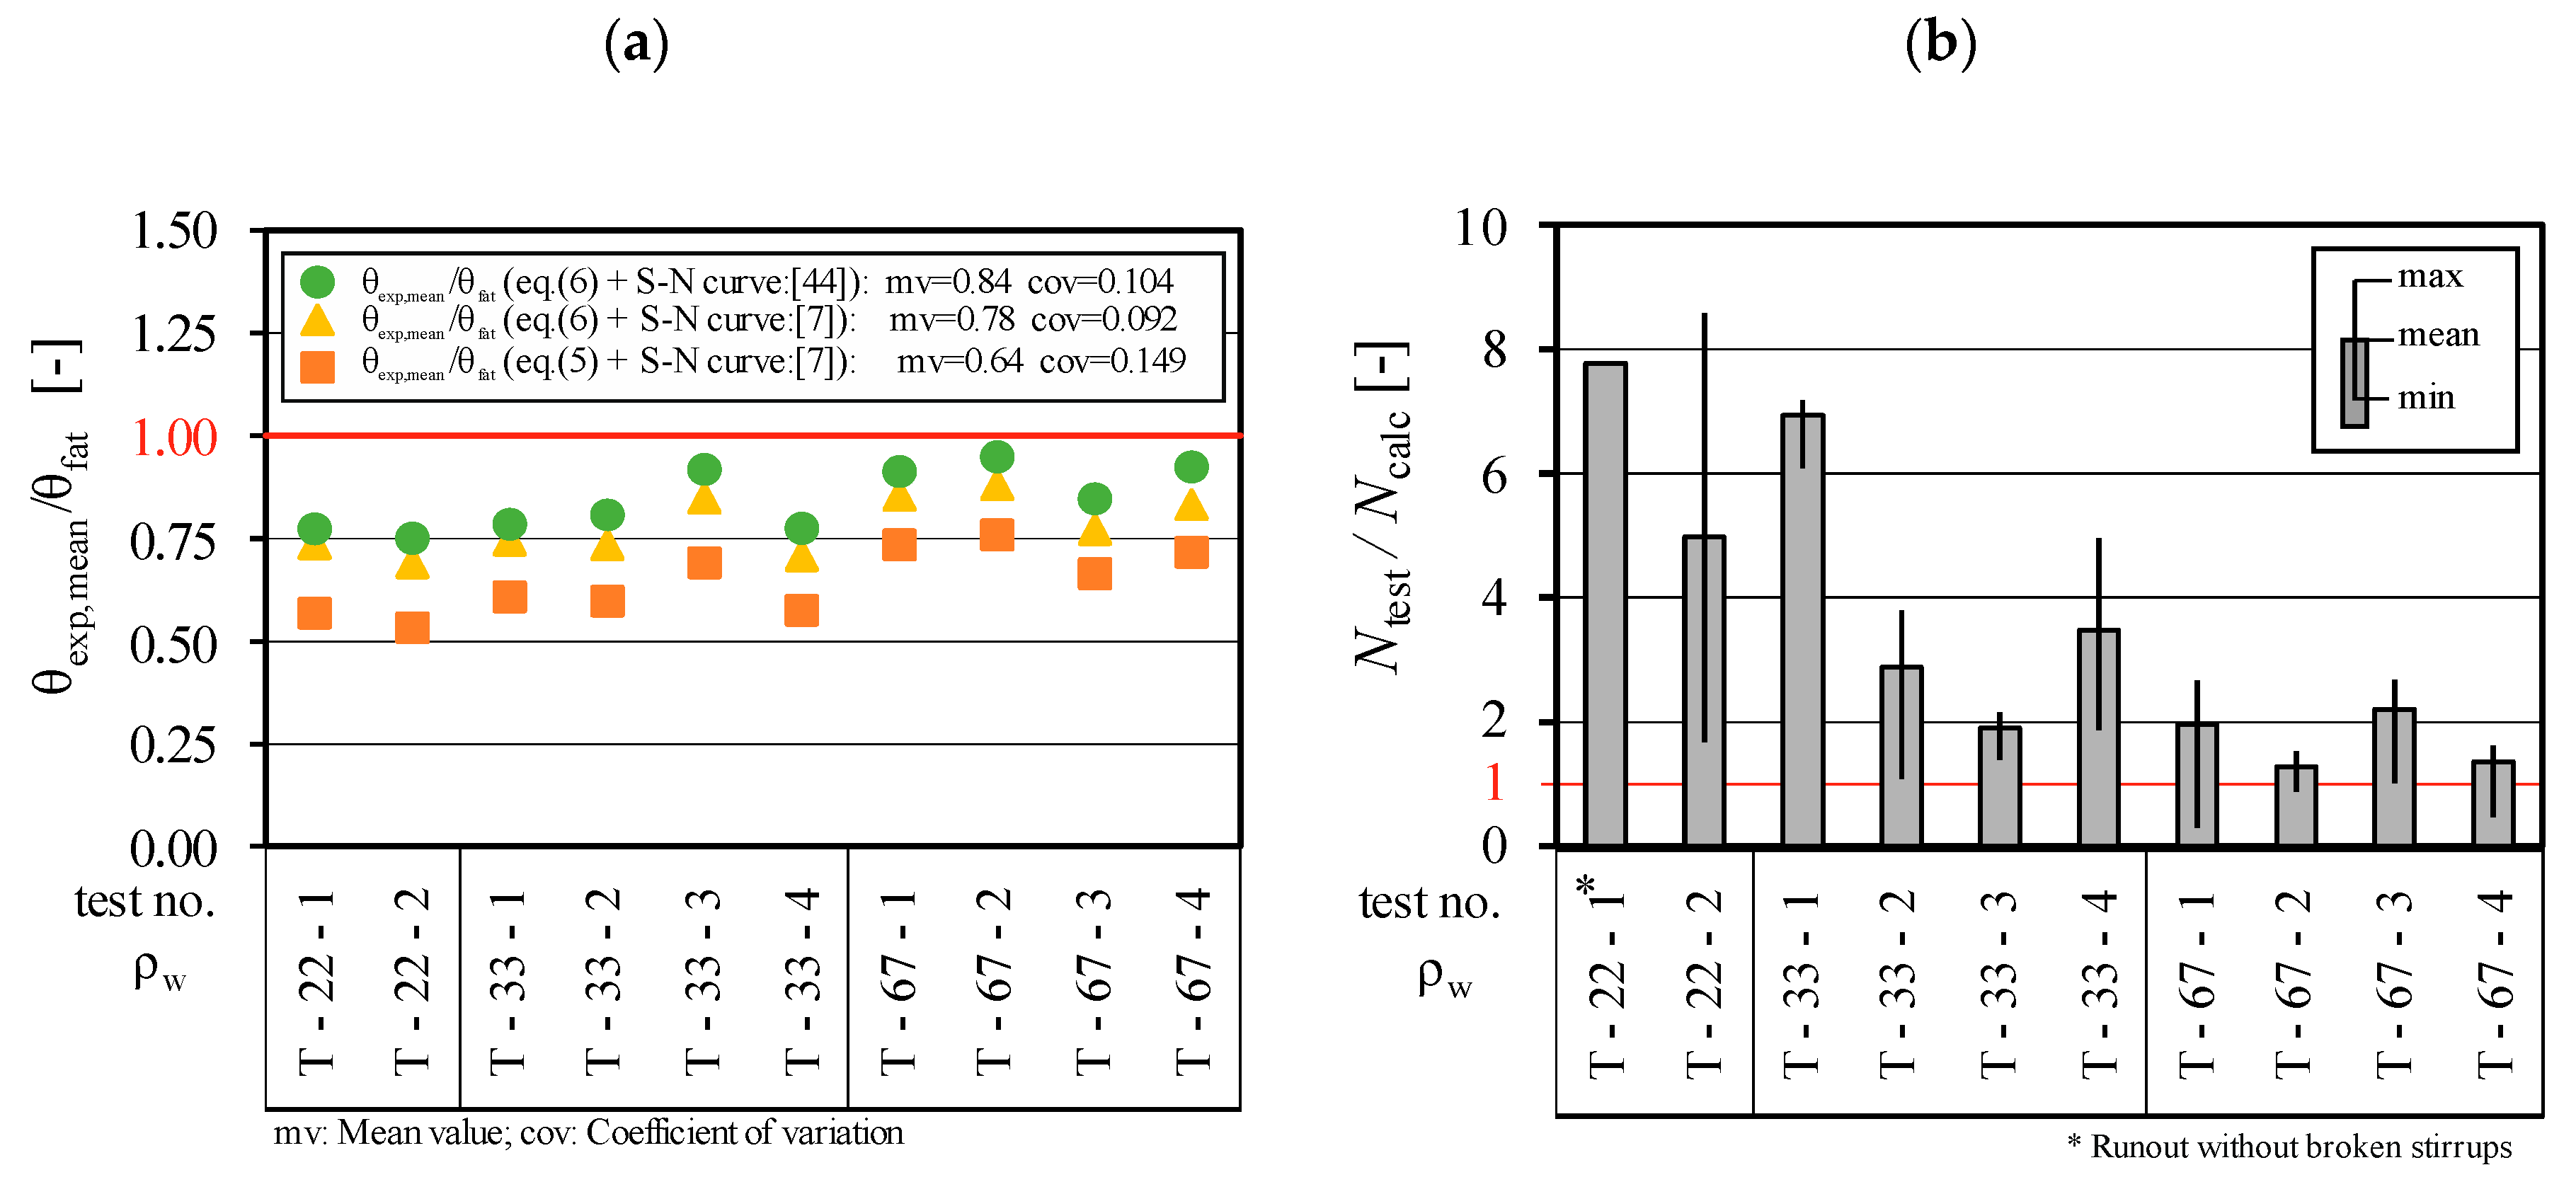
The same evaluation was performed for all beams tested with constant load levels and is summarized in Figure 11b. In addition to the mean value of the number of cycles reached before failure, the minimum and maximum values of all stirrups of each beam are also given. As for test T-33-2, the comparison of the recalculated strut angles of all T-beams with θstat,EC2 confirms the assumption, since the static strut angle according to EC 2 is in good accordance with the test results. The accuracy of this approach was verified in Figure 12a. In this figure, the ratio of the mean experimentally determined strut angle θexp,mean (Figure 11a) to strut angle θfat using different approaches is presented. The ratio of θexp,mean/θfat for the EC 2 approach (Equation (5), in combination with the S–N curve in accordance with EC 2), results in a mean value mv = 0.64 with a coefficient of variation of cov = 0.149. By applying θstat for static loads (Equation (6)) with the same S–N curve, the mean value already increases to 0.78 and the coefficient of variation drops from 0.149 to 0.092. If the S–N curve, according to Maurer et al. [45], is introduced to Equation (6), the mean value increases to 0.84 with a coefficient of variation of 0.104.
Therefore, this approach can also be applied to prestressed concrete T-beams with shear reinforcement ratios up to ρw = 0.67%.
Finally, the resisted number of cycles Ntest are compared with the calculated number of cycles applying Equation (6) and the S–N curve, according to [45] (Figure 12b). In comparison to Figure 9b, the ratio of Ntest/Ncalc is much closer to one, which also obviously confirms that the approach θfat = θstat,EC2 is appropriate for prestressed concrete T-beams with shear reinforcement ratios up to ρw = 0.67%.
5. Discussion
The main objectives of this research were: to determine the number of load cycles to failure and to compare them with the current design approaches; the announcement of shear fatigue failure; the determination of the relevant strut inclination of the truss model in order to evaluate the stress ranges of the stirrups under cyclic shear load. The shear reinforcement ratio and the load ranges were investigated as main parameters influencing the shear resistance under cyclic loading. The following findings can be drawn from the investigations:
- As already shown for I-beams [40,42,43], the cyclic loading of prestressed T-Beams led to a successive failure of the stirrup reinforcement with the simultaneous redistribution of shear forces to adjacent stirrups, associated with a clearly visible increase in deformations and crack widths. Due to pronounced crack pattern and increase in deformation, there was a good indication of the following fatigue shear failure. The different shear crack pattern of T-beams (flexural shear crack) compared to beams with I-profile (diagonal shear cracks in the web) did not have a significant influence on the general shear fatigue behavior. With the ongoing damage process, a rearrangement of the truss model into a model with a direct compression strut was observed.
- As a result of the successive failure of the stirrups, the stress in the adjacent stirrups increased gradually. This concerns stress ranges as well as stresses under upper load.
- The approach, according to EC 2, for determining the strut angle for fatigue () overestimates the actual stress ranges of the stirrups in I- and T-beams measured in the tests, and consequently underestimates the number of cycles until fatigue failure.
- The improved proposal of θfat = θstat,EC2 [46] was implemented in the first amendment to the guideline for the assessment of existing concrete bridges in Germany [15] with I-shaped cross sections and a shear reinforcement ratio up to 0.35%. This allowed for a verification of the shear fatigue resistance or reduction in the strengthening measures in many cases [17,48]. Tests on I-beams with higher shear reinforcement ratios and the tests on prestressed T-Beams presented in this paper confirm that θstat = θfat is also reasonable for members with I- and T-cross sections with a shear reinforcement up to 0.67% [42,43].
6. Conclusions and Outlook
In order to investigate shear fatigue behavior of prestressed concrete beams with shear reinforcement, cyclic shear tests were carried out on 10 T-beams with web reinforcement at the Institute of Structural Concrete of RWTH Aachen University and were compared with the findings on I-beams of previous studies. The tests on T-beams with shear reinforcement indicated a similar distinct announcement of shear fatigue failure. Furthermore, the load cycles achieved were significantly higher than the load cycles expected by Eurocode 2. The findings of this study in combination with the previous studies [40,41,42,43] form a basis to improve the design approach for the shear fatigue of prestressed beams in the next generation of Eurocode 2 [49].
In order to extend this approach to very high shear reinforcement ratios with fatigue failure of the concrete struts, and especially to reinforced concrete beams without prestressing, additional experimental and theoretical investigations, are required.
Author Contributions
Conceptualization, J.H. and M.H.; investigation, M.H.; formal analysis, M.H.; data curation, M.H.; writing—original draft preparation, M.H.; writing—review and editing, J.H. and M.H.; visualization, M.H.; project administration, M.H. and J.H.; supervision, J.H.; funding acquisition, J.H. Both authors have read and agreed to the published version of the manuscript.
Funding
The presented studies were funded by the German Research Foundation (DFG, reference HE 2637/25 1). The authors express their thanks to the DFG.
Conflicts of Interest
The authors declare no conflict of interest. The funders had no role in the design of the study; in the collection, analyses, or interpretation of data; in the writing of the manuscript, and in the decision to publish the results.
References
- Naumann, J. Brücken und Schwerverkehr-Eine Bestandsaufnahme. Bauingenieur 2010, 85, 1–9. [Google Scholar]
- Grünberg, J.; Hansen, M.; Liebig, J.P. Ermüdungsbeanspruchungen von Betonbrücken unter zunehmendem Schwerverkehr. Beton- und Stahlbetonbau 2007, 102, 596–606. [Google Scholar] [CrossRef]
- Schellenberg, K.; Vogel, T.; Chèvre, M.; Alvarez, M. Assessment of Bridges on the Swiss National Roads. Struct. Eng. Int. 2013, 23, 402–410. [Google Scholar] [CrossRef]
- Lantsoght, E.O.L.; Van Der Veen, C.; Walraven, J.; De Boer, A. Recommendations for the Shear Assessment of Reinforced Concrete Slab Bridges from Experiments. Struct. Eng. Int. 2013, 23, 418–426. [Google Scholar] [CrossRef] [Green Version]
- Hegger, J.; Karakas, A.; Pelke, E.; Schölch, U. Zur Querkraftgefährdung bestehender Spannbetonbrücken. Beton- und Stahlbetonbau 2009, 104, 737–746. [Google Scholar] [CrossRef]
- Deutsches Institut für Normung e.V. Eurocode 2: Bemessung und Konstruktion von Stahlbeton-und Spannbetontragwerken-Teil 1-1: Allgemeine Bemessungsregeln und Regeln für den Hochbau. Deutsche Fassung EN 1992-1-1:2004 + AC: 2010; (DIN EN 1992-1-1:2011-01); Beuth: Berlin, Germany, 2011. [Google Scholar]
- Deutsches Institut für Normung e.V. Nationaler Anhang-National festgelegte Parameter-Eurocode 2: Bemessung und Konstruktion von Stahlbeton- und Spannbetontragwerken-Teil 1-1: Allgemeine Bemessungsregeln und Regeln für den Hochbau; (DIN EN 1992-1-1/NA:2013-04); Beuth: Berlin, Germany, 2013. [Google Scholar]
- Deutsches Institut für Normung e.V. Eurocode 2: Bemessung und Konstruktion von Stahlbeton- und Spannbetontragwerken-Teil 2: Betonbrücken-Bemessungs- und Konstruktionsregeln. Deutsche Fassung EN 1992-2:2005 + AC: 2008; (DIN EN 1992-2:2010-12); Beuth: Berlin, Germany, 2010. [Google Scholar]
- Deutsches Institut für Normung e.V. Nationaler Anhang-National festgelegte Parameter-Eurocode 2: Bemessung und Konstruktion von Stahlbeton- und Spannbetontragwerken-Teil 2: Betonbrücken – Bemessungs- und Konstruktionsregeln; (DIN EN 1992-2/NA:2013-04); Beuth: Berlin, Germany, 2013. [Google Scholar]
- Deutsches Institut für Normung e.V. Spannbeton. Richtlinie für Bemessung und Ausführung; (DIN 4227); Beuth: Berlin, Germany, 1953. [Google Scholar]
- Bundesministerium für Verkehr. Zusätzliche Bestimmungen zu DIN 4227 für Brücken aus Spannbeton; (Richtlinie); Bundesministerium für Verkehr: Berlin, Germany, 1969.
- Deutsches Institut für Normung e.V. DIN-Fachbericht 102-Betonbrücken. Ausgabe März 2003; (Fachbericht 102:2003-03); Beuth: Berlin, Germany, 2003. [Google Scholar]
- Deutsches Institut für Normung e.V. Eurocode 2: Planung von Stahlbeton- und Spannbetontragwerken-Teil 2: Betonbrücken. Deutsche Fassung EN 1992-2:1996; (DIN EN 1992-2:1997-10); Beuth: Berlin, Germany, 1997. [Google Scholar]
- Bundesministerium für Verkehr, Bau und Stadtentwicklung Abteilung Straßenbau. Richtlinie zur Nachrechnung von Straßenbrücken im Bestand. Nachrechnungsrichtlinie; BMVBS: Bonn, Germany, 2011.
- Bundesministerium für Verkehr und digitale Infrastruktur Abteilung Straßenbau. Richtlinie zur Nachrechnung von Straßenbrücken im Bestand 1. Ergänzung. Nachrechnungsrichtlinie; BMVI: Bonn, Germany, 2015.
- Marzahn, G.; Hegger, J.; Maurer, R.; Zilch, K.; Dunkelberg, D.; Kolodziejczyk, A.; Teworte, F. Die Nachrechnung von Betonbrücken-Fortschreibung der Nachrechnungsrichtlinie. In BetonKalender 2015; Bergmeister, E.K., Fingerloos, F., Wörner, J.-D., Eds.; Wiley-VCH Verlag GmbH: Weinheim, Germany, 2014; pp. 819–904. ISBN 9783433603406. [Google Scholar]
- Teworte, F.; Hegger, J.; Herbrand, M. Structural Assessment of Concrete Bridges in Germany—Shear Resistance under Static and Fatigue Loading. Struct. Eng. Int. 2015, 25, 266–274. [Google Scholar] [CrossRef]
- Herbrand, M.; Kueres, D.; Claßen, M.; Hegger, J. Einheitliches Querkraftmodell zur Bemessung von Stahl- und Spannbetonbrücken im Bestand. Beton- und Stahlbetonbau 2016, 111, 58–67. [Google Scholar] [CrossRef]
- Herbrand, M. Shear Strength Models for Reinforced and Prestressed Concrete Members. Ph.D. Thesis, RWTH Aachen University, Aachen, Germany, 2017. [Google Scholar]
- Hegger, J.; Maurer, R.; Fischer, O.; Zilch, K. Beurteilung der Querkraft- und Torsionstragfähigkeit von Brücken im Bestand-Erweiterte Bemessungsansätze; Bundesanstalt für Straßenwesen: Bergisch Gladbach, Germany, 2018. [Google Scholar]
- Herbrand, M.; Adam, V.; Hegger, J. Shear Tests on Prestressed Concrete Continuous Beams. In Advances in Concrete Bridges: Design, Construction, Evaluation, and Rehabilitation; ACI Special Publication 333; Kim, Y.J., Myers, J.J., Nanni, A., Eds.; American Concrete Institute: Salt Lake City, UT, USA, 2019; pp. 119–135. ISBN 978-1-64195-078-7. [Google Scholar]
- Gehrlein, S.F.; Fischer, O. Full-scale shear capacity testing of an existing prestressed concrete bridge. Civ. Eng. Des. 2019, 1, 64–73. [Google Scholar] [CrossRef]
- Hegger, J.; Adam, V.; Teworte, F.; Kerkeni, N. Erweiterung der Nachrechnungsrichtlinie für Massivbrücken. In Brückenbau im Fokus; Ingenieurkammer-Bau NRW, Ed.; Ingenieurkammer-Bau NRW: Dusseldorf, Germany, 2019; pp. 53–77. [Google Scholar]
- Fédération Internationale du Béton. Fib Model Code for Concrete Structures 2010; Ernst & Sohn: Berlin, Germany, 2013. [Google Scholar]
- Marcheggiani, L.; Clementi, F.; Formisano, A. Static and dynamic testing of highway bridges: A best practice example. J. Civ. Struct. Health Monit. 2019, 10, 43–56. [Google Scholar] [CrossRef]
- Hansen, M. Determination and assessment of fatigue stresses on concrete bridges. Struct. Concr. 2020. [Google Scholar] [CrossRef]
- Suryanto, B.; Staniforth, G. Monitoring the Shear Fatigue Response of Reinforced Concrete Beams Subjected to Moving Loads using Digital Image Correlation. Civ. Eng. Dimens. 2019, 21, 6–12. [Google Scholar] [CrossRef]
- Suryanto, B.; Staniforth, G.; Kim, J.; Gebreyouhannes, E.; Chijiwa, N.; Fujiyama, C.; Woodward, P.K. Investigating the Mechanism of Shear Fatigue in Reinforced Concrete Beams subjected to Pulsating and Moving Loads using Digital Image Correlation. MATEC Web Conf. 2019, 258, 03015. [Google Scholar] [CrossRef] [Green Version]
- Cladera, A.; Ribas, C.; Oller, E.; Marí, A. Application of the Compression Chord Capacity Model to predict the fatigue shear strength of reinforced concrete members without stirrups. In CMMoST 2019: 5th International Conference on Mechanical Models in Structural Engineering; Editorial Club Universitario, Ed.; Editorial Club Universitario: San Vicente, Alicante, 2019; pp. 95–102. [Google Scholar]
- Classen, M. Shear Crack Propagation Theory (SCPT) – The mechanical solution to the riddle of shear in RC members without shear reinforcement. Eng. Struct. 2020, 210. [Google Scholar] [CrossRef]
- Banjara, N.K.; Ramanjaneyulu, K. Effect of Deficiencies on Fatigue Life of Reinforced Concrete Beams. ACI Struct. J. 2020, 117, 31–44. [Google Scholar] [CrossRef]
- Lantsoght, E.O.L.; Van Der Veen, C.; Koekkoek, R.; Sliedrecht, H. Fatigue Testing of Transversely Prestressed Concrete Decks. ACI Struct. J. 2019, 116, 143–154. [Google Scholar] [CrossRef] [Green Version]
- Lantsoght, E.O.L.; Koekkoek, R.; Van Der Veen, C.; Sliedrecht, H. Fatigue Assessment of Prestressed Concrete Slab-Between-Girder Bridges. Appl. Sci. 2019, 9, 2312. [Google Scholar] [CrossRef] [Green Version]
- Fathalla, E.; Tanaka, Y.; Maekawa, K. Effect of Crack Orientation on Fatigue Life of Reinforced Concrete Bridge Decks. Appl. Sci. 2019, 9, 1644. [Google Scholar] [CrossRef] [Green Version]
- Remitz, J.; Empelmann, M. Cyclic tensile tests on prestressing strands embedded in concrete. Mater. Struct. 2020, 53, 53. [Google Scholar] [CrossRef]
- Fischer, O. Prestressed Concrete Bridges in Germany – Overview of Current New Structures, Re-analysis and Research Activities to Preserve the Existing Infrastructure Network. Procedia Eng. 2016, 156, 103–108. [Google Scholar] [CrossRef] [Green Version]
- Fischer, O.; Müller, A.; Lechner, T.; Wild, M.; Kessner, K. Ergebnisse und Erkenntnisse zu durchgeführten Nachrechnungen von Betonbrücken in Deutschland. Beton- und Stahlbetonbau 2014, 109, 107–127. [Google Scholar] [CrossRef]
- Hegger, J.; Maurer, R.; Zilch, K.; Herbrand, M.; Kolodziejczyk, A.; Dunkelberg, D. Beurteilung der Querkrafttragfähigkeit des Längssystems von Spannbetonbrücken im Bestand. Bauingenieur 2014, 89, 500–510. [Google Scholar]
- Teworte, F.; Hegger, J. Querkraftermüdung von Spannbetonträgern ohne Querkraftbewehrung. Beton- und Stahlbetonbau 2013, 108, 34–46. [Google Scholar] [CrossRef]
- Teworte, F.; Hegger, J. Ermüdung von Spannbetonträgern mit Bügelbewehrung unter Querkraftbeanspruchung. Beton- und Stahlbetonbau 2013, 108, 475–486. [Google Scholar] [CrossRef]
- Teworte, F.; Hegger, J. Shear fatigue of prestressed concrete beams-load-bearing behaviour and modified design approaches. In Towards a Rational Understanding of Shear in Beams and Slabs: Fib Bulletin 85: Workshop in Zurich, Switzerland September 2016; Bayrak, O., Fernández Ruiz, M., Kaufmann, W., Muttoni, A., Eds.; Fédération internationale du béton (fib): Lausanne, Switzerland, 2018; pp. 239–253. ISBN 978-2-88394-125-0. [Google Scholar] [CrossRef]
- Hillebrand, M.; Hegger, J. Ermüdungsversuche an profilierten Spannbetonträgern unter Querkraftbeanspruchung. Beton- und Stahlbetonbau 2019, 114, 565–574. [Google Scholar] [CrossRef]
- Hillebrand, M.; Teworte, F.; Hegger, J. Shear fatigue of prestressed I-beams with shear reinforcement. Struct. Concr. 2020. [Google Scholar] [CrossRef]
- Stahlwerk Annahütte Max Aicher GmbH & Co., KG. Allgemeine bauaufsichtliche Zulassung Z-12.5-96: Annahütte Ankerstabstahl St 900/1100 mit Gewinderippen; Deutsches Institut für Bautechnik: Berlin, Germany, 2015. [Google Scholar]
- Maurer, R.; Block, K.; Dreier, F. Ermüdungsfestigkeit von Betonstahl-Bestimmung mit dem Interaktiven Verfahren. Bauingenieur 2010, 85, 17–28. [Google Scholar]
- Teworte, F. Zum Querkrafttragverhalten von Spannbetonträgern unter Ermüdungsbeanspruchung. Ph.D. Thesis, RWTH Aachen University, Aachen, Germany, 2014. [Google Scholar]
- Hegger, J.; Sherif, A.; Gortz, S. Investigation of Pre- and Postcracking Shear Behavior of Prestressed Concrete Beams Using Innovative Measuring Techniques. ACI Struct. J. 2004, 101, 183–192. [Google Scholar] [CrossRef]
- Hegger, J.; Marzahn, G.; Teworte, F.; Herbrand, M. Zur Anwendung des Hauptzugspannungskriteriums bei der Nachrechnung bestehender Spannbetonbrücken. Beton- und Stahlbetonbau 2015, 110, 82–95. [Google Scholar] [CrossRef]
- CEN/TC 250/SC 2/WG 1. prEN 1992-1-1/2020-06: Eurocode 2: Design of Concrete Structures-Part 1-1: General Rules for Buildings, Bridges and Civil Engineering Structures; Fifth Draft by the Project Team SC2.T1; European Committee for Standardization: Brussels, Belgium, 2020; unpublished. [Google Scholar]
Figure 1.
Experimental test setups with typical crack patterns (a) series 1: I-beam; (b) series 2: T-beam.
Figure 1.
Experimental test setups with typical crack patterns (a) series 1: I-beam; (b) series 2: T-beam.

Figure 2.
(a) Cross-section with reinforcement and longitudinal section with reinforcement; (b) Test setup.
Figure 2.
(a) Cross-section with reinforcement and longitudinal section with reinforcement; (b) Test setup.

Figure 3.
Crack pattern in the web and upper flange after failure (test specimen T-33-2, first part of test).
Figure 3.
Crack pattern in the web and upper flange after failure (test specimen T-33-2, first part of test).

Figure 4.
Development of (a) deflection and (b) indication of crack width with increasing load cycles for test T-33-2a.
Figure 4.
Development of (a) deflection and (b) indication of crack width with increasing load cycles for test T-33-2a.

Figure 5.
Test T-33-2a: (a) Crack pattern after first part of testing in the shear span with strain gauges on stirrups, documented locations of stirrup fatigue failures and number of broken legs; (b,c) Stirrup stresses under maximum force for stirrups S1 to S4 and S5 to S8, respectively.
Figure 5.
Test T-33-2a: (a) Crack pattern after first part of testing in the shear span with strain gauges on stirrups, documented locations of stirrup fatigue failures and number of broken legs; (b,c) Stirrup stresses under maximum force for stirrups S1 to S4 and S5 to S8, respectively.

Figure 6.
Final crack patterns of all T-Beams (black: cracks at the end of first part; green: cracks at the end of second part; red: cracks from test of residual static shear strength).
Figure 6.
Final crack patterns of all T-Beams (black: cracks at the end of first part; green: cracks at the end of second part; red: cracks from test of residual static shear strength).

Figure 7.
Resisted number of cycles until fatigue failure Ntest of the shear reinforcement.

Figure 8.
(a) Truss model for beams with shear reinforcement; (b) Characteristic S–N curve for reinforcing steel (both according to [8,9]).

Figure 9.
Ratio of the experimental and calculated number of cycles until fatigue failure based on strut inclination, according to Equation (3) and the S–N curve according to (a) DIN EN 1992 1-1/NA [7] and (b) Maurer et al. [45].

Figure 10.
Procedure to determine the strut angle for fatigue according to [46], exemplary for beam T-33-2, stirrup S4.
Figure 10.
Procedure to determine the strut angle for fatigue according to [46], exemplary for beam T-33-2, stirrup S4.

Figure 11.
(a) Recalculated strut angle for test specimen T-33-2; (b) Recalculated strut angles of all T-beams tested.
Figure 11.
(a) Recalculated strut angle for test specimen T-33-2; (b) Recalculated strut angles of all T-beams tested.

Figure 12.
(a) Comparison of experimentally determined strut angles θexp,mean with θfat. (b) Ratio Ntest/Ncalc applying the strut inclination of Equation (6) and the S–N curve according to [45].
Figure 12.
(a) Comparison of experimentally determined strut angles θexp,mean with θfat. (b) Ratio Ntest/Ncalc applying the strut inclination of Equation (6) and the S–N curve according to [45].


Table 1.
Shear reinforcement ratio, properties steel reinforcement (mean values), prestressing forces.
Table 1.
Shear reinforcement ratio, properties steel reinforcement (mean values), prestressing forces.
| Beam No. | ρw | fym | ftm | Es Modulus | Pm |
|---|---|---|---|---|---|
| (%) | (N/mm2) | (N/mm2) | (N/mm2) | (kN) | |
| T-22-1 | 0.22 | 524 | 625 | 197,330 | 330 |
| T-22-2 | 330 | ||||
| T-33-1 | 0.33 | 524 | 625 | 197,330 | 330 |
| T-33-2 | 330 | ||||
| T-33-3 | 330 | ||||
| T-33-4 | 330 | ||||
| T-67-1 | 0.67 | 524 | 625 | 197,330 | 500 |
| T-67-2 | 500 | ||||
| T-67-3 | 500 | ||||
| T-67-4 | 500 |
ρw = asw/bw; fym: mean yield strength of stirrups; ftm: mean tensile strength of stirrups; Pm: mean value of prestressing force.
Table 2.
Concrete strength (mean values), load combinations, load cycles, and failure types.
| Beam No. | Age | fcm,cyl | fctm,sp | Ec Modulus | Vmax | Vmin | Cycles Ni | Σ Ni | Status of Test |
|---|---|---|---|---|---|---|---|---|---|
| (day) | (N/mm2) | (N/mm2) | (N/mm2) | (kN) | (kN) | (∙103) | (∙103) | ||
| T-22-1a | 26 (S) | 42.9 | 3 | 25,900 | 217 | - | 0.001 | 0.001 | initial crack |
| - | - | - | - | 238.7 | 98.8 | 7,396 | 7,396 | stopped | |
| 62 (E) | 44.6 | 3.6 | 25,900 | 617 | - | 0.001 | 7,396 | residual | |
| T-22-2a | 42 (S) | 41.3 | 2.9 | 25,600 | 192.2 | - | 0.001 | 0.001 | initial crack |
| - | - | - | - | 238.7 | 63.7 | 1,496 | 1,496 | cyclic fail. | |
| T-22-2b | 69 (E) | 41 | 3.1 | 25,100 | 238.7 | 63.7 | 1,697 | 3,193 | cyclic fail. |
| T-33-1a | 65 (S) | 46.6 | 3.6 | 28,500 | 197.5 | - | 0.001 | 0.001 | initial crack |
| - | - | - | - | 238.9 | 55.1 | 4,300 | 4,300 | no failure | |
| 111 (E) | 47.5 | 3.3 | - | 282.2 | 98.4 | 2,075 | 6,375 | cyclic fail. | |
| T-33-2a | 53 (S) | 45.2 | 3.7 | 26,700 | 202.2 | - | 0.001 | 0.001 | initial crack |
| - | - | - | - | 282.1 | 53.3 | 1,071 | 1,071 | cyclic fail. | |
| T-33-2b | 67 (E) | 45 | 3.5 | 26,800 | 282.1 | 53.3 | 301 | 1,372 | cyclic fail. |
| T-33-3a | 27 (S) | 43.8 | 3.2 | 26,300 | 232.2 | - | 0.001 | 0.001 | initial crack |
| - | - | - | - | 355.7 | 171.9 | 1,291 | 1,291 | no failure | |
| T-33-3b | 47 (E) | 45.8 | 3.4 | 26,800 | 355.7 | 171.9 | 618 | 1,909 | cyclic fail. |
| T-33-4a | 14 (S) | 43.9 | 3.1 | 27,600 | 217.2 | - | 0.001 | 0.001 | initial crack |
| 31 (E) | 44.3 | 3.4 | 27,600 | 327.2 | 98.4 | 1,863 | 1,863 | cyclic fail. | |
| T-67-1a | 18 (S) | 45.5 | 3.6 | 26,800 | 252.2 | - | 0.001 | 0.001 | initial crack |
| 68 (E) | - | 3 | - | 378.2 | 73.7 | 3,112 | 3,112 | cyclic fail. | |
| T-67-2a | 50 (S) | 41.9 | 3.7 | 26,200 | 252.2 | - | 0.001 | 0.001 | initial crack |
| 77 (E) | - | - | - | 429.7 | 124.7 | 2,032 | 2,032 | cyclic fail. | |
| T-67-3a | 14 (S) | 39.8 | 3.3 | 25,600 | 227.7 | - | 0.001 | 0.001 | initial crack |
| 34 (E) | 42.7 | 3.7 | 26,500 | 429.7 | 49.6 | 1,191 | 1,191 | cyclic fail. | |
| T-67-4a | 19 (S) | 32.4 | 2.8 | 22,100 | 267.2 | - | 0.001 | 0.001 | initial crack |
| 29 (E) | 35.2 | - | 23,200 | 482.2 | 102.1 | 0,747 | 0,747 | cyclic fail. |
fcm,cyl = Mean value of concrete cylinder compressive strength; fctm,sp = Mean splitting tensile strength of concrete; Vmax = upper cyclic shear force; Vmin = lower cyclic shear force; cycles Ni = number of load cycles of this test phase; Σ Ni = Sum of load cycles up to this phase; (S) = test start; (E) = test end; initial crack = initial shear cracks due to static preloading; no failure = no shear failure of beam; stopped = stop of cyclic load; cyclic fail = cyclic shear failure; residual = residual static shear strength.
© 2020 by the authors. Licensee MDPI, Basel, Switzerland. This article is an open access article distributed under the terms and conditions of the Creative Commons Attribution (CC BY) license (http://creativecommons.org/licenses/by/4.0/).
Share and Cite
MDPI and ACS Style
Hillebrand, M.; Hegger, J. Fatigue Testing of Shear Reinforcement in Prestressed Concrete T-Beams of Bridges. Appl. Sci. 2020, 10, 5560. https://doi.org/10.3390/app10165560
AMA Style
Hillebrand M, Hegger J. Fatigue Testing of Shear Reinforcement in Prestressed Concrete T-Beams of Bridges. Applied Sciences. 2020; 10(16):5560. https://doi.org/10.3390/app10165560
Chicago/Turabian StyleHillebrand, Matthias, and Josef Hegger. 2020. "Fatigue Testing of Shear Reinforcement in Prestressed Concrete T-Beams of Bridges" Applied Sciences 10, no. 16: 5560. https://doi.org/10.3390/app10165560
Note that from the first issue of 2016, this journal uses article numbers instead of page numbers. See further details here.