Ionospheric Behavior of foF2 over Chinese EIA Region and Its Comparison with IRI-2016
by
Peng Zhu
1, 
Cong Xie
1,
Chunhua Jiang
2,*,
Guobin Yang
2,
Jing Liu
3,
Zhengqiang Li
4 and
Zhengyu Zhao
5 1
School of Information Science and Engineering, Hunan Institute of Science and Technology, Yueyang 414006, China
2
School of Electronic Information, Wuhan University, Wuhan 430072, China
3
Institute of Earthquake Science, China Earthquake Administration, Beijing 100036, China
4
Shanghai Aircraft Design and Research Institution, Shanghai 201210, China
5
Institute of Space Science and Applied Technology, Harbin Institute of Technology, Shenzhen 518055, China
*
Author to whom correspondence should be addressed.
Universe 2020, 6(8), 122; https://doi.org/10.3390/universe6080122
Submission received: 9 July 2020
/
Revised: 31 July 2020
/
Accepted: 10 August 2020
/
Published: 11 August 2020
(This article belongs to the Special Issue Space Weather)
Abstract
:The ionograms, which were recorded by the ionosonde located at Pu’er station (PUR, 22.7° N, 101.05° E, Dip Latitude 12.9° N) in the Southwest of China in the year of 2016, were used to study the ionospheric behavior of the ordinary critical frequency of the F2 layer (foF2) in the region of the northern equatorial ionization anomaly. To verify the performance of the International Reference Ionosphere (IRI) over the Southwest of China, a comparative study of the observed foF2 and the latest version of the International Reference Ionosphere (IRI-2016) was carried out. We found that the foF2 in equinox months is greater than summer and winter. Moreover, a higher frequency of the observed bite-out of foF2 in January and April than other months and the IRI-2016 cannot represent the bite-out of foF2 in diurnal variations. Compared to the observations at Pu’er Station, the IRI-2016 underestimated foF2 for most time of the year. The IRI with the International Radio Consultative Committee (CCIR) option overestimated foF2 is higher than that with the International Union of Radio Science (URSI) option. Furthermore, the normalized root mean square error of foF2 from the IRI-2016 with the CCIR option is less than that with the URSI.
1. Introduction
The ionosphere has a significant effect on the amplitude and phase of high frequency radio and satellite signals. To overcome the ionospheric effects on radio wave communication, studies of the ionosphere have become a hot topic. As the maximum of the electron density in the ionosphere appears in the F2 layer, this region is the most important for radio wave propagation. Therefore, the two most important parameters of the F2 layer, the ordinary critical frequency of the F2 layer (foF2), and the height of the maximum electron density in F2 layer (hmF2) are employed to study radio wave propagation in the ionosphere. Therefore, these two parameters are used to test the performance of the International Reference Ionosphere (IRI) over the Southwest of China and to verify the performance of the IRI in this region in this study.
As one of the most widely used global empirical models, the International Reference Ionosphere (IRI) was developed to represent global climatological ionospheric variations by the Committee on Space Research (COSPAR) and the International Union of Radio Science (URSI). The latest version of IRI is IRI-2016 (it can be accessed from https://ccmc.gsfc.nasa.gov/pub/modelweb/ionospheric/iri/iri2016/) [1]. The foF2 and hmF2 of the ionosphere can be calculated by the IRI with appropriate inputs. Therefore, many studies [2,3,4,5,6,7,8] carried out the comparison between them to test the performance of the IRI, which will help to improve the accuracy of the IRI in future work. Among those studies, Rao et al. [7] summarized comparative studies of observations and the IRI model from different sectors of the globe.
This study focuses on the diurnal and seasonal variations of the foF2 over the Chinese Equatorial Ionization Anomaly (EIA) region (Pu’er station, 22.7° N, 101.05° E, Dip Latitude 12.9° N) in the year of 2016. Since Pu’er station is a newly installed ionosonde station in the Chinese EIA region along the longitude of approximately 100° E, it can provide more data to carry out statistical studies of the ionosphere [9]. Therefore, a comparative study between the observations and the IRI model was performed to test the performance of the IRI model over the Southwest sector of China.
2. Data Set
Recently, a multifunctional High-Frequency radar, which is called Wuhan Ionospheric Sounding System (WISS) [10], was installed to monitor characteristics of the ionosphere at Pu’er in the Southwest of China. The ionosonde system implements vertical incidence ionospheric sounding continuously. In this study, the foF2 data were scaled manually by the ionoScaler [11] from ionograms recorded at Pu’er station in the year of 2016 to study ionospheric variations. The data resolution we used in this study is 30 min. For solar activity, the annual average value of F10.7 is 88.8 during the year of 2016. Therefore, this year (descending phase of solar cycle) is close to the low solar activity.
3. Results and Discussion
3.1. Magnetically Quiet Time Behavior
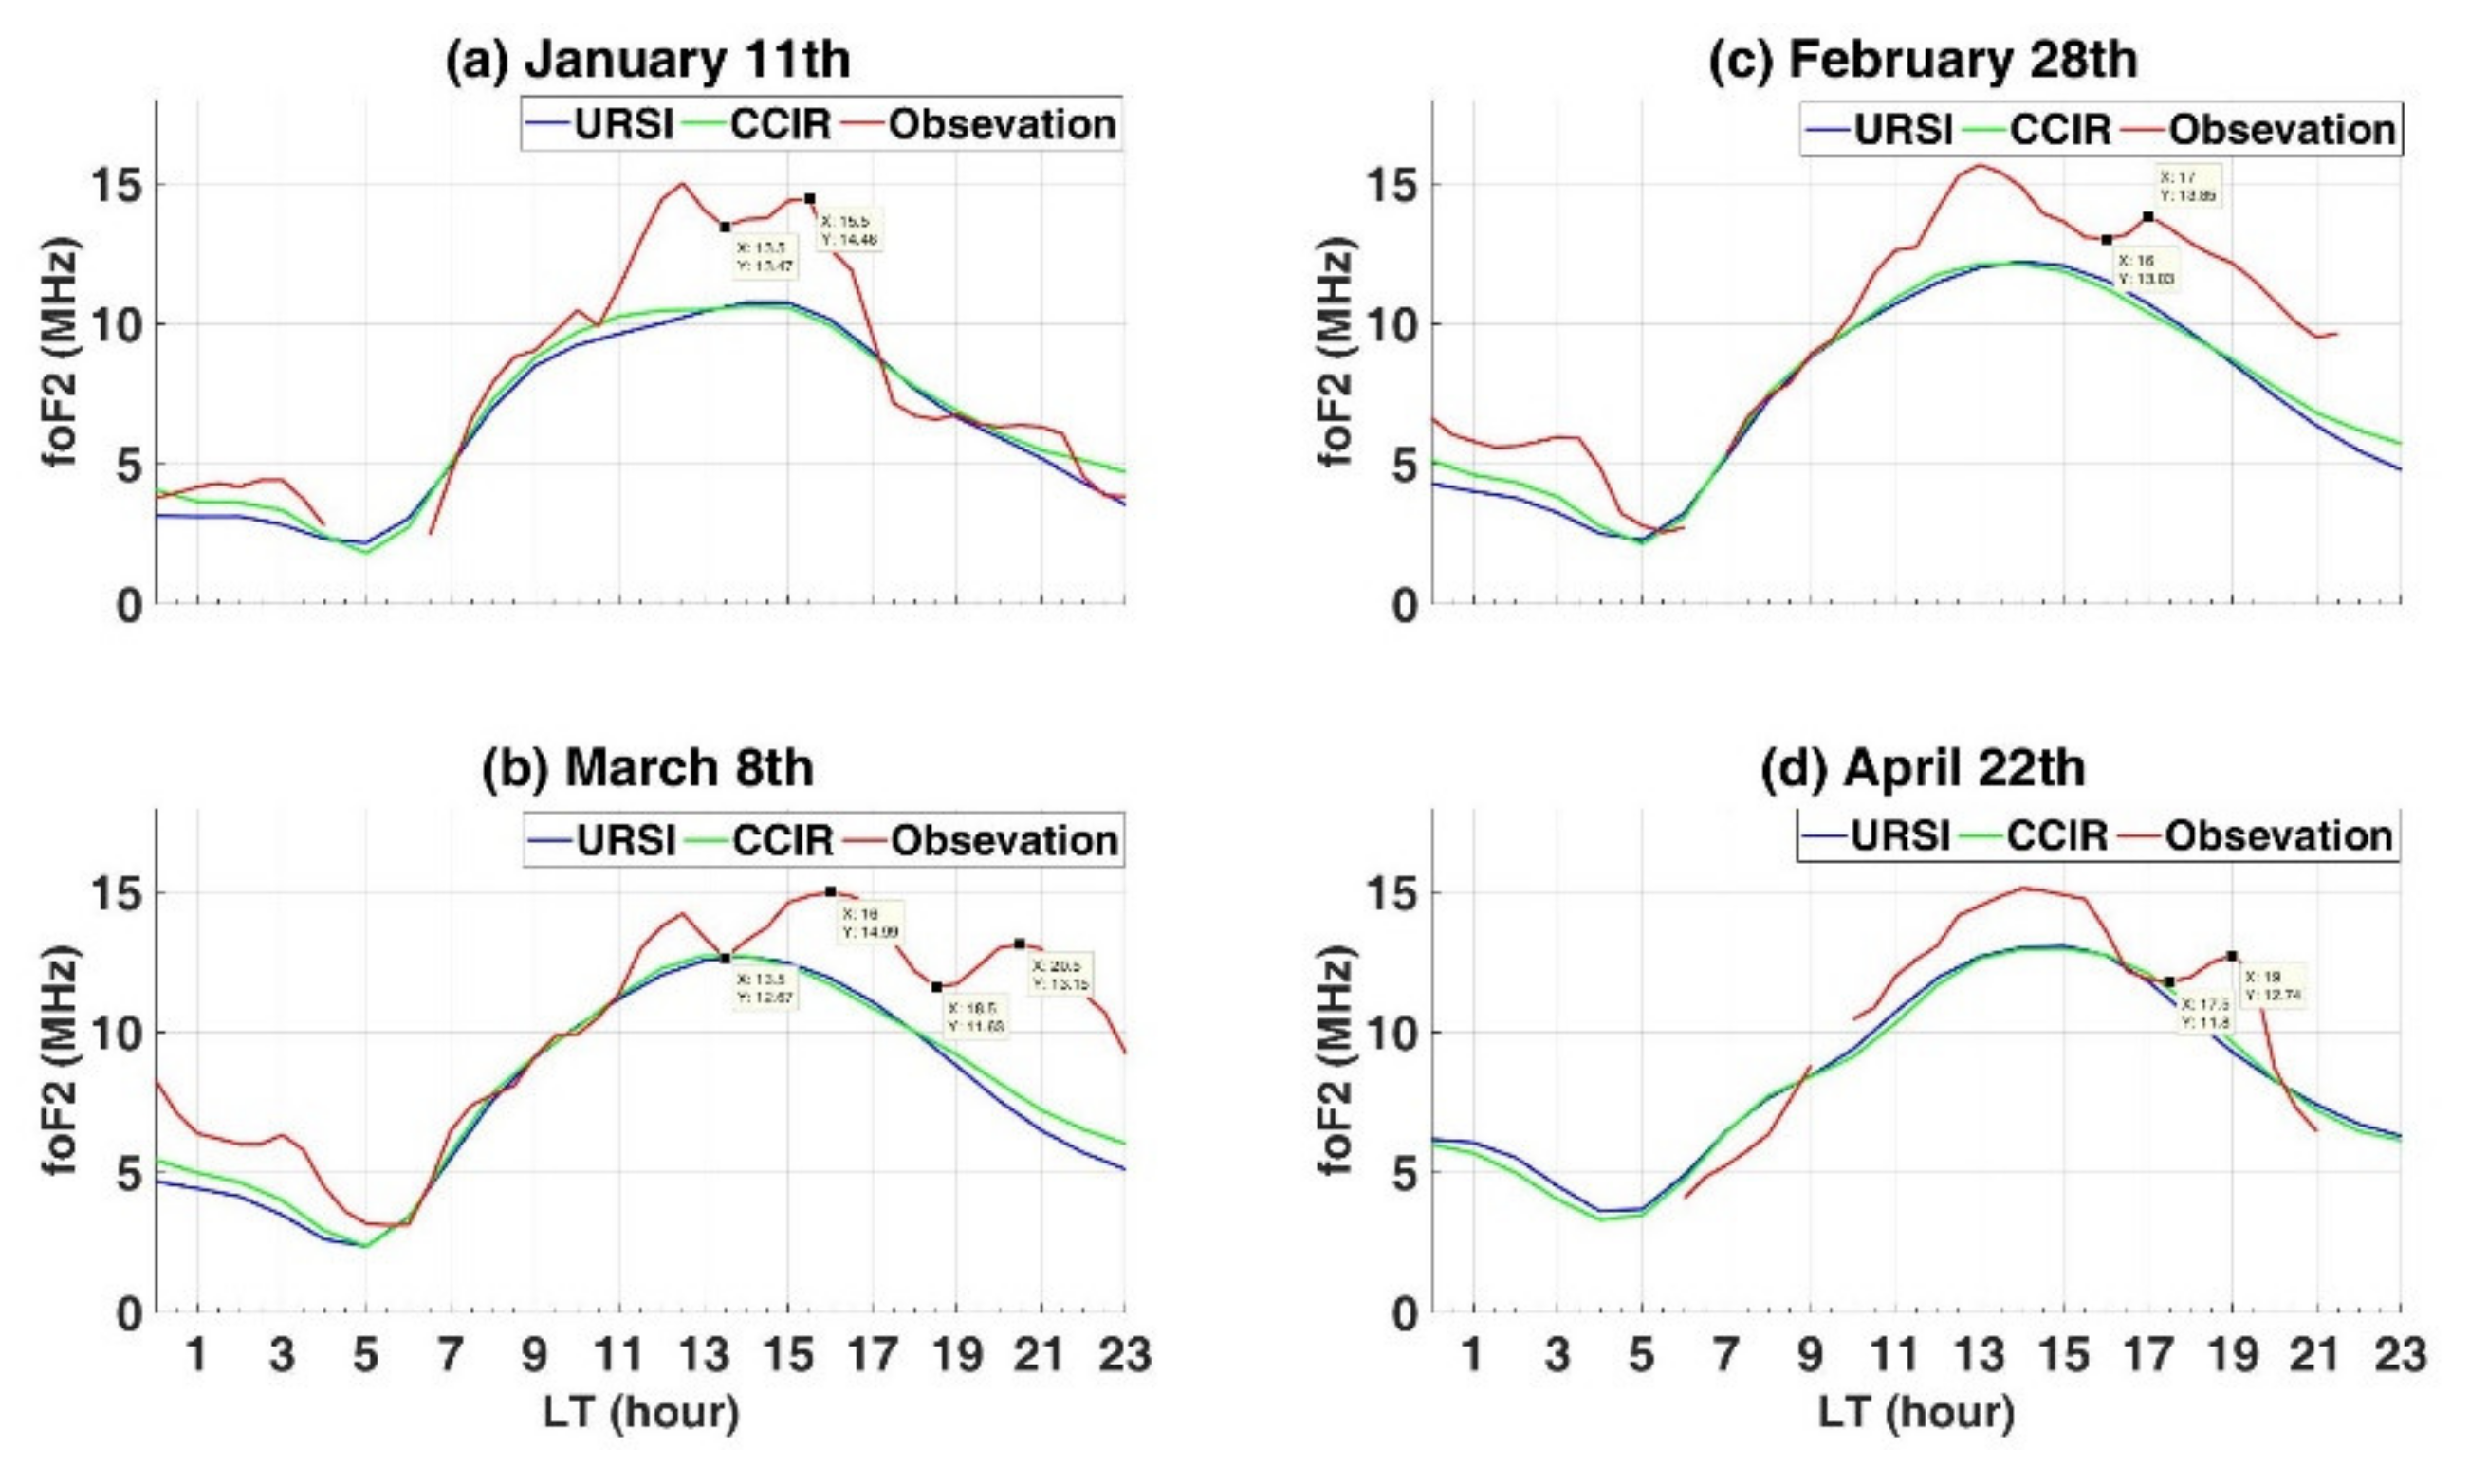
There are two options (URSI [12] and CCIR [13]) for evaluating foF2 in the IRI model and both of them are compared with the observed foF2 at Pu’er station. Figure 1a–c show the foF2 observed and calculated by the IRI with different options, respectively, as a function of day of year and local time (LT), in the year of 2016 at the Pu’er station. The blank spaces represent no data as the parameters have not been scaled by the ionoScaler. For the foF2 observed, it is shown that there is an evident semi-annual variation of the max of the foF2 every day. The foF2 in equinox months is greater than that in solstice months. Bite-outs in foF2 are a well-known ionospheric behavior and it is usually recognized that the maximum depression of foF2 is greater than 0.5 MHz [14]. For the diurnal variation of the foF2, the observed bite-out of foF2 appeared in January and April more frequently than other months. Figure 2 shows the bite-outs in foF2 that occurred on some days. It can be seen that the IRI cannot give the phenomenon. To give an explanation to the bite-out, Hirono and Maeda [15] and Rao [16] reported that the noontime bite-out occurred mainly located in two periods in Asia, one is in the forenoon and the other is in the afternoon. A forenoon bite-out is also reported by some studies [17,18] besides the noontime bite-out. Venkatesh et al. [19] studied noontime bite-outs of the Total Electron Content (TEC) and foF2 over India and Brazil at low latitudes (anomaly crest regions) and concluded that the mechanism of bite-outs around the crest related to some downward force that is different from that at the equator. However, Venkatesh et al. [19] did not specify what the downward force is. It needs further study to investigate the physical mechanism of the bite-out at low latitudes.
Figure 1d,e show the differences of the foF2 calculated by the IRI-2016 with URSI and CCIR options with the observations as a function of the day of year and local time (the foF2 observation minus the IRI-2016 values). It can be seen that the IRI-2016 with both URSI and CCIR mostly underestimated foF2, compared with the observations at Pu’er station.
To further reveal the difference between the observations and IRI-2016, the monthly average of foF2 was employed to make a comparative study. Figure 1f shows the contour plot of the monthly average (MA) of foF2 in the year 2016, as a function of local time and month. In summer, the diurnal peak value of foF2 mostly occurred at around 16:00 LT. It can also be seen from Figure 1f that the maximum value of foF2 in diurnal variation occurred more and more early from summer to winter.
Figure 1g,h show the monthly average of foF2 calculated by IRI with both options. They can also represent the semi-annual variation of foF2. For the diurnal variation of foF2, the normalized differences of the monthly averages of foF2 are calculated by
As shown in Figure 1i,j, they illustrate that the IRI-2016 underestimated the foF2 from the afternoon to mid-night period. The different value is much less during the pre-sunrise and morning period than the afternoon period. For the seasonal variation of foF2, the different value is much greater in equinox months than the solstice months. Figure 1i,h also shows that the minimum difference between the observations and IRI-2016 occurred in summer.
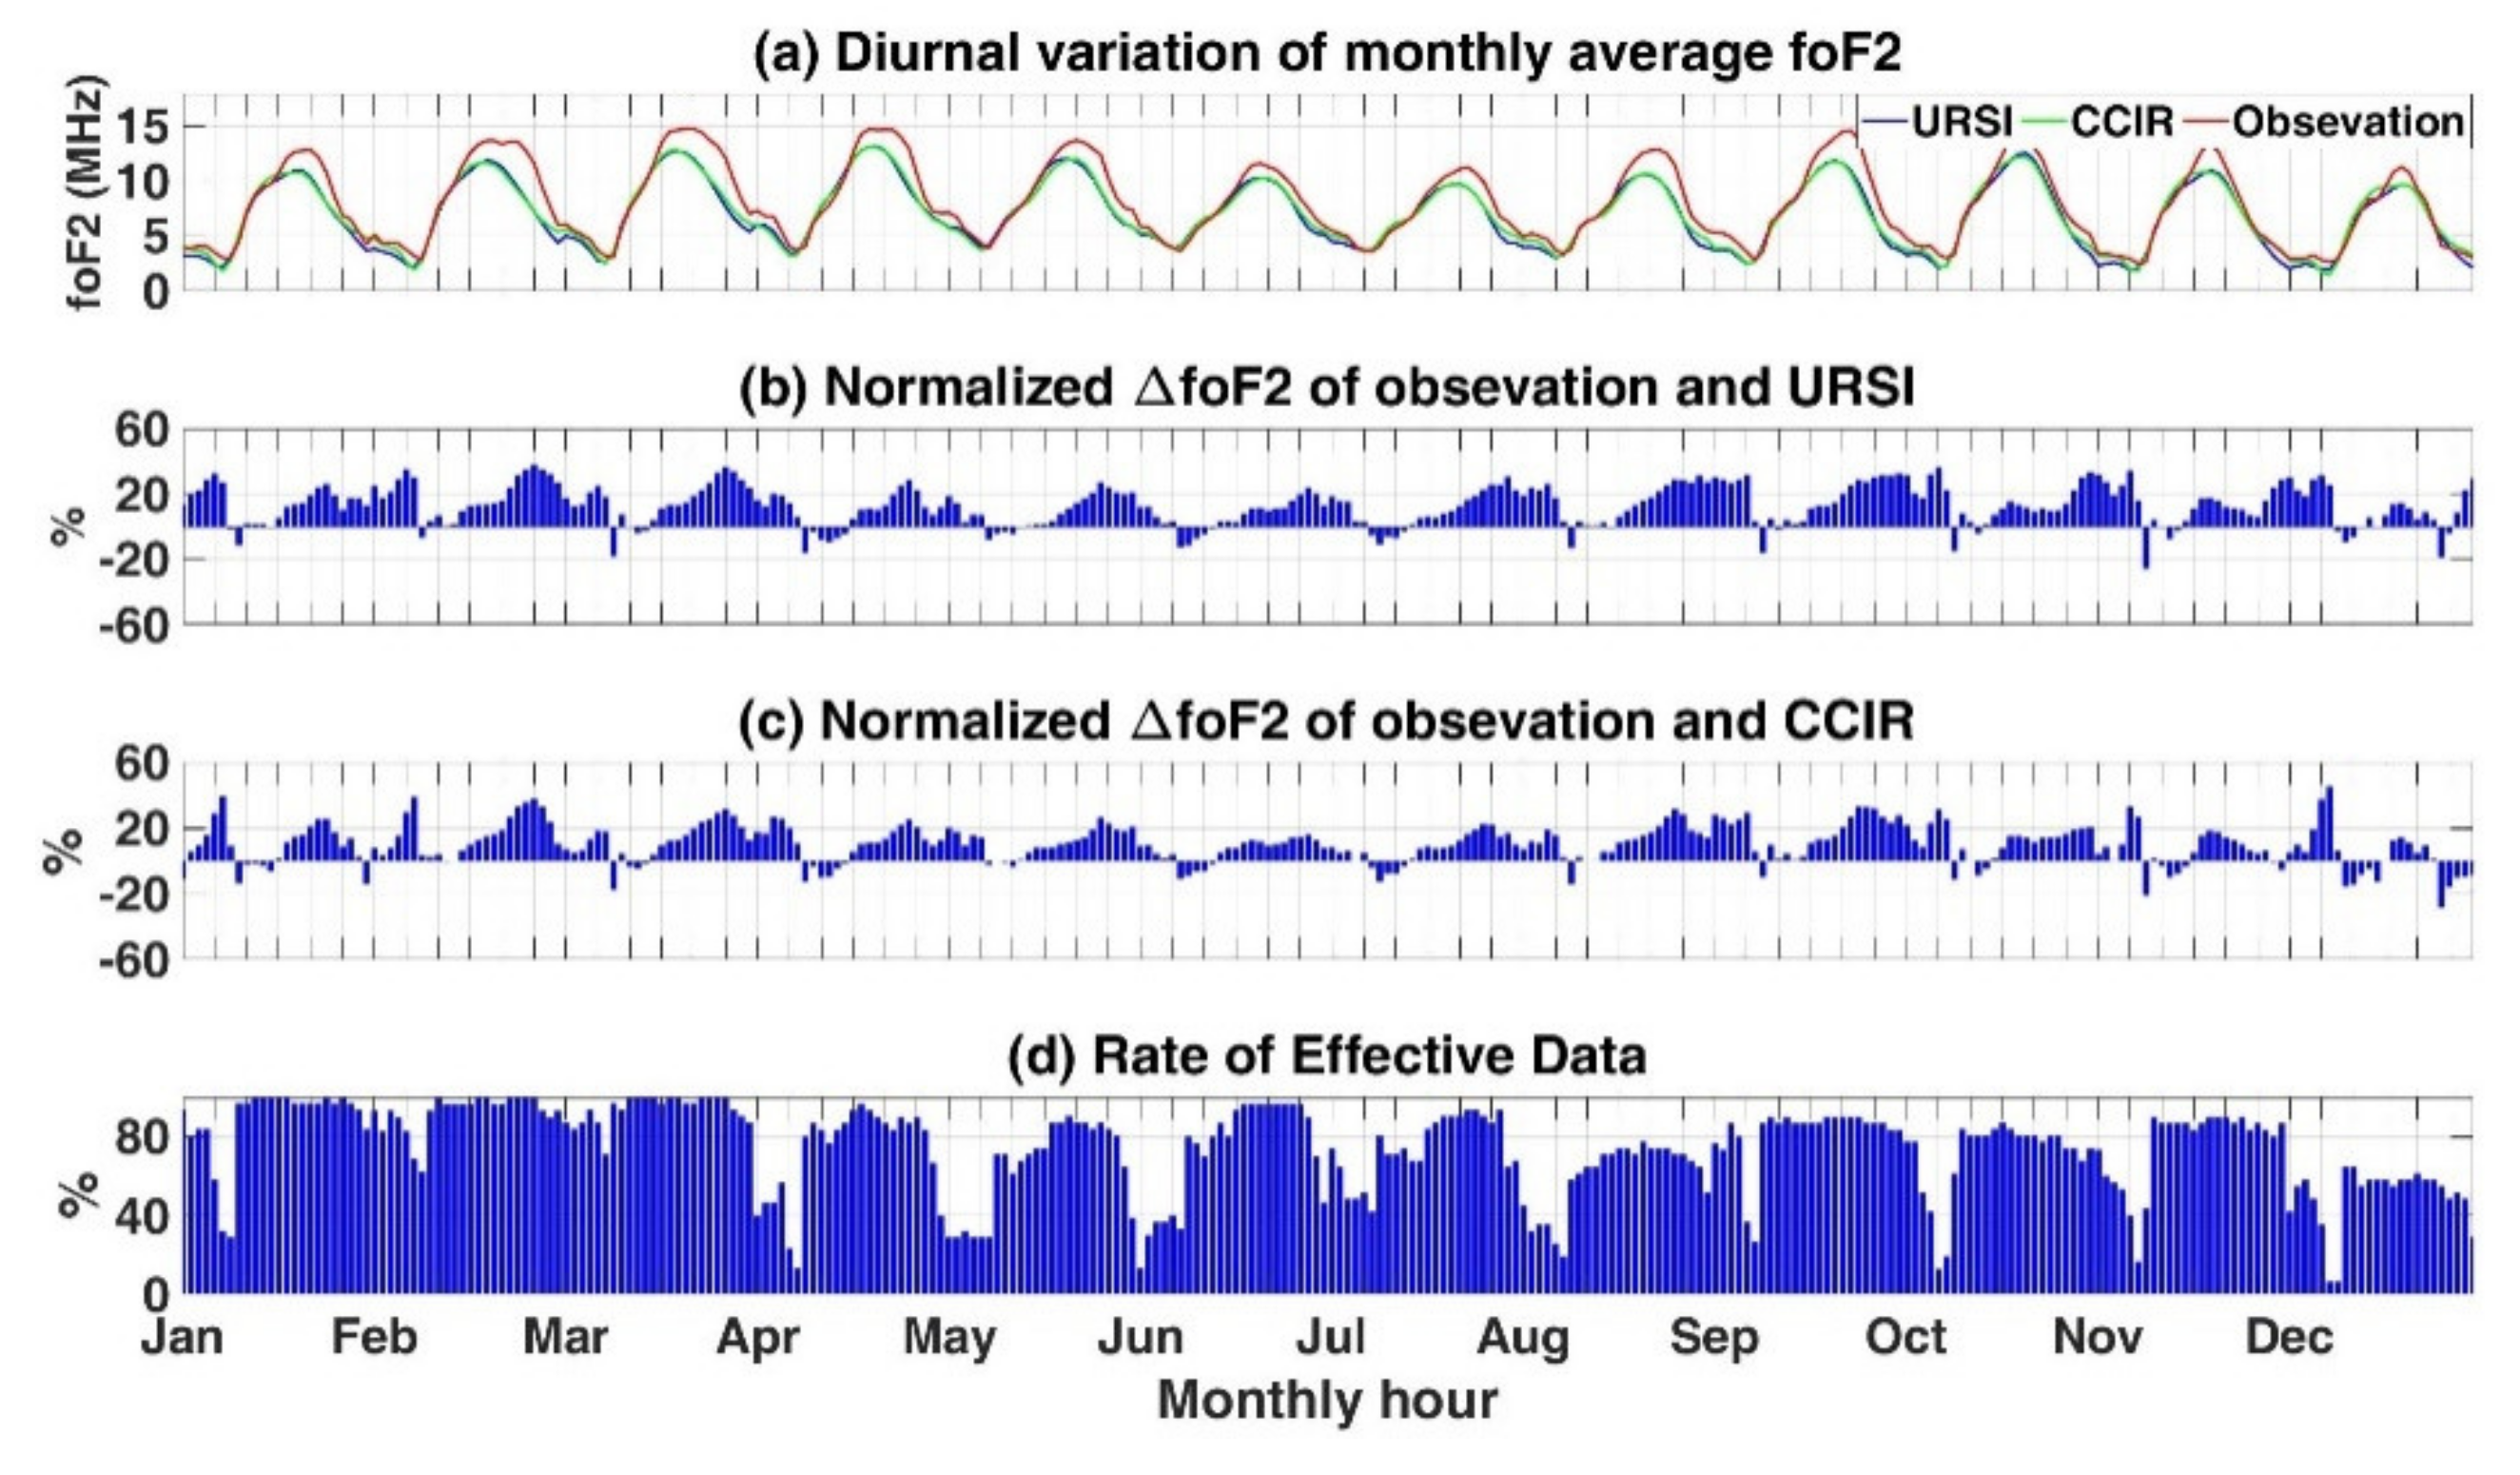
The diurnal variation of the monthly average of the foF2 from the observation and IRI-2016 along with their discrepancies, are presented in Figure 3. Figure 3a illustrates that the IRI-2016 with both URSI and CCIR options underestimated the foF2 at most times of the year in 2016. It should be noted that the monthly average of foF2 is the lowest in November for the observations and in December for IRI-2016. As shown in Figure 3b,c, the rate of the normalized calculated by the IRI with CCIR overestimated foF2 is higher than that with URSI in December. However, it needs more validation since the valid data in December are less than the other months.
In order to compare the performance between the URSI and CCIR options in the IRI-2016, the Normalized Root Mean Square Error (NRMSE) of the foF2 from observations and the IRI-2016 were calculated by all the data in the year of 2016 at one-hour resolution. The NRMSE is defined as follows,
The Normalized Root Mean Square Errors (NRMSEs) of the URSI and CCIR in foF2 are 0.2698 and 0.1147, respectively. The results show that the performance of the IRI-2016 with the URSI is better than that with the CCIR in our study. We also computed the mean of residuals, standard deviations and correlation coefficients between the observations and IRI-2016. As shown in Table 1, the monthly average with both options are almost the same for the correlation coefficients. However, IRI with URSI is better than that with CCIR for 1-h resolution. For both data resolution, the IRI-2016 with the CCIR option has a smaller standard deviation than that with the URSI. So as the mean of residuals, IRI-2016 with URSI is better than that with CCIR. Thus, the IRI-2016 with the URSI performed a little better than the CCIR in prediction of the foF2 since the URSI option is a little better than the CCIR.
3.2. Magnetically Disturbed Period
Geomagnetic storms are disturbances in Earth’s magnetic field which occur when a coronal mass ejection or a high-speed solar wind sweeps past the Earth. It can result in many hours of vibrant auroras at high, middle, and lower latitudes. When the ionosphere is affected by the geomagnetic storm, an ionospheric storm occurs. So it is well known that the ionosphere can be affected by a geomagnetic storm through the thermosphere [20,21,22,23,24,25]. The variation of the foF2 can be used to analyse the ionospheric storm. Thus, in order to study variations of the foF2 during geomagnetic storms, a magnetic storm that occurred on 11th October, 2016 was considered in this study. The measure of the disturbance was computed by
where the refers to the monthly median of the foF2.
In this study, we consider that it is a quiet ionosphere when the variability of established within , and it indicates the positive and negative storm effect with that ranges above 20% and below −20%, respectively, in the ionosphere [26,27]. Figure 4a–c shows the variation of the Disturbance Storm Time (Dst) index, and foF2 from 11th October to 20th October, respectively. At about 15:00 LT on 13th October which indicates the start of the storm’s main phase, the Dst began to decrease steadily reaching a value of -103 nT at around 2:00 LT on 14th October. During the recovery phase of this storm (15–16th October), there was a negative storm on October 15th since the was under −20%. Before that, the positive phase of occurred on 12–15th October and taking a significantly increasing in foF2 on 12th October. The foF2 is also calculated by the IRI with the foF2 STORM model [28,29]. However, neither of the IRI-2016 values with both the CCIR and URSI can represent the corresponding changes, as shown in Figure 4.
Recently, Rao et al. [7] carried out a comparative study between the IRI-2016 with ionospheric observations over another Chinese EIA station (Guangzhou, Geog. Lat. 23.10° N, Geog. Long. 113.40° E, dip, Lat. 13.49° N). In this study, Rao et al. [7] found that the IRI-2016 underestimated the foF2 in winter and equinoxes, and overestimated the foF2 in summer. However, the IRI-2016 almost underestimated foF2 values in the whole year of 2016 at Pu’er station in our study. For the temporal variation of the foF2, Rao et al. [7] found that the discrepancies were greater during the forenoon hours and smaller during the afternoon hours. However, it can be seen from Figure 1i,j that the greater discrepancies occurred in the afternoon hours at Pu’er station. All these results show that longitudinal variations of the ionosphere also have significant effects on the discrepancy between ionospheric observations and the IRI models.
Although a good agreement between ionospheric observations and the IRI models has been reported by many studies [7,30], its discrepancies cannot be ignored [7,31]. Especially, that electrical field and neutral winds play significant roles in the ionosphere over the equatorial and low latitudes. As a result, even the latest IRI model (e.g., the IRI-2016) also cannot remove these discrepancies with the ionospheric observations. To overcome this issue, a higher coverage of the ionosondes around the globe and the proposal of more practical physical models may be necessary for the IRI model.
4. Conclusions
In this study, we investigated the ionospheric behavior of foF2 at the northern equatorial ionization anomaly along the longitude of about 100° E and carried out a comparative study in foF2 between the observations and IRI-2016. The major findings are summarized as follows:
- (1)
- For seasonal variation, the foF2 in equinox months is greater than in solstice months. The average value of the foF2 in summer is the lowest value. However, the monthly average of the observed foF2 is the lowest in November, while it is in December for the IRI-2016.
- (2)
- Mostly, the IRI-2016 underestimated the foF2 compared with the observations in the present study. The IRI-2016 with the URSI performed a little better than the CCIR in prediction of the foF2.
- (3)
- The observed bite-out of foF2 in January and April occurred more frequently than other months and the IRI-2016 cannot represent the bite-out of foF2 in diurnal variations.
Author Contributions
Data curation, C.X.; Formal analysis; Funding acquisition, P.Z., C.X. and C.J.; Investigation, G.Y.; Project administration, Z.Z.; Resources, C.J., J.L. and Z.L.; Writing—original draft, P.Z. All authors have read and agreed to the published version of the manuscript.
Funding
This research was funded by the National Natural Science Foundation of China (NSFC 41604133), the China Postdoctoral Science Foundation funded project (2016 M592374), Hunan Provincial Natural Science Foundation of China (2018JJ3210,2018JJ2154), the Hunan Provincial Innovation Foundation for the Postgraduate under YCX2019A17.
Acknowledgments
The authors acknowledge the IRI project sponsored by the COSPAR and URSI and code is provided by the Community Coordinated Modeling Center (https://ccmc.gsfc.nasa.gov/pub/modelweb/ionospheric/iri/iri2016/). The authors also acknowledge the World Data Center for Geomagnetism, Kyoto for the Dst index (http://wdc.kugi.kyoto-u.ac.jp/dst_provisional/index.html) and the Institute of Earthquake Forecasting for providing ionosonde data. Data are available from Chunhua Jiang upon request ([email protected]).
Conflicts of Interest
The authors declare no conflict of interest.
References
- Bilitza, D.; Altadill, D.; Truhlik, V.; Shubin, V.; Galkin, I.; Reinisch, B.; Huang, X. International reference ionosphere 2016: From ionospheric climate to real-time weather predictions. Soc. Work 2017, 15, 418–429. [Google Scholar] [CrossRef]
- Batista, I.S.; Abdu, M.A. Ionospheric variability at Brazilian low and equatorial latitudes: Comparison between observations and IRI model. Adv. Space Res. 2004, 34, 1894–1900. [Google Scholar] [CrossRef]
- Zhang, M.L.; Shi, J.K.; Wang, X.; Wu, S.Z.; Zhang, S.R. Comparative study of ionospheric characteristic parameters obtained by DPS-4 digisonde with IRI2000 for low latitude station in China. Adv. Space Res. 2004, 33, 869–873. [Google Scholar] [CrossRef]
- Chuo, Y.J.; Lee, C.C. Ionospheric variability at taiwan low latitude station: Comparison between observations and IRI-2001 model. Adv. Space Res. 2008, 42, 673–681. [Google Scholar] [CrossRef]
- Yadav, S.; Dabas, R.S.; Das, R.M.; Upadhayaya, A.K.; Sharma, K.; Gwal, A.K. Diurnal and seasonal variation of F2-layer ionospheric parameters at equatorial ionization anomaly crest region and their comparison with IRI-2001. Adv. Space Res. 2010, 45, 361–367. [Google Scholar] [CrossRef]
- Zhao, X.; Ning, B.; Zhang, M.-L.; Hu, L. Comparison of the ionospheric F2 peak height between ionosonde measurements and IRI2016 predictions over China. Adv. Space Res. 2017, 60, 1524–1531. [Google Scholar] [CrossRef]
- Rao, S.S.; Chakraborty, M.; Pandey, R. Ionospheric variations over Chinese EIA region using foF2 and comparison with IRI-2016 model. Adv. Space Res. 2018, 62, 84–93. [Google Scholar] [CrossRef]
- Liu, Z.; Fang, H.; Weng, L.; Wang, S.; Niu, J.; Meng, X. A comparison of ionosonde measured foF2 and IRI-2016 predictions over China. Adv. Space Res. 2019, 63, 1926–1936. [Google Scholar] [CrossRef]
- Jiang, C.; Hu, H.; Yang, G.; Liu, J.; Zhao, Z. A statistical study of the F2 layer stratification at the northern equatorial ionization anomaly. Adv. Space Res. 2019, 63, 3167–3176. [Google Scholar] [CrossRef]
- Shi, S.; Yang, G.; Jiang, C.; Zhang, Y.; Zhao, Z. Wuhan ionospheric oblique backscattering sounding system and its applications—A review. Sensors 2017, 17, 1430. [Google Scholar] [CrossRef] [Green Version]
- Jiang, C.; Yang, G.; Zhou, Y.; Zhu, P.; Lan, T.; Zhao, Z.; Zhang, Y. Software for scaling and analysis of vertical incidence ionograms-ionoScaler. Adv. Space Res. 2017, 59, 968–979. [Google Scholar] [CrossRef]
- Rush, C.; Fox, M.; Bilitza, D.; Davies, K.; McNamara, L.; Stewart, F.; PoKempner, M. Ionospheric mapping: An update of foF2 coefficients. Telecommun. J. 1989, 56, 179–182. [Google Scholar]
- Joachim, M. Ccir atlas of ionospheric characteristics (ccir report 340). Telecommun. J. 1967, 34, 397–400. [Google Scholar]
- Majeed, T. A study of postnoon bite-out in foF2 at Karachi. Can. J. Phys. 1982, 60, 1176–1179. [Google Scholar] [CrossRef]
- Hirono, M.; Maeda, H. Geomagnetic distortion of the F2 region on the magnetic equator. J. Geophys. Res. 1955, 60, 241–255. [Google Scholar] [CrossRef]
- Rao, B.C.N. Some characteristic features of the equatorial ionosphere and the location of the F-region equator. J. Geophys. Res. 1963, 68, 2541–2549. [Google Scholar] [CrossRef]
- Yinn-Nien, H.; Bor-Shenn, J. On the forenoon bite-out in the critical frequency of the F2-layer. J. Atmos. Sol. Terr. Phys. 1978, 40, 581–584. [Google Scholar] [CrossRef]
- Zhang, S.-R.; Oliver, W.L.; Fukao, S.; Otsuka, Y. A study of the forenoon ionospheric F2 layer behavior over the middle and upper atmospheric radar. J. Geophys. Res. 2000, 105, 15823–15833. [Google Scholar] [CrossRef]
- Venkatesh, K.; Fagundes, P.R.; Abreu, A.J.d.; Pillat, V.G. Unusual noon-time bite-outs in the ionospheric electron density around the anomaly crest locations over the Indian and Brazilian sectors during quiet conditions—A case study. J. Atmo. Sol. Terr. Phys. 2016, 147, 126–137. [Google Scholar] [CrossRef]
- Fuller-Rowell, T.J.; Codrescu, M.V.; Rishbeth, H.; Moffett, R.J.; Quegan, S. On the seasonal response of the thermosphere and ionosphere to geomagnetic storms. J. Geophys. Res. 1996, 101, 2343–2353. [Google Scholar] [CrossRef]
- Lu, G.; Richmond, A.D.; Roble, R.G.; Emery, B.A. Coexistence of ionospheric positive and negative storm phases under northern winter conditions: A case study. J. Geophys. Res. 2001, 106, 24493–24504. [Google Scholar] [CrossRef]
- Li, Z.; Wei, F.; Feng, X.; Guo, J.; Emery, B.A.; Zhao, X. Large ionospheric disturbances during a minor geomagnetic storm on June 23, 2000. Ann. Geophys. 2012, 55, 253–263. [Google Scholar] [CrossRef]
- Danilov, A.D. Ionospheric F-region response to geomagnetic disturbances. Adv. Space Res. 2013, 52, 343–366. [Google Scholar] [CrossRef]
- Li, Z.; Knipp, D.J.; Wang, W. Understanding the behaviors of thermospheric nitric oxide cooling during the 15 May 2005 geomagnetic storm. J. Geophys. Res. 2019, 124, 2113–2126. [Google Scholar] [CrossRef]
- Jiang, C.; Wei, L.; Yang, G.; Aa, E.; Lan, T.; Liu, T.; Liu, J.; Zhao, Z. Large-scale ionospheric irregularities detected by ionosonde and GNSS receiver network. IEEE Geosci. Remote Sens. Lett. 2020, 1–4. [Google Scholar] [CrossRef]
- Buresova, D.; Lastovicka, J.; Hejda, P.; Bochnicek, J. Ionospheric disturbances under low solar activity conditions. Adv. Space Res. 2014, 54, 185–196. [Google Scholar] [CrossRef]
- Matamba, T.M.; Habarulema, J.B.; McKinnell, L.-A. Statistical analysis of the ionospheric response during geomagnetic storm conditions over South Africa using ionosonde and GPS data. Soc. Work 2015, 13, 536–547. [Google Scholar] [CrossRef]
- Araujo-Pradere, E.A.; Fuller-Rowell, T.J. STORM: An empirical storm-time ionospheric correction model 2. Validation. Radio Sci. 2002, 37, 4-1–4-14. [Google Scholar] [CrossRef]
- Araujo-Pradere, E.A.; Fuller-Rowell, T.J.; Codrescu, M.V. STORM: An empirical storm-time ionospheric correction model 1. Model description. Radio Sci. 2002, 37, 3-1–3-12. [Google Scholar] [CrossRef] [Green Version]
- Zhang, M.-L.; Shi, J.-K.; Wang, X.; Shang, S.-P.; Wu, S.-Z. Ionospheric behavior of the F2 peak parameters foF2 and hmF2 at Hainan and comparisons with IRI model predictions. Adv. Space Res. 2007, 39, 661–667. [Google Scholar] [CrossRef]
- Bilitza, D.; Brown, S.A.; Wang, M.Y.; Souza, J.R.; Roddy, P.A. Measurements and IRI model predictions during the recent solar minimum. J. Atmos. Sol. Terr. Phys. 2012, 86, 99–106. [Google Scholar] [CrossRef]
Figure 1.
(a) the observed foF2 (b) foF2 calculated by the International Reference Ionosphere (IRI) with CCIR option (c) foF2 calculated by IRI with International Union of Radio Science (URSI) option (d) the normalized deviation of the observed foF2 to that derived by IRI with CCIR (e) the normalized deviation of the observed foF2 to that derived by IRI with URSI (f) monthly average (MA) of the observed foF2 (g) monthly average of foF2 calculated by IRI with CCIR option (h) monthly average of foF2 calculated by IRI with URSI option (i) normalized deviation of monthly average observation foF2 to that derived by IRI with CCIR (j) normalized deviation of monthly average observation foF2 to that derived by IRI with URSI.

Figure 2.
The diurnal variations of foF2 in the days that bite-out occurred.

Figure 3.
Diurnal variation of the monthly average of foF2 from the IRI-2016 with the URSI and CCIR options and comparison of observed and modeled foF2.
Figure 3.
Diurnal variation of the monthly average of foF2 from the IRI-2016 with the URSI and CCIR options and comparison of observed and modeled foF2.

Figure 4.
Diurnal variation of foF2 from ionosonde observations, and the IRI-2016 with the URSI and CCIR options during a geomagnetic storm.
Figure 4.
Diurnal variation of foF2 from ionosonde observations, and the IRI-2016 with the URSI and CCIR options during a geomagnetic storm.


Table 1.
The standard deviation and correlation coefficient computed.
| foF2 Option | At 1-h Resolution | Monthly Average | ||
|---|---|---|---|---|
| IRI-2016 Option | URSI | CCIR | URSI | CCIR |
| Mean of residual (MHz) | −0.073 | 1.017 | −0.497 | −0.622 |
| Standard deviation (MHz) | 3.49 | 3.42 | 3.54 | 3.50 |
| Correlation coefficient | 0.996 | 0.885 | 0.914 | 0.921 |
© 2020 by the authors. Licensee MDPI, Basel, Switzerland. This article is an open access article distributed under the terms and conditions of the Creative Commons Attribution (CC BY) license (http://creativecommons.org/licenses/by/4.0/).
Share and Cite
MDPI and ACS Style
Zhu, P.; Xie, C.; Jiang, C.; Yang, G.; Liu, J.; Li, Z.; Zhao, Z. Ionospheric Behavior of foF2 over Chinese EIA Region and Its Comparison with IRI-2016. Universe 2020, 6, 122. https://doi.org/10.3390/universe6080122
AMA Style
Zhu P, Xie C, Jiang C, Yang G, Liu J, Li Z, Zhao Z. Ionospheric Behavior of foF2 over Chinese EIA Region and Its Comparison with IRI-2016. Universe. 2020; 6(8):122. https://doi.org/10.3390/universe6080122
Chicago/Turabian StyleZhu, Peng, Cong Xie, Chunhua Jiang, Guobin Yang, Jing Liu, Zhengqiang Li, and Zhengyu Zhao. 2020. "Ionospheric Behavior of foF2 over Chinese EIA Region and Its Comparison with IRI-2016" Universe 6, no. 8: 122. https://doi.org/10.3390/universe6080122
Note that from the first issue of 2016, this journal uses article numbers instead of page numbers. See further details here.