Analysis of a Mathematical Model. Opportunities for the Training of Food Engineering Students


1
Facultad de Química Farmacéutica, Universidad de Antioquia, Medellín 050010, Colombia
2
Facultad Nacional de Salud Pública, Universidad de Antioquia, Medellín 050010, Colombia
3
Facultad de Educación, Universidad de Antioquia, Medellín 050010, Colombia
*
Author to whom correspondence should be addressed.
Mathematics 2020, 8(8), 1339; https://doi.org/10.3390/math8081339
Submission received: 3 July 2020
/
Revised: 8 August 2020
/
Accepted: 10 August 2020
/
Published: 11 August 2020
(This article belongs to the Special Issue Mathematics Education in Science, Technology and Engineering: Exploring Research and Scholarship of the Student and Staff Experience)
Abstract
:International research has revealed different roles of mathematics in the practices of engineers and some implications of mathematics teaching for engineering students. Modeling and mathematical models have proven to be valuable tools for their professional work and for their teaching process. This study identifies opportunities offered by a process of analysis of a mathematical model in the training of engineers. For this analysis, an interpretation of mathematical models as an object–user–representation triad was used; mathematical models were also considered a pedagogical approach to mathematics teaching. Based on this approach, a qualitative study was developed. A teaching experiment was designed, in which, through a set of tasks, the analysis of a model describing the percentage of moisture removed in a radial airflow food dryer is considered. Results show that students evidenced a comprehension of the model function as a covariation relationship and implemented strategies for understanding it through the graphs in the model. The situated character of students’ reasoning and their experience with professional practices of engineers are also highlighted.
1. Introduction
International research highlights the need for future professionals to have experiences in which mathematics is linked to phenomena and situations of their professional field [1,2,3,4]. Romo-Vázquez [1] points out that the understanding of mathematics in professional environments is subject to its practical use; on the one hand, this happens since mathematics in more advanced dimensions tends more and more to be the charge of specialists or computer programs; on the other hand, because the needs of non-specialists seem to shift towards the ability to use mathematics as a communication tool among specific languages. According to Romo-Vázquez [1], this fact helps to explain why its role is under-recognized. Taking into account the professional practice of teachers, Romo-Vázquez [4] used mathematical modeling as a tool in a mathematics course for future teachers. They integrated key aspects of professional practice into the course, including the design of tasks, their adaptation to school contexts and the development of field experiences with students, along with reflection and feedback on the experience. Regarding professional training of engineers, Rendón-Mesa and colleagues [2] designed a strategy in which future professionals carried out projects related to their professional field; the experience developed in a multi-disciplinary context, including the use of professional situations, the problematization of student’s approaches and the interaction with experts.
The contributions of mathematical modeling to the professional training of engineers is an ongoing research topic in the international literature [1,5,6,7]. For Gainsburg [7], modeling is a central and ubiquitous activity in engineer professional work, leading to some of its greatest intellectual challenges. However, not all engineers get involved with the construction of models; sometimes, they just learn to use models or adapt them to diverse forms of representation and degrees of abstraction, interpreting and finding their meaning and plausibility in the real world. In this regard, engineers rarely create a new model; rather, they select a known standard model, with known solutions, and adapt or modify it slightly [1,8]. In this sense, educational research, in addition to accounting for ways to integrate modeling in the training of engineers, should also consider contexts, practices, and uses of already-built mathematical models and their use as a training tool for future engineers.
Based on these considerations, this investigation aimed to identify the opportunities offered by the study of mathematical models in the professional training of engineers; for doing that, classes and environments that promote a mathematical and professional training of engineers should be designed. In particular, this article aims to answer the two questions: What are the opportunities that mathematical model analysis offers for mathematics learning? What are the opportunities that mathematical model analysis offers for food engineering? To answer these question, this article is organized into five sections besides the Introduction. The first one focuses on offering a theoretical perspective on the notion of a mathematical model and how its analysis is conceived as a pedagogical tool. After that, a description of the participants of the study and the design of the tasks of the teaching experiment is offered. In the third section, the analytical tools are presented. Then, the results of the study are described and discussed based on the theoretical references. Finally, the conclusions of the study are offered.
2. On the Notion of a Mathematical Model
Mathematical modeling, in the perspective of mathematics education, can be considered as a research domain that seeks to investigate, among other aspects, the competences, meanings and other possibilities offered by contexts, models, constructions of models and interdisciplinary relationships, in connection to the mathematical training of students at different levels of schooling [9]. From a conceptual point of view, modeling can be considered a “translation” tool between two systems (one of them being mathematical and the other extra-mathematical). For instance, Lesh and Caylor [10] have conceived modeling as a way to design, treat and think in a mathematical system, about elements emerging on another system, whether real or imaginary. The interrelationships between these two systems can be diverse, generating different objects, purposes and ways of modeling.
As argued in the previous section, mathematics teaching should not always focus on model creation; some teaching efforts should be concentrated on the use and analysis of already-built models [1,11,12,13]. A look at the international literature shows that there is not a homogeneous interpretation of the term (mathematical) ‘model’, nor of the scope and implications that it has for education in science and mathematics. Consequently, the epistemological status of models is an open debate [13]. Among other interpretations, mathematical models can be considered theoretical constructs, structures, or representations. Lesh and Caylor [10] consider models as systems useful to design or make sense of other systems; for these researchers, the main way to differentiate mathematical models from other types of models (in fields such as physics, chemistry, statistics or biology), is that the former focus on the structural properties of systems, rather than on their physical, chemical, statistical or biological properties.
According to Giere [14], models involve a triadic representation relationship among a user, the represented object, and the representation. In a classic example, Giere [14] describes the map–user–city system as a model; the object map (representation) is used (by users) to represent another object (the city). In other words, there is a representation relationship between the represented object (the city) and the representing object (the map). This relationship is established and employed by users. It is in this sense that it is customary to say that the map is a model of the city. Based on this notion, Villa-Ochoa [13] proposed the analysis of a fetal growth model by future mathematics teachers; he noted that, in the school environment, teachers and students intervene as ‘other users’; from this fact, he highlighted that, in addition to the representation relationship, other relations are constructed (e.g., meaning, understanding, use) among the different users, the represented object and the representation.
The analysis of mathematical models has been proposed as a pedagogical approach to mathematics teaching and learning [11,12,13]. This approach is based on the fact that, in the study of a specific situation, it is not only necessary to produce models, but also to know, use and analyze existing models built for that situation. According to Villa-Ochoa [13], students can understand the mathematical model and use it to solve different problems, find inconsistencies and regularities, understand phenomena and interpret them and, in some cases, generate predictions. He considers that the discussion of new mathematical concepts can also be achieved by making references to a real situation. Villa-Ochoa [13] also notes that the visualization of a phenomenon in a graph provides information not perceived by students when merely algebraic solutions are presented; therefore, the graphic representation contributes to a greater understanding of the studied phenomenon and renders it more friendly and clear.
Some studies have shown that the teaching of mathematics is not related to the daily practices of engineers [1,15]. Therefore, it becomes necessary to study and promote educational practices that generate stronger links between mathematical procedures and mathematics as actually used by engineers [8,15]. These links should generate horizontal relationships between mathematical and engineering knowledge and practice [15]. This perception is based on the fact that, apparently, students often focus more their attention on mathematical details than on the studied model. Furthermore, these authors consider that when engineers use equations, graphs, diagrams, etc., they are already using models; so, models are not post-constructs, but represent a starting point to refer to the phenomena to be represented. Then, it is possible that using and analyzing models may emerge as one of the first steps before carrying out broader modeling and mathematical modeling processes. According to Romo-Vázquez [1], the modeling process is commonly incremental, that is, it consists of a fine-tuning of existing models based on experience and practice, including the results of modeling failures [1].
3. Materials and Methods
In order to address the research question, a qualitative study was conducted to identify the opportunities offered by the analysis of mathematical models in the professional training of prospective engineers. This methodology was chosen as a form of empirical inquiry that allows for an in-depth exploration of a phenomenon. In this study, the phenomenon was the analysis of the mathematical model by students. According to Creswell [16], other characteristics of qualitative research are: (i) stating the purpose and research questions in a general and broad way according to the participants’ experience; (ii) “Collecting data based on expressions of a small number of individuals so that the participants’ views are obtained” [16]; (iii) “Describing and classifying data using text analysis and interpreting the larger meaning of the findings” [16]. The qualitative research reported in this article was developed in a mathematics course prior to differential calculus. This course is offered to first semester students in food technology and engineering programs at a public university in Colombia. This section offers a description of the class, the research design, the collected data, and its analysis.
3.1. The Course and Participants
The course in which the empirical part of this research was implemented was carried out in the semester between January and June of 2015. This study was developed in a program offered at a University campus located 2.5 h far from the city of Medellin. The course took place in 8-h sessions over eight weekends. The purpose of the course was to promote algebraic and geometric concepts and tools to prepare students for differential and integral calculus courses. The course teacher (co-author of this article) is a food engineer with experience in setting up and managing small food businesses. The teacher, together with the research team (the other authors of the article) designed a set of tasks to promote mathematics learning through analysis of mathematical models. The design was implemented in sessions 3rd and 4th of the course. Nine students (17–19 years) participated in the research. They lived in rural places or small cities close to University Campus and were taking the mathematics first-semester course in Food Technology program. All students signed an informed consent. All names used in this paper are pseudonyms. The collection of research data was carried out through dialogues and extra-class interviews. The sources to collect the information were student work documents and videos of their participation in the sessions, as well as interviews and dialogues.
3.2. Design and Implementation of Teaching Experiments
Teaching experiments are a type of intervention-based methodology used in mathematics education research to study how students learn [17]; they seek to meet two fundamental objectives, namely: (a) improve teaching practice through didactic engineering approaches, acting on teaching-learning problems, and (b) increase the theoretical understanding of the context related to these problems [18]. These experiments include the design of tasks and a framework for analyzing student reasoning and actions. They should be conducted in real classes, focus on teaching and learning problems, and offer solutions based on theory. [18]
To start with the design of the teaching experiment, the researchers inquired into types of mathematical models used by food technologists or engineers. The results allowed an approximation to the use that engineers make of mathematical models [15]. As a result, the importance of the interpretation of graphs, knowledge of food processes and engineering design were identified [19]. A literature review was carried out in different specialized journals. For doing the search, the Boolean operators “food and mathematical modeling” and “food and mathematical models” were used. The search generated more than 5000 titles; the results were refined looking for the relation of models and modeling with industry and food processes; If the title suggested this relationship, the summary, the keywords, and the mathematical model were also read. Articles related to the use of mathematical models to predict, control, and describe production processes or product conservation, were selected. Relationships between mathematical models and mass and energy transport phenomena were also taken into account. The models were selected considering the algebraic and geometric topics of the course and according to engineers’ practices within the academic level of the students.
After the whole search, two mathematical models were selected. The first one modelled mass transfer processes (dehydration) and the second one modelled energy transfer processes (cooling and heating processes). On each of them, a set of activities was organized, generating a set of statements and actions that were structured according to specific purposes. This article analyzes the activity set that was created for the first teaching experiment. Table 1 describes these activities and their purpose. Emphasis was placed on graphic representation and on the establishment and understanding of the relationships among modeling-variables. This decision was based on the guidelines previously presented. [6,11].
3.2.1. Task 1 (T1)
Understanding the context. A lesson guide with a description of the drying phenomenon is presented. Questions are presented and homework on the context is proposed. The purposes of this task are (i) to provide information on radial airflow drying equipment; (ii) to recognize the dehydration of food as an activity of food engineers and (iii) to differentiate types of drying and factors involved in the drying process (surface, temperature, airspeed, etc.).
3.2.2. Task 2 (T2)
Recognition of the role of mathematics for phenomenon understanding. A model of the percentage of moisture removed (%H) for cassava was used [20]. The model describes the relationship between the percentage of moisture removed (%H) for cassava and the degree of dehydration through airflow. This model is expressed by a function between percentage and cassava quantity (C), surface/volume ratio (A/V), fan speed (V), and the recirculation air control temperature (T)
%H = 8.0826 − 0.006603 (C) + 41.2561 (A/V) + 2.8028 (V) + 0.2792 (T).
The students were asked for an “initial” description of what the model expresses about the phenomenon. The purposes of this task are (i) to recognize the actions taken by students to analyze the model as a multivariable function and (ii) to promote the recognition of variables and trends, the description of relationships between variables and the estimation of results according to the variables under study
3.2.3. Task 3 (T3)
Interpretation of graphical representation. The following graphs (Figure 1 and Figure 2) were presented to students who were asked to describe the cassava drying process.
A presentation and discussion about the interpretation of the graphs were undertaken in class. The purposes of these tasks were (i) to recognize trends of the variables for the percentage of moisture removed, (ii) to promote an interpretation of a straight line as a trend and descriptor of a relationship between variables and (iii) to describe the experience of the creators of the model gained when comparing the variables air temperature, percentage of moisture removed, and the amount of cassava in the dryer.
3.2.4. Task 4 (T4)
Use of the model. The students were invited to:
- Solve specific cases about data given in the model. Students constructed graphs by simplifying the model to functions with one independent variable and assuming the other variables as constants.
- Discuss limit, possible and not possible cases. The identification of cases was promoted through the questions what would happen if…? It is possible that…?
- Recognize the effect of the change in one of the variables over the other variables. An interpretation of the change was promoted through questions such as: What happens to the percentage of moisture when the independent variable changes? How much does it grow as…? What happens in an interval like…? Why does that behavior occur?
The purposes of these tasks were (i) to promote the use of the model to analyze specific cases and (ii) to identify possible uses and limitations of the mathematical model.
3.2.5. Task 5 (T5)
Model understanding. The students were invited to:
- Describe the importance of the model against the context. Questions that were asked included: What does the model say about the variation of the moisture percentage? Ask questions that can be answered with the information provided by the model. Ask questions that cannot be answered using the model.
- Report on how the model affects the quality of the dehydrated product. Questions were asked that allowed the students to manipulate and control the variables, so as to have an optimal moisture percentage, guaranteeing the quality of the cassava.
- Report on the learning obtained after model analysis. The students described their learning about the utility of this model in their profession. They also described how they could use it in future professional practice.
The purposes of these tasks were (i) to identify practices carried out by students and its relation to professional practices and (ii) to promote connections between students’ mathematical understandings and professionals’ knowledge and practices.
3.3. Analytical Tools
Based on the theoretical approaches presented above, two analytical tools were formulated. The first one is based on mathematical reasoning and understanding, and the second one is based on the use and analysis of models in the professional field of training.
The first tool allowed for focusing attention on the mathematical processes emerging from the model analysis. The approach used by Javaroni and Soares [12] was adopted. According to the authors, the analysis of models promote activities such as (i) the study of the phenomenon in question; (ii) study of the hypotheses considered for the elaboration of the model; (iii) understanding of what the model says about the phenomenon; (iv) study of the behavior of model solution(s), relating this behavior to the phenomenon and the hypotheses considered; (v) study of influences of the model parameters on the behavior of its solution(s), which allows making forecasts and analyzing the influence of possible interventions on the phenomenon; (vi) analysis of the limitations of the model.
The second tool adopted the approach used by Dillon [6]. For Dillon, engineering practice is explicitly focused on design: the process of building devices (which can range from simple components to complex systems and plants) that behave in specific ways. For this author, the notion of design involves a large component of visualization, and he argues that engineers keep coded information as images they see in their “mind’s eye.” Furthermore, he states that “a large part of engineering information is recorded and transmitted in a visual language that is, in effect, the lingua franca of modern-world engineers”. The decision to analyze graphical interpretations and uses was based on the fact that, in particular, food engineers require capacities to interpret and analyze graphs, both to infer trends and behavior of the variables, as well as to understand and develop specific methods in food processing; for example, the choice of processing conditions may be determined from a plot of log time versus temperature, or by the method of graphical analysis of heat penetration data [21].
Based on these two tools, the analysis focused on identifying and coding the data that, on the one hand, accounted for the mathematical processes that the students evidenced when they studied and analyzed the proposed models [12]. In this case, emerging codes such as “reasoning”, “understanding”, “views of covariation” and “visualization”, were identified. On the other hand, data offered evidence on the ways of understanding, visualizing and describing the behavior of the systems represented in the model (diagrams, sketches, graphs, engineering drawings, scale models, etc.); in this case, codes such as “food process knowledge”, “process representation”, “graphic” and “outline”, emerged. As the analysis was carried out, the results were compared by the research team. Based on this, they returned to the data to look for more evidence that would support or contradict the inferences that were emerging.
4. Results
According to the analytical criteria presented in the previous section, the results were organized. They show opportunities to reason with functions in specific contexts and articulations with the professional field of action of food engineering. Table 1 presents the results summarized by each of the tasks proposed in the teaching experiment.
In the first task, the students valued the possibility that in a first-semester math course they would be allowed to study a specific phenomenon of their discipline. The information provided in the lesson guide allowed them to recognize the presence of different factors and variables that intervene in the drying process of some foods, among them, the type of equipment available for drying. The students, as users of the model, committed themselves to mathematically understanding their relationships, but beyond that, they committed themselves to understand the context in depth; as a result, they recognized the presence of unconsidered variables in the phenomenon and discarded other variables that they initially considered relevant.
In the second and third tasks, the analysis of algebraic and graphical representations required the students to simplify the variables in order to understand some of their relationships. In this regard, the use of software for the dynamic treatment of Cartesian graphs was decisive, both for the visualization of the relationships and for the ‘manipulation’ of the model. For that purpose, the software GeoGebra (version 6, developed by Markus Hohenwarter et al., Linz, Austria, https://www.geogebra.org/?lang=en) was chosen. Another aspect to highlight these tasks was the opportunity they offered for students to reason with the covariation between variables [22,23]. After delimiting the quantities that made up the model, the students committed to understanding the dependency and covariation relationships between them. The fact that the teaching experiment provided the mathematical model influenced students to ‘create’ strategies to analyze multivariable ‘dependency’. These strategies involved the concepts and tools of the course.
The students stated that initially, they did not have the tools to represent a multivariable function; however, they used their perception and recalled previous knowledge about the phenomenon to point out relationships about covariation [22,23]; for example, during a class session, students recognized that the higher the temperature, the greater the loss of moisture. They also realized that this type of relationship was influenced by the presence of other variables. For the students, it became clear that the temperature had to be supervised. According to Berta, “[it has to] grow in a controlled way, because otherwise, there is a risk that the product burns or is not processed in its interior”. This type of conceptualization was studied in greater detail during the third task of the teaching experiment].
As students progressed through the proposed tasks, they found possibilities to refine their understanding of the variables and the covariation relations. For example, in the third task, students observed a direct relationship between the percentage of moisture removed and air temperature (Figure 1 and Figure 2). However, they also inferred that, although in both graphs the variables and the direction of the relation were the same (direct covariation), the values varied depending on the quantity of the product to be dried. In other words, other variables (which were assumed to be different constant values) were interpreted as a means to control the relationship.
In task 3, for example, Albert demonstrated his ability to identify the relationship between the variables and to interpret it within the framework of the studied phenomenon. In Figure 1, the student observed the temperature of 60 °C and compared it with the corresponding value in Figure 2. The following table (Table 2) presents the comments made by each of the students.
Each of the comments in Table 2 can be interpreted as examples of the relationships that students establish between the covarying quantities. For example, for particular cases, Albert noted the amount of change; Maruja, Berta and Davy noted a direct correlation between the quantities (coordination of the direction of change); Eder and Rómulo noted the dependency relationship between the variables (coordination of variables). In summary, Table 2 shows that the coordination and direction of change are notable facts [22,23].
In Task 4, students constructed Cartesian graphs in GeoGebra to represent the covariation between the percentage of moisture removed and the other variables. Once one variable was set, the others were considered constants whose value could be controlled through sliders.
When studying the relationship between the variables quantity of cassava and percentage of moisture removed, Romulo stated that when the amount of cassava was increased, the percentage of extracted moisture decreased. The other students agreed with this assessment. Subsequently, the professor asked the students to change the values of the sliders in the software. Romulo increased the slider that corresponded to the amount of cassava on the graph and observed what happened for amounts greater than 6000 g. After that, the teacher asked the students to interpret the effect of changing the sliders. This fact generated the following dialogue.
Maruja: no moisture is removed because there is a lot of it [cassava] in the dehydration equipment.
Albert: then the relationship between quantity and percentage of moisture is inverse.
Maruja: It does not continue extracting. If the result is negative, then the opposite happens; it provides moisture.
Research: Would it be logical to get moisture?
Maruja: No, but in functions, you see a lot of negative results.
Berta: Yes, it is a lot, like when we fry many potatoes
Research: Can you explain?
Berta: Yes, [for example] when we put a lot of [potatoes in the fryer] they don’t become toasted.
In some way, it could be observed that although students analyzed the model using its graphic representation, they also tried to relate their analysis to the dehydration process itself. That is, their reasoning was not detached from their understanding of the situation. This interpretation is based on the statements of Maruja and Berta; for example, Berta offered an example using an analogy of the studied behavior. Maruja tried to answer at a mathematical level and in the context of the studied phenomenon. According to Soares [12], there seems to exist an ability to interpret the result of the model in the context in which the problem was stated. In the case of the participants in this research, this ability was evident in the recognition of the correlation between the variables and, mainly, in the attention focused on the direction of growth and decrease of covariation. When analyzing the correlation between the two quantitative variables, the students observed the linear trend and the direction it followed. Based on this, they concluded whether the correlation was negative or positive.
As well in Task 4, the relationship between the variables quantity of cassava and percentage of moisture removed was studied. Extrapolations between the phenomenon and the mathematical activity emerged when manipulating the graph in GeoGebra by considering increasing values on the X-axis. As a result of his analysis of the model using its graphic representation, Rómulo pointed out that the dehydration process presented a problem when using amounts greater than 7 kg of cassava. He expressed: “I think the model fails for such large amounts of cassava”; for the student, the negative results were not coherent in light of the phenomenon studied; in parallel, Maruja expressed her understanding of the graph with an explanation that involved her understanding of functions; for Maruja: “when it comes to functions, negative results can be obtained for Y, although in reality that does not happen”. It is possible that students were implicitly establishing intervals for the values that could be used in the model according to the results they obtained. In this case, the estimated coefficient for the variable quantity of cassava was negative, which indicated that as the quantity of cassava varied, the percentage of moisture removed from cassava (%H) decreased by a factor of 0.0006603, keeping the other variables fixed. In Task 4, in addition to the graphical and algebraic interpretations, an opportunity to study metric and geometric relationships emerged. When the students analyzed the model represented in Figure 3, the teacher questioned them about the influence that variable A/V would have on the extraction of moisture. From the proposed model, it could be seen, for each unit, that the surface/volume ratio increased, the percentage of moisture removed (%H) for cassava increased by a factor of 41.2561 units, keeping constant the quantity of cassava (C), the fan speed (V) and the recirculation air control temperature (T).
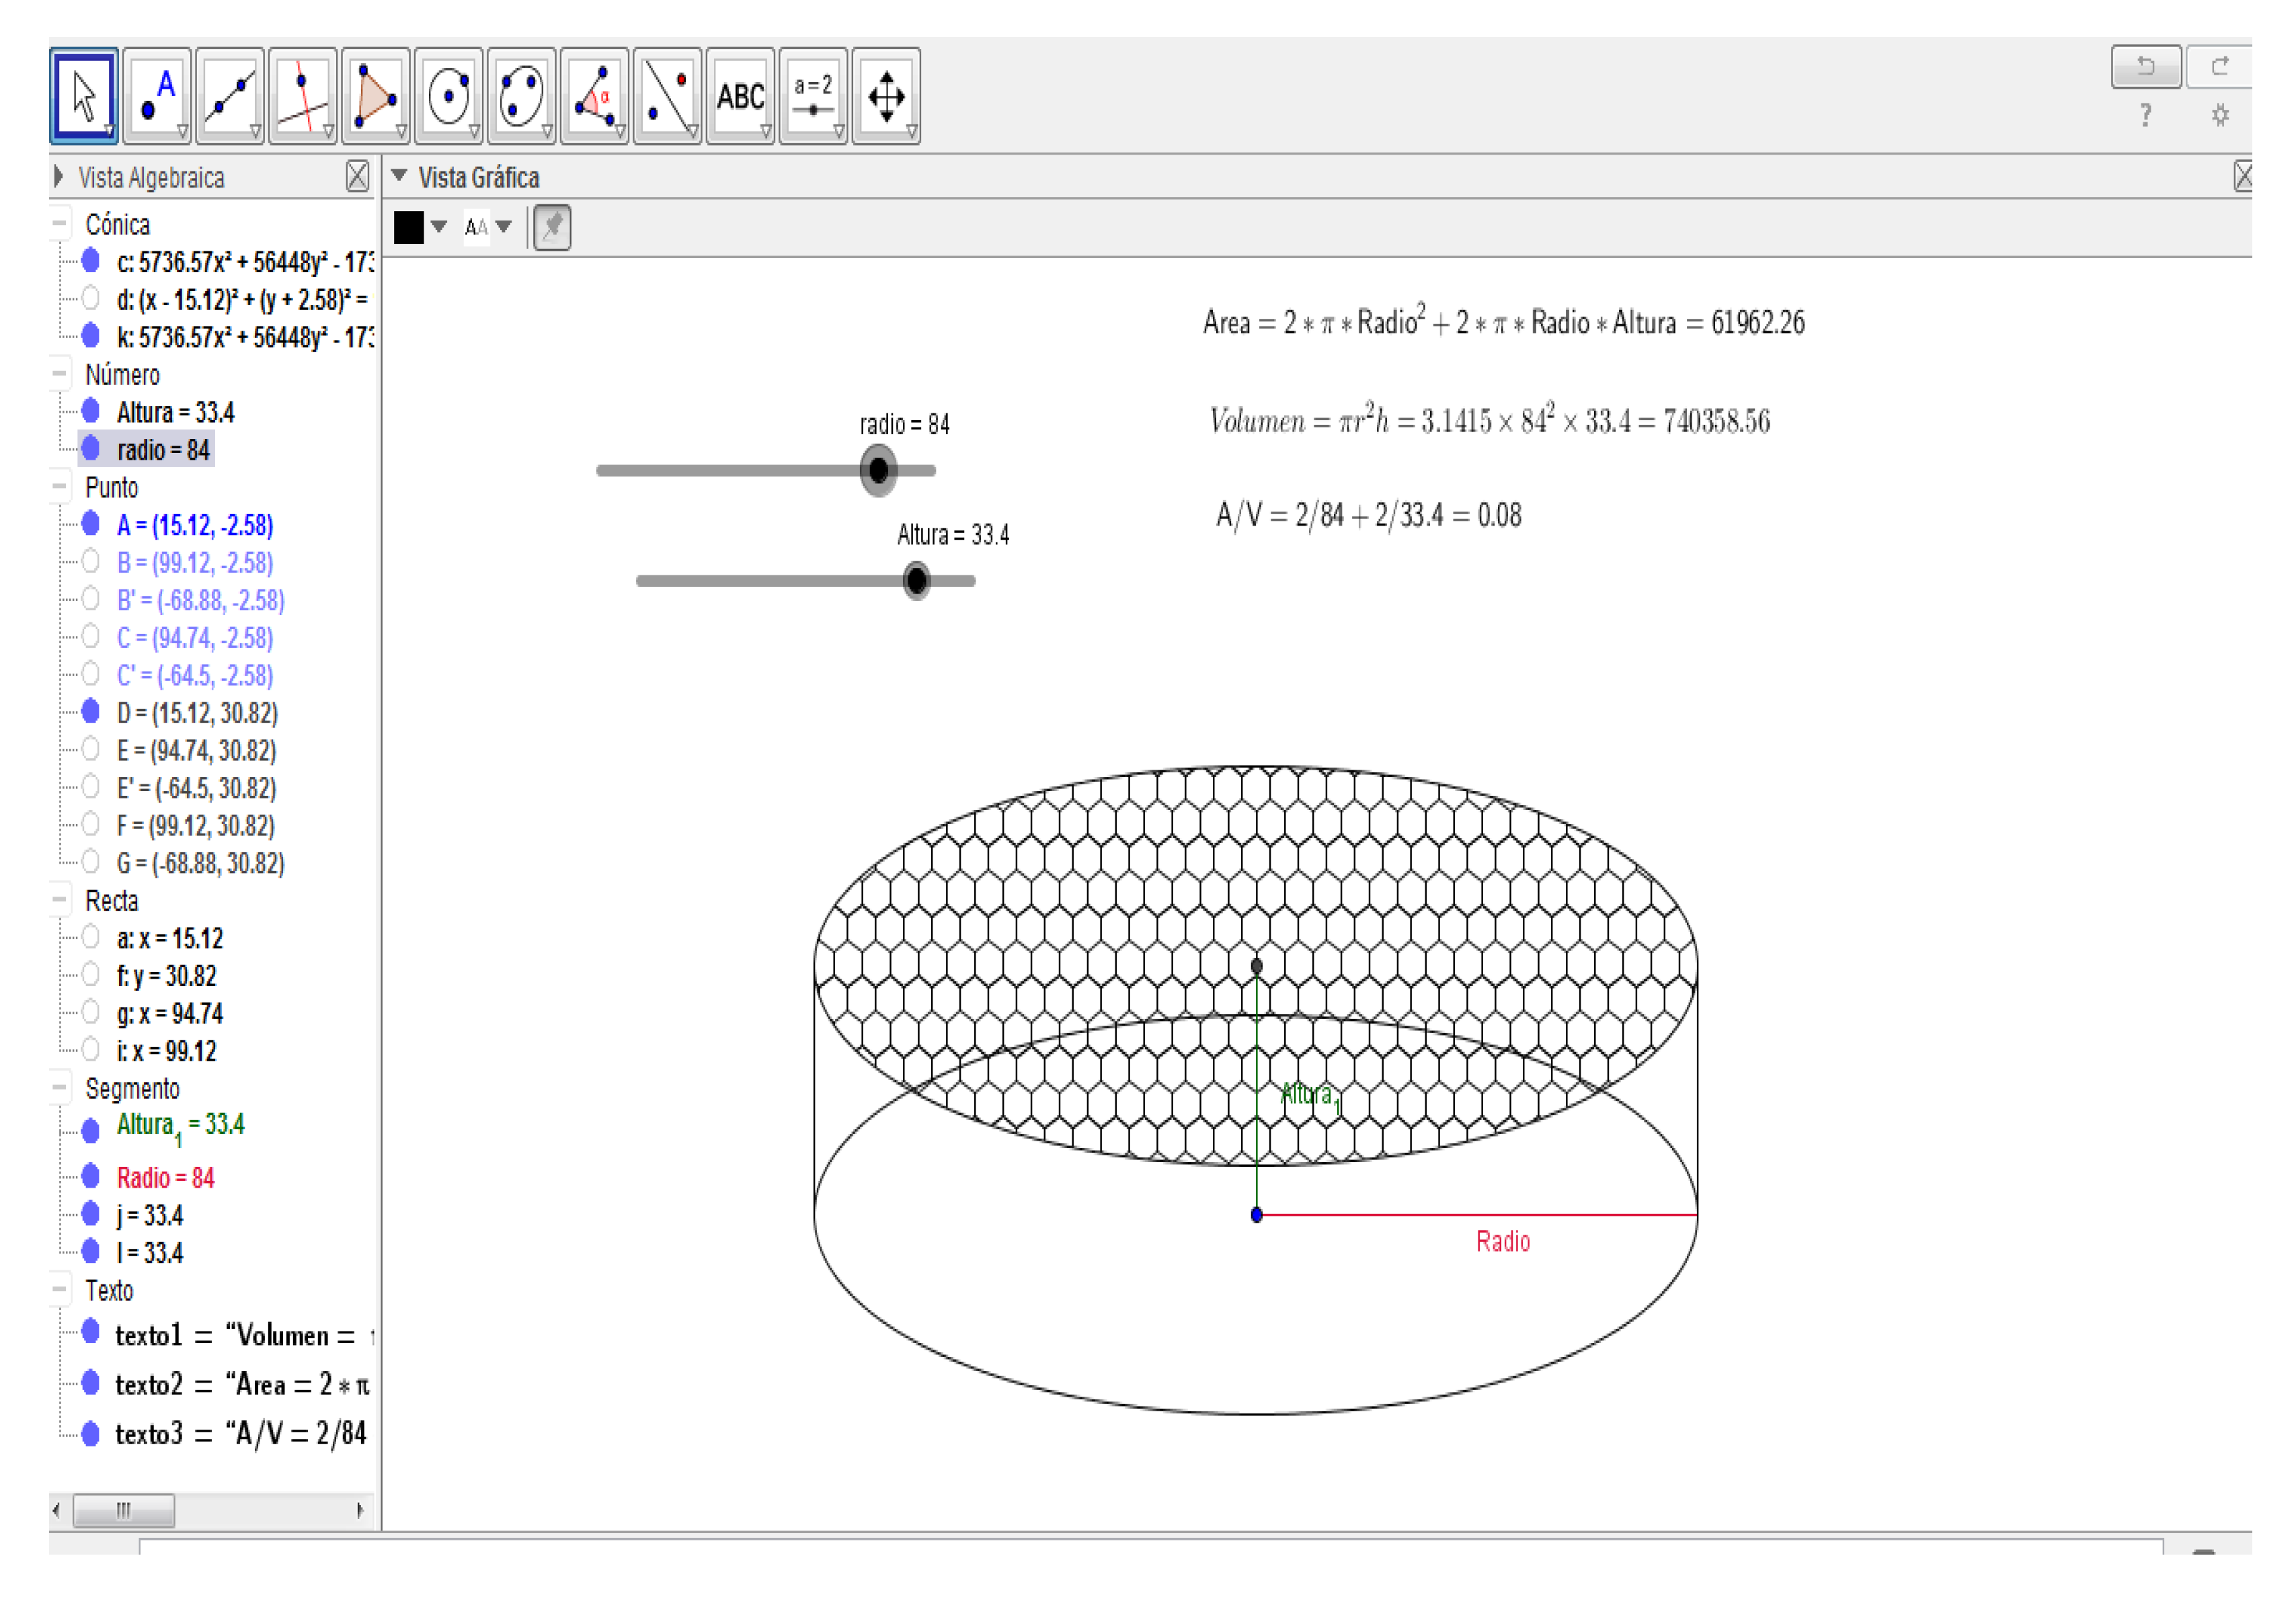
The question about the relationship between the variables percentage of moisture removed and ratio A/V (ratio surface/volume) sparked a discussion about the interpretation of the A, V and A/V quantities. These amounts were associated with the approximately cylindrical shape of the cassava pieces that were being dehydrated. To understand how these quantities were related, the students and the teacher took on the task of building in GeoGebra a representation of a “dynamic” cylinder in which the area and volume could be manipulated depending on the radius and height of the cylinder (Figure 4). According to Soares [11], this exploration with the sliders and the establishment of relationships between the quantities A and V could be considered an ‘experimentation’ through the software.
To promote reasoning about the covariation between A and V, the teacher suggested that students described the relationship between changes in sliders of A and V and changes in the ratio A/V. Then, he proposed to compare some possible cases for the values of A and V and describe the effects they would have on the ratio A/V. The references to small or big in Table 3 point to those two variables, whose values were between 0 and 1 or greater than 1 respectively.
From the manipulation of the sliders and the experience summarized in the previous table (Table 3) the teacher asked the students about their interpretation and identification of patterns between quantities. The following were the student responses:
Eder: With large radius and small h there is more extraction because the ratio is high.
Albert: It is preferable if cassava is thin.
Berta: So, when we fry potatoes it is easier if they are thin.
Eder and Berta: So, the height should be very small.
It was observed, for example, that Eder interpreted an inverse correlation relationship between the quantities, while Albert and Berta used their inferences to justify some actions in food dehydration. By observing this representation of A/V, the students were able to identify a way to achieve high relationships (values above 1) for this variable; also, Berta related again the conclusion with a process familiar to them: the frying of potatoes. A similar example had previously been used to explain the results in terms of a phenomenon well known for the students.
5. Discussion
Graphically-represented mathematical models play an important role in science and engineering and, therefore, in educational processes in those fields. The complexity of present-day technology, design, information revolution and health, and social crises require innovative solutions, which, in turn, require the training of professionals with capacities to interpret, understand and analyze different situations, and with abilities to offer feasible variants to problems and its consequences. Future professionals need to develop abilities to understand situations and phenomena based on data and information; above all, they need abilities to find the meaning that such information has in the context of each particular problem.
As observed in this article, the analysis of mathematical models offers opportunities for students to visualize and interpret trends and relationships between variables, infer results, and use them to make sense of situations and problems of their professional field. Through a set of tasks, the model to analyze the percentage of moisture removed enabled students to reason with functions and their covariation [22,23]. That is, the students evidenced an understanding of coordinated change, directional change and, with the use of the sliders, they also realized the relationship between the amount of change of a variable (slider) and the effects on the function being modeled. The use of sliders emerged as a tool to achieve a more comprehensive understanding of the model, even if the graphing of multivariate models was not within the scope of the mathematical contents of the course. Students’ reasoning throughout the experiment focused on understanding the dynamic nature of functions and the ‘effects’ that a changing variable has on a dependent variable (%H), keeping the other variables constant.
The students also reasoned on the effect on the independent variable when two variables are simultaneously changing. In general, even though the sliders allowed them to quantify some of the variables, they were mainly used to reveal the effects that a variable has on the change of some functions. On the one hand, this type of understanding of functions as covariation prepares students for a future study of calculus, since an important part of the problems of the students in these subjects derives from the dynamic nature of the concepts of the subject [22,23,24]. On the other hand, opportunities were also offered for students to study models through their graphical representation, involving the recognition of variables, the use of conventions for graphing (axes and scales), the use of software, the understanding of variation and some mathematical notions, contexts and objects related to food professionals. These elements are key within the components of graphing as a social practice [19].
During the development of the activities, there was also an opportunity for the students to understand metric and geometric relationships between area and volume. Two related aspects are worth noting: the first of them is the possibility of understanding the variation of quantities A and V in terms of the radius and the height of the cylinder; the role of the Software GeoGebra was important, since through the manipulation of the cylinder radius and height sliders it enabled the students to manage and comprehend the changes in the dimensions of the figure, the variation of the area, the volume and the ratio A/V. The second aspect important to note is the students’ understanding of the ratio A/V and its use in the moisture percentage model. As observed in Figure 3 and Figure 4, even though the quantities A and V appear in the model, the variable that needed to be taken into account in the model was the ratio between them (A/V). According to Molina-Toro and colleagues [25], the software was used as a support for the mathematical activity of the students. The software allowed model analysis to have components of interpretation, exploration and manipulation of variables, as well as the identification of regularities and the establishing of relationships; in some episodes, it also allowed the manipulation of geometric objects to recognize relationships between the quantities involved. The manipulation of the software also allowed the students to coordinate the changes in A and V independently and focus on the behavior of the ratio A/V as a new quantity. In the words of Thompson and colleagues [23], this is evidence of the understanding of a quantity as a multiplicative object. In the analysis of the model, the ratio A/V as a new quantity was also limited according to the conditions that the context places on the radius and height dimensions of the cylinder, which in the phenomenon represent pieces of cassava.
Although the sketches and graphs constructed by the students were continuous lines, there was no clear evidence of their understanding of the continuity of the functions. Continuity is used by food professionals, for example in optimizing thermal processing conditions in which, under certain conditions, graphs are constructed based on instantaneous heating followed by instantaneous cooling of the product. In this teaching experiment, the study of continuity was not promoted since the mathematical support for the understanding of the phenomenon did not require the concept. In calculus courses, the study of mathematical continuity is expected to depend on the uses that these professionals make of it in their professional practices and in the solution of real problems.
The understanding of a function as a covariation relation, as well as the comprehension of the mathematical model, was frequently linked to the context. This link could be observed at least in two moments: firstly, in the description of the variables as a description of the modeled quantities and not simply as abstract quantities; in fact, the acts of interpretation were mediated by students’ reference to variables as real quantities associated with the phenomenon; secondly, students used and interpreted the mathematical results to support certain facts (real or imagined) of food dehydration; their frequent reference to the phenomenon when reasoning suggested that the analysis of mathematical models provided opportunities for situated reasoning, in this case, covariational situated reasoning in the frame of professional practice.
Dehydration is a traditional method of food preservation. This method is also used to produce special foods and food ingredients and to process food industry by-products. There is a wide variety of industrial food drying equipment, mainly empirically developed, but continuously improved by recent advances in food drying and engineering technology [26]. The first activity of this teaching experiment offered students information about a radial airflow food drying equipment and also presented them with a mathematical model describing the percentage of moisture removed. Accessing the model enabled them to consider the variables involved in moisture loss and their relations with the shape and characteristics of the equipment.
Engineering students need to develop analytical abilities that enable them to understand phenomena and identify and solve problems through innovative and efficient methods. In the particular case of this study, opportunities were offered to identify variables, behaviors, relationships, and effects of changes in one variable over other variables’ behavior. These analytical abilities were also observed in the comprehension of a phenomenon based on the behavior of its model variables. Students studied the influence of the model parameters on the behavior of its solution(s) and were able to predict and analyze the influence of possible actions on the course of the phenomenon. These results support the studies made by Soares [11] and Javaroni and Soares [12], who argue that this type of behavior characterizes the analysis of mathematical models in a pedagogical approach. Furthermore, as in the case of Romulus, students identified limitations of the model to describe extreme cases of the phenomenon.
The analytical abilities of food engineers are evident in their professional practices. For example, these engineers must analyze and evaluate processes. In this type of practice, they need to determine the value of F for a given time or the required time for a given F value. For doing this, professionals can determine and analyze the heat penetration curve to get the appropriate values. Another example in which a graphical approach is also useful is in the processes of optimizing thermal processing conditions. In these types of practices, they have to choose the processing conditions, which can be determined from a graph log-time versus temperature. These graphs include two straight lines representing constant values of F and C. Those professional practices are slightly different from that of students in our teaching experiment; however, the graphic approach in the analysis of the model is similar in both cases. Table 4 summarizes the main actions of the students during the analysis of the mathematical model.
These actions were observed in a classroom environment that, in addition to studying a context and promoting the learning of mathematics, had as its main purpose the search for articulations with the professional field. According to Rendón-Mesa and colleagues [2], an understanding of the context, the problematization and the dialogue between disciplines was sought. For this reason, the teacher was continuously attentive to the students’ actions, questioning their responses and promoting reflections and arguments about their interpretations and solutions. The teacher also evoked his own experience as a food engineer to describe examples and confront students’ reflections on their learning process and on the usefulness of the model for the professional field.
In the perspective of Giere [14], the notion of a mathematical model involves a triadic relationship among an object to be modeled (relationship between the process of moisture removed and other variables), a representation (algebraic and graphical equation) and a user (food professional). Similarly to the case reported by Villa-Ochoa [13], students acted like other users who, in addition to refining their mathematical knowledge, were able to understand the phenomenon in greater detail; besides, they carried out a set of actions (Table 4) that keep some similarity with professional practice. These actions provide evidence of horizontal relationships between mathematical training and engineering knowledge [15]. These facts provide evidence that in mathematics classes it is possible to design environments that contribute to the reduction of gaps between the teaching of mathematics and engineering [2]. In this sense, the model analysis provided an authentic learning scenario. According to a review by Strobel and colleagues [3], authenticity can be observed in the relations that students perceive between the practices they are carrying out and the usefulness of those practices; for those authors, an example of authentic learning design occurs when students engage in expert-like activities (design, scientific research) related to ‘real world’ cases and problems.
6. Conclusions and Future Research
Two conclusions stand out as outcomes of this article. The first important conclusion is that the analysis of mathematical models offers opportunities to promote covariational interpretations of functions and their graphs. This kind of analysis has been advised as necessary in the mathematical training of students at different schooling levels. This was evident in the students’ reasoning, the creation of strategies to understand the effects that different variables have on a dependent variable, and the use of GeoGebra for analysis. In this regard, it is worth noting that the results and conclusions that were extracted from the model were linked to the meanings, experiences, and interpretations of food phenomena. Likewise, it is highlighted that the interpretations and uses that the students made of the mathematical model were strongly influenced by the graphic nature of the model and by the activities that were carried out to understand the phenomenon. Based on these characteristics, the analysis of mathematical models can offer opportunities to promote covariational reasoning in located practices of the profession.
The second important conclusion is that the analysis of mathematical models offers opportunities for students to understand and carry out actions that are related to future practices of their professional field. In this sense, the analysis of mathematical models offers opportunities for authentic learning. In the case of this study, the analysis of mathematical models allowed an integrated vision of mathematics and engineering. The importance of this articulation lies in the fact that students get the ability to use different characteristics and capacities to generate explanations and interpretations that allow them to comprehend the models used and analyzed.
This study highlights the intention not only to bring a mathematical model from engineering with motivational purposes, but also to introduce or produce a concept or to produce utilitarian ideas. The teaching experiments were designed to unveil the role of non-mathematical knowledge that emerges and is used in a modelling process. This research encourages researchers to produce other studies showing implications of promoting situations in which mathematics, engineering, and other contexts are linked with no one aspect being subordinated to another. An important challenge for future researches consists of analyzing the possibilities offered by mathematical modeling in other mathematics courses of engineering programs. Additionally, other challenges arise in relation to the choice of models, the design of the environments, and its integration to the mathematics curriculum in those programs.
Author Contributions
Conceptualization, E.S., J.A.V.-O., methodology, E.S., J.A.V.-O.; validation, J.A.V.-O.; D.G.-G.; formal analysis, E.S., J.A.V.-O., D.G.-G.; investigation, E.S., J.A.V.-O.; writing—original draft preparation, E.S., J.A.V.-O.; writing—review and editing, E.S., J.A.V.-O., D.G.-G. All authors have read and agreed to the published version of the manuscript.
Funding
This research received no external funding.
Conflicts of Interest
The authors declare no conflict of interest.
References
- Romo-Vázquez, A. La modelización matemática en la formación de ingenieros. Educ. Matemática 2014, especial (25 años), 314–338. Available online: https://www.redalyc.org/pdf/405/40540854016.pdf (accessed on 10 August 2020).
- Rendón-Mesa, P.A.; Duarte, P.V.E.; Villa-Ochoa, J.A. Articulación entre la matemática y el campo de acción de la ingeniería de diseño de producto: Componentes de un proceso de modelación matemática. Revista de la Facultad de Ingeniería. U.C.V. 2016, 31, 21–36. [Google Scholar]
- Strobel, J.; Wang, J.; Weber, N.R.; Dyehouse, M. The role of authenticity in design-based learning environments: The case of engineering education. Comput. Educ. 2013, 64, 143–152. [Google Scholar] [CrossRef]
- Romo-Vázquez, A.; Barquero, B.; Bosch, M. Profesional Online de Profesores de Matemáticas En Activo: Una Unidad de Aprendizaje Sobre La Enseñanza de La Modelización Matemática. Uni-pluriversidad 2019, 19, 161–183. [Google Scholar] [CrossRef] [Green Version]
- Lyon, J.A.; Magana, A.J. A review of mathematical modeling in engineering education *. Int. J. Eng. Educ. 2020, 36, 101–116. [Google Scholar]
- Dillon, C. Models: What do engineers see in them? In Ways of Thinking, Ways of Seeing. Mathematical and Other Modelling in Engineering and Technology; Bissell, C., Dillon, C., Eds.; Springer: Berlin, Germany, 2012; pp. 47–69. [Google Scholar]
- Gainsburg, J. The mathematical modeling of structural engineers. Math. Think. Learn. 2006, 8, 3–36. [Google Scholar] [CrossRef]
- Bissell, C.; Dillon, C. Telling tales: Models, stories and meanings. Learn. Math. 2000, 20, 3–11. [Google Scholar]
- Villa-Ochoa, J.A.; de Alencar, E.S. Un panorama de investigaciones sobre Modelación Matemática: Colombia y Brasil. Rev. Educ. Matemática 2019, 16, 18–37. [Google Scholar] [CrossRef]
- Lesh, R.; Caylor, B. Introduction to the special issue: Modeling as application versus modeling as a way to create mathematics. Int. J. Comput. Math. Learn. 2007, 12, 173–194. [Google Scholar] [CrossRef]
- Da Soares, D.S. Model analysis with digital technology: A “hybrid approach”. In Mathematical Modelling in Education Research and Practice; Stillman, G.A., Blum, W., Biembengut, M.S., Eds.; Springer: Cham, Switzerland, 2015; pp. 453–463. [Google Scholar]
- Javaroni, S.L.; Soares, D.d.S. Modelagem matemática e análise de modelos matemáticos na educação matemática. Acta Sci. 2012, 14, 260–275. [Google Scholar]
- Villa-Ochoa, J.A. Aspectos de la modelación matemática en el aula de clase. el análisis de modelos como ejemplo. In Investigaciones Latinoamericanas de Modelación de la Matemática Educativa; Arrieta, J., Diaz, L., Eds.; Gedisa: Barcelona, Spain, 2016; pp. 109–138. [Google Scholar]
- Giere, R.N. Using models to represent reality. In Model-Based Reasoning in Scientific Discovery; Magnani, L., Nersessian, N.J., Thagard, P., Eds.; Springer: Boston, MA, USA, 1999; pp. 41–57. [Google Scholar]
- Mendoza-Higuera, E.J.; Cordero, F.; Solís, M.; Gómez, K. El uso del conocimiento matemático en las comunidades de ingenieros. Del objeto a la funcionalidad matemática. Bolema Bol. Educ. Matemática 2018, 32, 1219–1243. [Google Scholar] [CrossRef] [Green Version]
- Creswell, J.W. Educational Research. Planning, Conducting, and Evaluating Quantitative and Qualitative Research; Pearson: Boston, MA, USA, 2012. [Google Scholar]
- Bernabeu, M.; Moreno, M.; Llinares, S. Experimento de enseñanza como una aproximación metodológica a la investigación en educación matemática. Uni-pluriversidad 2019, 19, 103–123. [Google Scholar] [CrossRef] [Green Version]
- Stylianides, A.J.; Stylianides, G.J. Seeking research-grounded solutions to problems of practice: Classroom-based interventions in mathematics education. ZDM Math. Educ. 2013, 45, 333–341. [Google Scholar] [CrossRef]
- Garza-Kanagusico, A.B.; Zaldívar-Rojas, J.D.; Quiroz-Rivera, S.; Rodríguez-García, C.E. Análisis de la práctica de graficación en estudiantes de ingeniería en un contexto de laboratorio de física. Uniciencia 2020, 34, 95–113. [Google Scholar] [CrossRef]
- Durango, N.; Bula Silvera, A.; Quintero, R.; Donado, L. Modelo matemático para secador de alimentos de flujo radial. Ingeniería. y Desarrollo. 2004, 15, 1–8. [Google Scholar]
- Holdsworth, S.D.; Simpson, R. Food engineering series. In Thermal Processing of Packaged Foods; Springer International Publishing: Cham, Switzerland, 2016. [Google Scholar]
- Villa-Ochoa, J.A. Razonamiento covariacional en el estudio de funciones cuadráticas. TED Tecné Epistem. Didaxis 2012, 31, 9–25. [Google Scholar] [CrossRef] [Green Version]
- Thompson, P.W.; Carlson, M.P. Variation, covariation and functions: Foundational ways of mathematical thinking. In Compendium for Research in Mathematics Education; Cai, J., Ed.; NCTM: Reston, Fairfax, 2017; pp. 421–456. [Google Scholar]
- Rueda, J.N.; Parada-Rico, S.E. Razonamiento covariacional en situaciones de optimización modeladas por ambientes de geometría dinámica. Uni-pluriversidad 2016, 16, 51–63. [Google Scholar]
- Molina-Toro, J.F.; Rendón-Mesa, P.A.; Villa-Ochoa, J.A. Research trends in digital technologies and modeling in mathematics education. EURASIA J. Math. Sci. Technol. Educ. 2019, 15, 1–13. [Google Scholar] [CrossRef]
- Saravacos, G.; Kostaropoulos, A.E. Food Engineering Series. In Handbook of Food Processing Equipment; Springer International Publishing: Cham, Switzerland, 2016. [Google Scholar]
Figure 1.
Relationship between moisture removed and recirculation-air control temperature for one kilogram of cassava with two levels of speed and the surface-to-volume ratio. Source: Durango and colleagues [20].
Figure 1.
Relationship between moisture removed and recirculation-air control temperature for one kilogram of cassava with two levels of speed and the surface-to-volume ratio. Source: Durango and colleagues [20].

Figure 2.
Relationship between the percentage of moisture removed and recirculation-air control temperature for two kilograms of cassava with two levels of speed and the surface-to-volume ratio. Source: Durango and Colleagues [20].
Figure 2.
Relationship between the percentage of moisture removed and recirculation-air control temperature for two kilograms of cassava with two levels of speed and the surface-to-volume ratio. Source: Durango and Colleagues [20].

Figure 3.
The relationship of %H vs. area/volume (A/V).

Figure 4.
Ratio A/V and its dependence on the values of radius and height.


Table 1.
Summary of results.
| Tasks/Activities | Outcomes |
|---|---|
| T1. Understanding the phenomenon: | The students stated that they recognized a radial airflow food dryer and some of its features. They used terms such as ‘model’, ‘temperature’, ‘design of machines’ (dryers), ‘the need to measure and control temperature’, and ‘the need to know the indexes of some foods’. They also identified quantities and direct and inverse relationships between them. They gained insight into the need to quantify variables through measurement. |
| T2. Recognition of the role of mathematics for phenomenon understanding. | Students recall knowledge about functions and their graphical representations; knowledge of Geometry and measurement, notions of surface, area, volume; and other concepts from other areas such as temperature, mass, heat, density. Students understood the meaning of mathematical concepts and terms linked to the context of the application of the model. Students stated that they had recognized ‘a dependency’ between the moisture percentage and other variables and quantities; however, there was no recognition of the conditions under which a quantity could be constant or variable or how variations in one quantity affected other quantities. |
| T3. Interpretation of graphical representation. | Students evinced reasoning capacity about covariation between quantities (for instance, coordinating direction of change of one variable with respect to other-variables change). Examples were offered on food processes that describe similar trends to those found in the mathematical model. |
| T4. Use of the model. | Students investigated the behavior of the moisture percentage based on other variables of the model. For doing this, they assumed the other variables were constants and created sliders to variate them using the Software GeoGebra (version 6, developed by Markus Hohenwarter et al., Linz, Austria). They constructed images of ‘multivariate’ behaviors by manipulating the sliders and observing the ‘effects’ on the function. |
| T5. Model understanding. | They interpreted trends, intercepts on the axes, negative values in the range of the variable and possible values of the result or outcome variable according to the variation on one or more variables in the model. |
Table 2.
Comments by students on task 3.
| Student | Comments |
|---|---|
| Albert | In that of 1 kg, more [moisture] is removed because 50% comes out and, in the other, a smaller quantity, given the same temperature value. |
| Maruja | […] with more cassava, less moisture is removed [indicating the height of the lines]. |
| Berta | The temperature varies, the higher the temperature the more moisture is removed, and it also seems a linear function. |
| Davy | Yes, it is a dependency relationship because, if temperature increases, the percentage of moisture removed increases. |
| Eder | It varies. |
| Rómulo | There is a dependency relationship as in the velocity graph [Making reference to the graph of air velocity vs. moisture percentage]. |
Table 3.
Student considerations on the effect of A and V values over A/V ratio.
| Values of A | Values of B | How the Ratio A/V Behaves |
|---|---|---|
| Small | Small | Results in a small number |
| Small | Big | High, around 1 or more |
| Big | Small | Varies between 0.05 and 0.53 |
| Big | Big | Big |
Table 4.
Student considerations on the effect of A and V values over the ratio A/V.
| Action | Context |
|---|---|
| Explain changes | Students explained observed changes as the graphs increased or decreased. These explanations were initially based on the direction of change rather than on the rate of change |
| Explain results in mathematical terms | Strange results for the phenomenon were estimated using the graphs and interpreted for the phenomenon using their understanding of functions. |
| Compare with models and make conclusions | Finding strange results, students turned to the use of mathematical models to determine conclusions. |
| Explain results in terms of the context | By looking at the results on the graphs, students responded in terms of the studied process. |
| Compare processes | Given the need to explain a result, students compared the results of the graphs with the results of known processes. |
| Determine model limitations | When finding strange results for the phenomenon, intervals in which the model provided logical explanations were determined. The model was said to be limited to some domain values. |
| Manipulate parameters and overcome the emerging limitations | When finding strange results, students concluded that the model was limited and looked for ways to make it work again by manipulating other parameters. |
| Determine comparatively the understanding of other processes | Students manifested the ability to interpret the results considering the common characteristics of the phenomenon with other phenomena known to them. |
© 2020 by the authors. Licensee MDPI, Basel, Switzerland. This article is an open access article distributed under the terms and conditions of the Creative Commons Attribution (CC BY) license (http://creativecommons.org/licenses/by/4.0/).
Share and Cite
MDPI and ACS Style
Sepúlveda, E.; González-Gómez, D.; Villa-Ochoa, J.A. Analysis of a Mathematical Model. Opportunities for the Training of Food Engineering Students. Mathematics 2020, 8, 1339. https://doi.org/10.3390/math8081339
AMA Style
Sepúlveda E, González-Gómez D, Villa-Ochoa JA. Analysis of a Mathematical Model. Opportunities for the Training of Food Engineering Students. Mathematics. 2020; 8(8):1339. https://doi.org/10.3390/math8081339
Chicago/Turabian StyleSepúlveda, Edwin, Difariney González-Gómez, and Jhony Alexander Villa-Ochoa. 2020. "Analysis of a Mathematical Model. Opportunities for the Training of Food Engineering Students" Mathematics 8, no. 8: 1339. https://doi.org/10.3390/math8081339
Note that from the first issue of 2016, this journal uses article numbers instead of page numbers. See further details here.