Radial Movement Optimization Based Optimal Operating Parameters of a Capacitive Deionization Desalination System
by
 , , and
Hegazy Rezk
1,2,* ,
,
Muhammad Wajid Saleem
3 ,
,
Mohammad Ali Abdelkareem
4,5,6 and
Mujahed Al-Dhaifallah
7,* 1
College of Engineering at Wadi Addawaser, Prince Sattam Bin Abdulaziz University, Wadi Aldawaser 11991, Saudi Arabia
2
Electrical Engineering Department, Faculty of Engineering, Minia University, Al Minya 61111, Egypt
3
Department of Mechanical Engineering, University of Engineering and Technology (UET), Lahore 39161, Pakistan
4
Department of Sustainable and Renewable Energy Engineering, University of Sharjah, Sharjah P.O. Box 27272, UAE
5
Center of Advanced Materials Research, Research Institute of Science and Engineering, University of Sharjah, Sharjah P.O. Box 27272, UAE
6
Chemical Engineering Department, Minia University, Al Minya 61111, Egypt
7
Systems Engineering Department, King Fahd University of Petroleum & Minerals, Dhahran 31261, Saudi Arabia
*
Authors to whom correspondence should be addressed.
Processes 2020, 8(8), 964; https://doi.org/10.3390/pr8080964
Submission received: 18 July 2020
/
Revised: 2 August 2020
/
Accepted: 7 August 2020
/
Published: 10 August 2020
(This article belongs to the Special Issue Design, Control and Optimization of Desalination Processes)
Abstract
:The productivity of the capacitive deionization (CDI) system is enhanced by determining the optimum operational and structural parameters using radial movement optimization (RMO) algorithm. Six different parameters, i.e., pool water concentration, freshwater recovery, salt ion adsorption, lowest concentration point, volumetric (based on the volume of deionized water), and gravimetric (based on salt removed) energy consumptions are used to evaluate the performance of the CDI process. During the optimization process, the decision variables are represented by the applied voltage, capacitance, flow rate, spacer volume, and cell volume. Two different optimization techniques are considered: single-objective and multi-objective functions. The obtained results by RMO optimizer are compared with those obtained using a genetic algorithm (GA). The results demonstrated that the RMO optimization technique is useful in exploring all possibilities and finding the optimum conditions for operating the CDI unit in a faster and accurate method.
1. Introduction
Despite the fact that water represents more than two-third of the earth, less than 1% is suitable for industrial and domestic usage [1]. The saline water represents 97% of the total water sources [2]. Therefore, water desalination is considered the best choice to secure the needs of humanity [3,4]. State-of-the-art water desalination techniques incur high energy cost, as well as high environmental impacts which are the main challenge [5,6]. Different strategies have been used like harnessing renewable energy sources [7,8,9], increasing efficiency of the existing methods [10,11], and devising new methods [12]. Capacitive deionization (CDI) is a newly developed water desalination technology for purification of river/brackish water based on electrochemical phenomena [13,14,15,16]. CDI has several advantages on other desalination techniques for its simple operation and low specific energy consumption. The salt is removed from brackish water using low voltage (~1 V), and it does not require high-pressure pumps (as in the case of the reverse osmosis (RO)) or heat source (as in the case of multi-stage flash distillation (MSF) and multiple-effect distillation (MED)). Therefore, it is an energy-efficient technology for low salinity waters. Moreover, CDI has low operational costs, thanks to its flexibility to be operated with electricity from renewable energy sources, such as solar energy, during charging. The energy recovery of up to 80% is possible during its discharge process [17,18], and under controlled conditions can be even 100% [19]. Keeping these advantages in view, CDI is considered as an emerging and promising technology. It is near to commercialization with several pilot plants under testing phase; some of them being operated with solar energy [20]. The working principle of the CDI is similar to that of a supercapacitor that involves the formation of an electrical double layer on the porous electrode as a result of applying electrical surface potential [21]. Different methods have been carried out to increase the performance of CDI, like; preparing carbon materials with high surface area and superior electrical conductivity [22,23], introducing electrode membranes [24], varying the operating conditions such as applied voltage, spacer volume, feed flow rate, electrode capacitance, and cell volume [25,26,27], and innovating the cell architectures [26]. Experimental evaluation of the CDI process is limited due to the constraints of time and resources. Mathematical models offer an effective alternative to describe and simulate the physical process, and optimize it before prototyping [28,29]. However, assumptions are made in electrical, chemical, and physical parameters to make the model solvable and hence results in decreasing the accuracy of its prediction of actual phenomena. Artificial Neural Network (ANNs) is considered as an effective method for high accuracy modeling of the processes using the available experimental data [30,31]. As stated previously, the optimization of these models is one of the effective methods that can be used to maximize the productivity of different processes with minimum time and resources [32].
Modern optimization has been used in different engineering applications, such as precision machining [33,34,35], tracking global maximum power of solar photovoltaics [36,37], biodiesel [38], and nanofluids [39]. In desalination, different optimization methods have been tested to identify the optimum design and operational parameters. For instance, Cheng et al. used the response surface methodology and desirability function approach for modeling and optimizing the vacuum membrane distillation. They demonstrated that the inlet feed temperature and its interaction with module parameters are cardinal to its performance. The process optimization resulted in simultaneous improvement in the thermal efficiency and water productivity of the system. Using the Genetic Algor43ithm, thermodynamic and economic optimization of utility steam network integrated multi-effect desalination system demonstrated a significant reduction in the period of return (from 1.03 to 0.22 years) and twice the water productivity (from 10.431 to 20.149 kg/s) [40]. Furthermore, a genetic algorithm was also used to optimize the economic and thermodynamic performance of solid oxide fuel cell/gas turbine (SOFC/GT) with and without integrated to a steam turbine (ST) (for power generation) or MED (for freshwater production). The optimization process revealed the improvement of the process in terms of the period of return by 9.88%, 6.78%, and 31.86% in the case of SOFC/GT, SOFC/GT-ST, and SOFC/GT-MED, respectively [41].
Meta-heuristic (evolutional) optimization algorithms are already being utilized to determine the best operating conditions of desalination systems. For instance, radial movement optimization (RMO) is used to identify the best operating conditions of the adsorption desalination cooling system driven by solar energy. Best operating conditions are identified for a solar-driven silica gel based adsorption desalination cooling system [9]. The optimization process demonstrated a 70% increase in water production and cooling effect. Similarly, multi-objective genetic algorithm (GA) optimization demonstrated a decrease of the product and environmental impact costs by 13.4% and 53.4%, when applied on an MSF desalination unit integrated with a gas turbine [42].
Similarly, in our previous study, the performance of the CDI system was evaluated against operational and structural parameters [43]. Based on the performance evaluation results, the genetic algorithm (GA) was adopted to improve the performance of CDI. Two types of optimization techniques were recommended based on the CDI desalination requirements: single objective optimization for single cost functions and multi-objective optimization for multiple cost functions, both subjected to multiple constrained variables [43]. Through this GA optimization, the performance of the CDI desalination process was improved from 15% to 92% with single objective optimization and from 1% to 75% with multi-objective optimization. The objective (cost) functions consisted of lowest concentration, pool water concentration, salt ion adsorption, freshwater recovery, energy consumption per liter, and energy consumption per gram. However, some limitations had been experienced with GA, such as in all the cases of multi-objective optimization, the optimized solution had to be manually selected from the Pareto optimal front. This was a major shortcoming in terms of objective-based optimization to find a feasible solution according to our required goals. To overcome this drawback, RMO is utilized in this manuscript to obtain the optimal solution set automatically. The same mathematical model and cost functions, as used in our previous paper [43], are adopted and optimized through RMO method. The results obtained are compared with the result of GA optimization of the previous paper.
2. Mathematical Model of Capacitive Deionization
The CDI cell operation is a dynamic phenomenon: the effluent concentration changes from maximum to minimum and repeats itself in cyclic manner. There are two developed modes of operation i.e., Constant Voltage (CV) [44] and Constant Current (CC) [45], and a novel hybrid CV-CC mode [46]. Biesheuvel et al. [47] demonstrated a well matching between the Gouy-Chapman-Stern (GCS) model for CDI that describes the charge and ions adsorption capacity with current and the effluent ion concentrations measured experimentally.
CV process was developed at the first stage, because it is the basic mode of capacitor operation, and later on the CC process was developed. Afterwards, based on CV and CC processes, Hybrid CV-CC process was developed, according to the water purification requirements. Therefore, in this paper and in our previous paper, CV process was considered as a base process for the performance evaluation and optimization. In a complete cycle of CDI, there are two processes: adsorption and desorption [44].
Adsorption process provides deionized water stream at outlet by absorbing the salt ions from the inlet water stream and storing them in electrically polarized porous electrodes. The effluent purified water stream concentration with respect to the cycle time during the adsorption of the CV process is measured by [44].
where , and all other parameters used are reported in Table 1. The effluent concentration () given by this equation is time dependent and changes from maximum to minimum, until, no more ions can be adsorbed. The model works by subtracting the absorbed salt from the influent concentration. Furthermore, as the above equation indicates, number of ions adsorbed and thus the effluent concentration varies with the capacitance (C) of the cell. After voltage is applied across the cell, and the charges begin to store in the porous electrodes, they attract the ions from the feed solution. When no more ions can be stored, the effluent concentration starts increasing, and ultimately becomes equal to influent concentration. Now the electrodes are said to be saturated.
Therefore, to further purify the inlet water, electrodes are regenerated. The regeneration of electrodes is known as the desorption process. During this process, the applied voltage is reversed or zero, due to which, the adsorbed ions are desorbed. The effluent concentration stream with respect to the cycle time during the desorption process of CDI for the CV process can be measured [44] by:
where , is the CDI cell voltage at the time of adsorption process completion and all other parameters used are reported in Table 1. As the electrodes are full with change and reverse or zero potential is applied, the already stored charges start moving out of electrodes steadily. While there are no opposite charges to hold the ions in electrodes, to ion starts flowing with the regenerative inlet stream, eventually, electrodes are regenerated. During regeneration, effluent concentration during desorption () varies with time and has values greater than inlet concentration (). The regeneration process is also function of capacitance along with other parameters mentioned in Table 1.
3. Performance Criterion
The output of the CDI system can be measured with reference to the purified water concentration, water recovery, salt ions adsorption, and specific energy consumption.
For the purified water concentration, the salt concentration in the effluent water for the complete adsorption process is accumulated in separate tank. It measured for a specific duration of time to get the average accumulated concentration of desalinated water, which is known as pool water concentration [43]. Equation (3) represents the pool water concentration. It is time dependent, and other operational parameters governing the pool water concentration (from Equation (3)) are inlet feed concentration, spacer volume, capacitance, applied voltage, and flowrate.
Water recovery is another criterion used to evaluate the performance of the desalination system. Water recovery is the ratio of water purified during the adsorption process to the total amount of water supplied for the complete cycle (adsorption process + desorption process). However, in this manuscript, the term freshwater recovered is used, which is the product of the inlet flow rate and the adsorption time of the CDI cycle, given in Equation (4). This formulation of freshwater recovery is specifically adopted in this manuscript for performance evaluation and optimization. This performance metric is important to compare the same system by varying the input parameters. Further, this equation provides an opportunity for optimization and results will be compared before and after optimization for the same system. However, in the general desalination process, water recovery is the evaluation criterion.
The working principle of CDI is based on the adsorption of the salt ions into the porous electrodes to produce deionized water as a product. Therefore, salt ions adsorption is also a performance evaluation criterion for the CDI process. The following mathematical equation is derived in reference [43] to measure the salt ions adsorption in the porous electrodes.
where is the molecular weight of NaCl. Moreover, the salt absorption is a function of flowrate (), and summation of effluent concentration within the time interval starting from initial time (tin) to end of adsorption (tad).
Energy consumption is a basic criterion that is generally used to check the performance of an electrically or mechanically powered systems. In this manuscript, the specific energy consumption of the CDI system is evaluated and optimized. Specific energy consumption in terms of a liter of freshwater recovered, and a gram of salt ions adsorbed is measured with Equations (6) and (7), respectively.
The operational dynamics and constraints of these equation are taken from [43,46]. Energy consumed per liter gives the energy for a liter of water desalinated, and not the liter of water supplied to the cell. Similarly, the energy consumed per gram gives the energy required to absorb a gram of salt out of water stream.
4. Performance Evaluation
From Equations (2) to (6), one may see that the output of the CDI system depends on different operational and structural parameters such as spacer volume, cell volume, applied voltage, capacitance, and flow rate. Figure 1 and Figure 2 evaluate the CDI performance for different operating parameters.
Figure 1 shows the impact of electrode capacitance and spacer volume on the performance of the CDI cell with all other operating parameters are constant and the same as mentioned in references [43,47]. As evident in the figure, the increase of the electrode capacitance generally resulted in increasing the cell performance in terms of decreased specific energy consumption (per liter or per gram of salt), increased freshwater productivity, salt ion removal, and the minimum exit water concentration. However, the increase in the spacer volume has a negative effect on all of these performance metrics.
Figure 2 shows the effect of applied voltage and flow rate on the performance of the CDI cell. As is obvious from the figure, increasing the applied voltage has a positive effect on the CDI performance in terms of decreasing the exit water concentration during the adsorption process, increasing the freshwater productivity, and increasing salt ion removal. While, at the same time, increasing the applied voltage negatively affects the CDI’s performance with the increase in the specific energy consumption. On the other hand, the increase of the feed flow rate has a positive effect in terms of decreasing the specific energy consumption and increasing both freshwater production and salt ion removal, while it has an adverse effect in terms of lowest concentration and pool water concentration. This compliance with the fact, that with the increase of flow rate, the resident time of the salt ions in the CDI cell reduced which results in the pass of ions through the cell without adsorbing and produced a high concentration effluent. This also increased the overall concentration of the accumulated produced water.
5. Performance Optimization
Variation of the performance with the change of input operating variables, as shown in Figure 1 and Figure 2, urges the need of optimization to decide the best-operating conditions at which the improved CDI performance could be achieved. Although we have done the optimization of such variables in our previous study using GA [43], however, the followings discrepancies were encountered.
1. The optimization solution was extracted manually from the Pareto optimal front in the case of multi-objective optimization.
2. The goal-based solution was not possible to determine directly. Instead, the solution was sorted manually based on our requirements from the optimal solution set obtained through GA optimization.
Therefore, radial movement optimization (RMO) is utilized in this manuscript to rectify the deficiencies reported above. RMO belongs to the class of metaheuristic algorithms as GA, but it uses the concept of memory, which is important to the algorithm. In RMO, the update of the next particle’s position is based on the knowledge of the past particle’s position, which is different from GA that uses genetic operators like crossover and mutation for updating the position. It escapes from falling in local optima and robustly discovers the global optimum. The mathematical representation of RMO is explained in detail in [48,49,50].
The governing relations of the CDI performance are utilized as the objective functions for the optimization and shown in Table 2.
The performance functions utilized here are based on the following:
Lowest concentration point:
The lowest concentration point is specific only for CV process of CDI, which defines the maximum absorption of salt ions at that particular time.
Pool water concentration:
It is a performance indicator that can be used for desalination where the effluent purified concentration is not constant and varies with time, such as in CDI desalination system.
Salt ion adsorption:
Salt adsorption is general performance measures used for CDI to indicate how many salt ions are adsorbed in a specific cycle.
Specific energy consumption:
Specific energy consumption in terms of gram is utilized for CDI to calculate energy consumption for one gram of salt ion removal. This energy consumption indicator is a very important criteria to evaluate and optimize the performance of the CDI system.
Similarly, energy consumption per liter is the type of specific energy consumption performance indicator which can be used to compare the different desalination technologies (such as RO, CDI, FO, and MD) in terms of energy required to obtain one liter of freshwater.
Freshwater recovery:
The freshwater production criterion is somehow similar to the water recovery performance indicator. It is specifically used here to check the CDI performance before and after optimization, to indicate how much freshwater production in terms of liter will be increased after the optimization.
RMO is used to optimize the CDI performance under different five constrained operating parameters, i.e., spacer volume, capacitance, applied voltage, flow rate, and cell volume, as shown in Table 3. The constraints are based on system limitations and very well reported in ref. [43]. As stated earlier, this is an extension of previously published work [43]; therefore, the same input parameters are used as in previous paper to make a comparison between RMO and GA optimization.
Two types of optimization are adopted in this manuscript to improve the performance of the CDI process: single objective and multi-objective. In single-objective optimization, each single-objective was optimized individually using the five operating parameters as decision variables, mentioned in Table 2. Hence, specific performance was optimized regardless of the other performance criteria. Furthermore, simultaneous optimization of all the performance functions was obtained using the multi-objective optimization where an acceptable solution that satisfies all the objective functions was generated. According to the number of constraints applied, there are single-constrained multi-objective function (SCMOF) optimization and multi-constrained multi-objective functions (MCMOF) optimization. In SCMOF, only a single decision variable is used for optimizing all the objective functions, and all other variables are kept constant. While, in MCMOF optimization, several decision variables are used for optimizing the objective functions. In general, SCMOF is used when only one operating parameters are allowed to change for enhancing the system performance, while MCMOF is used when more than one operating parameters are allowed to change for optimizing the performance of the system. In the current study, single-objective optimization and multi-objective optimization techniques both using multiple constraints are applied for optimizing the CDI performance. The mathematical expression of a single objective and multi-objective optimization is as follows. It can be observed in both mathematical expressions that Y5 and Y6 both have only three decision variables as compared with other objective functions. This is because the CDI cell performance function corresponding to the objective functions Y5 and Y6 are not dependent on the spacer and cell volume.
Single and multi-objective optimization with multiple constraints:
6. Results and Discussion
The parameters of the RMO algorithm and their values are tabulated in Table 4.
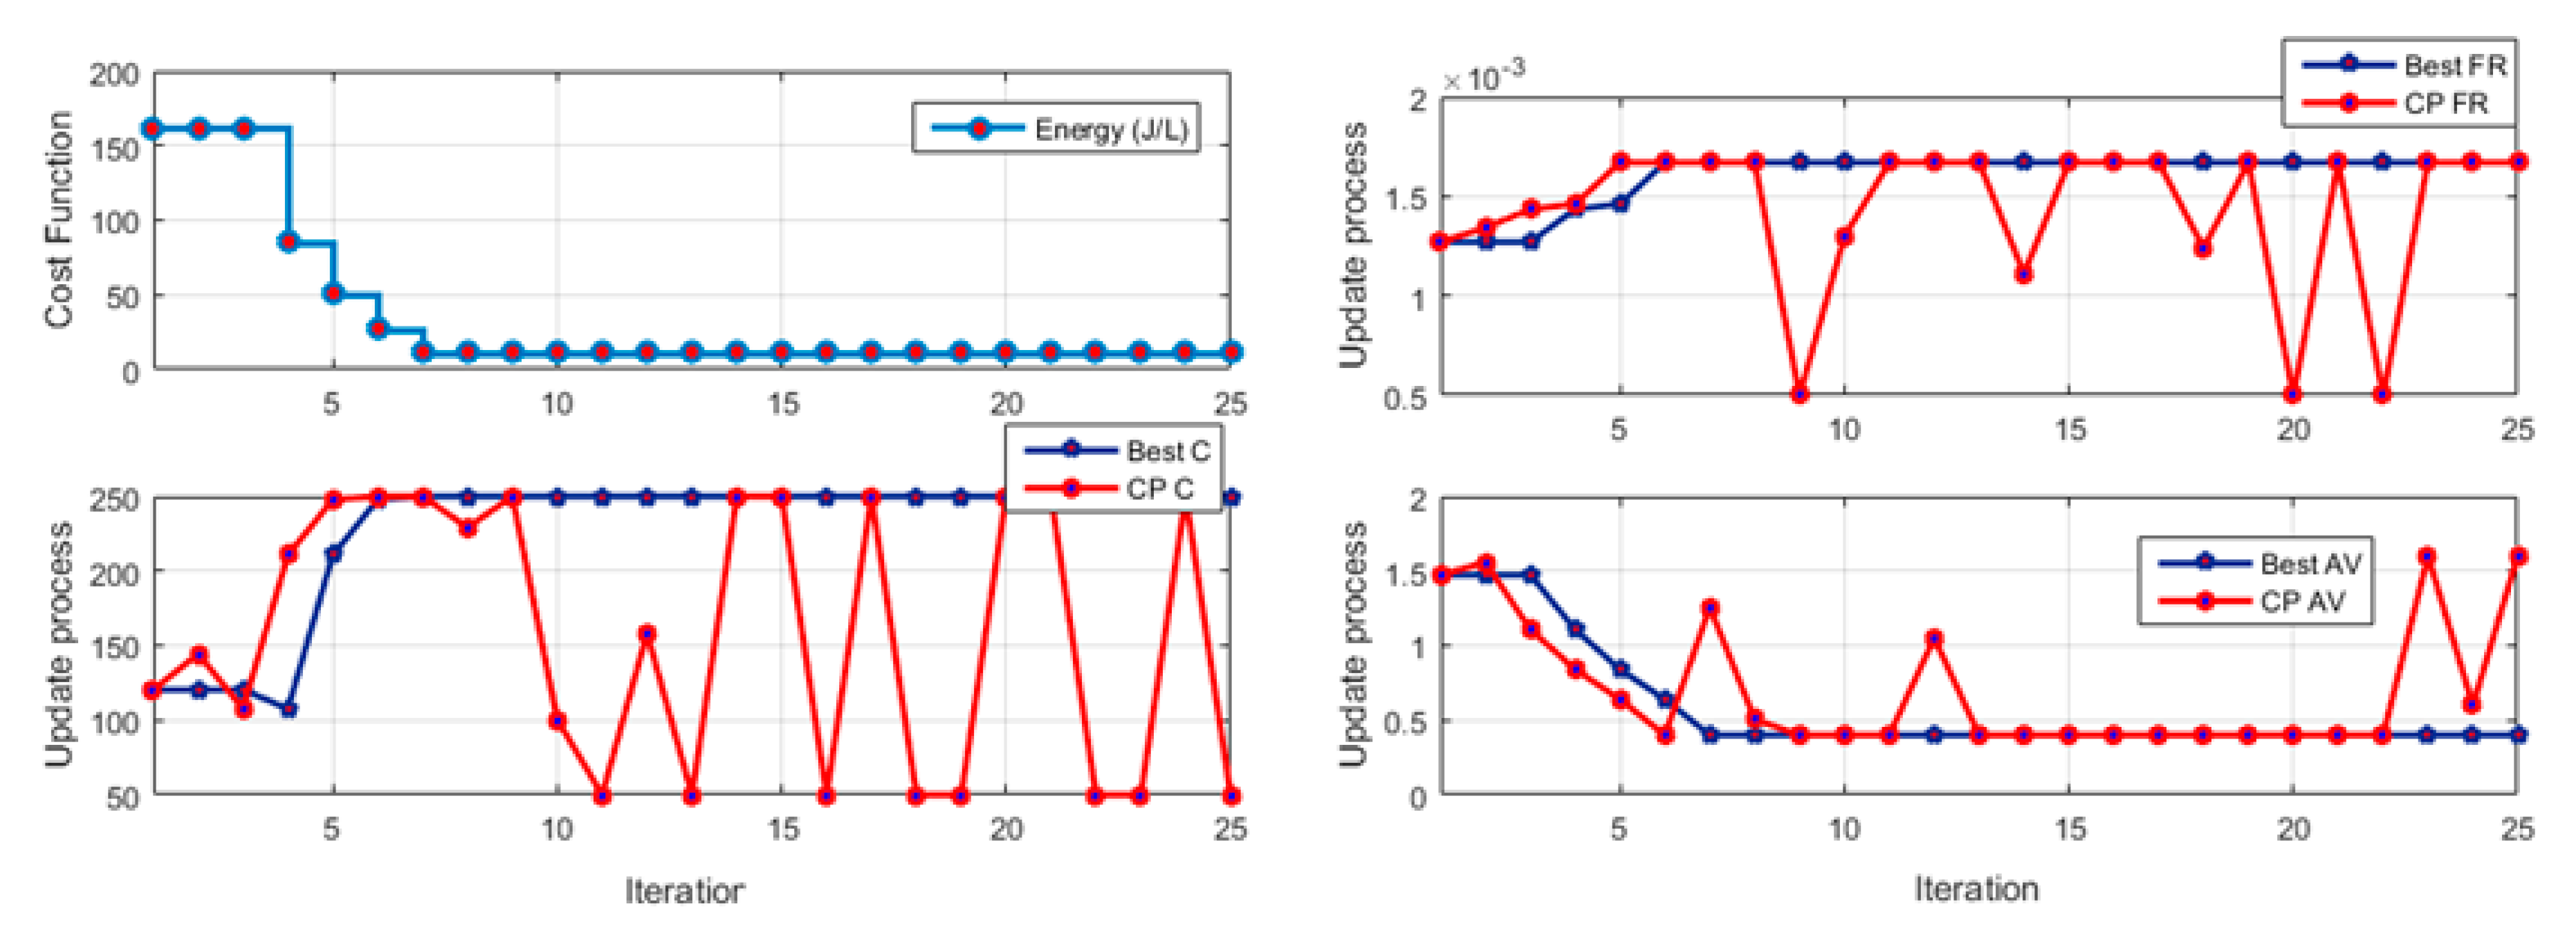
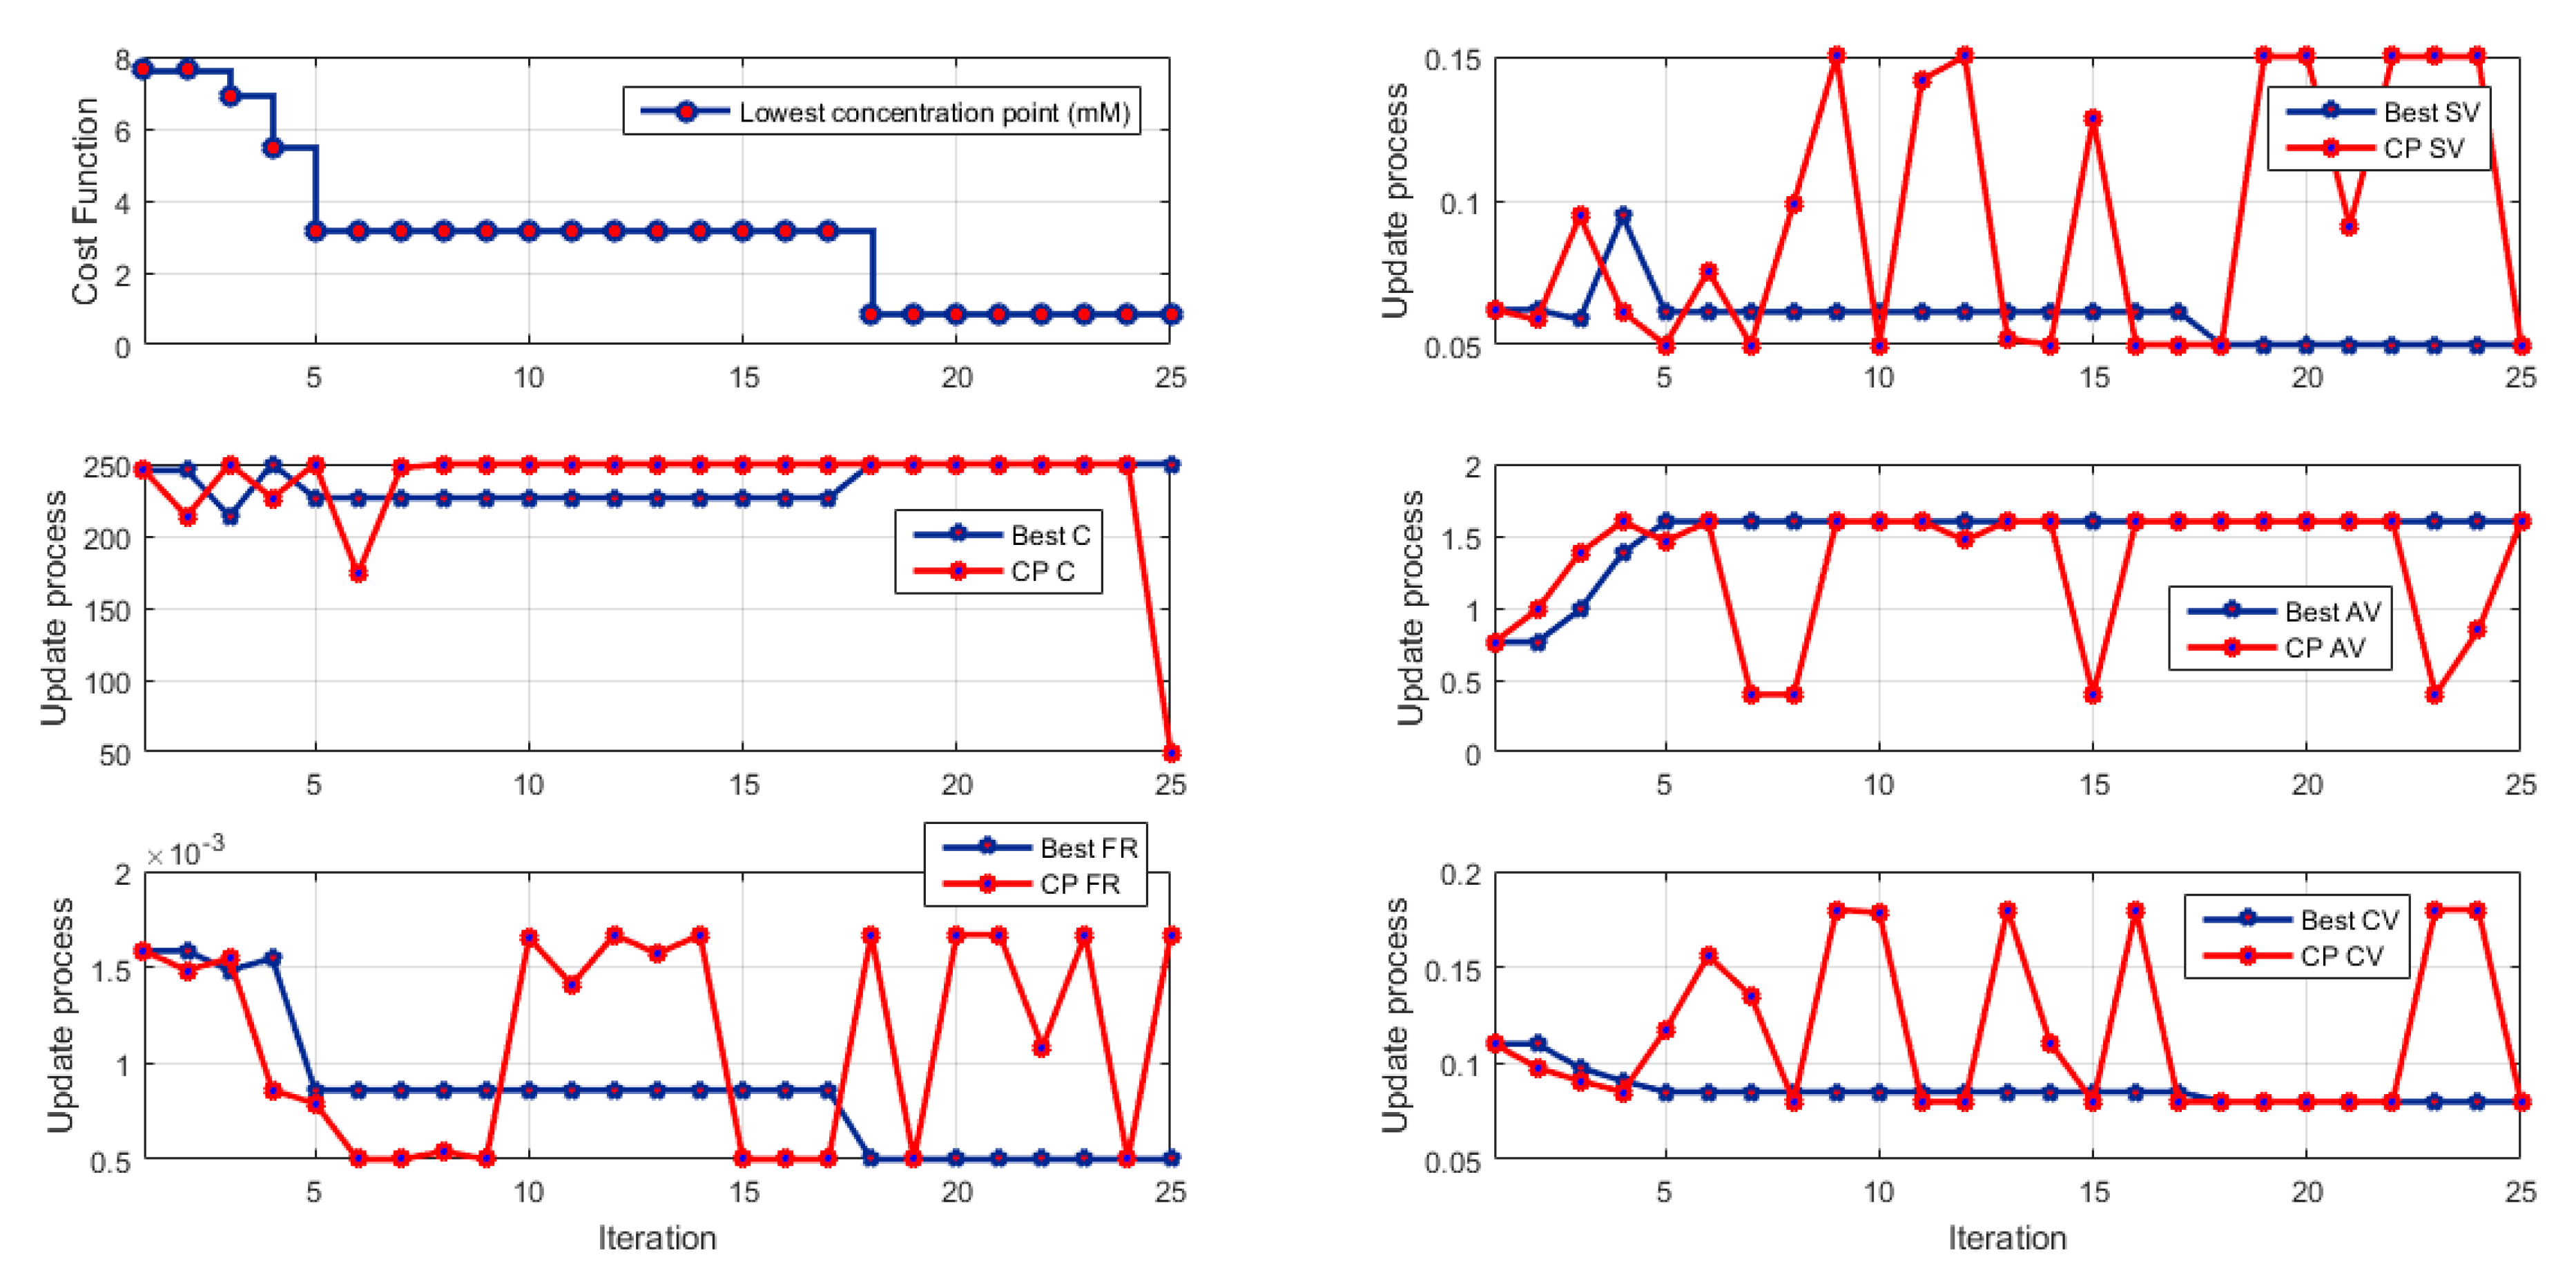
Figure 3, Figure 4, Figure 5, Figure 6, Figure 7 and Figure 8 show the cost function variation and best values of decision variables during the single objective optimization process, respectively, for specific energy consumption (per gram and liter), freshwater recovered, lowest concentration point, pool water concentration, and salt ion adsorption. The results demonstrated a decrease in the specific energy consumption during the optimization process (Figure 3a and Figure 4) that would be related to corresponding decision variables such as a decrease of spacer volume (SV) in Figure 3b, increase of the capacitance (C) in Figure 3c, a decrease in the applied voltage (AV) in Figure 3d, an increase in the feed flow rate (FR) in Figure 3e, and decrease of the cell volume (CV) in Figure 3f. Additionally, the optimization process revealed an increase in freshwater productivity (Figure 5), due to the increase of the capacitance and the flow rate with a higher applied voltage. Figure 6 and Figure 7 show a decrease in the lowest concentration point and pool water concentration due to the increase of capacitance and applied voltage with the decrease of the spacer volume, cell volume, and flow rate. Figure 8 shows an increase in the salt ions removal due to the increase of the capacitance and flow rate along with the decrease of spacer volume, cell volume, and applied voltage.
Table 5 summarizes the results of the single objective-based optimization for multiple constrained operating parameters. In this table, the optimized performance functions result obtained through RMO are compared with the optimized result obtained through GA of our previous paper [43] and with the performance values without optimization. It can be observed from the table that the improved result is obtained through RMO as compared with the result obtained from the GA of Matlab. For instance, compared to the results obtained using GA [43], specific energy consumption (J/g) decreased by 5.6%, freshwater productivity (L) increased by 25%, salt ion adsorption increased by 32%, pool water concentration (ppm) decreased by 5.6%. The lowest concentration point (mM) decreased by 65%.
The simultaneous optimization of all of the parameters is shown in Figure 9. The optimization results, in general, improve the process in terms of an increase of the capacitance, spacer volume, and flow rate along with the decrease of applied voltage and cell volume. Table 6 compared the result of the optimized performance of CDI obtained from RMO with the result derived from Pareto optimal solution set of GA for four different cases. The result of GA was taken from Table 6 of our previous published paper [43]. In general, the results obtained by the RMO is better than the best results obtained (case No.2) by the GA. Even the energy consumption per liter (Y5) and freshwater recovered (Y6) were also optimized through multi-objective optimization in RMO, which was not possible in GA multi-objective optimization because comparatively fewer decision variables are utilized in Y5 and Y6. Moreover, another advantage of RMO is that the optimal parameters are generated automatically, and there is no need for manual sorting that was done in the case of GA multi-objective optimization [43]. Therefore, it can be stated that RMO is better to obtain the goal-based single optimal solution.
The performance metrics used in this study are specified in the CV process of CDI. Therefore, this was slightly different from Hawks et al. [51] who defined generalized performance metrics (productivity, volume-averaged salt removal, volumetric energy consumption, and water recovery ratio) of CDI system for comparison with other desalination technologies.
Although fuzzy modeling is an effective and accurate method that proved a success in several applications, the main limitations of it that its accuracy depends on the accuracy and number of the experimental trails done. Therefore, some variations can be found from one study to another. However, fussy modeling is an acceptable and reliable modeling tool for most of the researchers which is clear from the exponential growth in its application in different fields.
7. Conclusions
Improving the performance of the capacitive deionization desalination (CDI) system was the essential objective of this research. Using the experimental data, a mathematical model was proposed and applied for the CDI system. RMO is used for optimizing the performance based on the different operating and structural parameters of the CDI system, such as spacer volume, capacitance, applied voltage, flow rate, and cell volume. The performance of the CDI system is evaluated through six different parameters: lowest concentration point, pool water concentration, energy consumption per liter, energy consumption per gram, salt ion adsorption, and freshwater recovery. Two different optimization techniques were considered: single-objective and multi-objective functions. The obtained results by RMO optimizer were compared with those obtained by the genetic algorithm (GA). The result showed a performance improvement from 5.6% to 65% in the case of single-objective optimization. Similarly, in the case of multi-objective optimization, RMO shows overall improved results as compared to GA. Furthermore, RMO optimization also overcame the deficiencies surfaced during the GA optimization. Thus, the above-discussed findings demonstrated the effectiveness of optimization techniques in exploring all possible conditions and determining the best one for the operation of the CDI system.
Author Contributions
Conceptualization, H.R., M.W.S., M.A.A., and M.A.-D.; methodology, H.R., M.W.S., and M.A.A.; formal analysis, H.R., M.W.S., M.A.A., and M.A.-D.; investigation, H.R., M.W.S., and M.A.-D.; resources, M.W.S., and M.A.; data curation, H.R., and M.W.S.; writing—original draft preparation, H.R., M.W.S., M.A.A., and M.A.-D.; writing—review and editing, H.R., M.W.S., M.A.A., and M.A.-D. All authors have read and agreed to the published version of the manuscript.
Funding
This research received no external funding.
Conflicts of Interest
The authors declare no conflict of interest.
References
- Abdelkareem, M.A.; El Haj Assad, M.; Sayed, E.T.; Soudan, B. Recent progress in the use of renewable energy sources to power water desalination plants. Desalination 2018, 435, 97–113. [Google Scholar] [CrossRef]
- Manju, S.; Sagar, N. Renewable energy integrated desalination: A sustainable solution to overcome future fresh-water scarcity in India. Renew. Sustain. Energy Rev. 2017, 73, 594–609. [Google Scholar] [CrossRef]
- Goh, P.S.; Ismail, A.F. Review: Is interplay between nanomaterial and membrane technology the way forward for desalination? J. Chem. Technol. Biotechnol. 2015, 90, 971–980. [Google Scholar] [CrossRef]
- Vane, L.M. Water recovery from brines and salt-saturated solutions: Operability and thermodynamic efficiency considerations for desalination technologies. J. Chem. Technol. Biotechnol. 2017, 92, 2506–2518. [Google Scholar] [CrossRef] [PubMed]
- Elsaid, K.; Sayed, E.T.; Abdelkareem, M.A.; Baroutaji, A.; Olabi, A.G. Environmental impact of desalination processes: Mitigation and control strategies. Sci. Total Environ. 2020, 740, 140125. [Google Scholar] [CrossRef]
- Elsaid, K.; Sayed, E.T.; Abdelkareem, M.A.; Mahmoud, M.S.; Ramadan, M.; Olabi, A.G. Environmental impact of emerging desalination technologies: A preliminary evaluation. J. Environ. Chem. Eng. 2020, 8, 104099. [Google Scholar] [CrossRef]
- Rezk, H.; Abdelkareem, M.A.; Ghenai, C. Performance evaluation and optimal design of stand-alone solar PV-battery system for irrigation in isolated regions: A case study in Al Minya (Egypt). Sustain. Energy Technol. Assess. 2019, 36, 100556. [Google Scholar] [CrossRef]
- Rezk, H.; Sayed, E.T.; Al-Dhaifallah, M.; Obaid, M.; El-Sayed, A.H.M.; Abdelkareem, M.A.; Olabi, A.G. Fuel cell as an effective energy storage in reverse osmosis desalination plant powered by photovoltaic system. Energy 2019, 175, 423–433. [Google Scholar] [CrossRef] [Green Version]
- Rezk, H.; Alsaman, A.S.; Al-Dhaifallah, M.; Askalany, A.A.; Abdelkareem, M.A.; Nassef, A.M. Identifying optimal operating conditions of solar-driven silica gel based adsorption desalination cooling system via modern optimization. Sol. Energy 2019, 181, 475–489. [Google Scholar] [CrossRef]
- Elsaid, K.; Taha Sayed, E.; Yousef, B.A.A.; Kamal Hussien Rabaia, M.; Ali Abdelkareem, M.; Olabi, A.G. Recent progress on the utilization of waste heat for desalination: A review. Energy Conver. Manag. 2020, 221, 113105. [Google Scholar] [CrossRef]
- Olabi, A.G.; Elsaid, K.; Rabaia, M.K.H.; Askalany, A.A.; Abdelkareem, M.A. Waste heat-driven desalination systems: Perspective. Energy 2020. [Google Scholar] [CrossRef]
- Sayed, E.T.; Shehata, N.; Abdelkareem, M.A.; Atieh, M.A. Recent progress in environmentally friendly bio-electrochemical devices for simultaneous water desalination and wastewater treatment. Sci. Total Environ. 2020. [Google Scholar] [CrossRef]
- Liu, X.; Chen, T.; Qiao, W.-C.; Wang, Z.; Yu, L. Fabrication of graphene/activated carbon nanofiber composites for high performance capacitive deionization. J. Taiwan Inst. Chem. Eng. 2017, 72, 213–219. [Google Scholar] [CrossRef]
- Duan, X.; Liu, W.; Chang, L. Porous carbon prepared by using ZIF-8 as precursor for capacitive deionization. J. Taiwan Inst. Chem. Eng. 2016, 62, 132–139. [Google Scholar] [CrossRef]
- Moustafa, H.M.; Obaid, M.; Nassar, M.M.; Abdelkareem, M.A.; Mahmoud, M.S. Titanium dioxide-decorated rGO as an effective electrode for ultrahigh-performance capacitive deionization. Sep. Purif. Technol. 2020, 235, 116178. [Google Scholar] [CrossRef]
- Moustafa, H.M.; Nassar, M.M.; Abdelkareem, M.A.; Mahmoud, M.S.; Obaid, M. Synthesis and characterization of Co and Titania nanoparticle -intercalated rGO as a high capacitance electrode for CDI. J. Environ. Chem. Eng. 2019, 7, 103441. [Google Scholar] [CrossRef]
- Pernía, A.M.; Norniella, J.G.; Martín-Ramos, J.A.; Díaz, J.; Martínez, J.A. Up–down converter for energy recovery in a CDI desalination system. IEEE Trans. Power Electron. 2012, 27, 3257–3265. [Google Scholar] [CrossRef]
- Oyarzun, D.I.; Hawks, S.A.; Campbell, P.G.; Hemmatifar, A.; Krishna, A.; Santiago, J.G.; Stadermann, M. Energy transfer for storage or recovery in capacitive deionization using a DC-DC converter. J. Power Sources 2020, 448, 227409. [Google Scholar] [CrossRef]
- Pernia, A.; Alvarez-Gonzalez, F.J.; Prieto, M.A.; Villegas, P.J.; Nuno, F. New Control Strategy of an Up–Down Converter for Energy Recovery in a CDI Desalination System. IEEE Trans. Power Electron. 2014, 29, 3573–3581. [Google Scholar] [CrossRef]
- Tan, C.; He, C.; Tang, W.; Kovalsky, P.; Fletcher, J.; Waite, T.D. Integration of photovoltaic energy supply with membrane capacitive deionization (MCDI) for salt removal from brackish waters. Water Res. 2018, 147, 276–286. [Google Scholar]
- Hassanvand, A.; Chen, G.Q.; Webley, P.A.; Kentish, S.E. A comparison of multicomponent electrosorption in capacitive deionization and membrane capacitive deionization. Water Res. 2018, 131, 100–109. [Google Scholar] [CrossRef] [PubMed] [Green Version]
- Li, H.; Ma, Y.; Niu, R. Improved capacitive deionization performance by coupling TiO2 nanoparticles with carbon nanotubes. Sep. Purif. Technol. 2016, 171, 93–100. [Google Scholar] [CrossRef]
- Roslan, N.; Ya’acob, M.E.; Radzi, M.A.M.; Hashimoto, Y.; Jamaludin, D.; Chen, G. Dye Sensitized Solar Cell (DSSC) greenhouse shading: New insights for solar radiation manipulation. Renew. Sustain. Energy Rev. 2018, 92, 171–186. [Google Scholar] [CrossRef]
- Uzun, H.I.; Debik, E. Economical approach to nitrate removal via membrane capacitive deionization. Sep. Purif. Technol. 2019, 209, 776–781. [Google Scholar] [CrossRef]
- Lu, D.; Cai, W.; Wang, Y. Optimization of the voltage window for long-term capacitive deionization stability. Desalination 2017, 424, 53–61. [Google Scholar] [CrossRef]
- Tang, W.; Liang, J.; He, D.; Gong, J.; Tang, L.; Liu, Z.; Wang, D.; Zeng, G. Various cell architectures of capacitive deionization: Recent advances and future trends. Water Res. 2019, 150, 225–251. [Google Scholar] [CrossRef]
- Dykstra, J.; Porada, S.; Van Der Wal, A.; Biesheuvel, P. Energy consumption in capacitive deionization–Constant current versus constant voltage operation. Water Res. 2018, 143, 367–375. [Google Scholar]
- Wang, J.; Yao, J.; Wang, L.; Xue, Q.; Hu, Z.; Pan, B. Multivariate optimization of the pulse electrochemical oxidation for treating recalcitrant dye wastewater. Sep. Purif. Technol. 2019. [Google Scholar] [CrossRef]
- Estupiñan Perez, L.; Sarkar, P.; Rajendran, A. Experimental validation of multi-objective optimization techniques for design of vacuum swing adsorption processes. Sep. Purif. Technol. 2019, 224, 553–563. [Google Scholar] [CrossRef]
- Nassef, A.M.; Fathy, A.; Sayed, E.T.; Abdelkareem, M.A.; Rezk, H.; Tanveer, W.H.; Olabi, A. Maximizing SOFC Performance through Optimal Parameters Identification by Modern Optimization Algorithms. Renew. Energy 2019, 138, 458–464. [Google Scholar] [CrossRef]
- Brar, L.S.; Elsayed, K. Analysis and optimization of cyclone separators with eccentric vortex finders using large eddy simulation and artificial neural network. Sep. Purif. Technol. 2018, 207, 269–283. [Google Scholar] [CrossRef]
- Rezk, H.; Nassef, A.M.; Inayat, A.; Sayed, E.T.; Shahbaz, M.; Olabi, A. Improving the environmental impact of palm kernel shell through maximizing its production of hydrogen and syngas using advanced artificial intelligence. Sci. Total Environ. 2019, 658, 1150–1160. [Google Scholar] [CrossRef] [PubMed]
- Rao, R.V.; Rai, D.P.; Balic, J. A multi-objective algorithm for optimization of modern machining processes. Eng. Appl. Artif. Intell. 2017, 61, 103–125. [Google Scholar] [CrossRef]
- Rao, R.V.; Rai, D.P.; Balic, J. Multi-objective optimization of machining and micro-machining processes using non-dominated sorting teaching–learning-based optimization algorithm. J. Intell. Manuf. 2018, 29, 1715–1737. [Google Scholar] [CrossRef]
- Rao, R.V.; Rai, D.P.; Balic, J. Multi-objective optimization of abrasive waterjet machining process using Jaya algorithm and PROMETHEE Method. J. Intell. Manuf. 2019, 30, 2101–2127. [Google Scholar] [CrossRef]
- Rezk, H.; Al-Oran, M.; Gomaa, M.R.; Tolba, M.A.; Fathy, A.; Abdelkareem, M.A.; Olabi, A.G.; El-Sayed, A.H.M. A novel statistical performance evaluation of most modern optimization-based global MPPT techniques for partially shaded PV system. Renew. Sustain. Energy Rev. 2019, 115, 109372. [Google Scholar] [CrossRef]
- Abdalla, O.; Rezk, H.; Ahmed, E.M. Wind driven optimization algorithm based global MPPT for PV system under non-uniform solar irradiance. Sol. Energy 2019, 180, 429–444. [Google Scholar] [CrossRef]
- Nassef, A.M.; Sayed, E.T.; Rezk, H.; Abdelkareem, M.A.; Rodriguez, C.; Olabi, A. Fuzzy-modeling with Particle Swarm Optimization for enhancing the production of biodiesel from Microalga. Energy Sources Part A Recover. Util. Environ. Eff. 2019, 41, 2094–2103. [Google Scholar] [CrossRef]
- Said, Z.; Abdelkareem, M.A.; Rezk, H.; Nassef, A.M. Fuzzy modeling and optimization for experimental thermophysical properties of water and ethylene glycol mixture for Al2O3 and TiO2 based nanofluids. Powder Technol. 2019, 353, 345–358. [Google Scholar] [CrossRef]
- Salimi, M.; Akbarpour Reyhani, H.; Amidpour, M. Thermodynamic and economic optimization of multi-effect desalination unit integrated with utility steam network. Desalination 2018, 427, 51–59. [Google Scholar] [CrossRef]
- Reyhani, H.A.; Meratizaman, M.; Ebrahimi, A.; Pourali, O.; Amidpour, M. Thermodynamic and economic optimization of SOFC-GT and its cogeneration opportunities using generated syngas from heavy fuel oil gasification. Energy 2016, 107, 141–164. [Google Scholar] [CrossRef]
- Hosseini, S.R.; Amidpour, M.; Shakib, S.E. Cost optimization of a combined power and water desalination plant with exergetic, environment and reliability consideration. Desalination 2012, 285, 123–130. [Google Scholar] [CrossRef]
- Saleem, M.W.; Kim, W.-S. Parameter-based performance evaluation and optimization of a capacitive deionization desalination process. Desalination 2018, 437, 133–143. [Google Scholar] [CrossRef]
- Jande, Y.A.C.; Kim, W.S. Predicting the lowest effluent concentration in capacitive deionization. Sep. Purif. Technol. 2013, 115, 224–230. [Google Scholar] [CrossRef]
- Zhao, R.; Biesheuvel, P.; Van der Wal, A. Energy consumption and constant current operation in membrane capacitive deionization. Energy Environ. Sci. 2012, 5, 9520–9527. [Google Scholar] [CrossRef] [Green Version]
- Saleem, M.W.; Jande, Y.A.C.; Asif, M.; Kim, W.-S. Hybrid CV-CC operation of capacitive deionization in comparison with constant current and constant voltage. Sep. Sci. Technol. 2016, 51, 1063–1069. [Google Scholar] [CrossRef]
- Zhao, R.; Biesheuvel, P.M.; Miedema, H.; Bruning, H.; van der Wal, A. Charge Efficiency: A Functional Tool to Probe the Double-Layer Structure Inside of Porous Electrodes and Application in the Modeling of Capacitive Deionization. J. Phys. Chem. Lett. 2010, 1, 205–210. [Google Scholar] [CrossRef]
- Seyedmahmoudian, M.; Horan, B.; Soon, T.K.; Rahmani, R.; Oo, A.M.T.; Mekhilef, S.; Stojcevski, A. State of the art artificial intelligence-based MPPT techniques for mitigating partial shading effects on PV systems–A review. Renew. Sustain. Energy Rev. 2016, 64, 435–455. [Google Scholar] [CrossRef]
- Vanithasri, M.; Balamurugan, R.; Lakshminarasimman, L. Radial movement optimization (RMO) technique for solving unit commitment problem in power systems. J. Electr. Syst. Inf. Technol. 2018, 5, 697–707. [Google Scholar]
- Al-Dhaifallah, M.; Nassef, A.M.; Rezk, H.; Nisar, K.S. Optimal parameter design of fractional order control based INC-MPPT for PV system. Sol. Energy 2018, 159, 650–664. [Google Scholar] [CrossRef]
- Hawks, S.A.; Ramachandran, A.; Porada, S.; Campbell, P.G.; Suss, M.E.; Biesheuvel, P.; Santiago, J.G.; Stadermann, M. Performance metrics for the objective assessment of capacitive deionization systems. Water Res. 2019, 152, 126–137. [Google Scholar] [PubMed]
Figure 1.
Impact of capacitance and spacer volume upon the CDI performance. While other operating parameters are constant as; flow rate: 60 mL/min, applied voltage: 1.2 V, Cell volume: 100 mL, feed concentration: 10 mM [47].
Figure 1.
Impact of capacitance and spacer volume upon the CDI performance. While other operating parameters are constant as; flow rate: 60 mL/min, applied voltage: 1.2 V, Cell volume: 100 mL, feed concentration: 10 mM [47].

Figure 2.
Impact of applied voltage and flow rate upon CDI performance. While other operating parameters are constant; Capacitance: 200 F, Cell volume: 100 mL, feed concentration: 10 mM [47].
Figure 2.
Impact of applied voltage and flow rate upon CDI performance. While other operating parameters are constant; Capacitance: 200 F, Cell volume: 100 mL, feed concentration: 10 mM [47].

Figure 3.
The cost function variation, best values of decision variables during the optimization process of energy per gram. Note: C is the capacitance, CP is the center point, FR is the flow rate, SV is the spacer volume, AV is the applied voltage, and CV is the cell volume. (a) the specific energy consumption during the optimization process; (b) a decrease of SV; (c) increase of the C; (d) a decrease in the AV; (e) an increase in the FR; (f) decrease of the CV.

Figure 4.
The cost function variation, best values of decision variables during the optimization process of energy consumption per liter. C is the capacitance, CP is the center point, FR is the flow rate, SV is the spacer volume, AV is the applied voltage, and CV is the cell volume.
Figure 4.
The cost function variation, best values of decision variables during the optimization process of energy consumption per liter. C is the capacitance, CP is the center point, FR is the flow rate, SV is the spacer volume, AV is the applied voltage, and CV is the cell volume.

Figure 5.
The cost function variation, best values of decision variables during the optimization process of fresh water. C is the capacitance, CP is the center point, FR is the flow rate, SV is the spacer volume, AV is the applied voltage, and CV is the cell volume.
Figure 5.
The cost function variation, best values of decision variables during the optimization process of fresh water. C is the capacitance, CP is the center point, FR is the flow rate, SV is the spacer volume, AV is the applied voltage, and CV is the cell volume.

Figure 6.
The cost function variation, best values of decision variables during the optimization process of the lowest concentration point. C is the capacitance, CP is the center point, FR is the flow rate, SV is the spacer volume, AV is the applied voltage, and CV is the cell volume.
Figure 6.
The cost function variation, best values of decision variables during the optimization process of the lowest concentration point. C is the capacitance, CP is the center point, FR is the flow rate, SV is the spacer volume, AV is the applied voltage, and CV is the cell volume.

Figure 7.
The cost function variation, best values of decision variables during the optimization process of pool water concentration. C is the capacitance, CP is the center point, FR is the flow rate, SV is the spacer volume, AV is the applied voltage, and CV is the cell volume.
Figure 7.
The cost function variation, best values of decision variables during the optimization process of pool water concentration. C is the capacitance, CP is the center point, FR is the flow rate, SV is the spacer volume, AV is the applied voltage, and CV is the cell volume.

Figure 8.
The cost function variation, best values of decision variables during the optimization process of salt ion adsorption. C is the capacitance, CP is the center point, FR is the flow rate, SV is the spacer volume, AV is the applied voltage, and CV is the cell volume.
Figure 8.
The cost function variation, best values of decision variables during the optimization process of salt ion adsorption. C is the capacitance, CP is the center point, FR is the flow rate, SV is the spacer volume, AV is the applied voltage, and CV is the cell volume.

Figure 9.
The cost function variation, best values of decision variables during the multi-objective optimization process. C is the capacitance, CP is the center point, FR is the flow rate, SV is the spacer volume, AV is the applied voltage, and CV is the cell volume.
Figure 9.
The cost function variation, best values of decision variables during the multi-objective optimization process. C is the capacitance, CP is the center point, FR is the flow rate, SV is the spacer volume, AV is the applied voltage, and CV is the cell volume.


Table 1.
Parameters used for capacitive deionization (CDI) effluent calculation
| Concentration of the CDI effluent during adsorption process | |
| Concentration of the CDI effluent during desorption process | |
| Water inlet stream concentration | |
| C | Capacitance of the electrodes |
| Charge efficiency (ratio of adsorbed salt ions in the electrodes/applied electric charge) | |
| F | Faraday’s constant |
| R | Resistance of the cell |
| Desorption voltage that equals to a negative value or zero according to the desorption process | |
| Volume of the spacer | |
| Adsorption voltage | |
| z | Molar ionic valance of the feed (average) |
| Inlet flow rate | |
| Cell volume | |
| Adsorption saturation time | |
| Pool water concentration | |
| Initial time of the adsorption process | |
| Salt ions adsorption |
Table 2.
Performance equations and corresponding objective functions for the optimization through radial movement optimization (RMO).
Table 2.
Performance equations and corresponding objective functions for the optimization through radial movement optimization (RMO).
| Performance Equations | Units | Objective Functions |
|---|---|---|
| Lowest concentration point | (mM) | Y1 |
| Pool water concentration | (ppm) | Y2 |
| Salt ion adsorption | (g) | Y3 |
| Energy consumption per gram | (J/g) | Y4 |
| Energy consumption per liter | (J/L) | Y5 |
| Freshwater recovery | (L) | Y6 |
Table 3.
Lower and upper bounds of the CDI operating parameters used during optimization, already reported in [43].
Table 3.
Lower and upper bounds of the CDI operating parameters used during optimization, already reported in [43].
| Operating Parameter | Decision Variables | Lower Limit | Upper Limit | |
|---|---|---|---|---|
| Spacer volume | L | x1 | 0.05 | 0.15 |
| Capacitance | F | x2 | 50 | 250 |
| Applied voltage | V | x3 | 0.4 | 1.6 |
| Flow rate | mL/min | x4 | 30 | 100 |
| Cell volume | L | x5 | 0.08 | 0.18 |
Table 4.
Parameters of the RMO optimizer and their values.
| Parameter | Value | Parameter | Value |
|---|---|---|---|
| K | 5 | Population size | 3 |
| C1 | 0.7 | Number of iterations | 25 |
| C2 | 0.8 |
Table 5.
Results of the single objective based optimization for multiple constrained operating parameters.
Table 5.
Results of the single objective based optimization for multiple constrained operating parameters.
| Performance Parameter | Values Before Optimization | Optimized by GA [43] | Optimized by RMO [present] | Optimal Operating Parameters | ||||
|---|---|---|---|---|---|---|---|---|
| X1 (Spacer Volume, L) | X2 (Capacitance, F) | X3 (Applied Voltage, V) | X4 (Flow Rate, mL/min) | X5 (Cell Volume, L) | ||||
| Lowest concentration point (mM) | 5.96 | 2.5 | 0.873 | 0.05 | 250 | 1.6 | 0.0005 | 0.008 |
| Pool water concentration (ppm) | 503.63 | 427.05 | 402.17 | 0.05 | 250 | 1.6 | 0.0005 | 0.008 |
| Salt ion adsorption (g) | 0.081 | 0.144 | 0.19 | 0.05 | 250 | 1.6 | 0.0017 | 0.008 |
| Energy consumption per gram (J/g) | 1753 | 434.77 | 410.32 | 0.05 | 250 | 0.4 | 0.0017 | 0.008 |
| Energy consumption per liter (J/L) | 141.78 | 11.78 | 11.76 | NA | 240 | 0.4 | 0.0017 | NA |
| Fresh water recovery (L) | 1.002 | 1.77 | 2.212 | NA | 250 | 1.6 | 0.0017 | NA |
Table 6.
Multi-constrained multi-objective functions (MCMOF) optimization, comparison of RMO with genetic algorithm (GA), and corresponding operating parameters.
Table 6.
Multi-constrained multi-objective functions (MCMOF) optimization, comparison of RMO with genetic algorithm (GA), and corresponding operating parameters.
| Case | Optimal Operating Parameters | Performance Parameters | |||||||||
|---|---|---|---|---|---|---|---|---|---|---|---|
| X1 | X2 | X3 | X4 | X5 | Y1 (mM) | Y2 (PPM) | Y3 (g) | Y4 (J/g) | Y5 (J/L) | Y6 (L) | |
| 1[GA] | 50.51 | 187.76 | 1.60 | 30.32 | 80.28 | 0.0029 | 433.86 | 0.0758 | 3137.19 | NA | NA |
| 2[GA] | 50.95 | 185.63 | 0.40 | 99.95 | 80.37 | 0.0088 | 557.68 | 0.0321 | 444.30 | NA | NA |
| 3[GA] | 50.84 | 188.02 | 1.60 | 100.01 | 80.07 | 0.0051 | 504.24 | 0.1333 | 1787.81 | NA | NA |
| 4[GA] | 50.84 | 187.86 | 1.23 | 83.42 | 80.88 | 0.0059 | 511.26 | 0.0962 | 1453.19 | NA | NA |
| 5[RMO] | 50 | 250 | 0.4 | 100 | 80 | 0.0086 | 555.7 | 0.046 | 410.3 | 11.76 | 1.6 |
© 2020 by the authors. Licensee MDPI, Basel, Switzerland. This article is an open access article distributed under the terms and conditions of the Creative Commons Attribution (CC BY) license (http://creativecommons.org/licenses/by/4.0/).
Share and Cite
MDPI and ACS Style
Rezk, H.; Saleem, M.W.; Abdelkareem, M.A.; Al-Dhaifallah, M. Radial Movement Optimization Based Optimal Operating Parameters of a Capacitive Deionization Desalination System. Processes 2020, 8, 964. https://doi.org/10.3390/pr8080964
AMA Style
Rezk H, Saleem MW, Abdelkareem MA, Al-Dhaifallah M. Radial Movement Optimization Based Optimal Operating Parameters of a Capacitive Deionization Desalination System. Processes. 2020; 8(8):964. https://doi.org/10.3390/pr8080964
Chicago/Turabian StyleRezk, Hegazy, Muhammad Wajid Saleem, Mohammad Ali Abdelkareem, and Mujahed Al-Dhaifallah. 2020. "Radial Movement Optimization Based Optimal Operating Parameters of a Capacitive Deionization Desalination System" Processes 8, no. 8: 964. https://doi.org/10.3390/pr8080964
Note that from the first issue of 2016, this journal uses article numbers instead of page numbers. See further details here.