Article

Hyperspectral Imaging Coupled with Multivariate Analysis and Image Processing for Detection and Visualisation of Colour in Cooked Sausages Stuffed in Different Modified Casings

by
Chao-Hui Feng
1,2,*,
Yoshio Makino
1,* and
Juan F. García Martín
3
1
Graduate School of Agricultural and Life Sciences, The University of Tokyo, 1-1-1, Yayoi, Bunkyo-ku, Tokyo 113-8657, Japan
2
RIKEN Centre for Advanced Photonics, RIKEN, 519-1399 Aramaki-Aoba, Aoba-ku, Sendai 980-0845, Japan
3
Departamento de Ingeniería Química, Facultad de Química, Universidad de Sevilla, 41012 Seville, Spain
*
Authors to whom correspondence should be addressed.
Foods 2020, 9(8), 1089; https://doi.org/10.3390/foods9081089
Submission received: 28 June 2020 / Revised: 4 August 2020 / Accepted: 7 August 2020 / Published: 10 August 2020
(This article belongs to the Special Issue Food Modelling*)

Abstract

:
A hyperspectral imaging system was for the first time exploited to estimate the core colour of sausages stuffed in natural hog casings or in two hog casings treated with solutions containing surfactants and lactic acid in slush salt. Yellowness of sausages stuffed in natural hog casings (control group, 20.26 ± 4.81) was significantly higher than that of sausages stuffed in casings modified by submersion for 90 min in a solution containing 1:30 (w/w) soy lecithin:distilled water, 2.5% wt. soy oil, and 21 mL lactic acid per kg NaCl (17.66 ± 2.89) (p < 0.05). When predicting the lightness and redness of the sausage core, a partial least squares regression model developed from spectra pre-treated with a second derivative showed calibration coefficients of determination (Rc2) of 0.73 and 0.76, respectively. Ten, ten, and seven wavelengths were selected as the important optimal wavelengths for lightness, redness, and yellowness, respectively. Those wavelengths provide meaningful information for developing a simple, cost-effective multispectral system to rapidly differentiate sausages based on their core colour. According to the canonical discriminant analysis, lightness possessed the highest discriminant power with which to differentiate sausages stuffed in different casings.

1. Introduction

Hyperspectral imaging (HSI), which can provide the spectral information along with the spatial distribution from a subject, is superior to the traditional spectroscopic methods [1]. The prediction map, as the most attractive part of HSI, enables the different attributes to be displayed from spot to spot in samples [2,3,4,5,6,7,8]. It has been intensively applied for meat adulteration detection [9,10,11,12]; monounsaturated and polyunsaturated fatty acid prediction in processed pork meats [13]; textural feature assessments of normal and white striping broiler breast meat [14]; and monitoring bacterial contaminations in chicken meat [15], the shelf-life of packaged bratwurst [16], and the pH [4], colour, [5] and triphosphate content [6] in ready-to-eat sausages. Hitherto, no study on the interior colour change due to sausages being stuffed in different modified casings has been done.
Natural casings are favoured by various sausage manufacturers due to their special cracking bite and tenderness [17,18]: the consumption of natural casings is double that of artificial casings and still dominates in the global casing market [19]. In addition to effective package [20,21,22,23,24] and cooling methods [17,25,26,27,28,29,30] to extend the shelf-lives of foodstuffs, as an efficient method for food preservation, drying is also widely employed in the food industry [31,32]. In this case, casings should be not only strong enough to hold the sausage batter, but also permeable to render water evaporation during drying [29]. Nevertheless, the high-speed and efficient sausage manufacturing is hampered by the occurrence of casing bursts, and so the properties of natural casings are requested to be improved [27]. By combining the methods used by Santos et al. [33] and Bakker et al. [34], the effects of solutions of soy oil and soy lecithin together with lactic acid in slush salt were initially investigated by Feng et al. [27]. According to the light microscopy, natural hog casings with the aforementioned treatment were observed to be more porous [27]. Previous studies addressed the microbial attributes [35,36], volatile composition [37], and physicochemical properties of sausages stuffed in modified casings [29,35,37]. HSI has showed its potential to monitor the evolution of surface sausage colour over time [2] and to determine pH, colour, and adenosine triphosphate in big Japanese sausage slices [4,5,6]. However, visualisation of the interior colour change related to hog casings with different modifications remains unexploited. Colour is an important parameter that affects the acceptance of foodstuffs by consumers to a great extent [5,38]. Conventionally, the colour is measured at a small random spot by an instrumental colourimeter. As a result, obtaining the complete colour prediction map pixel by pixel is impractical with this equipment. The distribution map generated by HSI can meet this requirement. Understanding the interior colour changes of sausages with modified casings may provide useful information on how quality changes in response to the unique modified casings.
Discriminant analysis (DA) is a method that can transform high-dimensional data into vectors as a prerequisite procedure before completing the algorithmic model [39]. It can estimate whether one of the samples belongs to defined groups according to the categories of selected variables [35,40]. According to the physicochemical and microbial attributes, sausages with different storage times and different levels of phenolic extracts from olive vegetation water were classified by DA [41]. Varrà et al. utilised the orthogonal partial last square-discriminant analysis to classify dry fermented sausages treated with ionizing radiation and non-irradiated ones, with a 100% classification rate [42]. It is thus interesting and of practical application to assess the effects of different casing modifications on the colour attribute of dried sausages using DA.
Differently from the previous research in which sausages were monitored by HSI over storage, the current study focuses on the feasibility of detecting the changes of core colour of sausages caused by different treatments (i.e., the use of different casings) using HSI. Furthermore, the relationship between colour attributes and different casing modifications is for the first time explained by discriminant analysis. The aim of current study was to establish a quantitative model relating the spectral data to the reference colour of the dried sausage core by means of partial least squares regression (PLSR). Subsequently, wavelengths with high predictive power were selected and resulting prediction maps of core colour were developed using algorithms of image processing.

2. Materials and Methods

2.1. Preparation of Samples and Measurement of Colour

Natural hog casings were purchased from a local casing company (Pakumogu.com, Niigata Prefecture, Japan) and desalted before being put into the surfactant solution composed of soy lecithin and soy oil. According to previous results on rupture force and burst pressure resistance [27], two different casing modifications were conducted. For treatment 1, the concentrations of soy lecithin (soy lecithin: distilled water) and soy oil were 1:27.5 (w/w) and 1.25% (w/w), respectively. The lactic acid concentration in solid salt was 19.5 mL/kg and the residence time was 75 min. As for treatment 2, the concentrations of soy lecithin, soy oil, and lactic acid were 1:30 (w/w), 2.50%, and 21 mL/kg NaCl, respectively. The residence time was 90 min. Distilled water was used to dissolve the surfactant solutions by stirring with a magnetic agitation of 325 rpm and heating at 60 °C. The hog casings were placed into the surfactant solution after it cooled to 25 °C for the corresponding reference time. Subsequently, the casings were extracted without rinsing and stored in the slush salt with lactic acid for the residence time. Before sausage production, the modified casings were rinsed for 10 min to eliminate modified solution and slush salt using distilled water.
The sausages were made with the following procedure: (1) the lean pork and back fat (Chinese supermarket, Tokyo, Japan) were cut into small pieces sterilely and mixed with seasoning extracts, Chinese white wine (55% ethanol), salt, sugar, and spice. Table 1 shows the detailed concentrations of the sausage ingredients. (2) The mixture was cured for 1 h. Afterwards, the mixture was minced once to sausage batter by using a plate (diameter: 5 mm). (3) The batter was stuffed using modified and natural desalted hog casings (as control samples) via a stuffing machine (STX-4000-TB2-PD-BL, Electric Meat Grinder and Sausage Stuffer, STX international, Tokyo, Japan). After being sectioned by twisting, the sausages were hung in an oven at 45 °C for 24 h and ageing at 20 °C in a sterilised incubator for another 24 h. The sausage sections were sterilely cut, vacuum packaged, and stored at 4 °C for 1 d.
The reference colour of the sausage core was measured by a Minolta CR-700D colourimeter (Konica Minolta Corp., Osaka, Japan) using CIE L* (lightness), a* (redness/greenness), and b* (yellowness/blueness) colour space after hyperspectral images acquirement. Before measurement, the colourimeter was calibrated by a standard white calibration plate and a standard D65 illuminate and 2o observer. The colour measurement was conducted in triplicate.

2.2. Hyperspectral Imaging System

A visible near-infrared hyperspectral imaging equipment (JFE, Techno-Research Corporation, Tokyo, Japan) working in the range 380–1000 nm was utilised to line scan (push-broom) the core of the sausage. The specific system description can be found elsewhere [4,5,6]. As the white reference, a uniform, stable, and high reflectance white ceramic tile (about 99% reflectance) was used for calibrating the HSI system. As for the dark reference, calibration was performed by completely covering the camera lens with an opaque cap. A reflectance mode was used for image acquisition, with the dark room temperature controlled at 20 °C and relative humidity of 30%. The corrected reflectance (Rcorrected) was obtained according to Equation (1):
R corrected = R r a w   R d a r k R w h i t e R d a r k
where Rraw, Rdark, and Rwhite were the reflectance images of raw, dark, and white, respectively. The sliced sausage core (diameter: 2.48 ± 0.11 cm; height: 2.10 ± 0.20 cm) was placed onto a sterilised black plastic background on a moving stage that had the speed of 2.08 mm/s. The stage was controlled by Spectrum Analyzer software (version 1.8.5, JFE, Techno-Research Corporation, Tokyo, Japan) and the spatial resolution of the acquired images was 0.75 mm per pixel. A hyperspectral image cube was produced by scanning in the direction perpendicular to the spatial plane of ImSpector spectrograph, and the hyperspectral images were processed and analysed via Spectrum Analyzer software. The illumination system, composed of a 150 W Xe lamp (Super Bright 152S, SAN-EI Electric, Osaka, Japan) and a 150 W tungsten halogen lamp (ColdSpot PCS-UHX, NPI, Tokyo, Japan), was fixed at 45° angles from the imaging area. The total spectral bands were 125 with intervals of 5 nm.
As for the region of interest (ROI), the sausage cores with different modified casings were manually selected to separate them from the background or other undesired sections. According to the ROI selection procedure described by Siripatrawan and Makino [43], the centre of each sample with a size of 50 × 50 pixels was selected, and the average spectra were used for a model development. After the multivariate statistical models were established, the images were segmented automatically: all pixels which had reflectance at 690, 685, and 685 nm for greater than 0.05 units were considered for lightness, redness, and yellowness, respectively; 75% ethanol was used for sterilising all equipment that contacted samples.

2.3. Model Development and Evaluation of Model Performance

One linear (partial least square regression (PLSR)) multivariate method was utilised for developing calibration models in the full spectral range of 380–1000 nm. Several spectral data pre-treatments were conducted prior to multivariate analysis (MVA) to improve the performance of the model. Those pre-treatments were standard normal variate (SNV), normalisation, multiplicative scatter correction (MSC), and first and second derivative. Two thirds of the total samples (n = 89) were selected for the calibration set and the remaining one third was used as the validation set.
Model performance evaluation is an important task in MVA to confirm the predictive ability and model robustness. The statistical values, namely, the mean square error of calibration (RMSEC), prediction (RMSEP), and cross validation (RMSECV), and the determination coefficients of calibration (Rc2), prediction (Rp2), and cross validation (Rcv2) were used to estimate the predictive capabilities [9,44,45]. A model with high R2, low RMSE, and a small absolute difference between RMSEC and RMSECV is regarded as a good model [2]. The multivariate analyses of PLSR and all computations were completed by The Unscrambler software (X 10.4, CAMO Software Inc., Trondheim, Norway).

2.4. Selection of Important Optimum Wavelengths (IOW)

The weighted regression coefficients (BW) that yielded the best PLSR model were selected as the important optimum wavelengths for colour. The new calibration models were created using the selected important optimum wavelengths (those that contained large BW values irrespective of sign). The predictive ability of the model using these wavelengths was compared to the predictive ability obtained using the full spectrum. The purpose of doing this was to simplify the model and to improve its accuracy [4,5,6,45]. If the model accuracy established by important optimum wavelengths performs comparably to the accuracy obtained when using the full spectrum, then the simplified model using the IOW could be proposed for an efficient online multispectral imaging system.

2.5. Sausage Properties Visualisation

As aforementioned, hyperspectral imaging generates three-dimensional matrices that contain a large amount of spatial and spectral information. It is a vital approach to understand the heterogeneity of the sausage via visual appraisal in each pixel in the image. In this study, the calibration model built with the selected IOW was used to produce the distribution maps for core colour of sausages stuffed using modified and control casings. A 2D matrix was generated by unfolding the 3D HSI at the IOW. Consequently, the columns represented the selected IOW and each row stood for the spectrum of a pixel. Afterwards, the spectrum of each pixel in the HSI was multiplied with regression coefficients obtained from PLSR model. In this way, the visualisation map was constructed and can schematically display the colour heterogeneity of the sausages; it is illustrated with a linear colour scale with different colours, standing for corresponding values of predicted colour of the sausage cores. All of these visualisation procedures were computed with the MATLAB software (R2017b; MathWorks Inc., Natick, MA, USA).

2.6. Statistical Analysis

Sausages with different modified casings were discriminated by canonical discriminant analysis according to the colour parameters (Statistics 26, IBM, Armonk, NY, USA). One-way ANOVA was used for analysing the effects of different casing treatments on the core colour of the sausages (Statistics 26, IBM, Armonk, NY, USA).

3. Results and Discussion

3.1. Calibration Models at Full Wavelengths

As a powerful tool for multivariate data analysis, partial least square regression (PLSR) has been extensively applied in the analysis of data with collinear variables in the independent and dependent variables [4,5,6]. The correlations between spectra of the sausage samples and relevant colour parameters were established by the PLSR models. As an important parameter with which to evaluate the model performance, the range of R2 value between 0.66 to 0.81 has been proven to be acceptable for approximate quantitative prediction, whereas an R2 value between 0.82 and 0.90 is required for a good prediction. An R2 value over 0.91 is reported to provide excellent prediction [46]. For the lightness of core sausages, Table 2 shows that the model built with the spectra pre-treated with second derivative obtained comparably satisfactory outcomes, with Rc2 of 0.73 and Rp2 of 0.74, and a small absolute difference between RMSEC and RMSECV (0.05).
It was reported that the Rp2 and RMSEP of the PLSR model developed to determine the lightness of cooked bratwurst pork sausages were 0.84 and 0.27, respectively [16]. The lower value of R2 achieved in this work may be partially attributed to the smaller image dataset (89 vs. 144) used for model training and validation. Regarding a* value, PLSR model devised by the second derivative could achieve a comparably higher Rc2 result (Rc2 = 0.76) with a comparably lower RMSEC (RMSEC = 1.37), whereas PLSR model developed by normalisation could reach comparably satisfactory Rc2 (Rc2 = 0.82) and RMSEC results (RMSEC = 1.81) for b* value. This can be due to the removal of the background noise or scattering effect reduction. Compared to a similar study, a higher Rc2 value (Rc2 = 0.93; RMSEC = 0.64) was also obtained when the PLSR was developed with the second derivative for predicting redness of the pre-cooked Japanese sausage [5]. Normally, pre-treatments improve the model’s performance in comparison with the model built with the raw spectra, probably because the scattering effect decreases and background noise is removed during pre-treatment procedures. For instance, the first (1st) and second (2nd) derivatives were reported to separate overlapping absorption bands [6,47], remove baseline drift and background noise [2], and eventually improve apparent spectral features [4,48]. With regard to normalisation, it is used to improve the spectral features and ensure the spectra to have an equal area under the curve, which renders the features of the spectra easy to compare in the same plot [49]. The functions of MSC and SNV are scatter correction [50]. Nolasco-Perez et al. classified ground chicken meat adulterated with pork. When using a portable NIR spectrometer, Rp2 ranged between 0.01 and 0.28, and it increased to 0.77–0.84 when the classification was performed by means of NIR-HSI [51].

3.2. Calibration Models with IOW

The selection of representative important wavelengths is a meaningful task for simplifying the model and potentially eliminating data redundancy. The data analysis is greatly improved via this method, which facilitates the development of a simple cost-effective HSI system (such as multispectral system) or an online industrial application [9]. The reduction of the wavelengths enables one to accelerate the algorithms’ efficacies and enhance their rapid classification of the sausages according to the core colour for the industry. The statistical parameters of PLSR developed from selected IOW are shown in Table 2. Ten (385, 400, 415, 570, 690, 855, 880, 990, 995, and 1000 nm), ten (390, 400, 410, 415, 435, 515, 610, 630, 685, and 795 nm), and seven wavelengths (390, 400, 415, 420, 435, 515, and 685 nm) were selected for L*, a*, and b*, respectively.
As depicted in Table 2, the models derived from IOW had moderate performance decreases, but in some cases, possessed similar performances, which implies that the IOW were efficient enough to replace the full range of spectra for predicting of core colour of sausages with different casings. A backward feature selection was used for choosing the IOW. To be specific, if the removal of one wavelength did not significantly affect the accuracy of the developed model, then that wavelength was discarded for the development of the optimal model. In this way, the wavelengths that contained redundant information were removed and so the model was simplified: around 92%, 92%, and 94% of wavelengths were removed from the full wavelengths set for L*, a*, and b*, respectively. For the parameter of the redness, 435 and 610 nm were selected as the representative wavelengths, which is consistent with the observation of Kamruzzaman et al. [9]. The absorption band at 430 nm was reported to be related to the Soret absorption that is associated with respiratory pigment haemoglobin [52]. With regard to the absorption band at 595 nm, it related to the respiratory pigments, principally deoxymyoglobin or oxymyoglobin [53]. In comparison with a similar study on Japanese cooked sausage slices, ten wavelengths were selected for predicting redness [5]. Eight and six wavelengths were reported to predict L* and a* of pork [54], whereas a set of six wavelengths was used to predict all colour (i. e. L*, a*, and b* values) in beef, lamb, and pork [9].

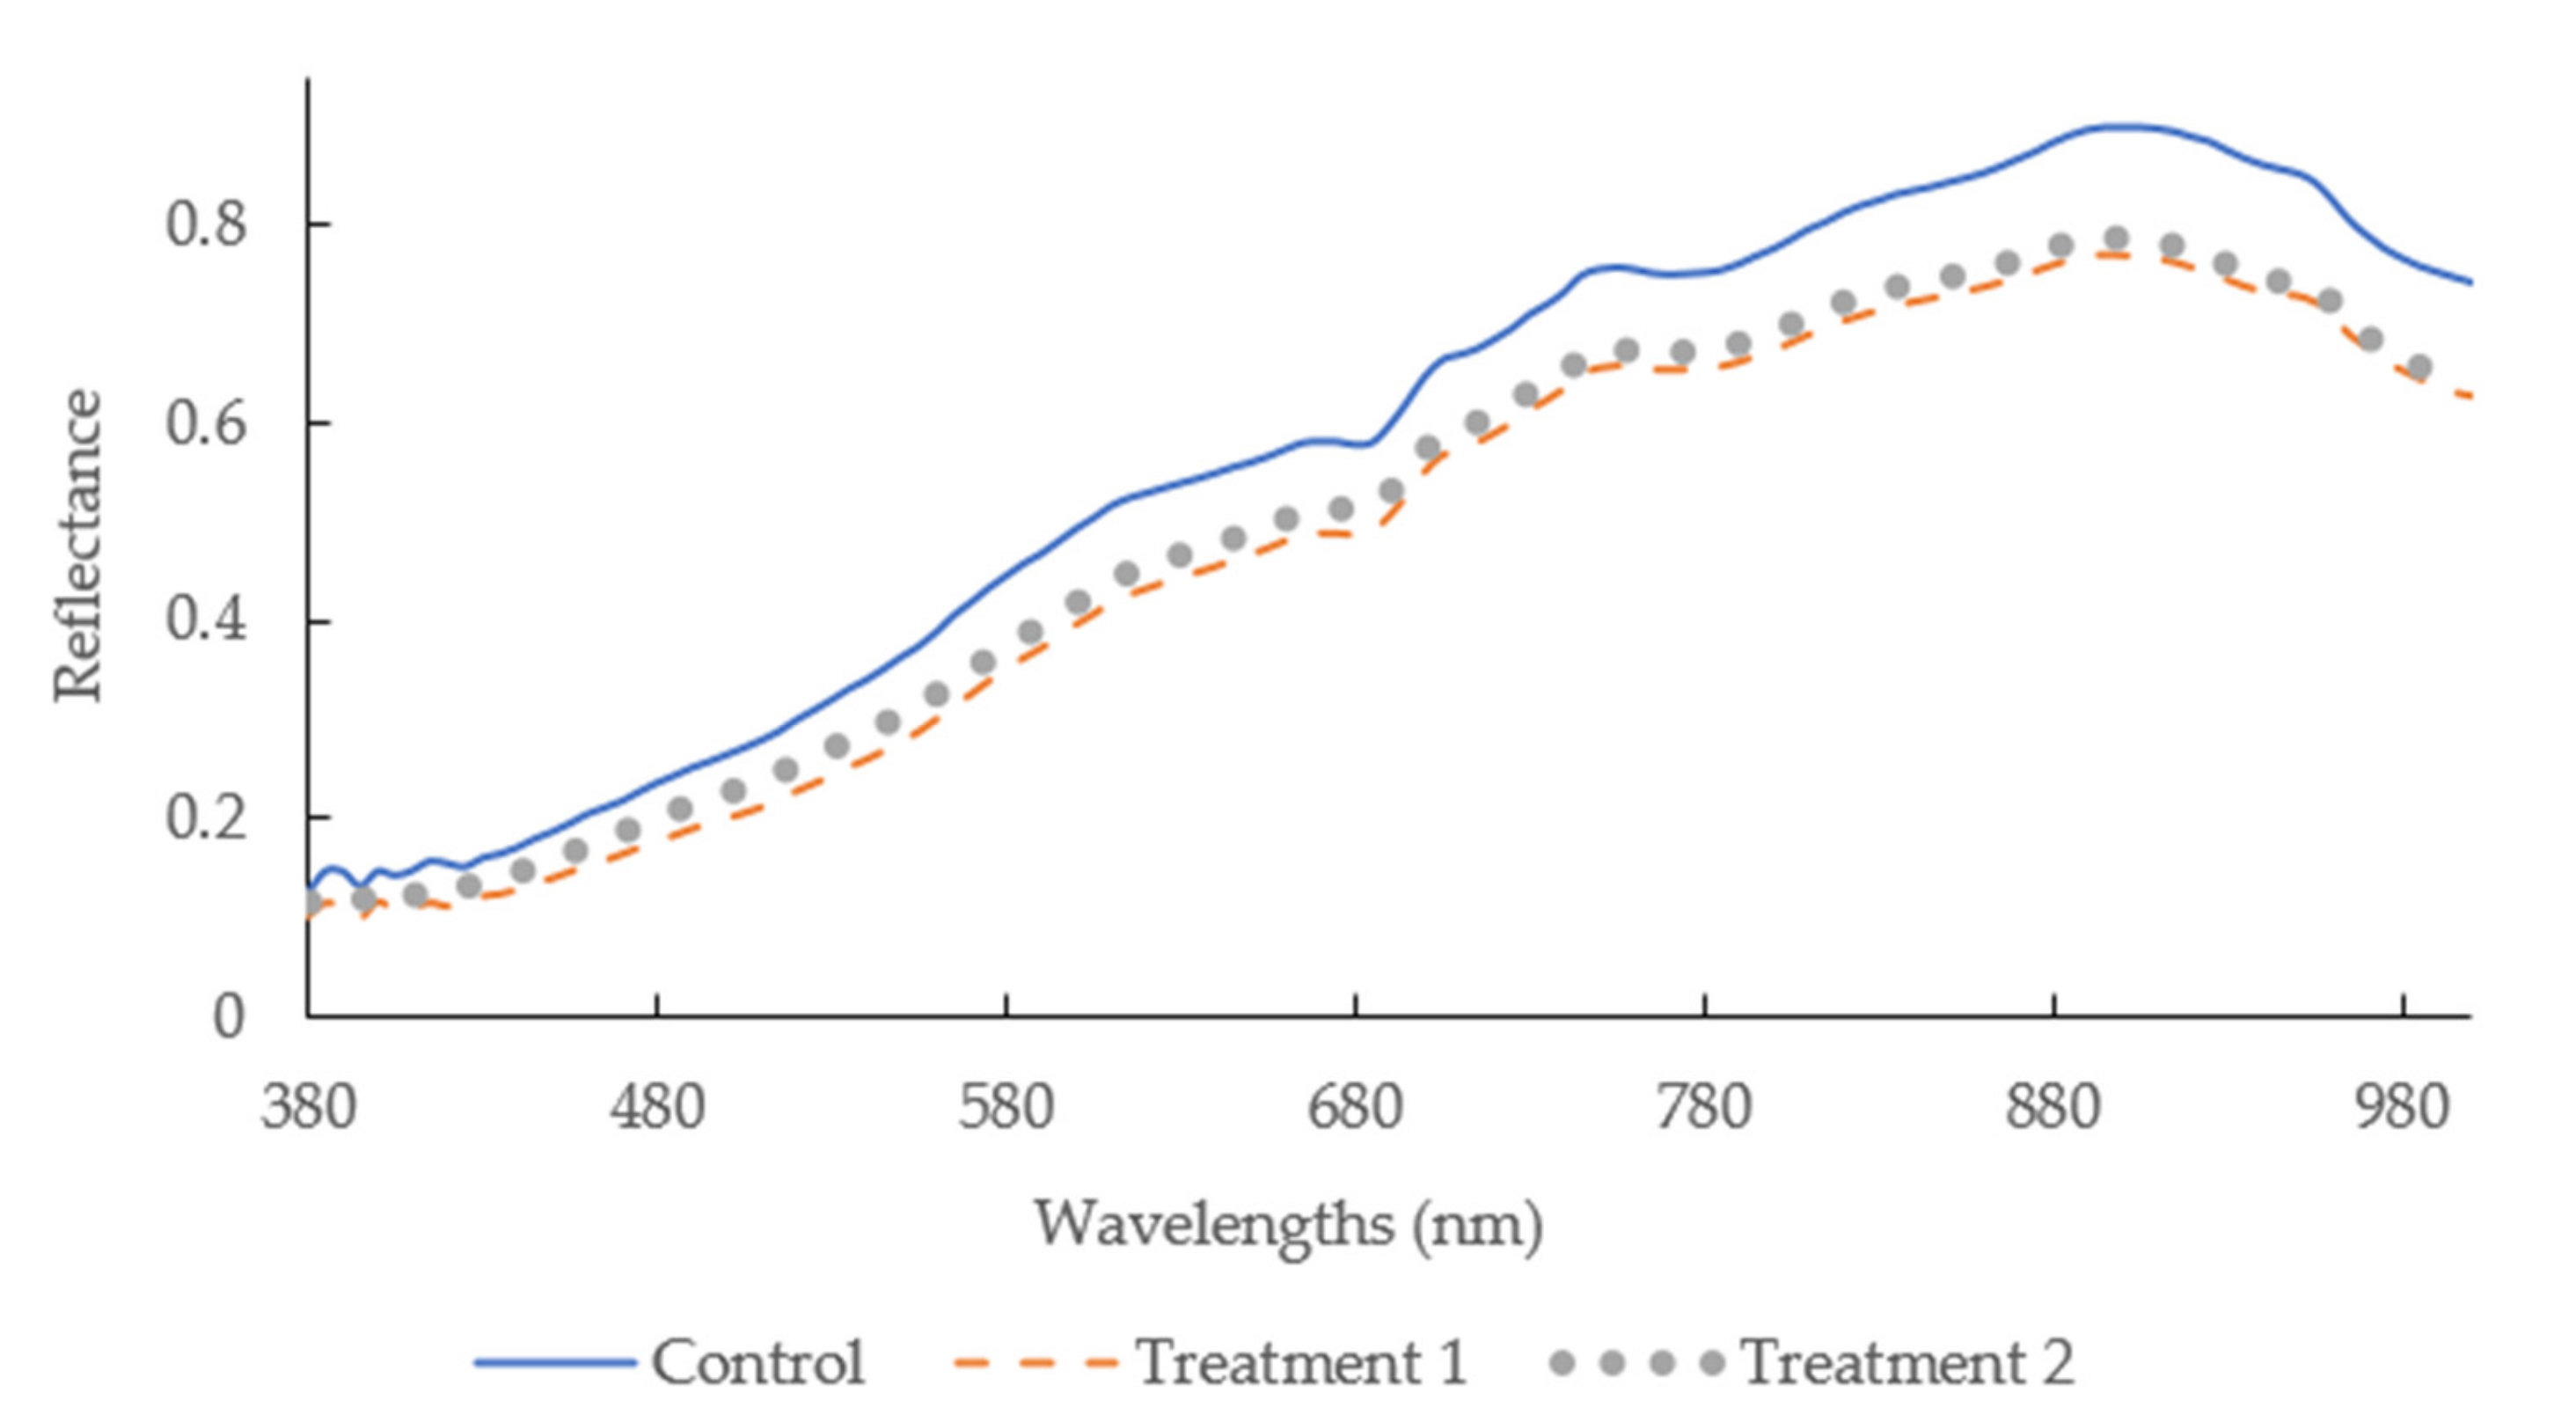
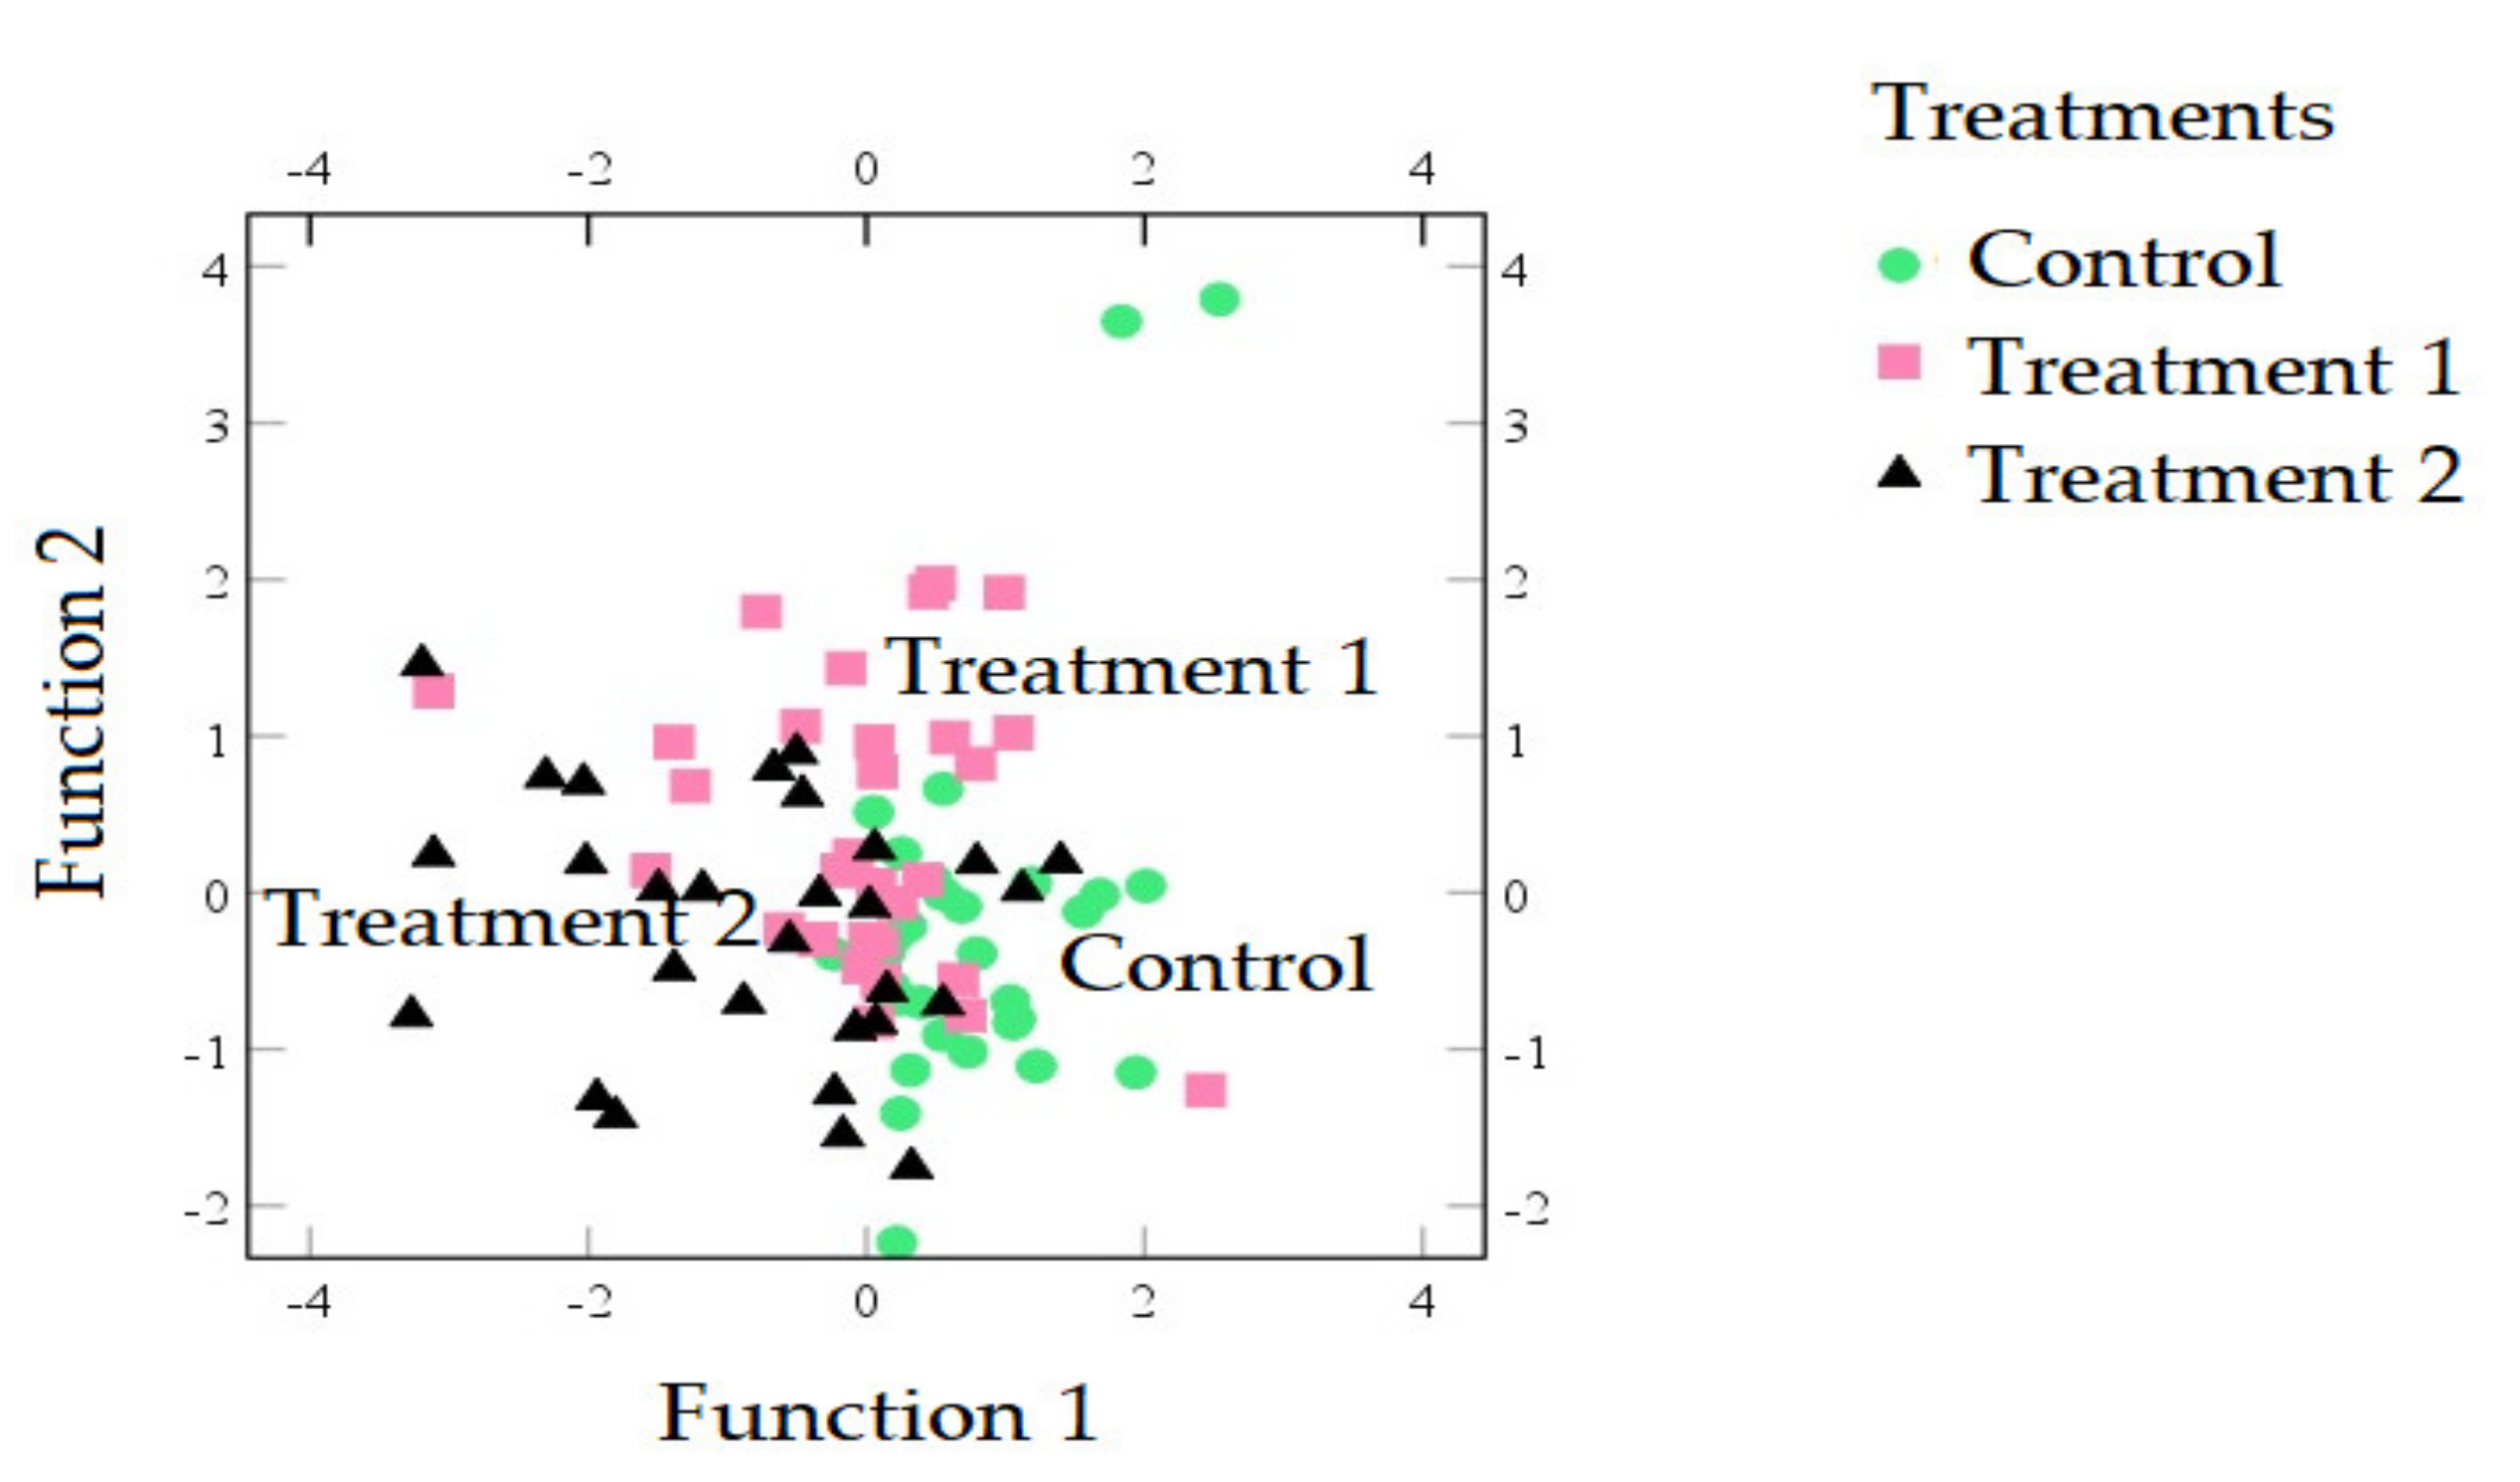
3.3. Overview of the Spectra and Discriminant Analysis

Figure 1 illustrates the mean spectra of sausages with different casings between 380 and 1000 nm. The reflectance of the sausages with treatment 1 presented the lowest reflectance, compared to that of sausages stuffed with control casing. This is consistent with the observation wherein a higher lightness for sausages with control casing (56.83 ± 5.48) was achieved. The higher water content of sausages stuffed in control casing may be attributed to this phenomenon. Due to the porous structure of modified casings, the water may evaporate via this porous structure and so concentrate the pigment, leading to less reflection. It is evident that there was a dip at 680 nm (Figure 1), which may be related to oxymyoglobin formation [2,5]. Peng and Wang stated there was a third overtone of N-H stretching between 775 and 850 nm, and there was a slope shape from 600 to 700 [55], which is related to oxymyoglobin generation [56].
As aforementioned, discriminant analysis can be utilised for evaluating whether the colour (L*, a*, and b* values) is able to discriminate the sausages with different modified casings. The relationship between colour and sausages with different casings was for the first time established. Two discriminant functions were established to separate sausages with different casings, with the correct classification of 62.90%. The two functions (Equations (2) and (3)) were as follows:
Function 1 = 0.47 [L*] + 0.14 [a*] + 0.40 [b*]
Function 2 = −0.62 [L*] + 0.80 [a*] + 0.32 [b*]
Function 1 explained 82.40% of total variance and had a higher canonical correlation (0.55) than function 2 (0.29) at a 1% significant level (Table 3), which indicates that Function 1 had a higher reliability with its higher canonical correlation. Lorenzo et al. stated that a Wilks’ lambda value was used to evaluate how well each function discriminated individuals (e.g., sausages with different casings) into groups [57]. As depicted in Table 3, function 1 possessed a low Wilks’ Lambda value (0.64) that demonstrated a pronounced discriminatory ability.
Equations (2) and (3) also illustrate that the variable with the highest discriminant power in Equations (1) and (2) was lightness, which was followed by yellowness (p < 0.05). The sausages stuffed in different casings can be thus classified by lightness. This agreed with the observation wherein the lightness of treatment 1 (50.86 ± 8.90) was significantly lower than that of control (56.83 ± 5.48) (p < 0.05). Sausages using casings modified by treatment 2 illustrated a separation by function 2 (Equation (3)): sausages with casings modified by treatment 2 were located in the negative part of function 2, whilst modified casing (using treatment 1) sausages were in the positive part (Figure 2).

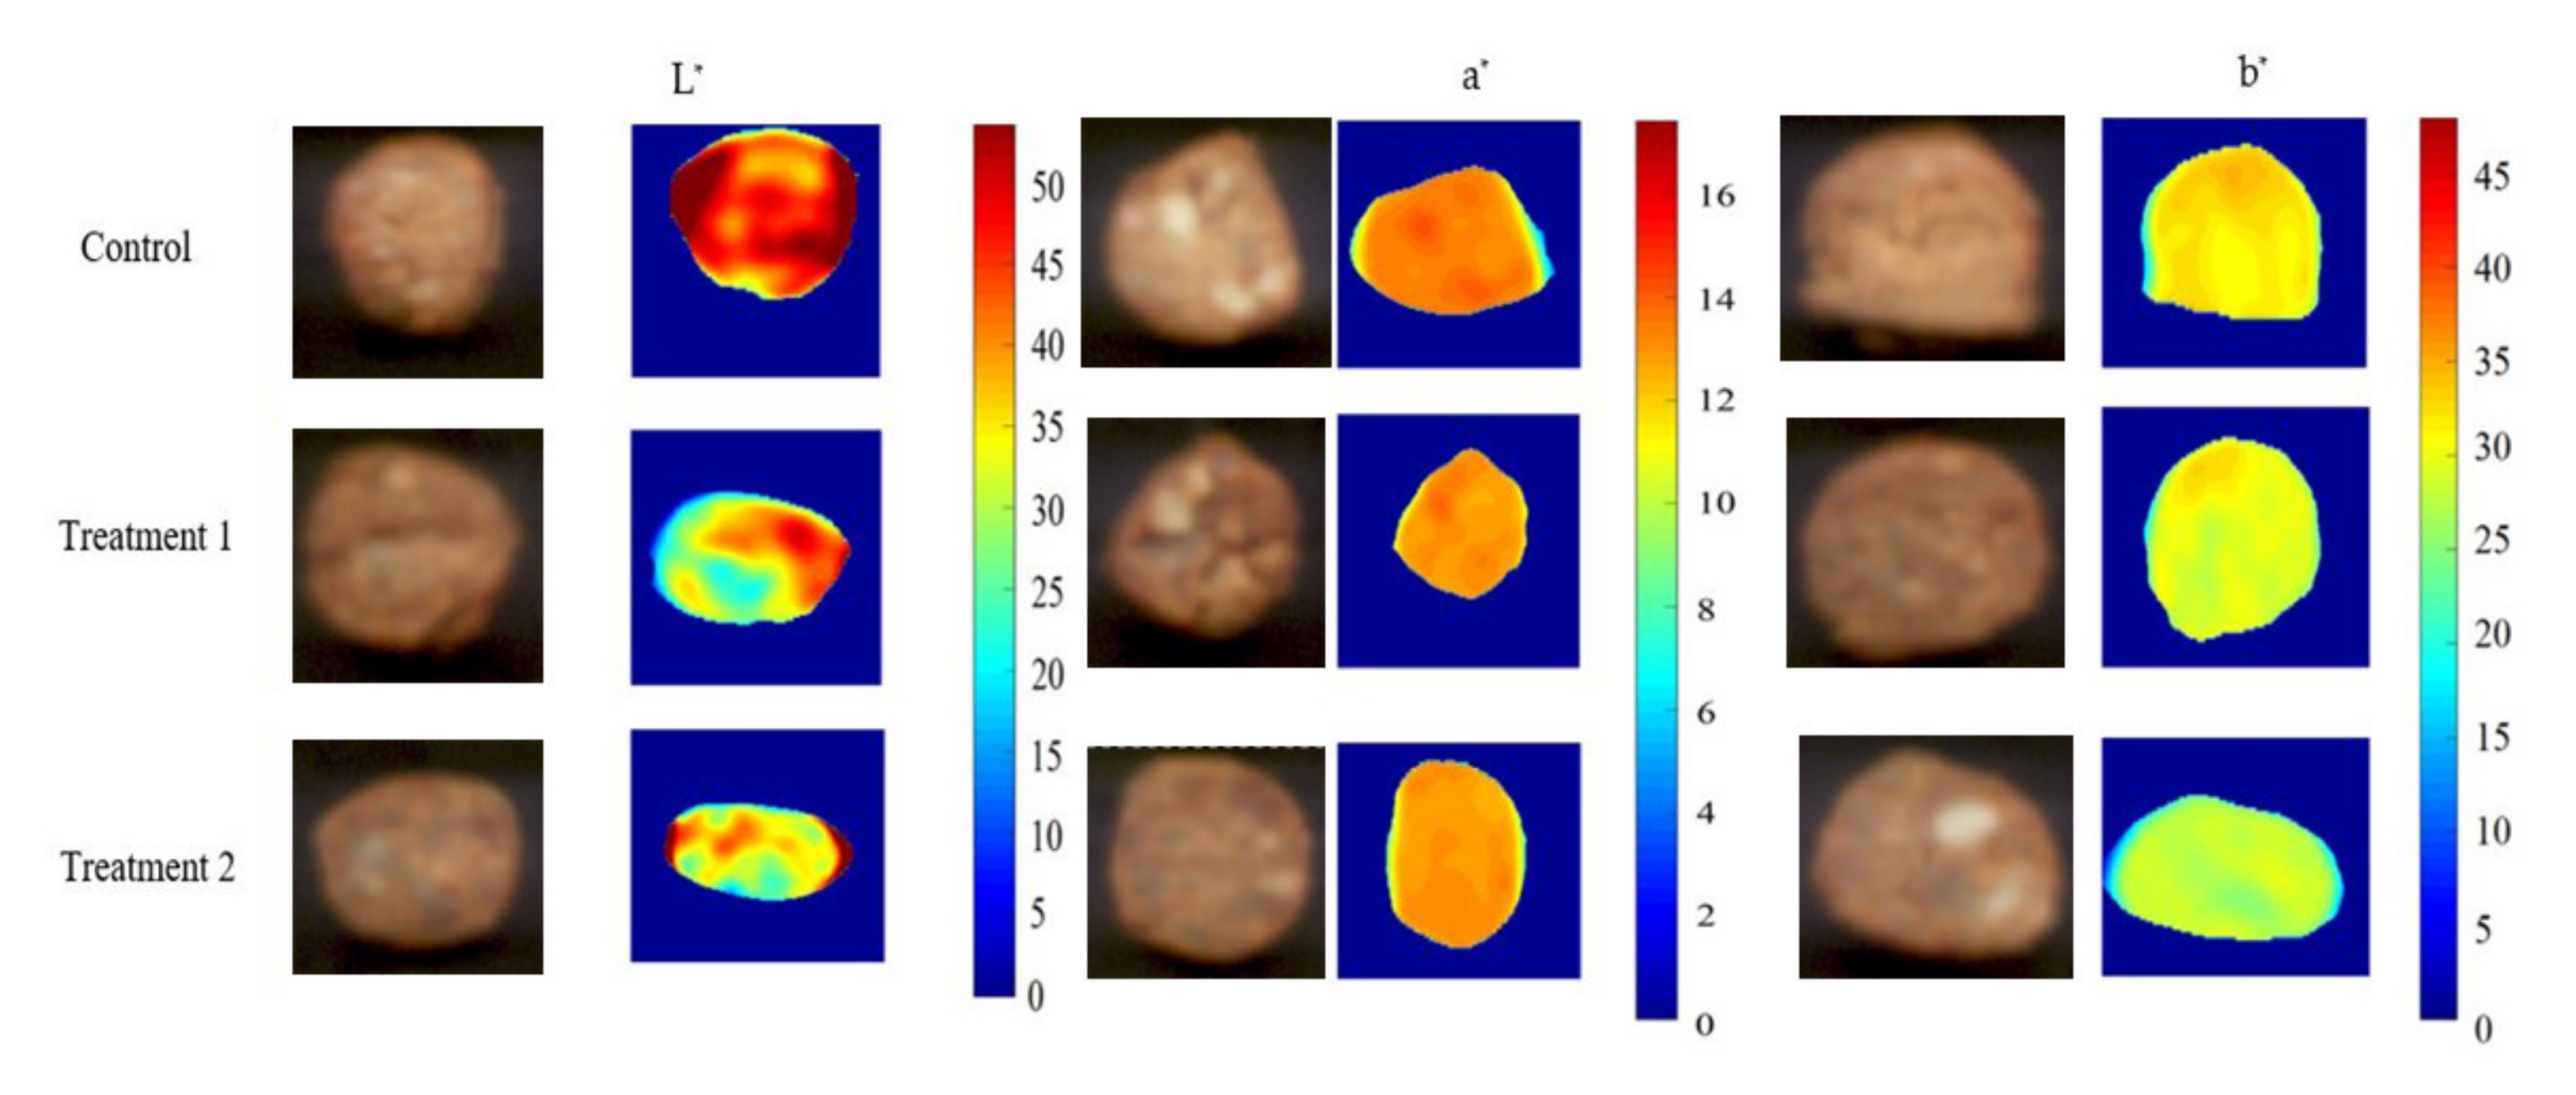
3.4. Visualisation of the Core Colour of Sausages

The main advantage of hyperspectral imaging is its prediction map in which a pixel with a similar spectral characteristic can be displayed [58]. Combined with MVA, the distribution and concentrations of L*, a*, and b* values within the sausages stuffed in different modified casings were mapped (Figure 3). Generally, the colour of the sausages is obtained as the mean value obtained from three (or more) random spots using the conventional colourimeter for colour measurement. Due to the uneven mixture for the sausage production, the measured value may not show the entire colour of the sausage. In contrast, it is predictable that each spot is clearly displayed via prediction map [9]. According to Figure 3, the control samples presented a higher lightness value than those of sausages stuffed in treatments 1 and 2. This is consistent with the observation wherein measured lightness for control (56.83 ± 5.48) was significantly higher than that for treatment 1 (50.86 ± 8.90) and treatment 2 (51.09 ± 8.56) (p < 0.05). It is clear that the lightness of surrounding parts of the sausages was higher than that in the middle parts, which may have been due to the high reflection of casing. With regard to redness and yellowness, the core colour of sausages were evenly distributed.
The current study possesses potential utility for applications:
  • The core colour of sausages with different modified casings were elaborated by HSI combined with MVA. The core colour changes on each pixel of casings modified by surfactant solutions were clearly displayed via distribution map. The results obtained from this technique can be used for automating the inspection and quality grading based on the core colour of the sausages by the integration of efficient image-processing algorithms in industrial machine-vision systems.
  • The relationships between colour parameters and different modified casings were clearly elucidated by the canonical discriminant analysis. Although the current classification accuracy could probably be outperformed by incorporating additional features from the acquired image data or applying different data treatments, the current study provides useful information for the sausage industry. For instance, lightness possessed the highest discriminant power, followed by yellowness (p < 0.05). It is thus feasible to apply discriminant analysis for separating the sausages stuffed in different casings.

4. Conclusions

The core colour of sausages with different modified casings were characterised by hyperspectral imaging coupled with a machine learning algorithm. The canonical discriminant analysis showed lightness can separate sausages with different modified casings. The coefficient of regression of a prediction model for lightness devised by spectra pre-treated with second derivative was 0.74 with the RMSEP of 4.27. With regard to redness, the PLSR model developed by second derivative reached a higher Rc2 value (Rc2 = 0.76), whilst the model developed by normalisation achieved a satisfactory Rc2 result (Rc2 = 0.82) along with the lowest RMSEC for yellowness (RMSEC = 1.81). Ten (385, 400, 415, 570, 690, 855, 880, 990, 995, and 1000 nm), ten (390, 400, 410, 415, 435, 515, 610, 630, 685, and 795 nm), and seven (390, 400, 415, 420, 435, 515, and 685 nm) wavelengths were selected as the important optimal wavelengths for L*, a* and b*, respectively. Those representative wavelengths were used for constructing the distribution map for elaborating the core colour of the sausages with different modified casings. The lightness of sausages with control casing was significantly higher than that of sausages with modified casings (p < 0.05). As an emerging tool to non-destructively evaluate the core colour of the sausages with different casings, hyperspectral imaging demonstrated its powerful prediction ability and fast analysis in online and off-line inspections.

Author Contributions

Conceptualisation, C.-H.F. and Y.M.; methodology, C.-H.F.; software, C.-H.F.; validation, C.-H.F.; formal analysis, C.-H.F.; investigation, C.-H.F. and Y.M.; resources, C.-H.F.; data curation, C.-H.F.; writing—original draft preparation, C.-H.F.; writing—review and editing, C.-H.F., J.F.G.M., and Y.M; visualisation, C.-H.F.; supervision, Y.M.; project administration, Y.M.; funding acquisition, C.-H.F. and Y.M. All authors have read and agreed to the published version of the manuscript.

Funding

This research was funded by Japan Society for the Promotion of Science (number P16104), a Grant-in-Aid for Scientific Research (JSPS number 16F16104), “Exploratory Collaboration Seed” in FY2020 “Collaboration Seed Fund” at Riken, Special Postdoctoral Researcher Program at Riken, and a JSPS Grant-in-Aid for Early-Career Scientists (number 20K15477).

Acknowledgments

The authors would also like to thank the anonymous reviewers for their constructive comments.

Conflicts of Interest

The authors declare no conflict of interest.

References

  1. Feng, C.H.; Makino, Y.; Oshita, S.; García-Martín, J.F. Hyperspectral imaging and multispectral imaging as the novel techniques for detecting defects in raw and processed meat products: Current state-of-the-art research advances. Food Control 2018, 84, 165–176. [Google Scholar] [CrossRef]
  2. Feng, C.H.; Makino, Y. Colour analysis in sausages stuffed in modified casings with different storage days using hyperspectral imaging—A feasibility study. Food Control 2020, 111, 107047. [Google Scholar] [CrossRef]
  3. Siripatrawan, U. Hyperspectral imaging for rapid evaluation and visualization of quality deterioration index of vacuum packaged dry-cured sausages. Sens. Actuators B-Chem. 2018, 254, 1025–1032. [Google Scholar] [CrossRef]
  4. Feng, C.H.; Makino, Y.; Yoshimura, M.; Thuyet, D.C.; García-Martín, J.F. Hyperspectral imaging in tandem with R statistics and image processing for detection and visualisation of pH in Japanese big sausages under different storage conditions. J. Food Sci. 2018, 83, 358–366. [Google Scholar] [CrossRef]
  5. Feng, C.H.; Makino, Y.; Yoshimura, M.; Rodríguez-Pulido, F.J. Real-time prediction of pre-cooked Japanese sausages color with different storage days using hyperspectral imaging. J. Sci. Food Agric. 2018, 98, 2564–2572. [Google Scholar] [CrossRef]
  6. Feng, C.H.; Makino, Y.; Yoshimura, M.; Rodríguez-Pulido, F.J. Estimation of adenosine triphosphate content in ready-to-eat sausages with different storage days, using hyperspectral imaging coupled with R statistics. Food Chem. 2018, 264, 419–426. [Google Scholar] [CrossRef]
  7. Feng, C.H.; Makino, Y.; Yoshimura, M.; Rodríguez-Pulido, F.J. Recent advances for rapid detection of quality and safety of fish by hyperspectral imaging analysis. In Hyperspectral Imaging Analysis and Applications for Food Quality; Nolet, L.M.L., Ed.; Boca Raton, FL, USA, 2018; Chapter 12; ISBN 978-1-138-63079-6. [Google Scholar]
  8. Reis, M.M.; Beers, R.V.; Al-Sarayreh, M.; Shorten, P.; Yan, W.Q.; Saeys, W.; Klette, R.; Craigie, C. Chemometrics and hyperspectral imaging applied to assessment of chemical, textural and structural characteristics of meat. Meat Sci. 2018, 144, 100–109. [Google Scholar] [CrossRef] [PubMed] [Green Version]
  9. Kamruzzaman, M.; Makino, Y.; Oshita, S. Online monitoring of red meat color using hyperspectral imaging. Meat Sci. 2016, 116, 110–117. [Google Scholar] [CrossRef]
  10. Kamruzzaman, M.; Makino, Y.; Oshita, S. Rapid and non-destructive detection of chicken adulteration in minced beef using visible near-infrared hyperspectral imaging and machine learning. J. Food Eng. 2016, 170, 8–15. [Google Scholar] [CrossRef]
  11. Zheng, X.C.; Li, Y.Y.; Wei, W.S.; Peng, Y.K. Detection of adulteration with duck meat in minced lamb meat by using visible near-infrared hyperspectral imaging. Meat Sci. 2019, 149, 55–62. [Google Scholar] [CrossRef]
  12. Zhao, Z.F.; Yu, H.Y.; Zhang, S.Y.; Du, Y.; Sheng, Z.Q.; Chu, Y.W.; Zhang, D.; Guo, L.B.; Deng, L. Visualization accuracy improvement of spectral quantitative analysis for meat adulteration using Gaussian distribution of regression coefficients in hyperspectral imaging. Optik 2020, 212, 164737. [Google Scholar] [CrossRef]
  13. Ma, J.; Sun, D.-W. Prediction of monounsaturated and polyunsaturated fatty acids of various processed pork meats using improved hyperspectral imaging technique. Food Chem. 2020, 321, 126695. [Google Scholar] [CrossRef] [PubMed]
  14. Jiang, H.Z.; Yoon, S.-C.; Zhuang, H.; Wang, W.; Li, Y.F.; Yang, Y. Integration of spectral and textural features of visible and near-infrared hyperspectral imaging for differentiating between normal and white striping broiler breast meat. Spectrochim. Acta A 2019, 213, 118–126. [Google Scholar] [CrossRef] [PubMed]
  15. Ye, X.J.; Lino, K.; Zhang, S.H. Monitoring of bacterial contamination on chicken meat surface using a novel narrowband spectral index derived from hyperspectral imagery data. Meat Sci. 2016, 122, 25–31. [Google Scholar] [CrossRef] [PubMed]
  16. Siripatrawan, U.; Makino, Y. Simultaneous assessment of various quality attributes and shelf life of packaged bratwurst using hyperspectral imaging. Meat Sci. 2018, 146, 26–33. [Google Scholar] [CrossRef] [PubMed]
  17. Feng, C.H.; Drummond, L.; Zhang, Z.H.; Sun, D. -W. Evaluation of innovative immersion vacuum cooling with different pressure reduction rates and agitation for cooked sausages stuffed in natural or artificial casing. LWT-Food Sci. Technol. 2014, 59, 77–85. [Google Scholar] [CrossRef]
  18. Chen, X.F.; Zhou, L.L.; Xu, H.Z.; Yamamoto, M.; Shinoda, M.; Tada, I.; Minami, S.; Urayama, K.; Yamane, H. The structure and properties of natural sheep casing and artificial films prepared from natural collagen with various crosslinking treatments. Int. J. Biol. Macromol. 2019, 135, 959–968. [Google Scholar] [CrossRef]
  19. Rebecchi, A.; Pisacane, V.; Miragoli, F.; Polka, J.; Falasconi, I.; Morelli, L.; Puglisi, E. High-throughput assessment of bacterial ecology in hog, cow and ovine casings used in sausages production. Int. J. Food Microbiol. 2015, 212, 49–59. [Google Scholar] [CrossRef]
  20. Makino, Y.; Ichimura, M.; Oshita, S.; Kawagoe, Y.; Yamanaka, H. Estimation of oxygen uptake rate of tomato (Lycopersicon esculentum Mill.) fruits by artificial neural networks modelled using near-infrared spectral absorbance and fruit mass. Food Chem. 2010, 121, 533–539. [Google Scholar] [CrossRef]
  21. Makino, Y.; Nishimura, Y.; Oshita, S.; Mizosoe, T.; Akihiro, T. Storage in high-barrier pouches increases the sulforaphane concentration in broccoli florets. PLoS ONE 2018, 13, e0192342. [Google Scholar] [CrossRef]
  22. Makino, Y.; Nishizaka, A.; Yoshimura, M.; Sotome, I.; Kawai, K.; Akihiro, T. Influence of low O2 and high CO2 environment on changes in metabolite concentrations in harvested vegetable soybeans. Food Chem. 2020, 317, 12380. [Google Scholar] [CrossRef] [PubMed]
  23. Wang, H.-W.; Makino, Y.; Inoue, J.; Maejima, K.; Funayama-Noguchi, S.; Yamada, T.; Noguchi, K. Influence of a modified atmosphere on the induction and activity of respiratory enzymes in broccoli florets during the early stage of postharvest storage. J. Agric. Food. Chem. 2017, 65, 8538–8543. [Google Scholar] [CrossRef] [PubMed]
  24. Yokota, Y.; Akihiro, T.; Boerzhijin, S.; Yamada, T.; Makino, Y. Effect of the storage atmosphere on metabolomics of harvested tomatoes (Solanum lycopersicum L.). Food Sci. Nutr. 2019, 7, 773–778. [Google Scholar] [CrossRef] [PubMed]
  25. Feng, C.H.; Sun, D.-W.; García Martín, J.F.; Zhang, Z.H. Effects of different cooling methods on shelf-life of cooked jumbo plain sausages. LWT-Food Sci. Technol. 2013, 54, 426–433. [Google Scholar] [CrossRef]
  26. Feng, C.H.; Sun, D.-W. Optimisation of immersion vacuum cooling operation and quality of Irish cooked sausages by using response surface methodology. Int. J. Food Sci. Tech. 2014, 49, 1850–1858. [Google Scholar] [CrossRef]
  27. Feng, C.H.; Drummond, L.; Sun, D.-W.; Zhang, Z.H. Evaluation of natural hog casings modified by surfactant solutions combined with lactic acid by response surface methodology. LWT-Food Sci. Technol. 2014, 58, 427–438. [Google Scholar] [CrossRef]
  28. Feng, C.H.; Drummond, L.; Sun, D.-W. Modelling the growth parameters of lactic acid bacteria and total viable count in vacuum-packaged Irish cooked sausages cooled by different methods. Int. J. Food Sci. Tech. 2014, 49, 2659–2667. [Google Scholar] [CrossRef]
  29. Feng, C.H.; Wang, W.; Makino, Y.; García-Martín, J.F.; Alvarez-Mateos, P.; Song, X.Y. Evaluation of storage time and temperature on physicochemical properties of immersion vacuum cooled sausages stuffed in the innovative casings modified by surfactants and lactic acid. J. Food Eng. 2019, 257, 34–43. [Google Scholar] [CrossRef]
  30. Feng, C.H.; Li, C. Immersion vacuum-cooling as a novel technique for cooling meat products: Research advances and current state-of-the art. Compr. Rev. Food. Sci. F. 2015, 14, 785–795. [Google Scholar] [CrossRef] [Green Version]
  31. Wang, X.H.; Zhang, Y.L.; Ren, H.Y.; Zhan, Y. Comparison of bacterial diversity profiles and microbial safety assessment of salami, Chinese dry-cured sausage and Chinese smoked-cured sausage by high-throughput sequencing. LWT-Food Sci. Technol. 2018, 90, 108–115. [Google Scholar] [CrossRef]
  32. Chen, J.X.; Hu, Y.Y.; Wen, R.X.; Liu, Q.; Chen, Q.; Kong, B.H. Effect of NaCl substitutes on the physical, microbial and sensory characteristics of Harbin dry sausage. Meat Sci. 2019, 156, 205–213. [Google Scholar] [CrossRef]
  33. Santos, E.D.; Müller, C.M.O.; Laurindo, J.B.; Petrus, J.C.C.; Ferreira, S.R.S. Technological properties of natural hog casings treated with surfactant solutions. J. Food Eng. 2008, 89, 17–23. [Google Scholar] [CrossRef]
  34. Bakker, W.; Houben, J.; Koolmees, P.; Bindrich, U.; Sprehe, L. Effect of initial mild curing, with additives, of hog and sheep sausage casings on their microbial quality and mechanical properties after storage at difference temperatures, Meat Sci. 1999, 51, 163–174. Meat Sci. 1999, 51, 163–174. [Google Scholar] [CrossRef]
  35. Feng, C.H.; García Martín, J.F.; Li, C.; Liu, B.-L.; Song, X.-Y.; Dong, Q.-L.; Wang, W.; Yang, Y. Evaluation of physicochemical properties and microbial attributes of cooked sausages stuffed in casing modified by surfactants and lactic acid after immersion vacuum cooling and long-term storage. Int. J. Food Sci. Tech. 2016, 51, 2270–2279. [Google Scholar] [CrossRef]
  36. Feng, C.H.; Liu, Y.W.; Makino, Y.; García-Martín, J.F.; Cummins, E. Evaluation of modified casings and chitosan-PVA packaging on the physicochemical properties of cooked Sichuan sausages during long term storage. Int. J. Food Sci. Tech. 2017, 52, 1777–1788. [Google Scholar] [CrossRef]
  37. Feng, C.H.; Li, C.; García-Martín, J.F.; Malakar, P.K.; Yan, Y.; Liu, Y.-W.; Wang, W.; Liu, Y.-T.; Yang, Y. Physical properties and volatile composition changes of cooked sausages stuffed in a new casing formulation based in surfactants and lactic acid during long-term storage. J. Food Sci. 2017, 82, 594–604. [Google Scholar] [CrossRef]
  38. EIMasry, G.M.; Nakauchi, S. Image analysis operations applied to hyperspectral images for non-invasive sensing of food quality—A comprehensive review. Biosyst. Eng. 2016, 142, 53–82. [Google Scholar] [CrossRef]
  39. Yin, W.G.; Ma, Z.M. High order discriminant analysis based on Riemannian optimization. Knowl.-Based Syst. 2020, 195(105630). [Google Scholar] [CrossRef]
  40. Matera, J.A.; Cruz, A.G.; Raices, R.S.L.; Silva, M.C.; Nogueira, L.C.; Quitério, R.N.; Cavalcanti, R.N.; Freiras, M.Q.; Conte Júnior, C.A. Discrimination of Brazilian artisanal and inspected pork sausages: Application of unsupervised, linear and non-linear supervised chemometric methods. Food Res. Int. 2014, 64, 380–386. [Google Scholar] [CrossRef]
  41. Fasolato, L.; Carraro, L.; Facco, P.; Cardazzo, B.; Balzan, S.; Taticchi, A.; Andreani, N.A.; Montemurro, F.; Martino, M.E.; Lecce, G.D.; et al. Agricultural by-products with bioactive effects: A multivariate approach to evaluate microbial and physicochemical changes in a fresh pork sausage enriched with phenolic compounds from olive vegetation water. Int. J. Food Microbiol. 2016, 228, 34–43. [Google Scholar] [CrossRef]
  42. Varrà, M.O.; Fasolato, L.; Serva, L.; Ghidini, S.; Novelli, E.; Zanardi, E. Use of near infrared spectroscopy coupled with chemometrics for fast detection of irradiated dry fermented sausages. Food Control 2020, 110, 107009. [Google Scholar] [CrossRef]
  43. Siripatrawan, U.; Makino, Y. Monitoring fungal growth on brown rice grains using rapid and non-destructive hyperspectral imaging. Int. J. Food Microbiol. 2015, 199, 93–100. [Google Scholar] [CrossRef] [PubMed]
  44. Kamruzzaman, M.; Makino, Y.; Oshita, S. Parsimonious model development for real-time monitoring of moisture in red meat using hyperspectral imaging. Food Chem. 2016, 196, 1084–1091. [Google Scholar] [CrossRef] [PubMed]
  45. Xu, J.L.; Riccioli, C.; Sun, D.-W. Development of an alternative technique for rapid and accurate determination of fish caloric density based hyperspectral imaging. J. Food Eng. 2016, 190, 185–194. [Google Scholar] [CrossRef]
  46. Girolamo, A.D.; Lippolis, V.; Nordkvist, E.; Visconti, A. Rapid and non-invasive analysis of deoxynivalenol in durum and common wheat by Fourier-Transform Near Infrared (FT-NIR) spectroscopy. Food Addit Contam. A 2009, 26, 907–917. [Google Scholar] [CrossRef] [PubMed]
  47. Oto, N.; Oshita, S.; Kawagishi, S.; Makino, Y.; Kawagoe, Y.; Al-Haq, M.I.; Shinozaki, S.; Hiruma, N. Non-destructive estimation of ATP contents and plate count on pork meat surface by UV-Vis reflectance spectrum analysis. J. Food Eng. 2012, 110, 9–17. [Google Scholar] [CrossRef]
  48. Shen, F.; Yang, D.; Ying, Y.; Li, B.; Zheng, Y.; Jiang, T. Discrimination between Shaoxing wines and other Chinese rice wines by near-infrared spectroscopy and chemometrics. Food Bioprocess. Tech. 2012, 5, 786–795. [Google Scholar] [CrossRef]
  49. Skjelvareid, M.H.; Heia, K.; Olsen, S.H.; Stormo, S.K. Detection of blood in fish muscle by constrained spectral unmixing of hyperspectral images. J. Food Eng. 2017, 212, 252–261. [Google Scholar] [CrossRef]
  50. Xu, L.; Zhou, Y.P.; Tang, L.J.; Wu, H.L.; Jiang, J.H.; Shen, G.L.; Yu, R.Q. Ensemble preprocessing of near-infrared (NIR) spectra for multivariate calibration. Anal. Chim Acta 2008, 616, 138–143. [Google Scholar] [CrossRef]
  51. Nolasco-Perez, I.M.; Rocco, L.A.C.M.; Cruz-Tirado, J.P.; Pollonio, M.A.R.; Barbon, S.; Barbon, A.P.A.C.; Barbin, D.F. Comparison of rapid techniques for classification of ground meat. Biosyst. Eng. 2019, 183, 151–159. [Google Scholar] [CrossRef]
  52. Cozzolino, D.; Murray, I. Identification of animal meat muscles by visible and near infrared reflectance spectroscopy. Lwt-Food Sci. Technol. 2004, 37, 447–452. [Google Scholar] [CrossRef]
  53. Mamani-Linares, L.W.; Gallo, C.; Alomar, D. Identification of cattle, llama and horse meat by near infrared reflectance or transflectance spectroscopy. Meat Sci. 2012, 90, 378–385. [Google Scholar] [CrossRef] [PubMed]
  54. Barbin, D.; ElMasry, G.; Sun, D.-W.; Allen, P. Predicting quality and sensory attributes of pork using near-infrared hyperspectral imaging. Anal. Chim. Acta 2012, 719, 30–42. [Google Scholar] [CrossRef] [PubMed]
  55. Peng, Y.K.; Wang, W.X. Application of near-infrared spectroscopy for assessing meat quality and safety. In Infrared Spectroscopy—Anharmonicity of Biomolecules, Crosslinking of Biopolymers, Food Quality and Medical Applications; Theophanides., T., Ed.; InTech: London, UK, 2015; Chapter 8. [Google Scholar]
  56. Sanz, J.A.; Fernandes, A.M.; Barrenechea, E.; Silva, S.; Santos, V.; Gonçalves, N.; Paternain, D.; Jurio, A.; Melo-Pinto, P. Lamb muscle discrimination using hyperspectral imaging: Comparison of various machine learning algorithms. J. Food. Eng. 2016, 174, 92–100. [Google Scholar] [CrossRef]
  57. Lorenzo, J.M.; Bedia, M.; Banon, S. Relationship between flavour deterioration and the volatile compound profile of semiripened sausage. Meat Sci. 2013, 93, 614–620. [Google Scholar] [CrossRef]
  58. Feng, C.H.; Otani, C. Terahertz Spectroscopy Technology as an Innovative Technique for Food: Current State-of-the-Art Research Advances. Crit. Rev. Food Sci. Nutr. 2020. (In Press) [Google Scholar] [CrossRef]
Figure 1. Mean spectra of the sausages with different casings in the spectral range of 380–1000 nm.
Foods 09 01089 g001
Figure 2. Distribution of the sausages in the coordinate system defined by the two discriminant functions used to differentiate among sausages stuffed in control (green circles), treatment 1 (pink squares), and treatment 2 (black triangles) casings.
Foods 09 01089 g002
Figure 3. Original sausage images and a corresponding distribution map of lightness (L*), redness (a*), and yellowness (b*) changes of control casing sausages (up), and sausages stuffed in modified casings using treatment 1 (central) and treatment 2 (down) kept at 4 °C after one day storage.
Foods 09 01089 g003
Table 1. Sausage ingredients.
Concentration (% w/w)
Lean pork 43.44
Back fat20.49
Chinese white wine26.73
Spice and seasoning4.90
Sugars2.50
Table 2. Calibration and prediction statistics for predicting core colour parameters based on full and important optimal wavelengths using PLSR with different pre-treatments.
Full wavelengths Calibration GroupPrediction GroupCross Validation
ParametersPre-TreatmentRc 2RMSEC 1Rp 2RMSEP 2Rcv 2RMSECV 3
L*6Raw0.714.260.714.570.744.17
Normalisation0.724.210.734.380.754.04
1st derivative0.734.150.744.270.764.01
2nd derivative 0.734.150.744.270.754.10
MSC 40.714.260.714.570.724.31
SNV 50.753.970.684.790.754.09
a*7Raw0.591.460.551.510.591.44
Normalisation0.641.370.611.390.641.35
1st derivative 0.761.110.571.470.661.31
2nd derivative 0.761.110.571.470.641.34
MSC0.591.460.541.510.591.44
SNV0.731.190.581.450.691.26
b*8Raw0.762.060.452.910.712.24
Normalisation0.821.810.492.80.722.17
1st derivative 0.652.520.442.920.682.35
2nd derivative 0.652.520.442.920.722.19
MSC0.762.060.452.910.712.21
SNV0.632.570.562.620.712.22
Important optimal wavelengthsL* Raw0.664.630.704.620.694.50
(385,400,415,Normalisation0.694.420.684.810.724.31
570,690,855,880,1st derivative 0.654.70.694.740.724.34
2nd derivative 0.704.360.645.060.714.35
990,995,1000)MSC0.654.730.664.950.714.38
SNV0.654.730.664.950.694.52
a* Raw0.571.470.561.490.571.48
(390,400,410,Normalisation0.611.420.621.380.611.40
415,435,515,1st derivative 0.611.40.541.520.61.42
2nd derivative 0.611.420.561.490.591.45
610,630,685,795)MSC0.581.470.631.360.591.44
SNV0.621.390.621.380.641.35
b* Raw0.602.680.383.090.652.45
(390, 400, 415, Normalisation0.762.080.313.250.652.44
420, 435,
515,685)1st derivative 0.732.220.373.110.672.39
2nd derivative 0.532.920.373.100.642.48
MSC0.662.490.422.980.672.36
SNV0.662.490.422.980.672.36
1 RMSEC: the root mean square error of calibration; 2 RMSEP: the root mean square error of prediction; 3 RMSECV: the root mean square error of cross validation; 4 SNV: standard normal variate; 5 MSC: multiplicative scatter correction; 6 L*: lightness; 7 a*: redness/greenness; 8 b*: yellowness/blueness
Table 3. Colour parameters of sausages with different types of casings and main statistics of the canonical discriminant functions from colour variables.
Colour ParametersLightnessRednessYellownessSeparationCanonical FunctionEigenvalueVariance (%)Canonical CorrectionWilks’ Lambdap Value
Control56.83 ±5.48 a 16.23 ± 2.42 ab20.26 ± 4.81 a
Treatment 150.86 ± 8.90 b7.09 ± 2.41 a19.75 ± 4.17 abTreatmentsFunction 10.4382.40.550.64<0.01
Treatment 251.09 ± 8.56 b5.72 ± 1.74 b17.66 ± 2.89 bFunction 20.0917.60.290.92<0.05
1 Averages with different superscript letters (a, b) in the same column were significantly different (p < 0.05).

