State of Health Estimation for Lithium-Ion Batteries Based on the Constant Current–Constant Voltage Charging Curve

1
College of Automation Science and Engineering, South China University of Technology, Guangzhou 510641, China
2
Guangzhou Triv Electronic Technologies Co. LTD, Guangzhou 510640, China
*
Author to whom correspondence should be addressed.
Electronics 2020, 9(8), 1279; https://doi.org/10.3390/electronics9081279
Submission received: 8 June 2020
/
Revised: 31 July 2020
/
Accepted: 5 August 2020
/
Published: 9 August 2020
(This article belongs to the Section Power Electronics)
Abstract
:The state of health is an indicator of battery performance evaluation and service lifetime prediction, which is essential to ensure the reliability and safety of electric vehicles. Although a large number of capacity studies have emerged, there are few simple and effective methods suitable for engineering practice. Hence, a least square support vector regression model with polynomial kernel function is presented for battery capacity estimation. By the battery charging curve, the feature samples of battery health state are extracted. The grey relational analysis is employed for the feature selection, and the K-fold cross-validation is adopted to obtain hyper-parameters of the support vector regression estimation model. To validate this method, the support vector regression estimation model was trained and tested on the battery data sets provided by NASA Prognostics Center of Excellence. The experimental results show that the proposed method only needs some battery feature data, and can achieve high-precision capacity estimation, which indicates that the proposed method shows great efficiency and robustness.
1. Introduction
In recent years, the rapid development of electric vehicles (EVs) has effectively alleviated the pressure of energy crisis and environmental pollution [1,2]. Due to the outstanding characteristics of high energy density, long cycle life, and high efficiency, lithium-ion batteries have become the main power solution for EVs. Therefore, for EVs that use lithium-ion batteries as power on a large scale, the performance degradation of lithium-ion batteries is critical [3,4], and there are still some problems in the EV industry that need to be solved, such as mileage, service life, and battery safety. [5,6]. Among these issues, how to estimate battery health status rapidly is a critical and difficult issue for battery management systems (BMS). The state of health (SOH) indicates a change in the ability of the battery to store and release electrical energy compared to the new battery [7,8], which can directly reflect the aging of the battery [9,10]. Typically, after the actual capacity of the battery drops to 70% or 80% of its nominal capacity, the remaining useful life (RUL) of the battery reaches the end of life (EOL). Therefore, under the accurate SOH estimation, the battery can be replaced in time before the battery fails to avoid system collapse.
1.1. Review of Estimation Approaches
Direct measurement is one of the most common methods used in engineering applications. Generally, an increase in battery resistance can be used to indicate SOH. However, due to different battery materials and application environments, battery capacity fade and resistance increase may expand at multiple speeds, which hinders the method for calculating SOH based on battery internal resistance [11]. The open circuit voltage (OCV) of lithium-ion batteries is regarded as a convenient way for state of charge (SOC) and SOH estimation [12]. Nevertheless, during the battery testing, the discharge current is extremely low and takes a lot of time. As another effective method, battery electrochemical impedance spectroscopy (EIS) employs information about electrode reactions and then identifies the internal processes of lithium batteries [13]. The EIS testing relies on expensive equipment, which makes it difficult to apply to engineering practice. Moreover, the ultra-low resistance of the power battery almost exceeds the detection range of the EIS testing.
To enhance the accuracy of battery SOH estimation, some adaptive state estimation methods are used for the battery SOH prediction. Wassiliadis, N et al. [14] proposed an approach tackling battery SOH estimation, which consists of two extended Kalman filters (EKFs), that synchronously estimate both the battery SOH and model parameters. Shi, E et al. [15] proposed a method that uses improved unscented particle filter (IUPF) to estimate the ohm internal resistance, and then estimates the SOH based on the internal resistance. The testing results show that IUPF has certain advantages, with the SOH estimation error always less than 3%. Feng, Y. designed three terminal sliding-mode observers (TSMOs), one used to estimate battery SOC, and two additional TSMOs which are subsequently presented to estimate the battery SOH [16]. Finally, a set of complete estimation models for battery SOC and SOH are formulated. Li, Y. et al. [17] proposed a simple and robust smoothing method based on a Gaussian filter to reduce the noise on incremental capacity curves, thus the signatures associated with battery aging can therefore be accurately identified. Although various filtering methods of modern control theory have obtained accurate SOH estimation results, they require a priori knowledge of system states, which increases the computational cost and makes it difficult to implement SOH estimates.
With the rapid development of artificial intelligence (AI), machine learning (ML) methods have been applied for battery health monitoring. To supply accurate battery SOH estimation, Yang, Duo et al. proposed a Gaussian process regression (GPR) model based on the charging curve [18]. Guo, Peiyao et al. proposed a new method that depends on a relative vector machine (RVM) to estimate the SOH of lithium-ion batteries by health feature extraction [19]. Cai, Lei et al. proposed a new evolutionary framework for battery SOH estimation. The feature sample can be measured by a set of battery current pulses just lasting a few seconds. With this new evolutionary framework, a battery SOH can be accurately estimated by support vector regression (SVR) and genetic algorithms (GA) [20]. Although ML methods require a large number of samples for model training, they rarely require modeling or complex proofs, which makes them a new research direction for battery SOH estimation.
The direct measurement method [11,12,13] estimates the battery SOH by measuring the battery voltage, current, and EIS characteristics. It is easy to implement and can be used in engineering applications, but the estimation accuracy is limited. The adaptive method [14,15,16,17] realizes battery SOH estimation through a designed observer or filter, which relies on battery equivalent circuit model (ECM) and model parameters. Hence, it must focus on the battery mechanism model, solid electrolyte interface (SEI), lithium plating and other aging mechanisms. The ML method [18,19,20], with the collection of feature sample data, can establish a model for battery SOH estimation. It is implemented to learn the internal relationship between features and battery SOH. In addition, other methods for battery SOH estimation can be found which are not considered to be inside the determined classification [21,22,23]. Under the above literature review and analysis, the battery SOH estimation is confronted with three challenges. First, the battery capacity is related to complex internal chemical reactions, and cannot be measured directly and accurately. Furthermore, the lithium batteries are also affected by the external environment. The changes of environment temperature may alter battery internal resistance, which in turn affects battery SOH estimation. Third, battery SOH is a key indicator of battery cells, which can effectively prevent battery failure and ensure the reliability and safety of electric vehicle travel. More importantly, accurate battery SOH estimation can promote the timely batteries’ recovery, and ladder utilization, which is a challenging and meaningful task.
1.2. Contribution and Organization
To conquer the challenge, a least square support vector regression (LS-SVR) model with a polynomial kernel function is proposed for lithium-ion batteries’ SOH estimation. The contributions of this research are shown below.
- (1)
- A new SOH estimation method for lithium-ion batteries is proposed, the LS-SVR model only needs some feature samples of battery charging curve and can work efficiently, which does not depended on ECM, complex mathematical calculations and time-consuming parameter tuning.
- (2)
- Based on the battery charging curve in the constant current and constant voltage (CC–CV) phase, the feature samples in the degradation process can be easily obtained. This method for feature acquisition is efficient and convenient in engineering applications.
The remainder of this paper is organized as follows. The related work is introduced in Section 2 and Section 3 introduces the modeling approach of SoH estimation. The SoH estimation results and analysis are presented in Section 4, Section 5 and Section 6 which provide the discussion and conclusion of battery SoH estimation, respectively.
2. Related Work
2.1. Problem Formulation of SOH
The capacity fade of the lithium-ion battery has three main origins: loss of negative electrode active material, loss of positive electrode active material, and loss of lithium inventory (LLI). The LLI contains aging mechanisms, e.g., solid electrolyte interface (SEI) formation and lithium plating, where cyclable lithium is consumed by side reactions.
To date, as the indicator of the battery degradation degree, there has been no uniform definition for battery SoH. Multiple notions are created to denote the battery SoH, which includes battery internal resistance, battery capacity, cycle number, and so on [5]. In general, the battery SoH can be defined by the capacity ratio as shown in Equation (1):
where is the SOH value at the cycle, is the capacity at the cycle, is the initial capacity.
2.2. The Constant Current and Constant Voltage Test
The first stage of CC–CV charging is constant current charging. The battery is continuously charged with a predetermined current until the battery’s charging cut-off voltage. During this period, the voltage is not stable. If the battery voltage is not limited, the battery voltage will continue to rise, causing internal polarization, destroying the battery structure, and even causing battery failure or explosion. The second stage of CC–CV charging is constant voltage charging. After constant current charging, when the battery voltage reaches a predetermined value, it will switch to constant voltage charging. In order to ensure that the battery can be fully charged without being damaged, trickle charging is used in the constant voltage charging mode. As the charging capacity increases, the actual battery voltage will get closer and closer to the set voltage. At this time, the current will gradually decrease. When the charging current approaches zero, the battery is fully charged.
3. Modeling and Methodology
3.1. Feature Construction
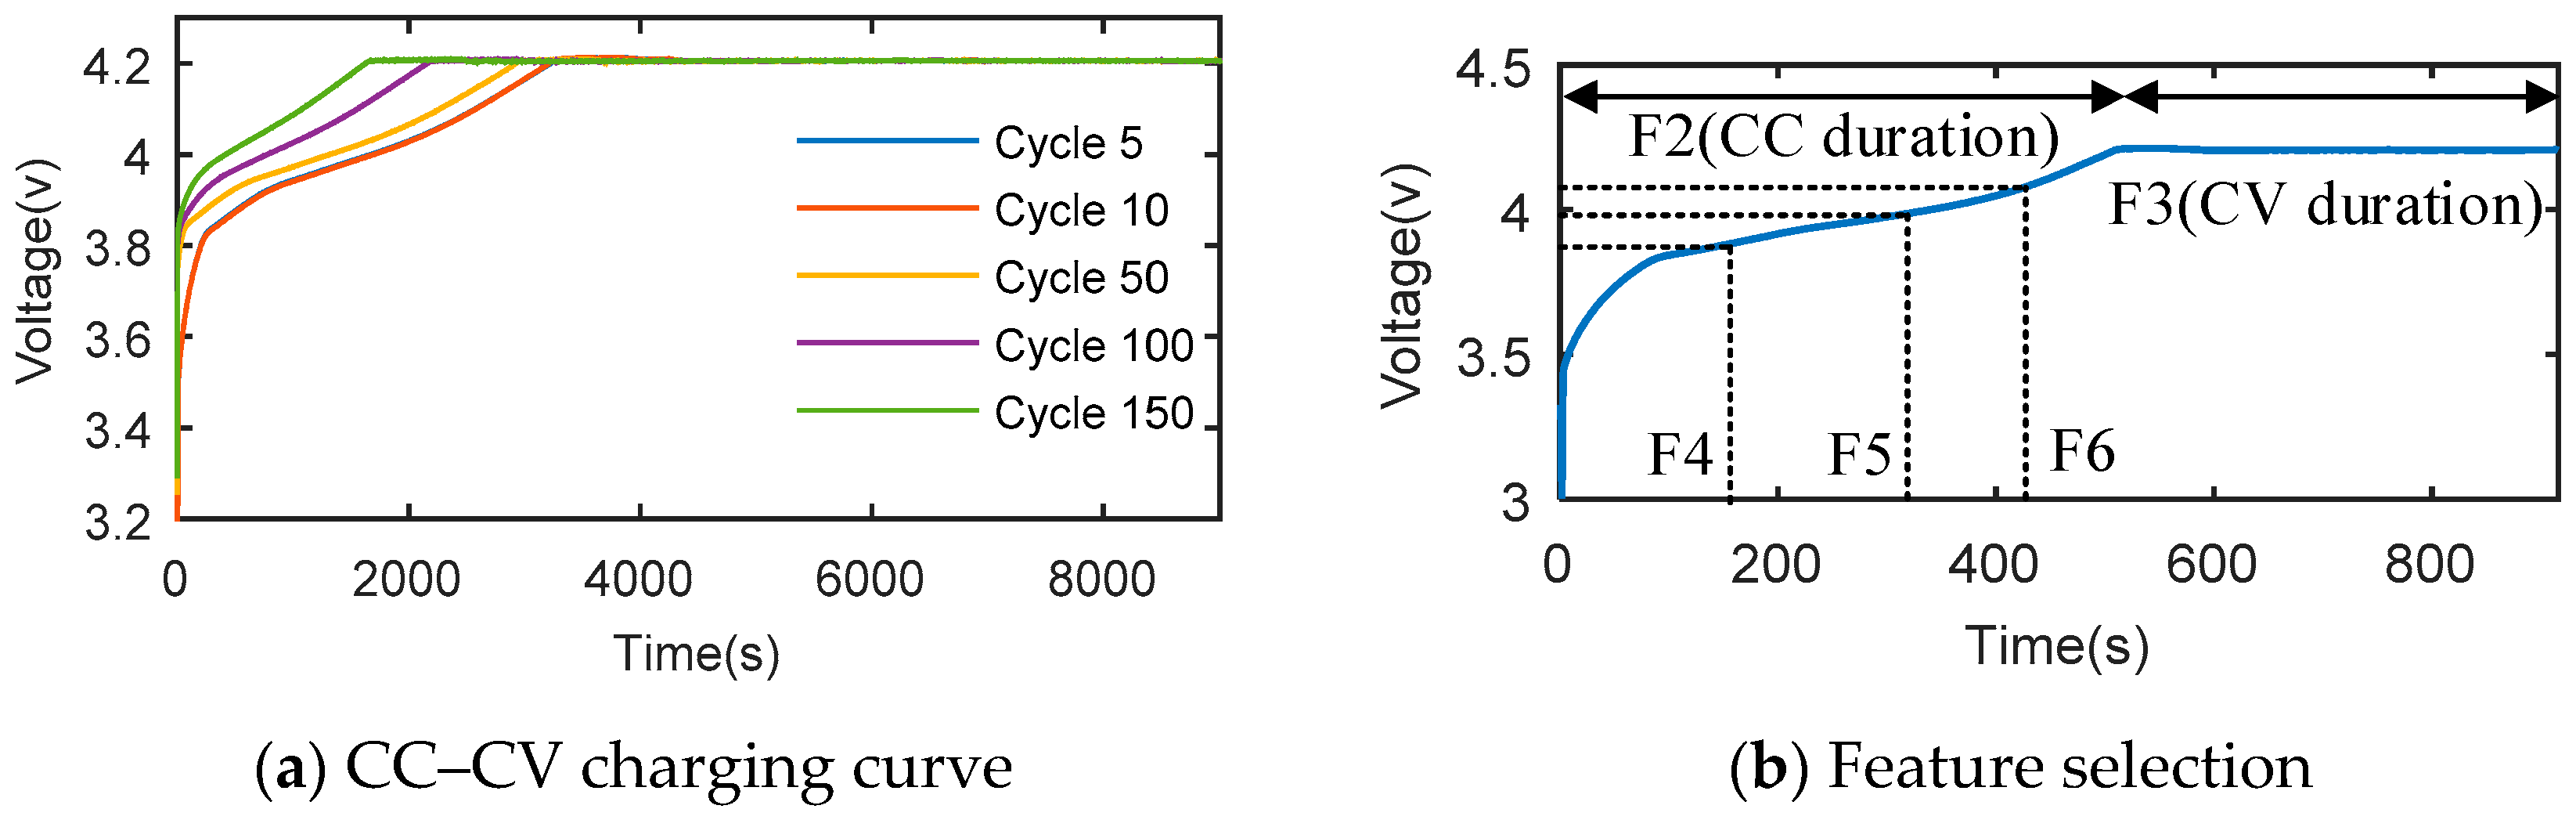
Figure 1a shows the constant current–constant voltage (CC–CV) charging curve of lithium-ion batteries at different cycle numbers. According to the figure, some laws with regard to battery aging can be found: as the battery cycle life increases, the charging time in the CC phase shows a downward trend, while the duration time in the CV phase shows an increasing trend. Since there is a relationship between the battery-charging curve and the cycle life, this helps establish the correlation with the SOH estimate by analyzing the battery charging curve characteristics. Therefore, based on the geometric characteristics of the charging curve at different cycle numbers, six features (F1, F2, F3, F4, F5, and F6) were selected for battery SOH estimation.
- (1)
- F1 is the cycle number, indicating the number of cycles of battery charge and discharge. The battery SOH and the cycle life are relevant for the batteries in this case. To develop an accurate battery SOH estimation method, the cycle number is considered as a feature variable.
- (2)
- F2 is the duration time of the CC phase, and the charging time in the CC phase decreases as the battery cycle number increases. The duration time can show how much battery capacity can be charged in the CC phase, which denotes the battery polarization phenomenon.
- (3)
- F3 is the duration time of the CV phase, it is employed to eliminate the polarization effect caused by CC phase to ensure the battery can be fully charged. The longer the CV phase duration is, the more difficult the lithium intercalation process will be.
- (4)
- F4 is the duration time of the CC phase at 3.9 V, F5 is the duration time of the CC phase at 4.0 V, F6 is the duration time of the CC phase at 4.1 V.
3.2. Features Extraction
Feature selection is a key part of building an ML model. If the number of features is too small, the accuracy of the model estimation will not be high; however, if the number of features is increased, the accuracy of the model estimation will not increase monotonically. Obviously, choosing the right features will be beneficial to model prediction. Therefore, the grey relational analysis (GRA) algorithm [24] is adopted for feature selection. This is a theory based on the grey system, trying to measure the level of relationship based on the similarity between the factors. The GRA provides quantitative measurements of system evolution and is ideal for dynamic process analysis. The specific steps of the algorithm are as follows.
- Step 1.
- For a given data set, determine the reference sequence , where ; and comparative sequence , here ;
- Step 2.
- Data normalization;
- Step 3.
- Compute the relational coefficients:where is the identification coefficient, and ;
- Step 4.
- Compute the relational grade :
According to the GRA algorithm, the relationship level between the feature and the SOH can be calculated, as shown in Table 1. The closer the value of the relationship level is to 1, the greater the relationship between the feature and the SOH. The correlation between F1–F6 and SOH is very close to 1, which indicates that the selection of these features is reasonable for constructing the LS-SVR model and providing an accurate SOH estimation.
3.3. SOH Estimation by LS-SVR
Support vector machine (SVM) was developed by Vapnik and co-workers [25]. It is widely used for classification and regression, and has shown superior performance for small sample, nonlinear and high dimensional data sets compared to other ML algorithms. The theoretical foundations of SVM are Vapnik Chervonenkis (VC) dimension theory and the criterion of minimizing structural risk, which is composed of empirical risk and confidence interval. Give the training sample set as
where is the feature variable, is the ground-truth value, . There exists an optimal hyper-plane to separate the training data set as
where is the mapping function that can enhance the model performance, is the weight vector and is the offset item. For the LS-SVR regression model [26], the hyper-plane can be transformed into the following optimization problems:
where the parameter is the introduced slack variable to measure the error variance of the LS-SVR model, the parameter is a penalty factor that establishes a trade-off between model flatness and empirical risk. Equation (6) is a convex optimization problem. Therefore, a Lagrange function is introduced to solve the convex optimization problem, as shown in Equation (7):
where and are the Lagrange multipliers. According to Karush–Kuhn–Tucher (KKT) conditions, the Lagrange function is allowed to have a partial derivative of 0 for the optimization target. Then, we have:
The Equations can be converted into the following form:
Hence, the decision function is obtained by solving Equation (9), and the regression model can be written as
where the is defined as follows:
The Equation (11) is termed as the kernel function that meets the Mercer’s condition [27], can avoid calculating the complex transformation. The common kernel functions of SVM are shown in Table 2.
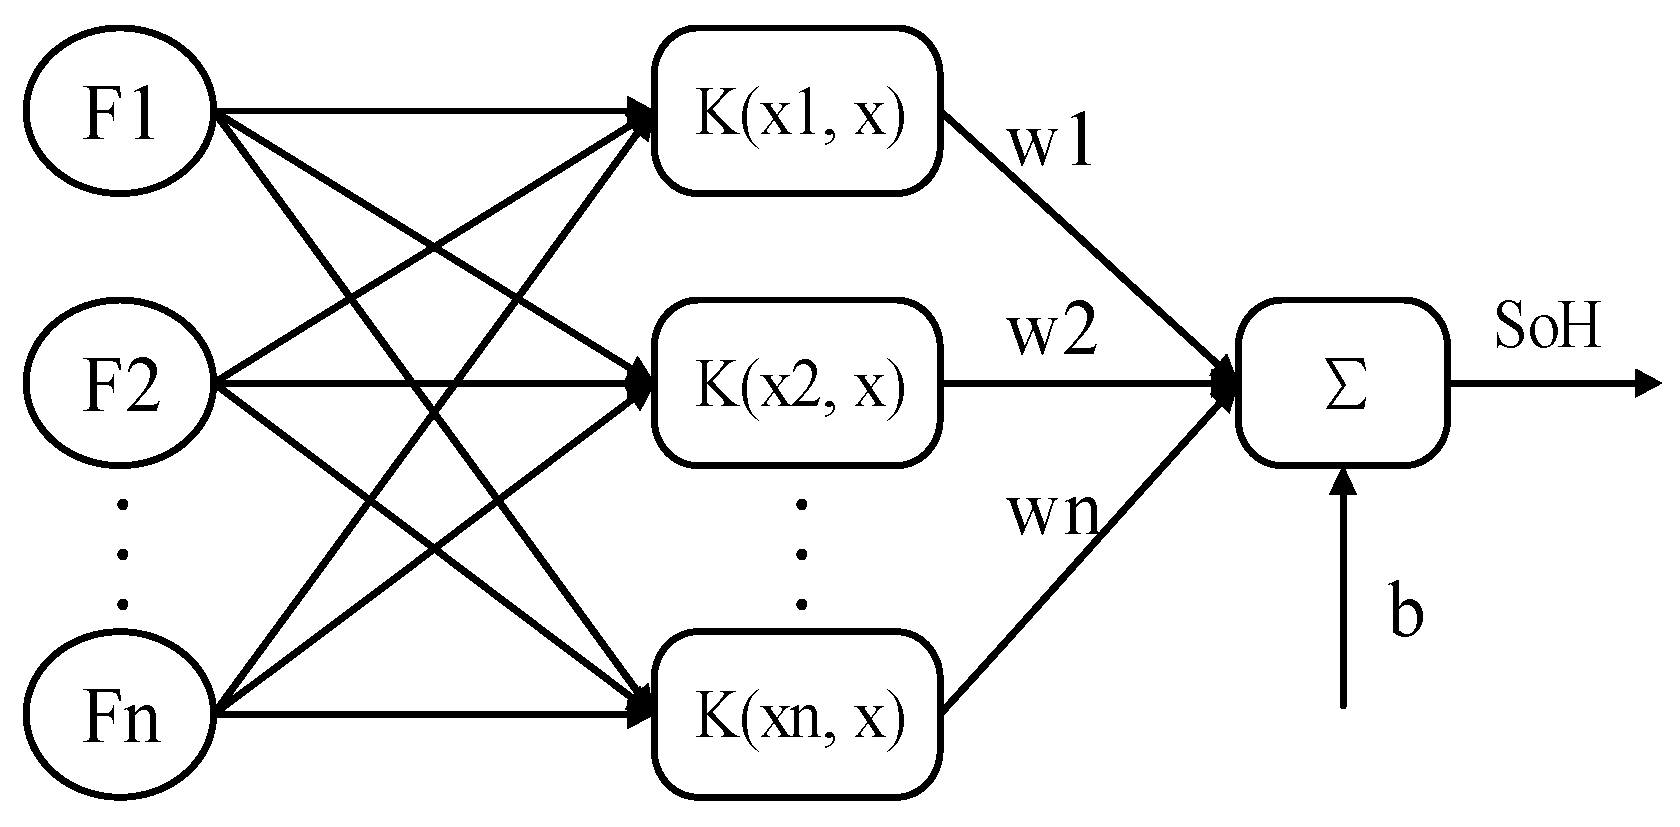
Thus, the structure diagram of the LS-SVR model for battery SOH prediction is shown in Figure 2.
3.4. Hyperparametric Optimization
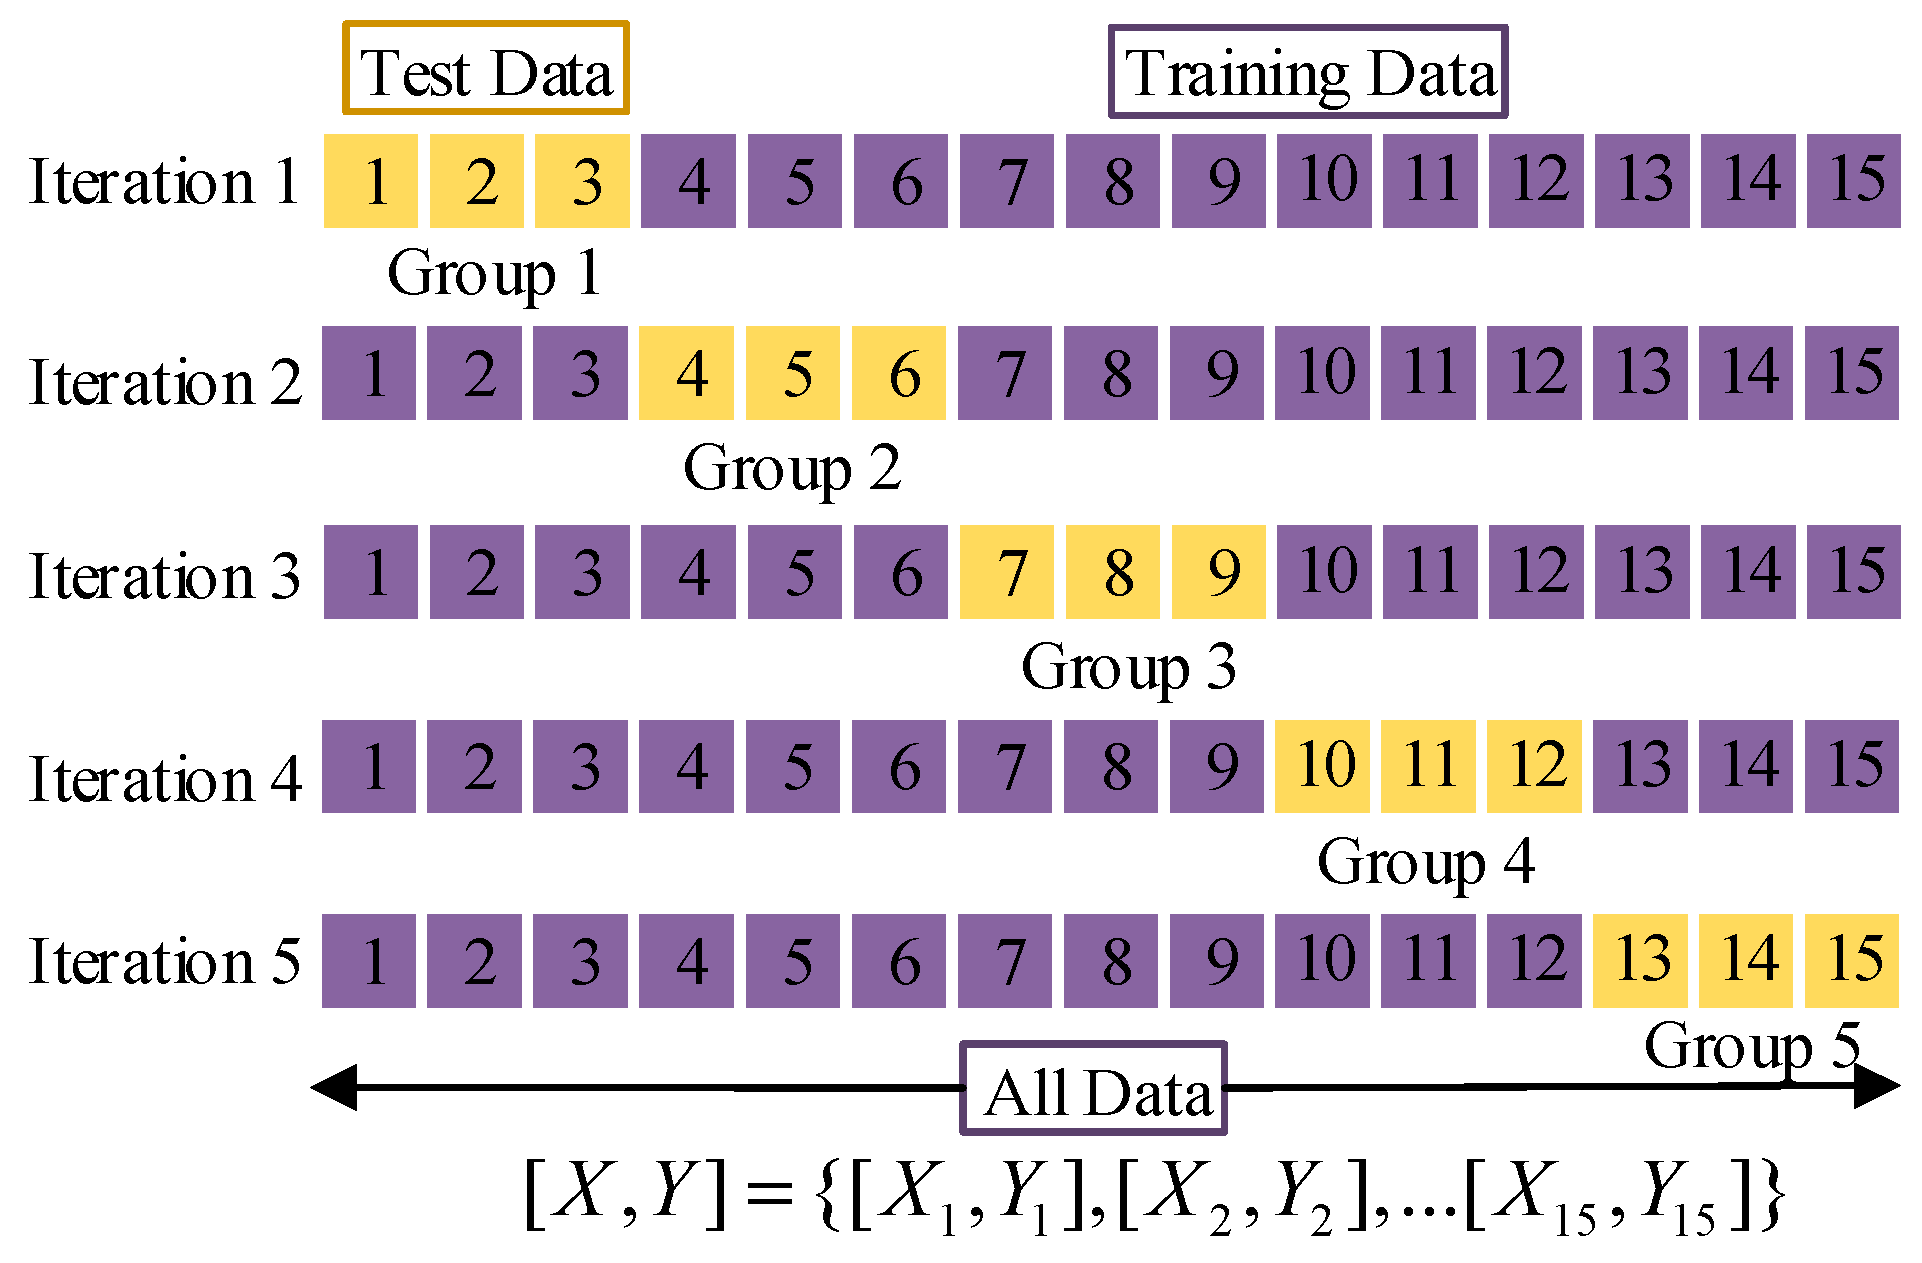
To achieve a better estimation performance of the LS-SVR model, kernel parameters and penalty factors should be optimized before model testing. In this paper, model parameters are configured based on personal experience, and then the model hyperparameters are selected by using K-fold cross-validation [28]. At each round, the K-th group data are selected as the verification set, and the remaining K-1 group data are used as the training set. Through the model training, K estimators and verification errors are obtained, and the average of the K verification errors is regarded as a verification error. Finally, the hyperparameter is determined when the verification error is minimal. As shown in Figure 3, for the 5-fold cross-validation process, the yellow part is the verification set and the purple part is the training set. In those iterations, five models are used for training and testing respectively. The model verification error of each test set (Group1–Group5) is added and averaged to obtain the total cross-validation score.
4. Analysis of Experimental
In this section, the experimental analysis is presented, including the data acquisition, model training, model validation and results.
4.1. Data Description
In this study, the battery aging data used for testing were obtained from the database of the NASA Ames Center of Excellence Diagnostic Center [29]. The data set was acquired by testing the lithium-ion 18,650 battery through the NASA battery prediction test bench. In order to comprehensively study the law of the SOH attenuation trend, several batteries were tested multiple times in different working modes. The experiment consisted of three processes: constant current–constant voltage (CC–CV) charging, constant current (CC) discharge, and battery impedance measurement, all the testing was done at room temperature (24 °C). The battery charging process consists of two phases: the CC phase and the CV phase. First, the battery is charged with 1.5 A current in the CC phase until the battery voltage reaches 4.2 V. Then, in the CV phase, the battery is charged by a constant voltage way until the charging current drops to 20 mA. The parameters of cells used for the test are shown in Table 3.
After the battery aging test, the feature samples of the battery can be collected from the CC–CV charging curve. The method of battery feature construction is described in Section 3.1 To fully validate the model, the test data of multiple batteries were used for the experiment. According to the cross-validation principle, 80% of the data set was selected as the training set, and the remaining data set was selected as the test set.
4.2. Model Training
The experiment was carried out on a platform running Windows 8.0, Matlab 2015 [30], and LS-SVMlab Toolbox [31]. The Toolbox is implemented in C/Matlab language and used for LS-SVM simulation.
Data preprocessing is necessary to prevent the impact of different dimensions of the original data on the model training process. This effect is eliminated by data normalization and improves the convergence rate during model training. This article scales the feature data to a range between 0 and 1 by using the min–max normalization method, as shown in Equation (12):
where is the raw data, is the scaled value, and are the maximum and minimum data values, respectively.
Fitness evaluation plays a crucial role in model training. The cross-validation mean square error (MSE) is adopted to estimate the model performance to determine the general performance of the LS-SVR model. The definition of a cross-validation MSE is as follows:
where is the measured value, is the estimated value, and is the number of samples.
The LS-SVR model is configured with the polynomial kernel to perform the 5-fold cross validation. Table 4 shows the cross-validation results, which give the best parameters for the model and the corresponding cross-validation errors. As the table shows, the model with a polynomial kernel yields a cross-validation MSE of 1.26%, which is a satisfactory SOH testing result, and confirms that the polynomial is an appropriate kernel function of the LS-SVR mode for battery SOH estimation.
4.3. Performance Metrics
Five statistical parameters, namely the root mean square error (RMSE), mean absolute error (MAE), mean absolute percentage error (MAPE), coefficient of determination (R2), and SOH estimation error (Error), are adopted as the model performance metrics to verify the comprehensive performance of the LS-SVR estimation model. RMSE denotes the sample standard deviation of the differences between the estimated and actual values. The MAE, MAPE, and SOH estimation error are used to determine the error margin of the SOH estimation results. R2 denotes the interpretation degree of the data input to the result output. An R2 of 100% is a perfect model, while the closer the values of RMSE, MAE and Error are to 0, the higher is the implied model performance. Each performance metric is defined as follows:
where is the actual battery SOH value, is the estimated battery SOH value, is the mean SOH, and is the number of test samples.
4.4. Model Validation
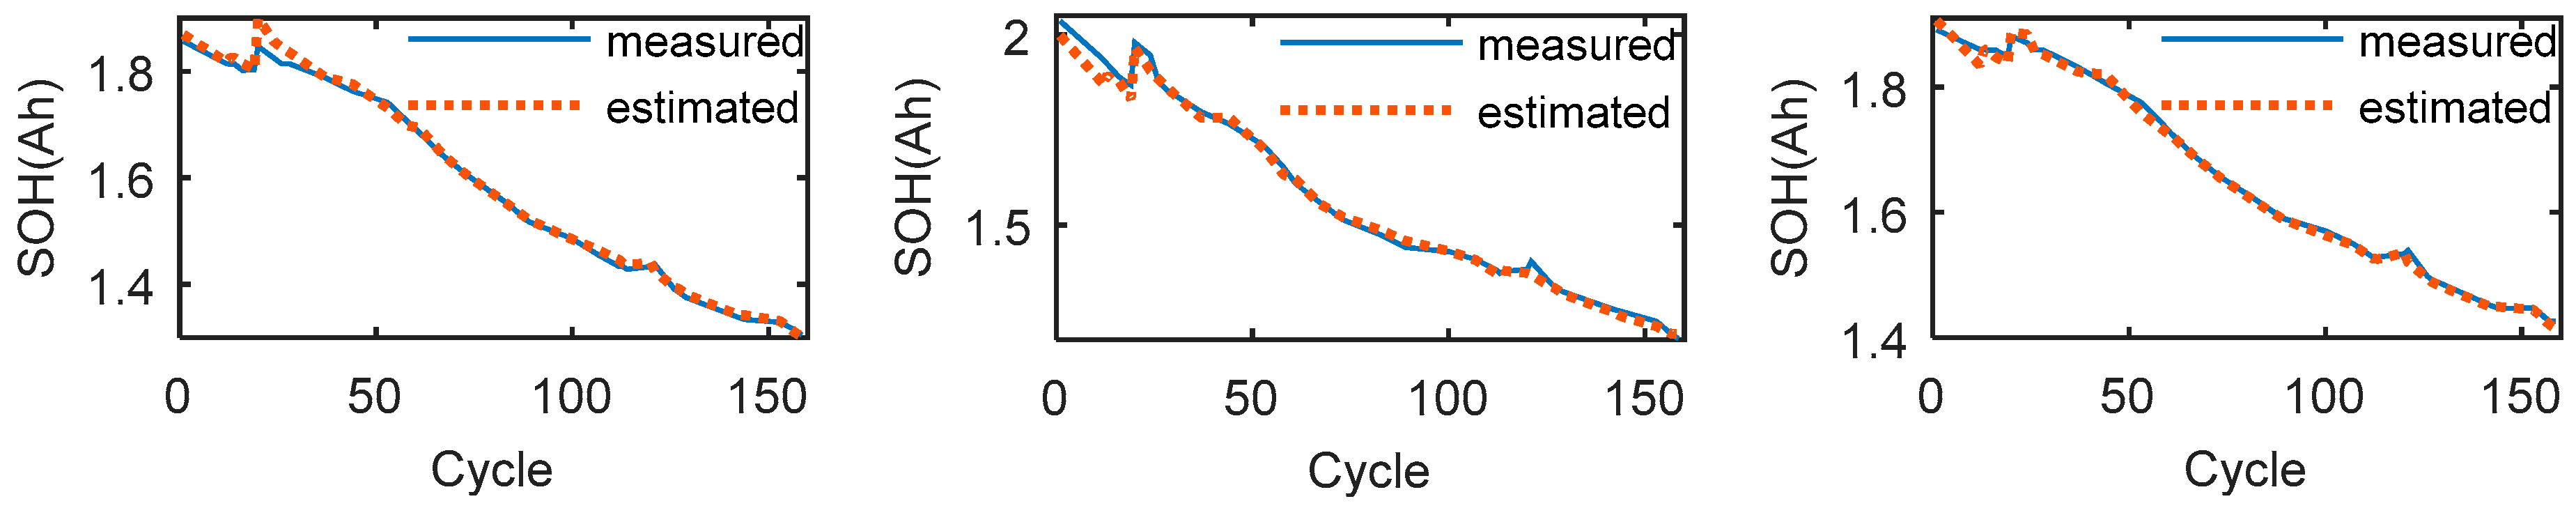
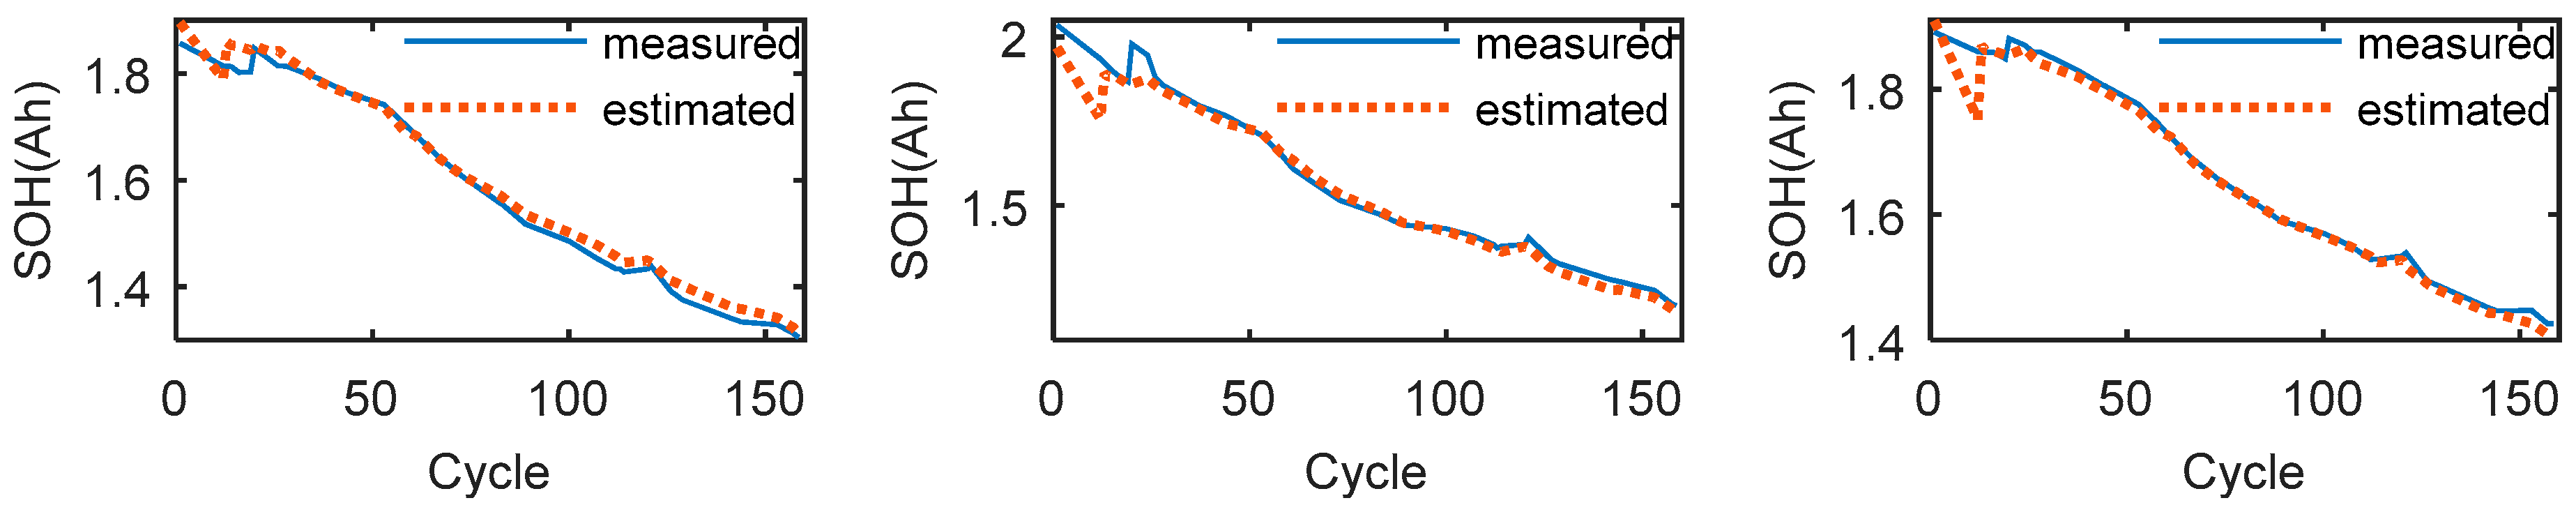
To verify the comprehensive performance of the estimated model and the selected kernel function, the LS-SVR model with the polynomial kernel was trained by the training set, and the trained model was then verified by three test sets. All the data prepared for model testing are different from the training set. The measured battery SOH is considered the actual SOH for reference. The reference SOH and the SOH estimated by the proposed method are normalized to a range from 0% to 100%.
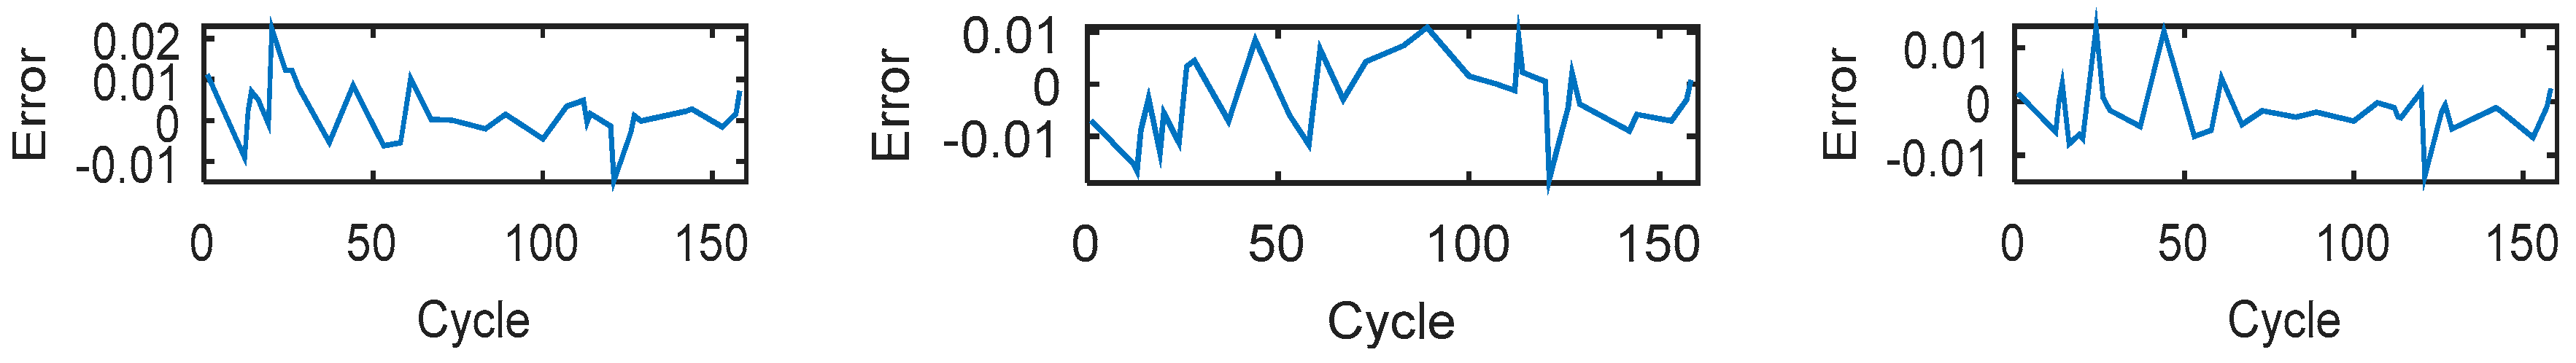
Figure 4 shows the SOH estimation results, and Figure 5 shows the SOH estimation errors. As shown in Table 5, the statistical test results reveal that the estimation result on the No. 5 test set is the worst, the RMSE, MAE, MAPE and R2 values are 1.26%, 0.89%, 0.53% and 99.58%, respectively. The estimation results obtained on the No. 6 test set are better, with RMSE, MAE, MAPE and R2 values of 1.36%, 1.08%, 0.65% and 99.73%, respectively, exceeding the estimation accuracy acquired with the No. 5 test set. The estimation results obtained on the No. 7 test set are almost as good as that obtained on the No. 6 test set. Moreover, the results of the three tests are satisfactory.
Table 5 reveals that the best test results with the LS-SVR model were obtained on the No. 6 test set. In this case, the R2 index is the best among all tests, indicating that the battery SOH estimation curve attains the best fit. In contrast, the worst test results were obtained on the test set No. 5. Although the results of these three tests are different, the overall performance index is still very good, especially the total error range of battery SOH estimation, which is between −1.83% and 2.25%. Therefore, the above test results sufficiently show that the LS-SVR model with the polynomial kernel can overcome the nonlinear relationship between the input variables and battery SOH.
In the process of repeated cycles in batteries discharge/charge, the side reactions emerge between the battery electrode and electrolyte, which leads to battery SEI with a poor conductivity and even inside recoverable lithium-ion loss [32]. Obviously, repeated cycles in battery discharge/charge can harm the morphology of battery electrode and will accelerate the loss of active electrode material. Consequently, the capacity or battery SOH will not change monotonically with the battery repeated cycles. The capacity regeneration arises during battery cycling, proving that the battery SOH and cycle life are not the same.
5. Discussion
5.1. The Influence of the Kernel Function on the Estimation Model
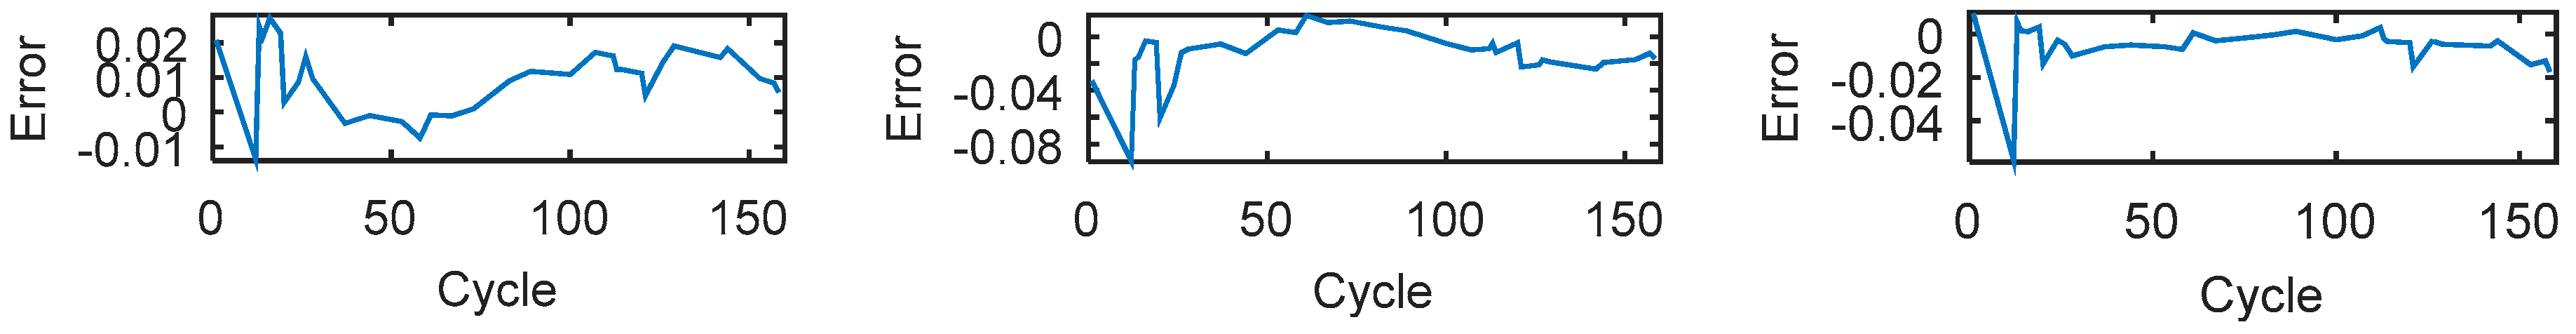
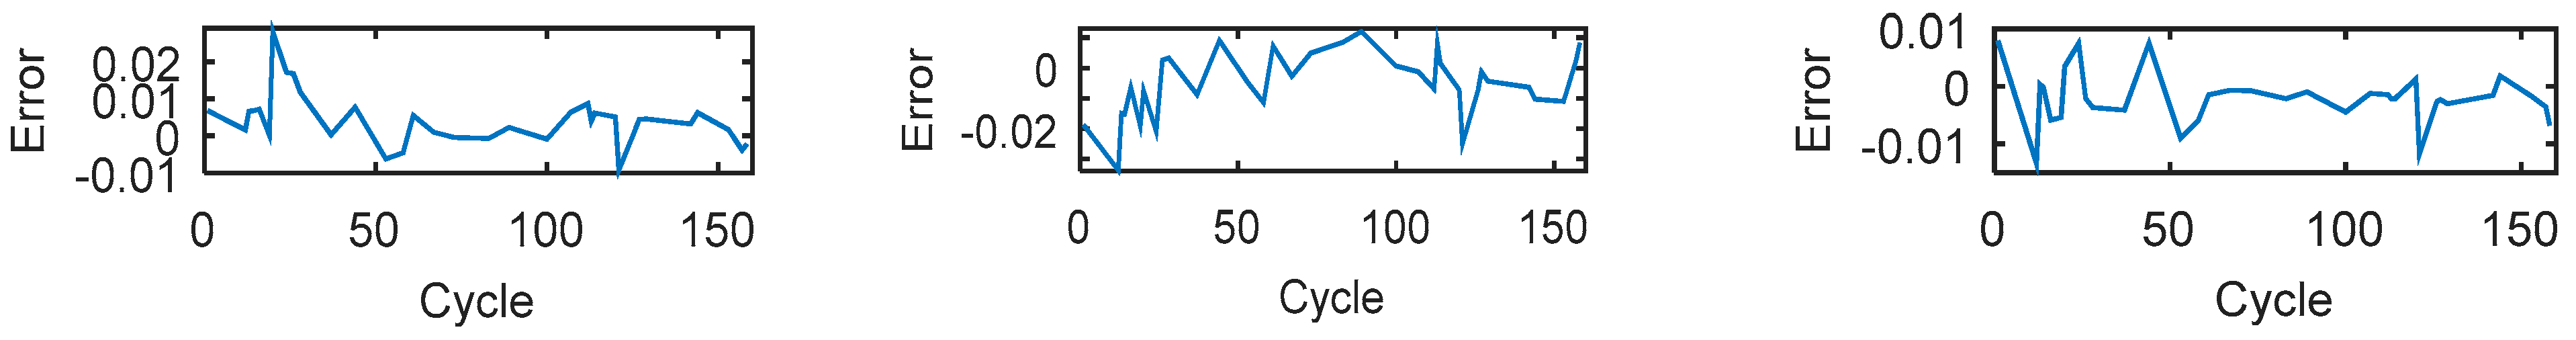
To illustrate the rationality of the kernel function selection, two other LS-SVR models with linear and radial basis function (RBF) kernel functions were trained and then tested. The estimated results of the SOH for each model are as shown in Figure 6, Figure 7, Figure 8 and Figure 9, and the statistical results of the test are given in Table 6.
As shown in the statistical results, the SOH estimation on the No. 6 test case from THE LS-SVR model with the linear kernel function is the worst, with RMSE, MAE, MAPE and R2 values of 4.43%, 2.8%, 1.67% and 97.13%, respectively. The LS-SVR model with the RBF kernel function tested on the No. 6 test case produced better estimation results. The RMSE, MAE, MAPE, and R2 values are 2.06%, 1.53%, 0.92%, and 99.38%, respectively, which exceeded the estimation accuracy of the model with the linear kernel function. From the overall comparison, the estimation results of the LS-SVR model with the RBF kernel function were better than that of the model with linear kernel functions. However, compared to the model with polynomial kernel function, as shown in Table 5, the results of the model with RBF are slightly inferior, especially from the perspective of the average value.
Although the LS-SVR model with linear kernel function obtains surprising estimation results, it cannot overcome the non-linear characteristics of the battery well. By the RBF kernel, the LS-SVR model has achieved satisfactory estimation results. However, due to the complexity of RBF, the calculation difficulty is increased. The LS-SVR model with a polynomial kernel function not only obtains accurate estimation results, but also low-complexity calculations, which is the best choice for application in embedded systems.
5.2. The Influence of the Feature Variables on the Estimation Model
To illustrate the rationality of the feature variable selection, six LS-SVM models with the polynomial kernel (minus one variable) were trained and tested, and the statistical results of the test are given in Table 7. Clearly, after removing the F1 feature in the training set, the test results from the trained model were the worst, especially the estimation result on the No. 2 test case, where the R2 is as low as 97.38%, while the RMSE, MAE and MAPE are as high as 4.23%, 2.27%, and 1.36%, respectively. This leads to the SOH estimation error range of up to (−9.88% 3.06%). The SOH estimation results of the model trained without the features F4, F5 or F6 are slightly better. The RMSE values of these tests are between 97% and 99%, and the SOH estimation error range has also been reduced accordingly. Compared to the other models, the models trained without F2 or F3 produced relatively good SOH estimation results, the values of R2 all exceed 98%, however, they are inferior to the models trained on all input variables. As a consequence, no matter which feature is deleted, the SOH estimation results will decline. Therefore, as shown in Table 1, the selected features are essential for the SOH estimation model and have a good correlation with SOH.
5.3. Performance Comparison
To further evaluate the performance of the method, a comprehensive comparison of the proposed method with the recently published method in terms of model design, feature construction, and verification error is shown in Table 8.
Although the feature acquisition method based on the charge–discharge curve (CC–CV) is a wise choice, the slope and the vertical slope of the CC charging curve is not easy or convenient to obtain [10]. The RVM is also used as the SOH estimation model, but the estimation accuracy is not as good as in the proposed method [11]. The method based on the peak value of the IC curve can accurately estimate the battery SOH, but the IC curve is sensitive to measurement noise. Therefore, an appropriate smoothing method must be considered, such as a Gaussian filter, to obtain a smooth curve [12]. Lei Cai et al. proposed a new evolutionary framework to estimate SOH by the pulse current test method to collect the response voltage for feature construction. However, the algorithm only considers the calendar aging of batteries and does not consider cyclic battery aging [15]. By the above comparison, the overall performance of this method is superior, and it is simple and easy to implement for engineering applications.
6. Conclusions
In this research, we focused on model design and feature construction to establish a battery SOH estimation method based on ML models. We chose the LS-SVR model to establish the battery SOH estimation model because the former is widely used to solve classification and regression problems. Moreover, the battery CC–CV curve is used for feature construction. This feature acquisition method is effective and convenient in engineering applications.
According to this study, the following conclusions can be drawn. First, although the LS-SVR model with the RBF kernel can achieve ideal SOH estimation results, due to the introduction of the Gaussian function, the structure of the RBF kernel function is more complicated than that of other kernel functions. Therefore, as a trade-off between the model complexity and generalization performance, the polynomial kernel is the best choice for implementing the LS-SVR model on embedded devices. Second, we extracted six features from the CC–CV curve as the input variables for the LS-SVR model, and verified the rationality of the feature selection through GRA correlation calculation and experiments. Finally, as shown in Table 8, a comparison between the most advanced battery SOH estimation methods and the proposed method reveals that the proposed method not only attains accurate SOH estimation, but also has a slight advantage in feature construction, which explains its superior comprehensive performance.
Author Contributions
Investigation, methodology, writing—original draft, B.X. (Bin Xiao); review and editing, B.X. (Bing Xiao); supervision, L.L.; funding acquisition, B.X. (Bing Xiao). All authors have read and agreed to the published version of the manuscript.
Funding
This work was supported by the Natural Science Foundation of Guangdong Province (Grant/Award Number: 2015A010106005).
Acknowledgments
The authors would like to thank the NASA Ames Center of Excellence Diagnostic Center for providing the experimental data.
Conflicts of Interest
The authors declare no conflict of interest.
References
- Onat, N.C.; Aboushaqrah, N.N.M.; Kucukvar, M.; Tarlochan, F.; Hamouda, A.M. From sustainability assessment to sustainability management for policy development: The case for electric vehicles. Energy Convers. Manag. 2020, 216, 1–16. [Google Scholar]
- Un-Noor, F.; Padmanaban, S.; Mihet-Popa, L.; Mollah, M.N.; Holm-Nielsen, J.B. A Comprehensive Study of Key Electric Vehicle (EV) Components, technologies, challenges, impacts, and future direction of development. Energies 2017, 10, 1217. [Google Scholar] [CrossRef] [Green Version]
- Darabi, Z.; Ferdowsi, M. Impact of Plug-In Hybrid Electric Vehicles on Electricity Demand Profile. Power Syst. 2012, 53, 319–349. [Google Scholar]
- Bilgin, B.; Magne, P.; Malysz, P.; Yang, Y.; Pantelic, V.; Preindl, M.; Korobkine, A.; Jiang, W.; Lawford, M.; Emadi, A. Making the Case for Electrified Transportation. IEEE Trans. Transp. Electrif. 2015, 1, 4–17. [Google Scholar] [CrossRef]
- Lipu, M.S.H.; Hannan, M.; Hussain, A.; Hoque, M.; Ker, P.J.; Saad, M.; Ayob, A. A review of state of health and remaining useful life estimation methods for lithium-ion battery in electric vehicles: Challenges and recommendations. J. Clean. Prod. 2018, 205, 115–133. [Google Scholar] [CrossRef]
- Sun, X.; Li, Z.; Wang, X.; Li, C. Technology Development of Electric Vehicles: A Review. Energies 2019, 13, 90. [Google Scholar] [CrossRef] [Green Version]
- Karavas, C.-S.; Arvanitis, K.; Papadakis, G. A game theory approach to multi-agent decentralized energy management of autonomous polygeneration microgrids. Energies 2017, 10, 1756. [Google Scholar] [CrossRef] [Green Version]
- Hittinger, E.; Wiley, T.; Kluza, J.; Whitacre, J. Evaluating the value of batteries in microgrid electricity systems using an improved Energy Systems Model. Energy Convers. Manag. 2015, 89, 458–472. [Google Scholar] [CrossRef] [Green Version]
- Sung, W.; Lee, J. Implementation of SOH Estimator in Automotive BMSs Using Recursive Least-Squares. Electronics 2019, 8, 1237. [Google Scholar] [CrossRef] [Green Version]
- Yi, W.; Youren, W.; Winco, K.C.Y.; Michael, P. Ultrasonic Health Monitoring of Lithium-Ion Batteries. Electronics 2019, 8, 751. [Google Scholar]
- Guha, A.; Patra, A. State of Health Estimation of Lithium-Ion Batteries Using Capacity Fade and Internal Resistance Growth Models. IEEE Trans. Transp. Electrif. 2018, 4, 135–146. [Google Scholar] [CrossRef]
- Bian, X.; Liu, L.; Yan, J.; Zou, Z.; Zhao, R. An open circuit voltage-based model for state-of-health estimation of lithium-ion batteries: Model development and validation. J. Power Sources 2020, 448, 227401. [Google Scholar] [CrossRef]
- Matteo, G.; Lucio, C.; Corrado, G.; Stefano, C.; Aldo, D.C. Performance Analysis and SOH (State of Health) Evaluation of Lithium Polymer Batteries Through Electrochemical Impedance Spectroscopy. Energy 2015, 89, 678–686. [Google Scholar]
- Wassiliadis, N.; Adermann, J.; Frericks, A.; Pak, M.; Reiter, C.; Lohmann, B.; Lienkamp, M. Revisiting the dual extended Kalman filter for battery state-of-charge and state-of-health estimation: A use-case life cycle analysis. J. Energy Storage 2018, 19, 73–87. [Google Scholar] [CrossRef]
- Shi, E.; Xia, F.; Peng, D.; Li, L.; Wang, X.; Yu, B. State-of-health estimation for lithium battery in electric vehicles based on improved unscented particle filter. J. Renew. Sustain. Energy 2019, 11, 024101. [Google Scholar] [CrossRef]
- Feng, Y.; Xue, C.; Han, Q.-L.; Han, F.; Du, J. Robust Estimation for State-of-Charge and State-of-Health of Lithium-Ion Batteries Using Integral-Type Terminal Sliding-Mode Observers. IEEE Trans. Ind. Electron. 2020, 67, 4013–4023. [Google Scholar] [CrossRef]
- Li, Y.; Abdel-Monem, M.; Gopalakrishnan, R.; Berecibar, M.; Nanini-Maury, E.; Omar, N.; Bossche, P.V.D.; Van Mierlo, J. A quick on-line state of health estimation method for Li-ion battery with incremental capacity curves processed by Gaussian filter. J. Power Sources 2018, 373, 40–53. [Google Scholar] [CrossRef]
- Yang, D.; Zhang, X.; Pan, R.; Wang, Y.; Chen, Z. A novel Gaussian process regression model for state-of-health estimation of lithium-ion battery using charging curve. J. Power Sources 2018, 384, 387–395. [Google Scholar] [CrossRef]
- Guo, P.; Cheng, Z.; Yang, L. A data-driven remaining capacity estimation approach for lithium-ion batteries based on charging health feature extraction. J. Power Sources 2019, 412, 442–450. [Google Scholar] [CrossRef]
- Cai, L.; Meng, J.; Stroe, D.-I.; Luo, G.; Teodorescu, R. An evolutionary framework for lithium-ion battery state of health estimation. J. Power Sources 2019, 412, 615–622. [Google Scholar] [CrossRef]
- Dai, H.; Zhao, G.; Lin, M.; Wu, J.; Zheng, G. A novel estimation method for the state of health of lithium-ion battery using prior knowledge-based neural network and markov chain. IEEE Trans. Ind. Electron. 2019, 66, 7706–7716. [Google Scholar] [CrossRef]
- Song, Z.; Wu, X.; Li, X.; Sun, J.; Hofmann, H.; Hou, J. Current Profile Optimization for Combined State of Charge and State of Health Estimation of Lithium Ion Battery Based on Cramer–Rao Bound Analysis. IEEE Trans. Power Electron. 2018, 34, 7067–7078. [Google Scholar] [CrossRef]
- Yang, Q.; Xu, J.; Li, X.; Xu, D.; Cao, B. State-of-health estimation of lithium-ion battery based on fractional impedance model and interval capacity. Int. J. Electr. Power Energy Syst. 2020, 119, 105883. [Google Scholar] [CrossRef]
- Tosun, N. Determination of Optimum Parameters for Multi-Performance Characteristics in Drilling by Using Grey Relational Analysis. Int. J. Adv. Manuf. Technol. 2005, 28, 450–455. [Google Scholar] [CrossRef]
- Cortes, C.; Vapnik, V. Support-Vector Networks. Mach. Learn. 1995, 20, 273–297. [Google Scholar] [CrossRef]
- Johan, A.K.S.; Tony, V.G.; Jos, D.B.; Bart, D.M.; Joos, V. Least Squares Support Vector Machines; World Scientific: Singapore, 2002. [Google Scholar]
- Vapnik, V.N. The Nature of Statistical Learning Theory; Springer: New York, NY, USA, 1995. [Google Scholar]
- Kohavi, R. A Study of Cross-Validation and Bootstrap for Accuracy Estimation and Model Selection; International Joint Conference on Artificial Intelligence: San Francisco, CA, USA, 1995; Volume 2, pp. 1137–1143. [Google Scholar]
- NASA Ames Prognostics Data Repository. Available online: https://ti.arc.nasa.gov/tech/dash/groups/pcoe/prognostic-data-repository/ (accessed on 8 June 2020).
- Matlab 2015. Available online: https://www.mathworks.com/products/matlab.html (accessed on 8 June 2020).
- LSSVMLab. Available online: http://www.esat.kuleuven.be/sista/lssvmlab (accessed on 8 June 2020).
- Olivares, B.E.; Munoz, M.A.C.; Orchard, M.; Silva, J.F. Particle-filtering-based prognosis framework for energy storage devices with a statistical characterization of state-of-health regeneration phenomena. IEEE Trans. Instrum. Meas. 2012, 62, 364–376. [Google Scholar] [CrossRef]
Figure 1.
The feature selection in charging curve.

Figure 2.
The schematic diagram of LS-SVM model for SOH estimation.

Figure 3.
A schematic of K-fold cross-validation.

Figure 4.
The SOH estimation results of the LS-SVM model with the polynomial kernel tested on the No. 5, No. 6 and the No. 7 batteries.
Figure 4.
The SOH estimation results of the LS-SVM model with the polynomial kernel tested on the No. 5, No. 6 and the No. 7 batteries.

Figure 5.
The SOH estimation error of the LS-SVM model with the polynomial kernel tested on the No. 5, No. 6 and the No. 7 batteries.
Figure 5.
The SOH estimation error of the LS-SVM model with the polynomial kernel tested on the No. 5, No. 6 and the No. 7 batteries.

Figure 6.
The SOH estimation results of the LS-SVM model with the linear kernel tested on the No. 5, No. 6 and the No. 7 batteries.
Figure 6.
The SOH estimation results of the LS-SVM model with the linear kernel tested on the No. 5, No. 6 and the No. 7 batteries.

Figure 7.
The SOH estimation error of the LS-SVM model with the linear kernel tested on the No. 5, No. 6 and No. 7 batteries.
Figure 7.
The SOH estimation error of the LS-SVM model with the linear kernel tested on the No. 5, No. 6 and No. 7 batteries.

Figure 8.
The SOH estimation results of the LS-SVM model with the RBF kernel tested on the No. 5, No. 6 and No. 7 batteries.
Figure 8.
The SOH estimation results of the LS-SVM model with the RBF kernel tested on the No. 5, No. 6 and No. 7 batteries.

Figure 9.
The SOH estimation error of the LS-SVM model with the RBF kernel tested on the No. 5, No. 6 and No. 7 batteries.
Figure 9.
The SOH estimation error of the LS-SVM model with the RBF kernel tested on the No. 5, No. 6 and No. 7 batteries.


Table 1.
Grey relational grades between the features and state of health (SOH).
| Features | F1 | F2 | F3 | F4 | F5 | F6 |
|---|---|---|---|---|---|---|
| GRA | 0.5903 | 0.8952 | 0.5959 | 0.8930 | 0.9013 | 0.9119 |
Table 2.
Common kernel function.
| Kernel Function | |
| Linear Kernel | |
| Polynomial Kernel | |
| Radial Basis Function |
Table 3.
Cell parameters.
| Battery No. | Voltage Upper | Voltage Lower | Discharge Current |
|---|---|---|---|
| No. 5 | 4.2 | 2.7 | 2 |
| No. 6 | 4.2 | 2.5 | 2 |
| No. 7 | 4.2 | 2.2 | 2 |
Table 4.
Cross-validation results.
| Kernel Function | The Optimal Parameters | Validation Errors |
|---|---|---|
| Polynomial Kernel | C = 100, d = 6, p = 2 | 1.26% |
Table 5.
Statistical results of the SoH estimation.
| Kernel | Test Case | RMSE | MAE | MAPE | R2 (%) | Error (%) |
|---|---|---|---|---|---|---|
| Polynomial kernel | No. 5 | 1.26 | 0.89 | 0.53 | 99.58 | [−1.48 2.25] |
| No. 6 | 1.36 | 1.08 | 0.65 | 99.73 | [−1.83 1.09] | |
| No. 7 | 0.95 | 0.7 | 0.41 | 99.67 | [−1.4 1.39] | |
| No. 5, 6, 7 | 1.19 | 0.89 | 0.53 | 99.66 | [−1.83 2.25] |
Table 6.
Statistical results of SOH estimation.
| Kernel | Test Case | RMSE | MAE | MAPE | R2 (%) | Error (%) |
|---|---|---|---|---|---|---|
| Linear kernel | No. 5 | 2.25 | 1.87 | 1.17 | 98.66 | [−1.35 2.72] |
| No. 6 | 4.43 | 2.8 | 1.67 | 97.13 | [−9.25 1.59] | |
| No. 7 | 2.17 | 1.18 | 0.69 | 98.29 | [−5.83 0.94] | |
| No. 5, 6, 7 | 2.95 | 1.95 | 1.1767 | 98.0267 | [−9.25 2.72] | |
| Radial Basis Function | No. 5 | 1.43 | 0.98 | 0.59 | 99.46 | [−0.92 2.8] |
| No. 6 | 2.06 | 1.53 | 0.92 | 99.38 | [−3.37 1.2] | |
| No. 7 | 0.87 | 0.65 | 0.38 | 99.72 | [−1.34 0.79] | |
| No. 5, 6, 7 | 1.4533 | 1.0533 | 0.63 | 99.52 | [−3.37 2.8] |
Table 7.
Statistical results of the SOH estimation.
| Minus Features | Test Case | RMSE | MAE | MAPE | R2 | Error |
|---|---|---|---|---|---|---|
| F1 | Test 1 | 3.03 | 2.31 | 1.45 | 97.61 | [−5.99 3.83] |
| Test 2 | 4.23 | 2.27 | 1.36 | 97.38 | [−9.88 3.06] | |
| Test 3 | 2.72 | 1.83 | 1.12 | 97.31 | [−6.24 2.69] | |
| Test 1, 2, 3 | 3.33 | 2.14 | 1.31 | 97.43 | [−9.88 3.83] | |
| F2 | Test 1 | 2.22 | 1.38 | 0.82 | 98.71 | [−5.42 2.04] |
| Test 2 | 3.61 | 1.72 | 1.01 | 98.08 | [−8.66 2.8] | |
| Test 3 | 2.18 | 1.09 | 0.63 | 98.27 | [−6.09 1.82] | |
| Test 1, 2, 3 | 2.67 | 1.39 | 0.82 | 98.35 | [−8.66 2.8] | |
| F3 | Test 1 | 2.20 | 1.36 | 0.80 | 98.74 | [−5.23 2.56] |
| Test 2 | 3.58 | 1.79 | 1.04 | 98.12 | [−8.54 2.7] | |
| Test 3 | 2.08 | 0.99 | 0.58 | 98.42 | [−6.01 1.63] | |
| Test 1, 2, 3 | 2.62 | 1.38 | 0.81 | 98.43 | [−8.54 2.7] | |
| F4 | Test 1 | 2.25 | 1.57 | 0.95 | 98.69 | [−5.19 1.96] |
| Test 2 | 3.98 | 2.27 | 1.33 | 97.67 | [−8.31 2.31] | |
| Test 3 | 2.36 | 1.26 | 0.72 | 97.97 | [−5.93 1.96] | |
| Test 1, 2, 3 | 2.86 | 1.7 | 1.0 | 98.11 | [−8.31 2.31] | |
| F5 | Test 1 | 2.46 | 1.64 | 0.99 | 98.43 | [−5.07 2.82] |
| Test 2 | 3.80 | 2.05 | 1.24 | 97.87 | [−8.08 2.32] | |
| Test 3 | 2.18 | 1.08 | 0.62 | 98.27 | [−5.83 1.82] | |
| Test 1, 2, 3 | 2.81 | 1.59 | 0.95 | 98.19 | [−8.08 2.82] | |
| F6 | Test 1 | 3.09 | 2.39 | 1.44 | 97.51 | [−4.58 4.79] |
| Test 2 | 4.07 | 2.43 | 1.46 | 97.57 | [−8.09 2.24] | |
| Test 3 | 2.33 | 1.43 | 0.84 | 98.02 | [−5.84 2.32] | |
| Test 1, 2, 3 | 3.16 | 2.08 | 1.25 | 97.7 | [−8.09 4.79] |
Table 8.
Comparison of the proposed method with the start-of-the-art methods.
| Method | Feature Construction | Test Set | Aging Type | Errors |
|---|---|---|---|---|
| GPR [12] | Charge/discharge curve (CC–CV) | NASA data | Cycle aged | RMSE: 0.78–3.45% |
| RVM [13] | Charge/discharge curve (CC–CV) | NASA data | Cycle aged | RMSE: 1.02–4.22% |
| LR [14] | Incremental capacity curve | Battery aging test | Cycle aged | Mean Errors: 0.81–1.48% |
| SVR-GA [15] | Voltage response of the pulse test | Battery aging test | Calendar aged | RMSE: 1.91–1.31% |
| LS-SVR (proposed) | Charge/discharge curve (CC–CV) | NASA data | Cycle aged | RMSE: 0.95–1.36% |
© 2020 by the authors. Licensee MDPI, Basel, Switzerland. This article is an open access article distributed under the terms and conditions of the Creative Commons Attribution (CC BY) license (http://creativecommons.org/licenses/by/4.0/).
Share and Cite
MDPI and ACS Style
Xiao, B.; Xiao, B.; Liu, L. State of Health Estimation for Lithium-Ion Batteries Based on the Constant Current–Constant Voltage Charging Curve. Electronics 2020, 9, 1279. https://doi.org/10.3390/electronics9081279
AMA Style
Xiao B, Xiao B, Liu L. State of Health Estimation for Lithium-Ion Batteries Based on the Constant Current–Constant Voltage Charging Curve. Electronics. 2020; 9(8):1279. https://doi.org/10.3390/electronics9081279
Chicago/Turabian StyleXiao, Bin, Bing Xiao, and Luoshi Liu. 2020. "State of Health Estimation for Lithium-Ion Batteries Based on the Constant Current–Constant Voltage Charging Curve" Electronics 9, no. 8: 1279. https://doi.org/10.3390/electronics9081279
Note that from the first issue of 2016, this journal uses article numbers instead of page numbers. See further details here.