
Abstract
Geomechanical modelling and simulation are introduced to accurately determine the combined effects of hydrocarbon production and changes in rock properties due to geomechanical effects. The reservoir geomechanical model is concerned with stress-related issues and rock failure in compression, shear, and tension induced by reservoir pore pressure changes due to reservoir depletion. In this paper, a rock mechanical model is constructed in geomechanical mode, and reservoir geomechanics simulations are run for a carbonate gas reservoir. The study begins with assessment of the data, construction of 1D rock mechanical models along the well trajectory, the generation of a 3D mechanical earth model, and running a 4D geomechanical simulation using a two-way coupling simulation method, followed by results analysis. A dual porosity/permeability model is coupled with a 3D geomechanical model, and iterative two-way coupling simulation is performed to understand the changes in effective stress dynamics with the decrease in reservoir pressure due to production, and therefore to identify the changes in dual-continuum media conductivity to fluid flow and field ultimate recovery. The results of analysis show an observed effect on reservoir flow behaviour of a 4% decrease in gas ultimate recovery and considerable changes in matrix contribution and fracture properties, with the geomechanical effects on the matrix visibly decreasing the gas production potential, and the effect on the natural fracture contribution is limited on gas inflow. Generally, this could be due to slip flow of gas at the media walls of micro-extension fractures, and the flow contribution and fracture conductivity is quite sufficient for the volume that the matrixes feed the fractures. Also, the geomechanical simulation results show the stability of existing faults, emphasizing that the loading on the fault is too low to induce fault slip to create fracturing, and enhanced permeability provides efficient conduit for reservoir fluid flow in reservoirs characterized by natural fractures.
Introduction
Carbonate reservoir resource development and production is critically affected by geomechanics. Both matrix and fracture permeability in gas reservoirs control production potential in naturally fractured reservoirs, but fractures are commonly considering the main flow path from matrixes to production wells. However, the permeability and porosity are extremely sensitive to stress changes in the reservoir. Compaction processes that result from reservoir depletion cause rock deformation, rock grain redistribution, decreased matrix pore size, changes in fault/fracture stability status, and decreased fracture aperture or even closure with a significant decrease in pore pressure. The permeability and porosity of the fractures decrease with fracture closure, and for some natural fractures, the decrease in porosity and permeability is even greater. In order to mobilize more gas from the reservoir into a well and create the highest production rate possible in such a dual-permeability reservoir, a very low bottom hole pressure is necessary. This will significantly alter the effective stress, and may lead to enormous rock deformation. As a consequence, both the fracture and matrix permeability in gas reservoirs may change significantly.
Several parameters including fracture type (partly propped fracture, micro fractures), Young's modulus, and in situ stress are used to derive the variation in permeability behaviour due to geomechanics. In a simple approach, the effective porosity and permeability are updated as a function of the formation pressure only. However, the addition of geomechanical effects is generally recommended for updating the porosity and permeability changes according to the rock stress state, types of fractures, etc.
The field of this case study is a carbonate fractured gas reservoir in the early development stage. The availability of data at this phase is quite sufficient to investigate the geomechanical effects on reservoir simulation and analysis of the effects of stress changes on dual-continuum media flow behaviour, fault stability, fracture conductivity, reservoir production potential, and water production problems, and to compare the results with conventional uncoupled reservoir simulation (Longuemare et al. 2002). The scope of the present research can be divided into two main steps. The first step involves the analysis and quality check with information from different sources to extract the essential useful data and parameters to characterize the reservoir properties, construct dual-continuum geological models, create 1D rock mechanical properties, and generate a 3D geomechanical model.
The second step involves defining a dynamic flow simulation model. Two separate reservoir simulations are then run, without geomechanical effects and adding geomechanical effects, to investigate reservoir dynamic performance, history matching, and analysis simulation prediction. Finally, the results of two-way coupled geomechanical simulation are analysed for comparison with conventional reservoir simulation results.
The two-way coupled geomechanical simulation results indicate that as pressure decreases, the matrix permeability decreases by nearly 20% and the natural fracture effective permeability decreases nonsignificantly; however, the cumulative production curves are decreased nonsignificantly and are almost the same. This is because the minor impact of the Klinkenberg effect on gas production, high fracture permeability, and fracture conductivity is sufficient for the volume that the matrixes feed the fractures.
Rock mechanical model computation and construction
A well mechanical earth model (MEM) is constructed by analysis of rock mechanics properties using well wireline data, and the MEM is calibrated using lab experiment results. These individual well MEM models are then converted and used to generate a 3D geomechanical simulation model, which provides information on how the rock properties (porosity and permeability) respond to changes in pressure during reservoir production as a result of effect forecasting results and ultimate recovery.
The mechanical properties of the reservoir and overburden formation can be explicitly characterized by a rock mechanical model (RMM), which includes the elastic properties of the rock, pore pressure, and the in situ stress state. Here, rock elastic, dynamic properties and the magnitude of stresses including vertical, maximum, and minimum stresses were calculated based on log data (Fjaer et al. 2008). The dynamic rock properties were extracted from the sonic log, and were then used to determine the static properties and were calibrated with lab experimental data results for core samples. The acquired wireline data of six wells from the main Sonic Scanner log were used to assess the rock dynamic mechanical properties and in situ stresses, and were compared with core measurement data of two wells (Archer and Rasouli 2012). The process computes the far-field principal stresses according to an elastic model. Compressional slowness, shear slowness, and density are used for direct calculation of the dynamic elastic properties. The RMM consists of overburden pressure (TZSP), pore pressure (PPPS), elastic dynamic and static properties, rock strength, and far-field maximum and minimum stresses (TYSP and TXSP).
Sonic log-derived elastic properties are considered dynamic because they are derived from high-frequency dynamic measurement, as opposed to laboratory measurements, which are static. In many rocks, especially weak rocks, the dynamic properties are different from the static properties. Many correlation methods have been used to convert dynamic properties to static properties. For instance, a modified Morales correlation was used to determine the static Young’s modulus (YME) and yielded a good match with core measurement, and both the Plumb porosity correlation and Horsrud (2001) correlation gave the best match for the unconfined compressive strength.
Generally, good matching has been found between the estimated parameters from log data and the measured parameters from lab experiments of the core sample from two wells, X-04 and X-06, as shown by the blue and red curves, respectively, in Fig. 1.

Comparison of rock mechanical properties from log and core data for wells X-04 and X-06
The orientation of the maximum horizontal stresses evaluated using well image logs of six wells showed a fast shear azimuth in a NE direction at 40–45°, which matched the maximum stress direction in the area.
Breakouts are defined as borehole enlargements that develop along the minimum horizontal stress (Shmin) orientation. In vertical wells, breakouts are vertical and are caused by the compressive shear failure of the wellbore wall. Breakouts occur when the borehole circumferential stress exceeds the compressive strength of the rock (Zoback et al. 2003), caused by damage and enlargement on opposite sides of the borehole (Luthi 2001). In the Upper Qamchuqa, breakouts are clearly observed. Table 1 and Fig. 2 show examples of breakouts from well X-06.

Breakout examples from image log of well X-06
It is concluded that the dominant strike orientation of the interpreted breakouts is consistent between wells. The orientation is NW–SE, which confirms the expected present-day regional maximum horizontal stress (SHmax) of NE–SW.
Finally, the calculated parameters of rock elastic properties, pore pressure, and in situ stress states were plotted using appropriate well log suite combinations and are presented as a well 1D RMM for each well. Figure 3 shows an example of the 1D RMM for well X-02.

1D rock mechanical model for well (X-02)
Building the 3D geomechanical model
The geomechanical model is constructed to analyse the effect of stress and strain on rock compaction, structure displacement, rock deformation, and how the rock properties (porosity and permeability) respond to changes in pressure during reservoir production lifetime, and to calculate the ultimate recovery under this condition.
The Petrel (Schlumberger 2019a) Reservoir geomechanics tool was designed for building 3D models of rock stresses, deformations, and failure in a reservoir. First, grid model creation, property population, simulation-launch, and run management are completed, and the results are then checked and visualized. The VISAGE (Schlumberger 2019b) finite element geomechanics simulator was used to perform the numerical stress and displacement computations for intact, faulted, and naturally fractured rock.
The workflow stages for creating a 3D geomechanical model and running 4D geomechanical simulations with one/two-way coupling for this study case are given below:
-
Create a geomechanical grid using original geological and/or reservoir simulation model and convert to an embedded model through the addition of overburden by extending to ground level, underburden, and sideburden coarsened grid cells to an existing 3D reservoir grid (see Fig. 4). Embedding is an essential process to ensure that boundary effects do not affect the stress state in the area of the reservoir. The sideburden is created to be at least three times the reservoir width, and the underburden thickness is set such that the model is roughly rectangular in shape. The final 3D geomechanics model contains a total of 72,072 grid cells (39 × 132 × 14).
Fig. 4 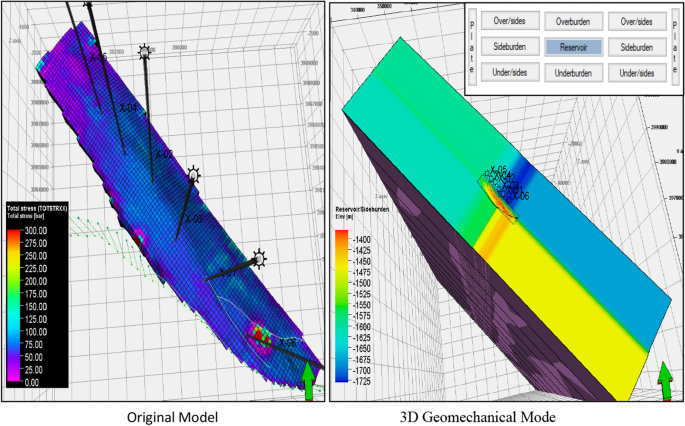
3D grid model
-
Build the geomechanical materials and functions model: a material is a collection of rock geomechanical parameters, i.e. Poisson's ratio, Young's modulus, Biot elastic constant bulk density, porosity, and linear thermal expansion coefficient, which are allocated to one or more sections of the model. Two types of material are defined:
-
Intact rock material for reservoir, overburden, underburden, and sideburden, based on yield criteria and a range of elasticity models.
-
Discontinuity materials, to model faults and fractures.
-
-
Populate properties; continuous properties including critical data, static Young's modulus, bulk density, Poisson's ratio, unconfined compressive strength, and friction angle are introduced as curves at well log resolution (see Fig. 3).
-
The logs are upscaled to the model well grid using geostatistical methods. The upscaled logs are interpolated through the 3D model by sequential Gaussian simulation. The entire 3D geomechanical model is populated with the mechanical properties from the well RMM. Figure 5 shows the Young's modulus distribution in 3D space.
Fig. 5 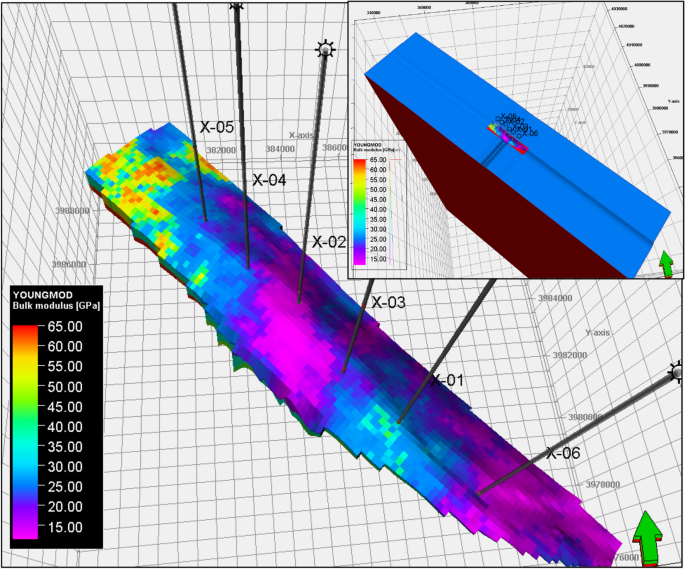
3D distribution of Young's modulus
-
Model discontinuities (faults and DFNs): discontinuity modelling introduces existing fault and discrete fracture network (DFN) models into the geomechanics simulation as follows:
-
A fault mapping object illustrates how the current model is associated with a set of faults (see Fig. 6). Each created object contains a set of fault properties and a list of cells intersecting the fault.
Fig. 6 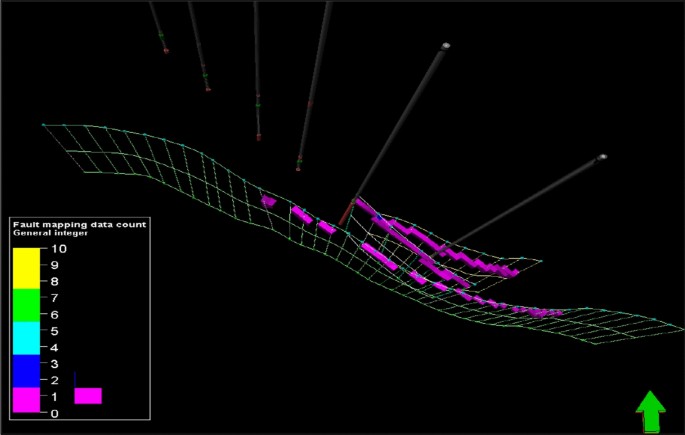
Fault-associated grid cell
-
A DFN mapping object describes how a set of DFNs is associated with the current model (see Fig. 7). Each created object contains a set of DFN properties and a list of cells intersecting the DFN.
Fig. 7 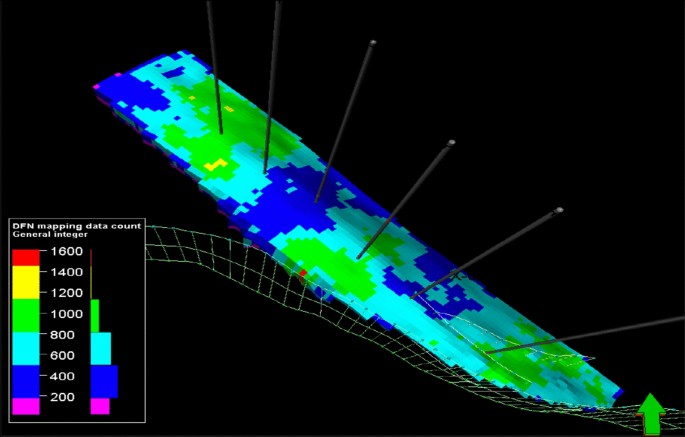
All fractures associated grid cell
-
-
Define pressure, temperature, and saturation conditions for a specified simulation case at selected required time steps to show the VISAGE simulator which pressure, temperature, and water saturation to use for specific cells of the grid by running either a one-way or two-way coupled simulation.
-
The one-way coupled simulation generates the state of in situ stress at each date/time for rock deformations.
-
The two-way coupling simulation generates a process of data exchange (“back and forth”) between ECLIPSE (Schlumberger 2009) and VISAGE. Pore pressure, temperature, and/or saturation changes at each time step are provided by the ECLIPSE simulator, and the updated changes in permeability and pore volume are returned by VISAGE for each coupled step.
-
-
Define boundary conditions; the stress on the geomechanical grid and the initial stress for the simulation.
The principal stress values and orientation are estimated for the model from RMMs of six wells. Rock density, pore pressure, and horizontal stress are used in stress initialization to calculate the local field stress in each grid cell.
-
Define and run the Reservoir Geomechanics RG simulation case; the input data used to define the case are as follows:
-
Geomechanical properties; elastic isotropic and Mohr–Coulomb
-
Pressure data from simulation flow model case for selected time steps
-
Boundary condition; principal stress values and orientation from stress initialization simulation
-
Discontinuity data; fault and DFN data
-
Pore volume updating using pore volume multipliers
-
Permeability updating function for matrix reservoir using the Kozeny–Carman permeability approach
-
Permeability updating function for faults and fractures, normal strain versus normal and shear permeability multiplier function is used; see empirical equation below (Gutierrez et al. 2000).
$$K = Ko \, e^{ - C\sigma n}$$where Ko is the average initial permeability, σn is effective normal stress along the fracture and fault, and C is an empirical constant.
-


As indicated in the above equation, a reduction in fracture permeability “opening” occurs with an increase in normal stress, and the fracture becomes stiffer and more difficult to close completely.
Geomechanical two-way coupling simulation results
The most important part of coupling geomechanics is the coupling pattern. One-way, two-way, interactive, fully coupled, and other coupling schemes differ in the way in which the geomechanical problem with flow is solved (Tillner et al. 2014). A fully coupled method runs the geomechanical and flow simulations simultaneously at several pre-selected time steps. This approach is an accurate solution, but with significant computation complexity and long computation time (Tran et al. 2005; Wang et al. 2015).
The flow simulation model for this case study was a compositional model with a 3D Cartesian grid system. The dynamic flow grid had the following dimensions:
-
Nx × Ny × Nz = 27 × 121 × 3
-
Dx × Dy = 150 × 150 m
-
Dz = 33–105 m
-
Total grid blocks = 9801
Fractures were introduced by preparing the model in dual-permeability mode. This means that every grid block was associated with one fracture element, which effectively doubled the total number of grid blocks to 19,602.
The faults in the dynamic model were copied from the static model. Major groups of faults were modelled from partially to fully transmissible, while minor faults were modelled to be fully transmissible owing to their relatively low throws. Table 2 shows reservoir and fluid properties.
The flow simulation of this study case is coupled with a geomechanical model using an iterative coupling technique to accurately simulate the changes in rock properties due to the geomechanical effect, in order to understand how production modifies the stress state and permeability of both rock matrix and fracture along the time of field production, and to investigate its impact on reservoir performance and production potential. The coupled geomechanical model performs a calculation for the variation in associated stress and strain. Depletion increases the effective stress, which finally generates strains, inducing modification of the mechanical parameters and petrophysical characteristics of the rock (Nauroy 2011).
Field in situ stress states
The flow simulation model is coupled with a geomechanical model using an iterative coupling technique at pre-selected time steps (about 25 time steps) to accurately simulate the changes in rock properties due to geomechanical effects, in order to understand how production modifies the stress state and permeability of both rock matrix and fracture along the time of field production, and to investigate its impact on reservoir performance and production potential. The coupled geomechanical model performs a calculation for the variation in associated stress and strain. Depletion increases the effective stress, which finally generates strains inducing modification of the mechanical parameters and petrophysical characteristics of the rock.
A base-case dual-porosity/dual-permeability model (DPDP) was used to run two-way coupled geomechanics simulations for six producer wells under the following conditions: target gas rate of 125 MMscf/day, and minimum bottom hole flow pressure of 52 bars. The ECLIPSE 300 simulation results are coupled with the VISAGE finite element simulator. The VISAGE simulator is one of the most advanced and comprehensive stress analysis simulators. Petrel RG was used to launch the coupling simulation to predict changes in stress/strain due to changes in pore pressure at each interval between time steps and was used to update the formation properties and determine rock deformation, and finally, to calculate the ultimate recovery under this condition.
Generally, two-way coupling simulation results show a reduction in total stress and increase in effective stress by about 120 and 20 bar, respectively, as well as the strain induced during a coupled simulation period of 15 years. Figure 8 shows the changes in total stress, effective stress, and strain versus time, which confirm the reservoir compaction state.

Total stress decrease, effective stress increase, and induced strain
Figure 9 shows an almost homogenous distribution of stress along the structure. Figures 5, 6, 7, 8, 9, 10, 11, 12, 13, 14, 15, 16, 17, 18, 19, 20, 21, 22, and 23 show 3D maps of induced strain due to changes in stress, with a maximum value of 0.0006. The strain-induced area is mainly at the NE flank of the structure

3D map of total stress at beginning and end of field life

3D map of strain at beginning and end of field life

3D map of rock vertical displacement at beginning and end of field life

Rock vertical displacement over simulation period at the central and NE regions

Cross section of rock vertical displacement at beginning and end of field life

Lateral rock displacement in X and Y directions over simulation period

Stress path diagram

Mohr–Coulomb diagram for matrix failure criteria

Mohr–Coulomb diagram for fracture failure criteria

Mohr–Coulomb diagram of cell within fault at well X-06 (south region)

Fault elastic shear displacement at beginning and end of simulation period

Matrix permeability map before production

Matrix permeability map at end of simulation period

Matrix permeability updating at highly depleted region with high initial permeability at grid cell (20, 59, 2)

Matrix permeability updating at highly depleted region with high initial permeability for grid cell (17, 69, 2)
Reservoir compaction
The reduction in reservoir pressure along the production period leads to an increase in vertical effective stress, in turn causing compaction of the reservoir interval and giving rise to vertical deformation. Displacement calculations were performed within every grid cell of the reservoir. Figures 11 and 12 show the rock vertical displacement; as the pore pressure decreases, a vertical displacement with maximum magnitude of about 20–40 cm occurs at the central and NE regions of the structure after about 15 years of simulation.
Figure 13 shows a cross section of vertical displacement accompanied by lateral displacements towards the centre of the reservoir of maximum thickness running from north-west to south-east for two time steps. i.e. the beginning and end of production; the maximum vertical displacement is at the northwestern part. The magnitudes of lateral deformation were also calculated using X and Y displacements. Maximum values of 9 cm in the X direction and 1.2 cm in the Y direction were predicted for 1 January 2030 (see Fig. 14). In general, it is concluded that the structure is forced to displace down-dip towards the NW.
Rock and discontinuity failure criteria
According to the loading stress path, there are two different ways to define rock under compression (Nauroy 2011):
-
At low mean effective stresses, the rock rapidly loses the ability to resist the load and begins to deform; in another words, brittle failure along the formation of a shear band crossing the rock.
-
At high mean effective stresses, the rock maintains the ability to resist the load as the strain due to slip along a multitude of intersecting shear planes is increased; in another words, ductile failure occurs under the effect of homogeneous micro-cracking.
The different steps of damage development resulting from critical stresses are characterized by brittle and ductile failure modes such as micro-cracks, slip with friction, and pore collapse. At times the stress paths associated with the decrease in pore pressure can induce normal faulting (Tillner et al. 2014).
Figures 15, 16 and 17 show the stress path and standard Mohr’s failure envelope for both matrix and fracture. It is clearly shown that stress circles are at the compressive side and below the failure envelope, which means that the rock is in shear form with less possibility of matrix deformation, and the rock remains intact: rock failure in compression is a difficult process of microscopic failures of the creation of small tensile cracks and inducing frictional sliding on grain boundaries. This occurs when all applied stresses exceed the rock compressive strength, which is normally equal to the mean value of the maximum principal stress; at this point the rock starts to lose its capacity to resist applied stress and begins to deform. An important concept to note here is that rocks with low compressive strength which have low cohesion are weak at low mean stresses but increase in strength as the mean stress increases.
It is also observed that the stress circle is moved to the right on the positive side due to hydrocarbon production, which leads to two processes: First, grain rearrangement, collapse, or reduction in matrix pore size occur and possibly crushing of grains which dominate the deformation mode. Second, some fractures are stressed critically (in a frictional failure state), which is the possible cause for the decrease in fracture conductivity, and are normal oriented for shear failure and closing natural extension fractures. Open extensional fractures formed in the initial stress field have an appreciable effect on fluid flow and are capable of sliding in the ambient stress field, as most of them are critically plotted in the region above the Mohr failure envelope line of the calculated friction coefficient.
The result was also used to investigate the possibility of fault reactivation. Figure 18 shows a Mohr–Coulomb diagram of the “stress state” of a cell within the fault, and the lines represent the stress state for a fault along selected time steps. All stress circles are below the failure line, which indicates a zone of stability and relative perturbation of stress, so the geomechanical simulation result emphasizes that the loading on the fault is too low to induce fault slip to create fracturing and then enhanced permeability to provide efficient conduit for fluid flow in fractured reservoirs.
In general, the Mohr stress circle increases in size and is shifted to the right and stays below the failure line, indicating that the fault located within the region experiences production depletion, which leads to an increase in effective stress and increased difference between the minimum and maximum principal stresses and less possibility of fault slipping. Figure 19 shows a nonsignificant change in fault elastic shear displacement along the simulation period. The examination helps to understand the critical stress nature of the faults in order to address practical field problems such as changes in field production behaviour and detection of any anomalies in well production such as a rapid decline in well productivity and premature water cut.
In the case where the stress circle is tangential with the failure line or their loading path reaches across the shear failure line as the fault frictional strength is reached, the represented cells with a failure stress state potentially contribute to slip and reactivate/activate a pre-existing fault, which is not apparent in this case, and that clearly confirms the seal capacity of the reservoir bounding faults. The active faults are those whose permeability is increasing; the permeability changes in the fault are computed from the strain and tangential of the fault plane and are then used to update the fault transmissivity multipliers included in the simulation model (Tran et al. 2005).
It is necessary to remember that fault stability depends on sufficient shear stress magnitude to overcome the effective normal stress of the fault plane and exceed the resistance to sliding pre-existing faults that occur because of elevating the pore pressure. All three principal stresses have values close to the vertical stress and relatively small changes in the field in situ stress. As the acting shear and normal stresses on the fault depend on the principal stresses, the pore pressure magnitudes and fault orientation with respect to the principal stresses can cause an alteration in the faulting style (Hamid et al. 2017).
Permeability variation
The high compacting part of the reservoir leads to a substantial permeability loss, and it induces new fault in normal faulting environments. Carbonates develop a plastic behaviour before failure, and this behaviour indicates irreversible strains without affecting elastic properties; these strains are induced by the coupling of the micro-fracturing related to crushing and frictional slipping. The loading paths of the high initial porosity rocks essentially encounter by plastic behaviour under high effective mean stress (Nauroy 2011).
At pre-elastic phase, the changes in stress values subject the rock to compression and induce a significant decline in matrix permeability when the existing micro-cracks close. The change in permeability values becomes complex at the post-elastic phase, and depends on the stress loading path and initial rock porosity and permeability values. This approach results in a decrease or an increase in the permeability, reflecting the competition under the effect of progressive micro-cracking of the rock between, firstly, the greater connectivity, and secondly, the greater tortuosity and/or reduction in the pore throat size, ultimately leading to grain crushing and causing the pores to collapse.
Rocks with low initial permeability will be highly sensitive to increasing or maintaining their permeability by the development of micro-cracks. In rocks with high initial permeability, their overall connectivity is not modified by micro-cracks but allows grain movements, which increase the tortuosity and/or reduce the size of the pore throats, thus reducing the permeability (Nauroy 2011).
Figures 20 and 21 show matrix permeability maps before and after production. Generally, the matrix permeability is significantly affected by geomechanics at highly depleted areas characterized by higher initial matrix permeability values larger than 10 mDarcy, and slightly affected at regions with an initial value of less than 10 mDarcy.
The matrix permeability declines by 10% at highly depleted regions with permeability greater than 10 mDarcy and by about 2% at regions of permeability less than 10 mDarcy (see Figs. 22, 23, 24 and 25).

Matrix permeability updating at region with low initial permeability for grid cell (19, 59, 3)

Matrix permeability updating at region with low initial permeability for grid cell (19, 87, 3)
The permeability of the dual-continuum system is complex and extremely sensitive to stress changes and the degree of rock consolidation which determines the change in permeability whether related to a change in the matrix structure or to activation of fractures or faults: fracture geomechanical behaviour depends on the fracture network density and orientation and on both the stress path and initial stress state throughout production (Zoback et al. 2003).
Figures 26 and 27 show the fracture network permeability map before and after production. The change in fracture network conductivity by adding geomechanical effects is greater than the change in matrix permeability. In general, the same change trend is observed for permeability updating of different fracture network conductivity measures.

Fracture permeability map before production

Fracture permeability map at end of simulation period
In this study, the change in the fracture network conductivity and matrix contribution caused a slight change in reservoir productivity. This can be explained by the fact that a change in permeability does not critically affect gas inflow, because gas slippage and micro-extension fractures have a large influence on flow.
Figures 28 and 29 show that the net bulk fracture permeability decreased by 20% for high and low fracture network conductivity.

Fracture network permeability updating for grid cell (18, 48, 3)

Fracture network permeability updating for grid cell (16, 79, 2)
Coupling simulation effect on reservoir production potential
The simulation result with stress dependent provides small effect or nonsignificant decline in reservoir performance; shorter plateau period by about three and half months, slight reduction in gas and condensate cumulative production from 352 to 338 Bscf and from 6.64 to 6.20 MMSTB, respectively (see Fig. 30, black line for conventional simulation and red line for coupling simulation. The coupled flow of geomechanical simulation results also showed delayed and decreased water cut by 2 years with percentage less than 20%. This reflects a decrease in connectivity between the reservoir and aquifer due to stress-induced changes in permeability.

Full field simulation result with and without geomechanical effect
The individual well coupling simulation result shows a reduction in the rate of gas and condensate production, a slight decrease in cumulative recovery, and shorter plateau period for all wells except well X-05, which shows a slight increase in ultimate gas recovery by 3% because of delayed water production (see Figs. 31, 32, 33, 34, 35, and 36).

Well X-01 simulation results with and without geomechanical effects

Well X-02 simulation results with and without geomechanical effects

Well X-03 simulation results with and without geomechanical effects

Well X-04 simulation results with and without geomechanical effects

Well X-05 simulation results with and without geomechanical effects

Well X-06 simulation results with and without geomechanical effects
The decrease in permeability is the main cause of the decline in well production performance. The slight improvement in gas production of well X-05, even with reduced permeability, is due to a decease in water influx, which overcomes the permeability loss.
A limitation of conventional reservoir simulation is that the permeability and compressibility are generally considered to be constant or depend only on the fluid, and the influence of stress and strain variation is neglected. The coupled geomechanical-reservoir simulation calculation predicts almost lower estimated production gas rates along a plateau period; in addition to changes in permeability and porosity, there is also the possibility of an indication that pore compression was overestimated in conventional calculations. It is important to highlight that better pressure matching was achieved with a geomechanical two-way coupling simulation.
Table 3 summarizes the well production performance potential. It can be concluded that wells X-02 and X-06 have a greater decline in gas recovery of around 7.5%, as these wells are located in areas with greater effective stress, with dominant matrix contribution. Wells X-04 and X-05 have almost unchanged and increased gas recovery factors, respectively. These wells are located in the NW region and overcome the fracture contribution. All wells show a decrease in condensate recovery when geomechanics is added, with percentages ranging from 3.5 to 10%.
In conclusion, in gas condensate reservoirs, geomechanical effects on the matrix visibly decrease the gas production potential, and its effect on the natural fracture contribution is limited on gas inflow; generally, this could be due to slip flow of gas at the media walls of micro-extension fractures, and the flow contribution and fracture conductivity is quite sufficient for the volume that the matrixes feed the fractures.
Conclusions
Geomechanical effects were successfully introduced by combining the effects of hydrocarbons production and changes in rock properties through two-way coupling simulation. The results of analysis were as follows:
-
1.
In gas condensate reservoirs, geomechanical effects on the matrix visibly decrease the gas production potential, and their effect on the natural fracture contribution is limited on gas inflow; generally, this may be due to slip flow of gas at the media walls of micro-extension fractures, and flow contribution and fracture conductivity is quite sufficient for the volume that the matrixes feed the fractures.
-
2.
Two-way coupling simulation shows a reduction in total stress and an increase in effective stress by about 120 bar and 20 bar, respectively, as well as induced strain over a coupled simulation period of 15 years, which confirms reservoir compaction. The strain-induced area is mainly at the NE flank of the structure.
-
3.
An increase in vertical effective stress recorded in turn caused compaction of the reservoir interval and gave rise to vertical deformation. The maximum vertical displacement of about 20–40 cm was recorded at the centre and the NE region of the structure after about 15 years of simulation. The magnitudes of lateral deformation were also calculated using X and Y displacements. A maximum value of 8 cm in the X direction and 1.2 cm in the Y direction was predicted by 1 January 2030. In general, it is concluded that the structure is forced to displace down-dip towards the NW.
-
4.
The stress path and standard Mohr’s failure envelope for both matrix and fractures clearly show that stress circles are moved to the right in the positive “compressive” side and stay below the failure envelope, which indicates that the rock is in shear form with less likelihood of matrix deformation, and the rock remains intact.
-
5.
Investigation of fault reactivation shows that the Mohr stress circle increases in size and is shifted to the right and kept below the failure line, which indicates a zone of stability and that the fault located within this region experiences production depletion and less likelihood of fault slipping. Therefore, the geomechanical simulation result emphasizes that the loading on the fault is too low to induce fault slip to create fracturing and then enhanced permeability to provide efficient conduit for fluid flow in naturally fractured reservoirs.
-
6.
The change in the fracture network conductivity is conservable; the matrix permeability declines by 10% in the highly depleted region with permeability greater than 10 mD and by about 2% in the region of permeability less than 10 mDarcy. The net bulk fracture permeability decreases by 20% for high and low fracture network conductivity.
-
7.
The coupling simulation effects on reservoir production potential provide a small effect or nonsignificant decline in reservoir performance compared with conventional simulation, a shorter plateau period by about three and half months, and slight reduction in gas and condensate cumulative production from 352 to 338 Bscf and from 6.64 to 6.20 MMSTB, respectively. But better pressure matching was achieved with the geomechanical two-way coupling simulation.
-
8.
Individual well coupling simulation results show a reduction in the gas and condensate production rate, slight decrease in cumulative recovery and shorter plateau period for all wells as a result of the decrease in permeability, with the exception of well X-05, which shows a slight increase in ultimate gas recovery of 3% because of the delayed water production problem.
References
Archer S, Rasouli V (2012) A log based analysis to estimate mechanical properties and in-situ stresses in a shale gas well in North Perth Basin. Pet Miner Resour Trans Eng Sci 81:163–174
Fjaer E, Holt RM, Horsrud P, Raaen AM, Risnes R (2008) Petroleum related rock mechanics, developments in petroleum science, 2nd edn. Elsevier, Maryland Heights
Gutierrez M, Qino L, Nygard R (2000) Stress-dependent permeability of a de-mineralised fracture in shale. Mar Pet Geol 17(8):895–907
Hamid O, Omair A, Guizada P (2017) On 2017, reservoir geomechanics in carbonates. Paper SPE 183704 presented at the SPE Middle East Oil & Gas show and conference held in Manama, Bahrain, 6–9 March
Horsrud P (2001) 2001, Estimating mechanical properties of shale from empirical correlation. SPE Drill Complet 16:68–73
Longuemare P, Mainguy M, Lemonnier P, Onaisi A, Gérard C, Koutsabeloulis N (2002) Geomechanics in reservoir simulation: overview of coupling methods and field case study. Oil Gas Sci Technol-revue De L Institut Francais Du Petrole 57:471–483
Luthi SM (2001) Geological well logs. Springer, Berlin
Nauroy J-F (2011) 2011, Geomechanics applied to the petroleum industry. IFP Energies nouvelles, Editions Technip, Paris
Schlumberger (2009) ECLIPSE 300. Schlumberger Information Solutions, Houston
Schlumberger (2019) Petrel Seismic-to-Evaluation Software, Version 2019. Schlumberger Information Solutions, Houston
Schlumberger (2019) VISAGE™ 2019. Schlumberger Information Solutions, Houston
Tillner E, Shi J-Q, Bacci G, Nielsen CM, Frykman P, Dalhoff F, Kempka T (2014) Coupled dynamic flow and geomechanical simulations for an integrated assessment of CO2 storage impacts in a saline aquifer. Energy Procedia 63:2879–2893
Tran D, Nghiem L, Buchanan L (2005) An overview of iterative coupling between geomechanical deformation and reservoir flow. In: International thermal operations and heavy oil symposium. Calgary. SPE 97879
Wang C, Wi Y, Xiong Y, Philip H (2015) Geomechanics coupling simulation of fracture closure and its influence on gas production in shale gas reservoirs. In: SPE reservoir symposium, Houston. SPE 173222-MS
Zoback MD, Barton CA, Castillo DA, Finkbeiner T, Grollimund BR, Moos DB, Wiprut DJ, Brudy M, Ward CD, Pesca P (2003) Determination of stress orientation and magnitude in deep wells. Int J Rock Mech Min Sci 40(7, 8):1049–1076
Acknowledgements
The authors would like to thank Schlumberger for their support.
Author information
Authors and Affiliations
Corresponding author
Additional information
Publisher's Note
Springer Nature remains neutral with regard to jurisdictional claims in published maps and institutional affiliations.
Rights and permissions
Open Access This article is licensed under a Creative Commons Attribution 4.0 International License, which permits use, sharing, adaptation, distribution and reproduction in any medium or format, as long as you give appropriate credit to the original author(s) and the source, provide a link to the Creative Commons licence, and indicate if changes were made. The images or other third party material in this article are included in the article's Creative Commons licence, unless indicated otherwise in a credit line to the material. If material is not included in the article's Creative Commons licence and your intended use is not permitted by statutory regulation or exceeds the permitted use, you will need to obtain permission directly from the copyright holder. To view a copy of this licence, visit http://creativecommons.org/licenses/by/4.0/.
About this article

Cite this article
Ahmed, B.I., Al-Jawad, M.S. Geomechanical modelling and two-way coupling simulation for carbonate gas reservoir. J Petrol Explor Prod Technol 10, 3619–3648 (2020). https://doi.org/10.1007/s13202-020-00965-7
Received:
Accepted:
Published:
Issue Date:
DOI: https://doi.org/10.1007/s13202-020-00965-7