 Hui-Xing Kang
 Xin-Guang Zhu
 Wataru Yamori
 Yan-Hong Tang
- 1Institute of Ecology, College of Urban and Environmental Sciences and Key Laboratory for Earth Surface Processes of Ministry of Education, Peking University, Beijing, China
- 2Center of Excellence for Molecular Plant Sciences and State Key Laboratory of Plant Molecular Genetics, Chinese Academy of Sciences, Shanghai, China
- 3Institute for Sustainable Agro-Ecosystem Services, Graduate School of Agricultural and Life Sciences, The University of Tokyo, Tokyo, Japan
Leaf temperature changes with incident light intensity, but it is unclear how the concurrent changes influence leaf photosynthesis. We examined the time courses of CO2 gas exchanges and chlorophyll fluorescence of seedling leaves in four tropical tree species in response to lightflecks under three different temperature conditions. The three conditions were two constant temperatures at 30°C (T30) and 40°C (T40), and a simulated gradually changing temperature from 30 to 40°C (Tdyn). The time required to reach 50% of the full photosynthetic induction under T40 was similar to, or even larger than, that under T30. However, the induction of assimilation rate (A) and electron transport rate of photosystem II (ETR II) and Rubisco activation process were generally accelerated under Tdyn compared to those at either T30 or T40. The acceleration in photosynthetic induction under Tdyn was significantly greater in the shade-tolerant species than in the shade-intolerant species. A modified photosynthetic limitation analysis indicated that the acceleration was likely to be mainly due to ETR II at the early stage of photosynthetic induction. The study suggests that concurrent increases in leaf temperature with light may increase leaf carbon gain under highly fluctuating light in tropical tree seedlings, particularly in shade-tolerant species.
Introduction
Most of our understanding on plant photosynthesis so far is almost completely based on the measurements made under so-called steady-state or temporally constant environments. However, photosynthesis in nature rarely or even never occurs under constant environments, but under fluctuating light, and changing temperature and other environmental variables. Field observations showed considerable variation in photosynthetically active radiation (PAR) at different temporal scales from seconds to days under tropical forest canopies (Pearcy, 1983; Tang et al., 1999). Efficient utilization of temporally variable light has been considered to be critical for leaf carbon gain (Pearcy, 1990; Kaiser et al., 2015; Tomimatsu and Tang, 2016; Yamori, 2016).
Temporal changes in PAR under forest canopies are often accompanied with changes in leaf temperature (Tleaf; Singsaas and Sharkey, 1998; Wise et al., 2004). Changes in Tleaf can be closely associated with changes of PAR. For example, leaf temperature increased from 32 to 39°C within several min due to sunflecks (Leakey et al., 2003). Despite of a limited number of observations indicating a close relationship between changes in Tleaf and changes in light intensity, there is no detailed quantitative description, within our knowledge, for Tleaf changes in response to a step change in light intensity. Nonetheless, such associated changes in temperature with light are expected to influence photosynthesis in nature because leaf photosynthesis is a highly temperature-dependent process (Berry and Björkman, 1980). Recent studies further suggest that photosynthetic induction in response to an increase in PAR varied at different constant temperatures (Leakey et al., 2003; Kaiser et al., 2017; Wachendorf and Küppers, 2017). Moreover, thermal responses of photosynthesis are highly species specific (Slot et al., 2016; Slot and Winter, 2017a; Slot and Winter, 2017b; Fauset et al., 2018). However, very little knowledge has been accumulated regarding concurrent changes in leaf temperature with light on dynamic photosynthesis, despite the fact that the changes may be potentially important for leaf carbon gain under fluctuating light and temperature conditions in nature.
In this study, we characterized induction kinetics in four lowland tropical tree species under two constant temperatures and a simulated dynamic temperature condition, aiming to address (1) how the concurrent changes in leaf temperature with light affect the photosynthetic induction process, (2) if and how major physiological and biochemical processes contribute to the effect(s), and (3) whether there are any differences in the effect(s) between shade-tolerant and shade-intolerant tree species in tropical rain forests.
Materials and Methods
Study Site and Plant Species
The study was conducted in a lowland tropical rain forest in Pasoh Forest Reserve (2°59′N, 102°08′E), Malaysia. This is a primary Dipterocarp forest with an averaged leaf area index estimated as 6.52 in the core area of the reserve (Tani et al., 2003b). The annual rainfall of the normal years, i.e., no El Niño years, observed by the meteorological station within the reserve averaged 1809 mm during the period from 1983 to 1990. Most rainfall was observed during the rainy season from March to May and from October to December. Mean annual temperature at 52 m above the forest floor was 25.6°C, ranging from 22.6 to 29.9°C (Tani et al., 2003a).
The study species were two shade-intolerant species, Croton argyratus Blume and Shorea leprosula Miq., and two shade-tolerant species, Neobalanocarpus heimii (King) Ashton and Lepisanthes senegalensis (Poir.) Leenh, which are all native to lowland forests (Thomas et al., 2003). Five to six seedlings from different light regimes were selected for each species. Light regime was characterized as averaged daily light integral (DLI) of 60 days prior to the experiment (unit mol m-2 d-1), which was estimated from hemispherical photographs using SOLARCALC 7.0 (Mailly et al., 2013). All field measurements were conducted between August and October 2018.
Leaf Gas Exchange and Chlorophyll Fluorescence
Photosynthetic induction responses were measured using a LI-6800 (LI-COR, Lincoln NE, USA) fitted with a LI-6800-01 fluorometer (90% red and 10% blue) on a fully expanded and healthy leaf in each selected seedling. Leaves were first acclimated to the irradiance at 50 μmol m-2 s-1 for at least 20 min until steady-state assimilation rate (A) and stomatal conductance for H2O (gsw) were visibly reached, after which light was raised to 1000 μmol m-2 s-1 for 32 min. A, gsw, and intercellular CO2 concentration (Ci) were logged every second. To avoid any artefacts from correctional changes in temperature or relative humidity, temperature of the heat exchanger (Texchg) was controlled. Photosynthetic induction was measured under three different temperature conditions, i.e., two constant temperature conditions with 30°C (T30) and 40°C (T40), and a simulated dynamic temperature condition (Tdyn). For the two constant temperatures, Tleaf reached a constant value around 30.7°C under T30 and 36.6°C under T40 prior to the increase in light. Under the Tdyn condition, Texchg was kept at 30°C before the increase in light and then set to an expected value of 40°C at the same time when light increased. The warming speed of leaf temperature was similar to our observation within the same forest (Figure S1). Prior to the induction, leaf-to-air vapor-pressure deficit (VPD) was kept steady around 1 kPa under Tdyn and T30 and 2.3 kPa under T40 to mimic the natural levels at each temperature, according to our records of within-canopy microenvironments (see Figure S2). Reference CO2 concentration was maintained at 400 μmol mol-1. Photosynthetic CO2 response curves were generated with a LI-6400XT equipped with a LI-6400-02B LED light source on the same leaves at a block temperature of 30 and 40°C. Leaves were first fully induced under 400 μmol mol-1 and 1000 μmol m-2 s-1. Then, the reference CO2 concentration was reduced to 50 μmol mol-1 in a stepwise manner, after which it returned to the starting level. When steady-state A was again reached, the CO2 concentration was increased to 1500 μmol mol-1 in several steps. Flow rate was maintained at 350 μmol s-1, and relative humidity was controlled at 70%, which yield a VPD similar to that reached at the end of induction.
All measurements were repeated with the same environmental settings as the measurement of photosynthetic induction course to produce the time courses of chlorophyll fluorescence signals using the same LI-6800. Hence, we obtained two sets of induction curves, one with gas exchange only and the other with both gas exchange and chlorophyll fluorescence. Leaf samples were placed in dark for at least 2 h. Then, light was increased to 50 μmol m-2 s-1 until gas exchange parameters reached steady state, which typically took 20 min, followed by 30 min of induction. However, due to weather and insufficient time, some chlorophyll fluorescence measurements under Tdyn started from a light intensity of 50 μmol m-2 s-1 directly without dark adaptation. For these measurements, less time (~10 min) was required to reach steady state under low light. Gas exchange parameters were recorded every 5 s, and chlorophyll fluorescence was recorded every minute. Recorded chlorophyll fluorescence signals include Fo and FM, if leaves were dark adapted, Fs, FM’, and Fo’ by turning off the actinic light and then applying far-red light. We used the multi-phase flash (MPF) protocol of the fluorometer for measuring FM and FM’. MPF settings were as factory default, including 8000 μmol m-2 s-1 for flash beam intensity, 40% ramp reduction during the 2nd phase of the MPF, and 0.3 s duration of each flash phase. The quantum yields of photosystem II [Y(II)] were calculated after Yamori et al. (2012). The electron transport rates of photosystem II (ETR II) were calculated using the following equation: ETR II = 0.5 × α × I × Y(II), where 0.5 is the fraction of absorbed light allocated to photosystems II, α is leaf light absorptance (see below), and I is light intensity. The quantum yields of photochemical quenching based on the puddle (qP) and the lake model (qL) and non-photochemical quenching (NPQ) were calculated as described by Kalaji et al. (2017). Data obtained without dark adaptation were excluded from NPQ calculation.
Light Absorptance
Leaf light absorptance was calculated from measured reflectance and transmittance. For each species, four to six branches from seedlings other than those for photosynthesis measurements were sampled around 18:00 h, with the cut end submerged in water immediately. Samples were kept in dark and then measured within 6 h using a Maya-2000-Pro spectrometer (Ocean Optics, Dunedin, FL, USA). Four to six healthy, fully expanded leaves in each sampled branch and three to four discs per leaf were measured. Light absorptance was calculated with respect to the irradiance spectrum of the LI-6800-01 fluorometer, which was also measured with the same spectrometer. This yield leaf light absorptance of 0.88, 0.87, 0.90, and 0.92 for N. heimii, L. senegalensis, C. argyratus, and S. leprosula, respectively.
Data Analysis
For those measurements made under Tdyn, the time course of H2O concentration in the sample cell (H2Os) exhibited an unusually steep peak within the first minute, since the LI-6800 started to elevate Texchg. As a result, stomatal conductance doubled and Ci increased during the first minute since LED light and Texchg concurrently changed. After excluding the possibility of a contaminated leaf chamber by repeating the same measurement settings with a brand new LI-6800 later, we suspected that such errors were induced by the heat exchanger itself. We matched the LI-6800 only immediately before each measurement, and the differences in match adjustment factor between two consecutive measurements were small compared to the differences in water concentrations result from foliar transpiration. Thus, we proposed an empirical method to sequentially correct H2Os, transpiration rate, A, gsw, and Ci (for detailed information, see Supplementary File S1).
To determine the maximum rate of increase in , the time courses of A during induction (gas exchange only) were fitted to the Boltzmann sigmoidal model proposed by Drake et al. (2013):
where a1 and a2 are the left and right horizontal asymptotes, respectively, t0 is the point of inflection, and ΔtA describes the steepness of the curve. The maximum rate of increase is the value of the derivative of Equation (1), where t = t0. The maximum rate of increase in was calculated in the same way.
To assess if sunfleck utilization was improved or inhibited under Tdyn and T40, induction carbon gain (ICG) at time t was calculated after Chazdon and Pearcy (1986a):
where Aini is the steady-state A prior to the induction.
To identify the transition point between Rubisco and RuBP regeneration limitation (Ci,trans) at high temperature, photosynthetic CO2 response curves were fitted after Bellasio et al. (2016), assuming a constant RL : Rd ratio of 60% (Way et al., 2019). Rd was calculated by averaging the readings over the last minute in the dark period during chlorophyll fluorescence measurements. Ci,trans was determined as:
where Vc,max is the apparent maximum carboxylation rate of Rubisco, J1000 is the potential electron transport rate under 1000 μmol m-2 s-1, Г* is the CO2 photocompensation point, and Km is the effective Michaelis-Menten constant for Rubisco after Bernacchi et al. (2001).
To obtain the apparent time constant of Rubisco activation (τRubisco), transient A, recorded during chlorophyll fluorescence measurements, was corrected to steady-state Ci reached at the end of induction (Ci,f) with respect to transient Tleaf after Urban et al. (2007) and then fitted to the exponential function proposed by Woodrow and Mott (1989):
where is the final corrected A and Ai is the estimated initial A prior to the induction. For modeling convenience, we assumed that Rubisco is a one-phase process and used the data from whole induction curves for fitting. In the prior test, we found that fitting the whole curves yield higher R2 and smaller confidence intervals than only fitting the data from minute 2 to 10 after the light increase in 25 among 30 cases. We also acknowledge that using the data from whole curve could underestimate τRubisco. Using transient Ci recorded during chlorophyll fluorescence measurements, we calculated the potential A supported by transient ETR II (Aj) and that supported by transient carboxylation rate with respect to transient Tleaf (Ac):
The temperature response of Rd was described for each leaf studied using an exponential model with Q10 (Vanderwel et al., 2015). The temperature dependency of Г* for each leaf was described by the Arrhenius function using the CO2 response curves:
where Г*(25) is Г* at 25°C and Ea is the activation energy term. R is the molar gas constant. For simplicity, we assume that RL, Km, and Г*, which respond to fluctuations in temperature instantaneously, and components of ETR II, i.e., fraction of absorbed light allocated to photosystems II and leaf light absorptance, remain constant during induction. Considerations of these assumptions are described in detail in Discussion. Transient carboxylation rate (Vc) was estimated in analogy to Eqn. (1):
Vc,f and Vc,ini were estimated from the so-called one-point method (De Kauwe et al., 2016) using data recorded before and at the end of induction, respectively. Assimilation rate decreased during induction in some measurements made under Tdyn.
ETR II obtained under photorespiratory condition was likely to deviate from true linear electron transport rate, leading to incorrect Aj. Considerations on how to model the midway decrease in A during induction and necessary calibration of ETR II are described in detail in Supplementary File S2. We compared Ac(t) against Aj(t) to determine whether photosynthetic rate was limited by Rubisco carboxylation or RuBP regeneration at time t.
Statistical Analysis
To determine the effects of measurement temperature condition, data were compared by one-way ANOVA test. Data were log-transformed to meet the assumptions of normality and homogeneity of variances when necessary. Otherwise, a non-parametric Kruskal-Wallis test was used. All tests were conducted using SPSS Statistics Version 20.0 (IBM Corp., New York, USA). To examine whether the variances in the induction responses between T30 and Tdyn were related to species-specific shade tolerance (S) and DLI, we performed a two-way ANOVA analysis using S and DLI as the main factors and S × DLI as the interaction factor. The differences in induction responses were represented as the percentage change of a parameter. These tests were carried out in R version 3.5.0 (R Core Team, 2018).
Results
Photosynthetic Induction Response
Time courses of photosynthetic induction under three different temperature conditions are shown in Figure 1. After full acclimation under T40, both initial photosynthetic rate (Aini) and final steady-state photosynthetic rate (Af) were significantly smaller than those under T30 (Table 1). The maximum rate of increase in under T40 decreased by 31–64% compared to that under T30.
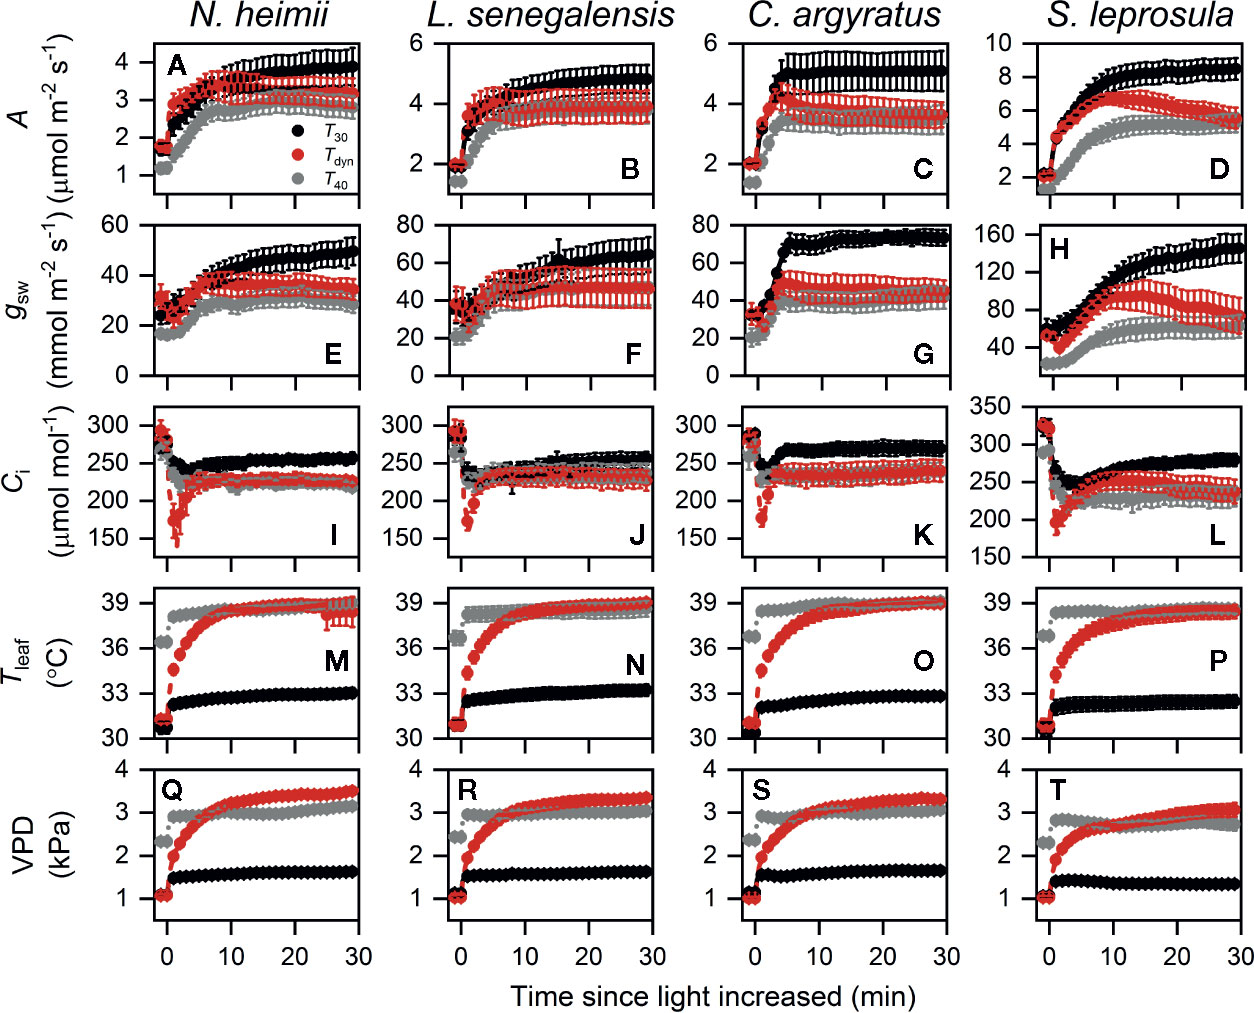
Figure 1 Time courses of A (A–D), gsw (E–H), Ci (I–L), Tleaf (M–P), and VPD (Q–T) during photosynthetic induction in N. heimii (A, E, I, M, Q), L. senegalensis (B, F, J, N, R), C. argyratus (C, G, K, O, S), and S. leprosula (D, H, L, P, T). Shown are the data recorded during gas exchange only measurements under constant 30°C (T30) and 40°C (T40) and simulated dynamic temperature condition (Tdyn). Values are the means ( ± SE) of five to six individual seedlings for each species. A, assimilation rate; gsw, stomatal conductance for H2O; Ci, intercellular CO2 concentration; Tleaf, leaf temperature; VPD, leaf-to-air vapor pressure deficit.
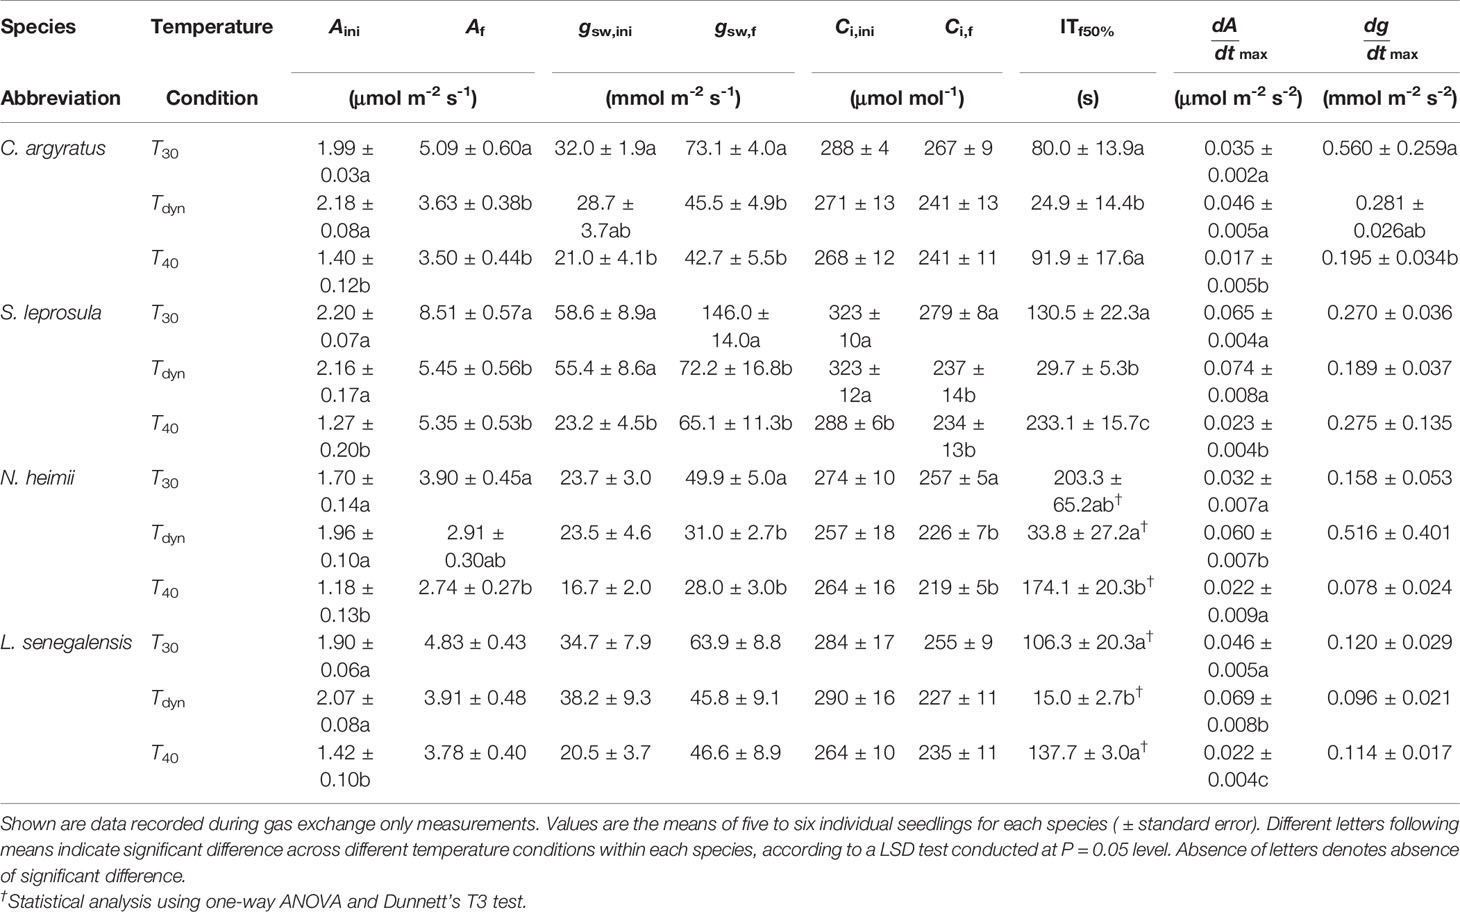
Table 1 Parameters of photosynthetic induction since the increase in irradiance from 50 to 1000 μmol m-2 s-1 in four tropical woody species under constant 30°C (T30), 40°C (T40), and simulated dynamic temperature condition (Tdyn). Aini, Af, gsw,ini, gsw,f, Ci,ini, and Ci,f were A, gsw, and Ci reached before and at the end of photosynthetic induction, respectively, calculated by averaging single values over the last minute of each period; ITf50%, the time required to reach 50% of the difference between Aini and Af; and were the maximum increasing rate of A and gsw, respectively.
Photosynthetic rate increased faster under Tdyn than either T30 or T40 and showed an overshoot within 10 min after light intensity increased. Af under Tdyn was similar to that under T40. The time required to reach 50% of full photosynthetic induction (ITf50%) under Tdyn was 69–86% lower and 73–89% lower than that under T30 and T40, respectively (Table 1). The difference in between T30 and Tdyn was significant in the shade-tolerant species.
Stomatal conductance before and at the end of induction decreased in all species under T40 compared to those under T30 (Table 1). The maximum rate of increase in gsw was larger under T30 than Tdyn, except for N. heimii. A larger depletion in Ci during induction was observed under Tdyn than T30 and T40 in all species (Figure 1).
Photosynthetic Sub-Processes Under Different Temperature Conditions
The time required for ETR II to reach 50% of full induction (ETR50%) was 17–44% lower under Tdyn than T30 (Table 2). ETR II reached a maximum within 10 min and decreased afterward under Tdyn (Figure 2). The dynamics of qP and qL were similar among the three temperature conditions. In comparison with T30, NPQ increased faster under T40 in all species and under Tdyn in N. heimii and C. argyratus.
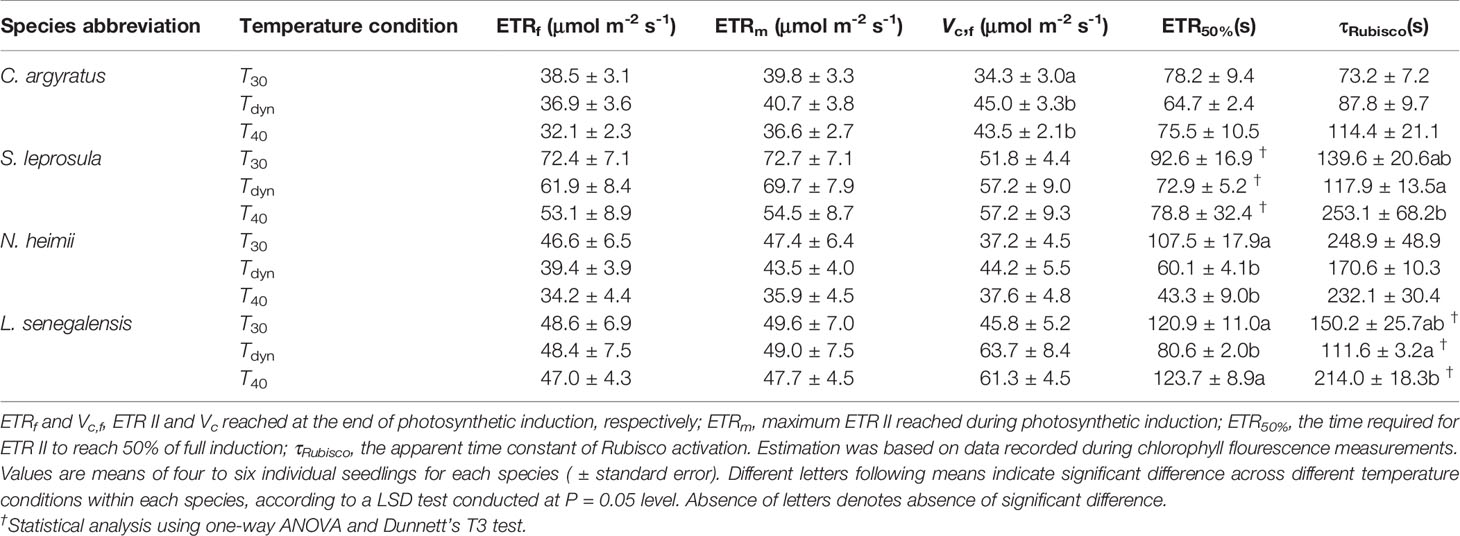
Table 2 Parameters of the time courses of ETR II and Vc during photosynthetic induction since the increase in irradiance from 50 to 1000 μmol m-2 s-1 in four tropical woody species under constant 30°C (T30), 40°C (T40), and dynamic temperature condition (Tdyn).
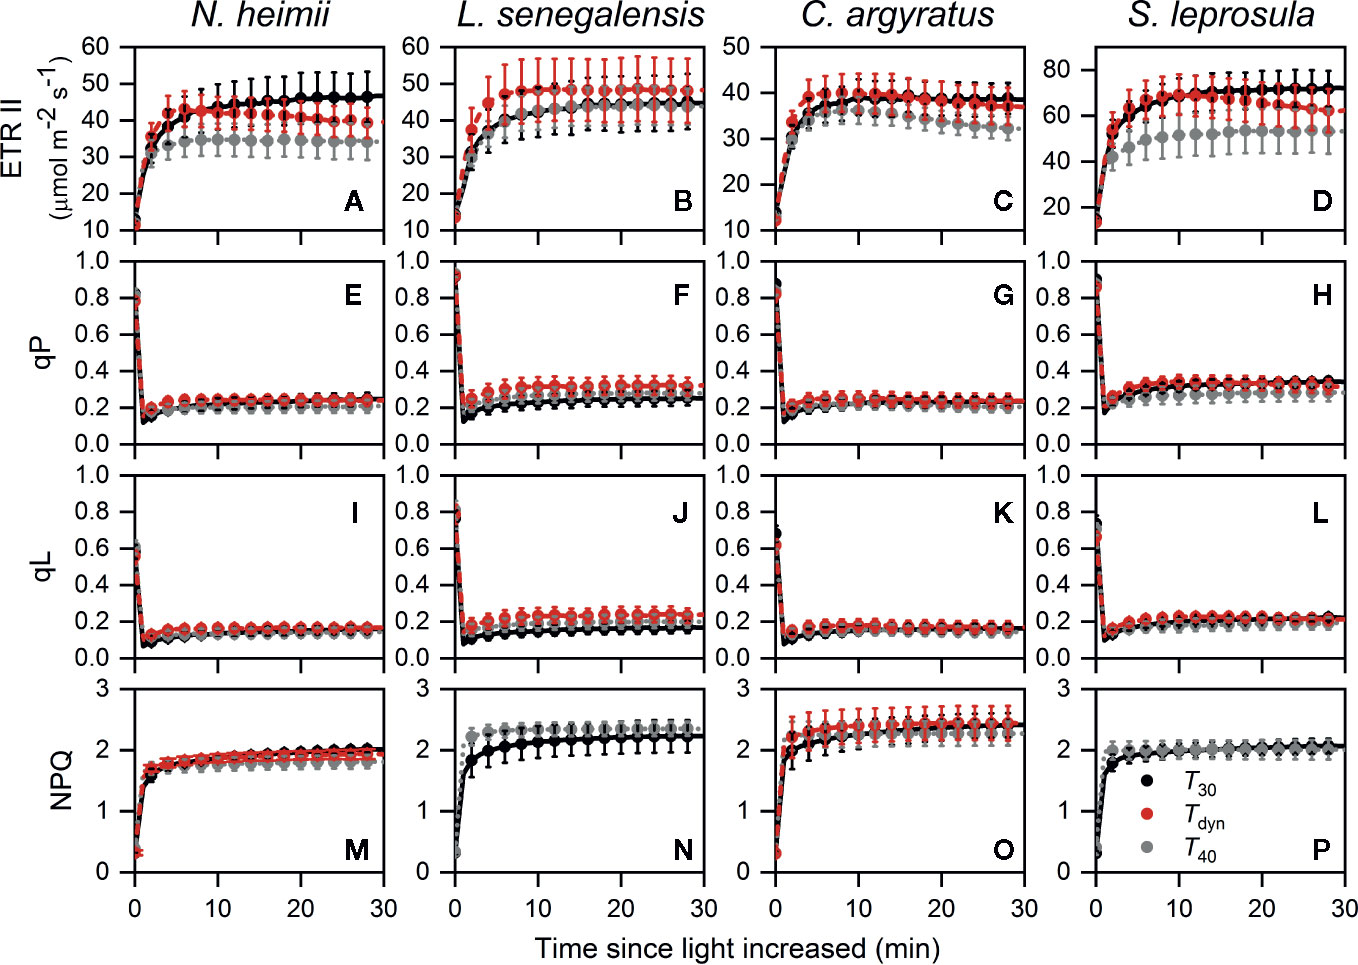
Figure 2 Time courses of ETR II (A–D), qP (E–H), qL (I–L), and NPQ (M–P) during photosynthetic induction in N. heimii (A, E, I, M), L. senegalensis (B, F, J, N), C. argyratus (C, G, K, O), and S. leprosula (D, H, L, P). Values are the means ( ± SE) of three to six individual seedlings for each species under constant 30°C (T30) and 40°C (T40) and dynamic temperature condition (Tdyn). NPQ in L. senegalensis and S. leprosula was not shown due to insufficient replicates (n < 3, see Materials and Methods). ETR II, electron transport rate of photosystem II; qP and qL are photochemical quenching based on the puddle and the lake model, respectively; NPQ, non-photochemical quenching.
Steady-state Vc reached at the end of induction was higher under Tdyn and T40 than that under T30 (Table 2). The time constants of Rubisco activation were larger under T40 in all species, except for a small decrease in N. heimii. In comparison with T30, τRubisco decreased under Tdyn in all species, except for a small increase in C. argyratus.
Primary Limiting Factor During Photosynthetic Induction
As shown in Figure 3, estimated Ac matched the time course of measured A. We noted that A was limited by Aj only for the first several min (Figure S3), after which A was limited by Ac instead. The averaged time length of Aj limitation ranged from 1.4 to 2.7 min under T30, while the rest of photosynthetic induction was occupied by Ac limitation. Limitation from Ac almost dominated the entire induction process under T40 (Figure S3). This was consistent with CO2 response curves obtained at T40, as the transition point between Rubisco and RuBP regeneration limitation was much higher than transient Ci during induction in all species (Figure 4).
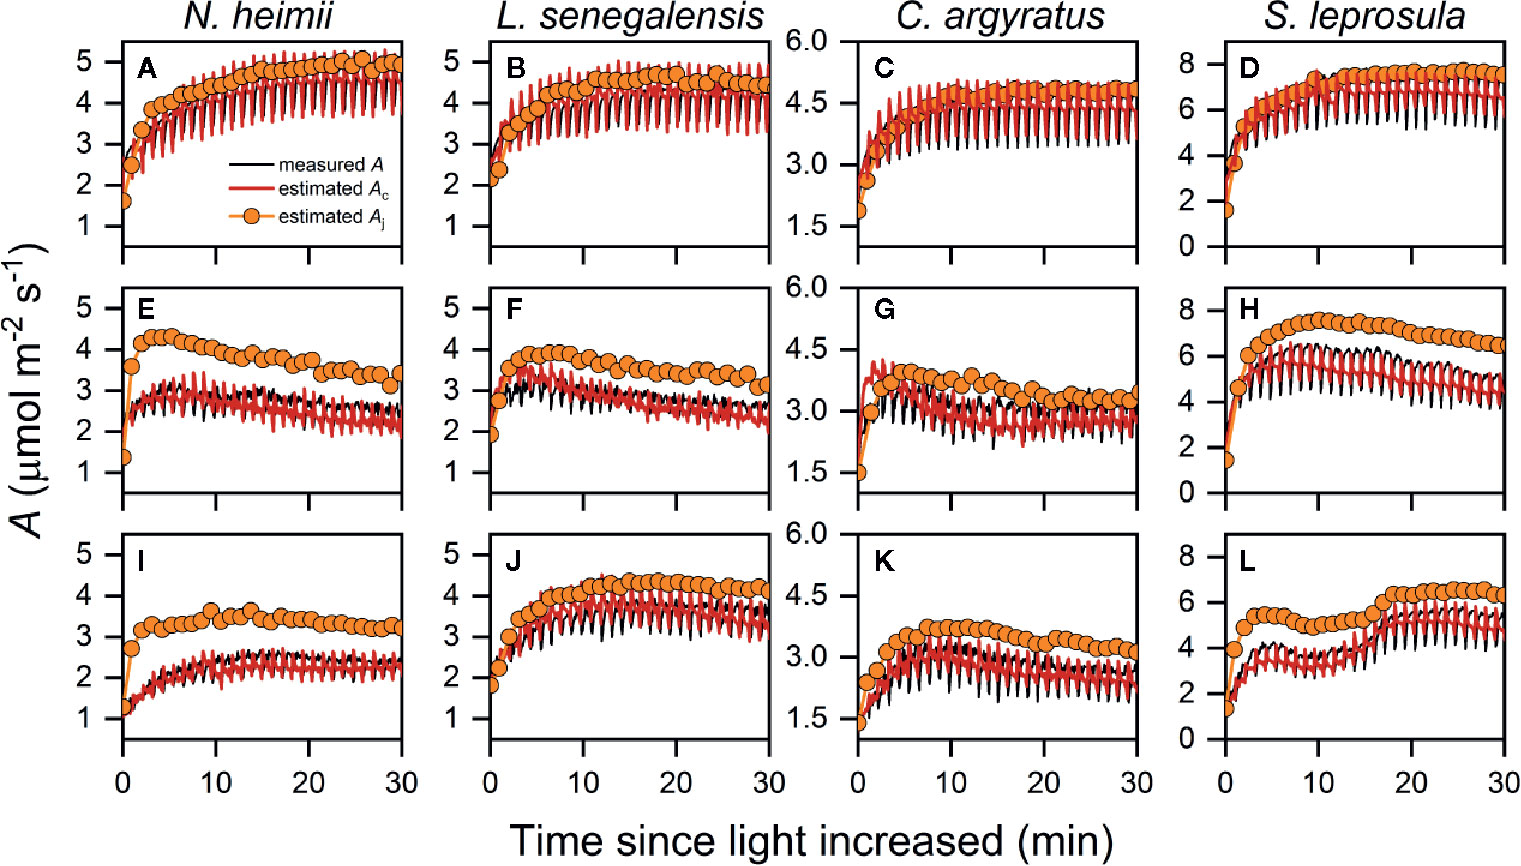
Figure 3 Representative time courses of measured A (open symbols), estimated Ac (red solid line), and estimated Aj (orange symbols with solid line) during photosynthetic induction in N. heimii (A, E, I), L. senegalensis (B, F, J), C. argyratus (C, G, K), and S. leprosula (D, H, L) under constant 30°C [T30 (A–D)] simulated dynamic temperature [Tdyn (E–H)] and constant 40°C condition [T40 (I–L)], respectively. Measured A were those simultaneously recorded during chlorophyll fluorescence measurements. Estimated Ac and Aj were the potential A supported by Vc and ETR II, respectively. Periodic oscillations of A were inevitable due to the periodic dark pulses necessary for determining fluorescence yield.
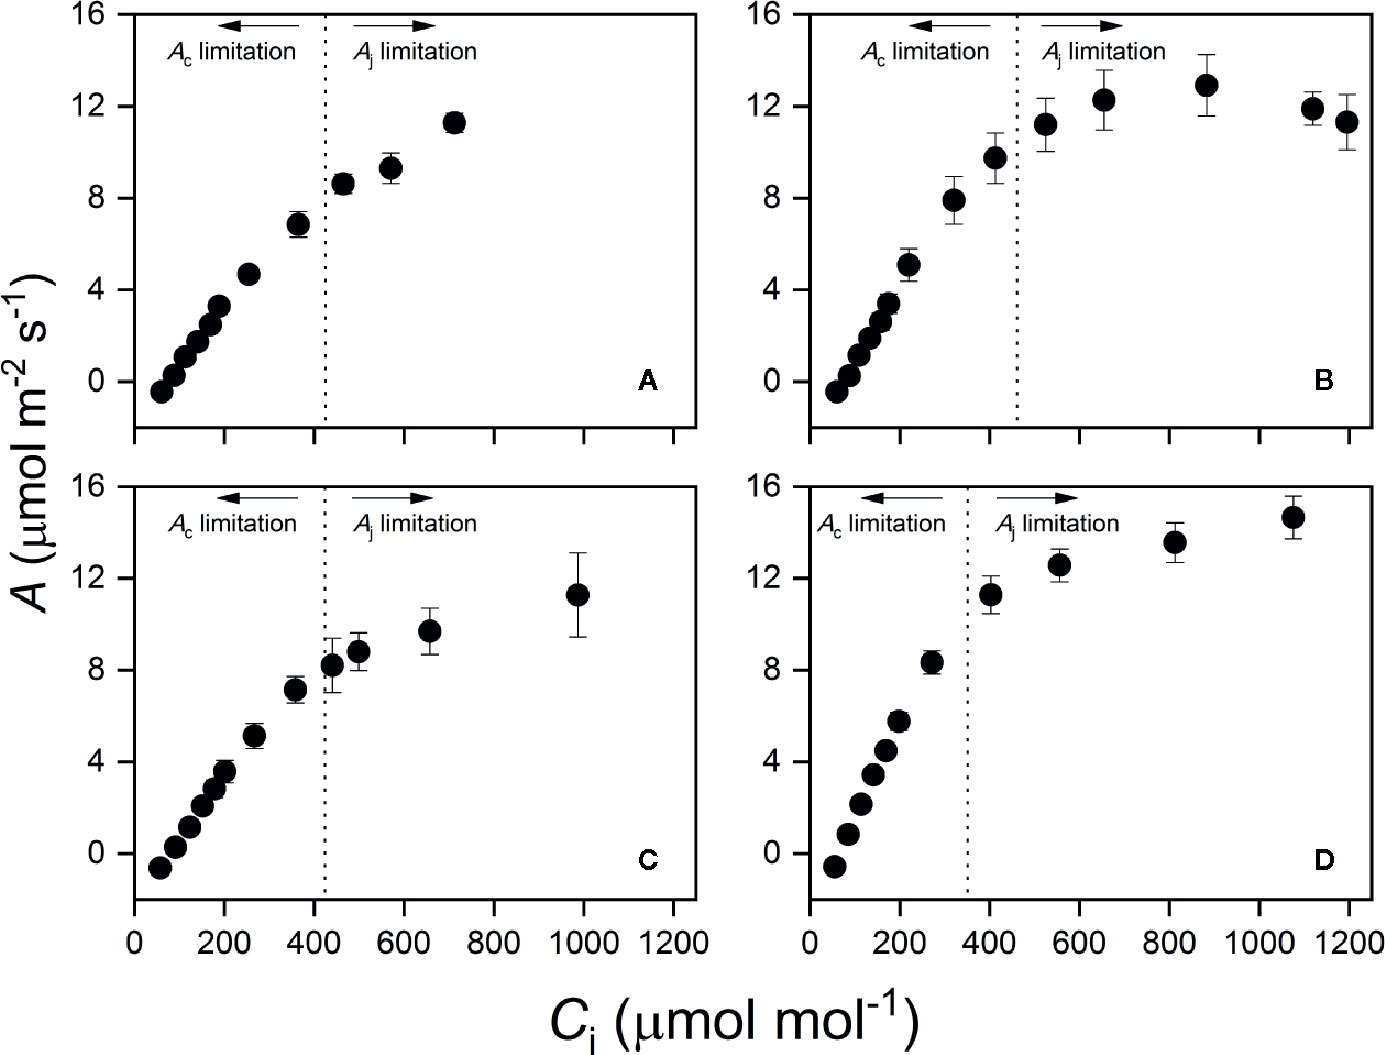
Figure 4 Photosynthetic CO2 response curve at high temperature (T40) in N. heimii (A), L. senegalensis (B), C. argyratus (C), and S. leprosula (D). Assimilation rate (A) was recorded under 1000 μmol m-2 s-1 at an average leaf temperature of 36.7°C.The x-intercept of vertical dotted lines represents the averaged transition CO2 concentration in each species, above which the primary limitation imposed on photosynthesis switched from Ac to Aj. Values are the means ( ± SE) of five to six individual seedlings for each species. A, assimilation rate; Ci, intercellular CO2 concentration.
Carbon Gain
ICG within the first 5 min under T40 was 45–83% of that under T30 (Figure 5). However, ICG within the first minute increased by 38–153% under Tdyn compared to that under T30. The differences in ICG between Tdyn and T30 decreased as the integration interval increased. ICG over 30 min (ICG30min) was 20–38% lower under Tdyn than that under T30. The shade-tolerant species showed larger increments in ICG under Tdyn and smaller decreases under both Tdyn and T40 than the shade-intolerant species.
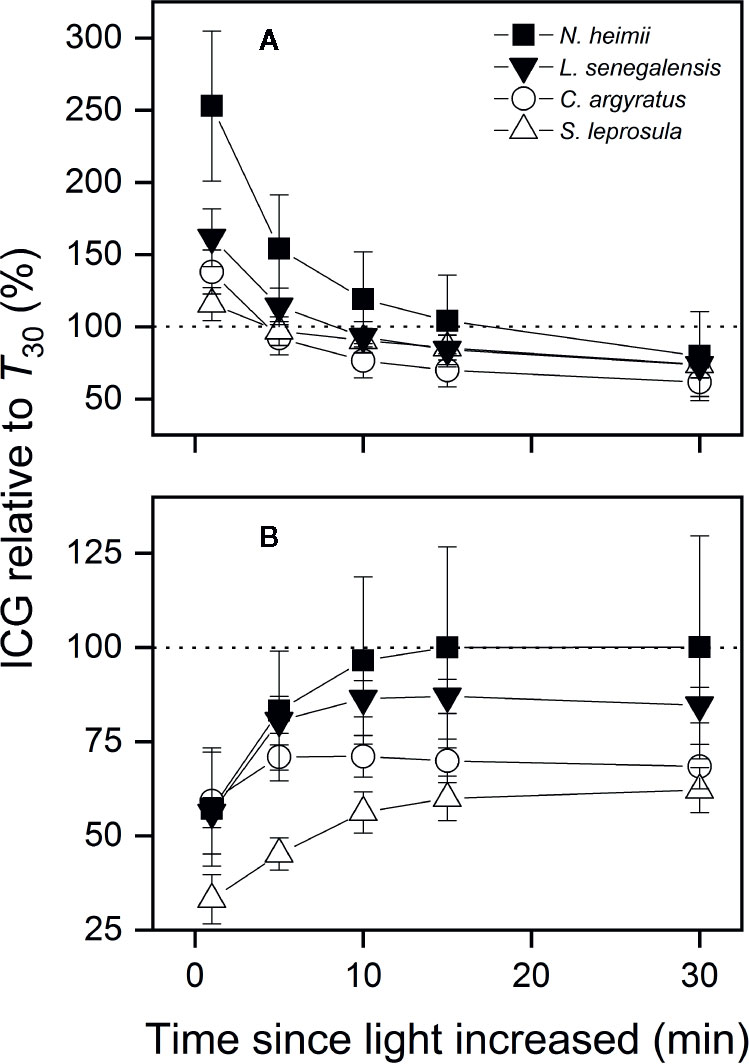
Figure 5 ICG under simulated dynamic temperature condition [Tdyn (A)] and under constant 40°C [T40 (B)] relative to that under constant 30°C (T30) as a function of the time since light increased in tree seedlings of four tropical woody species. Shown are data recorded during gas exchange only measurements. The dotted lines indicate equal amount of ICG between two temperature conditions. Open and closed symbols represent data from shade-intolerant and shade-tolerant species, respectively. Values are the means ( ± SE) of five to six individual seedlings for each species. No significant differences were found across species at P = 0.05 level.
The Effects of Species-Specific Shade Tolerance and Growth Light Environment
In comparison with T30, increments in and ICG1min under Tdyn were significantly related to species-specific shade tolerance (Table 3). The decrease in ITf50% was related to individual averaged DLI, as seedlings with low DLI showed greater reduction in ETRf than those with high DLI (Figure S4).
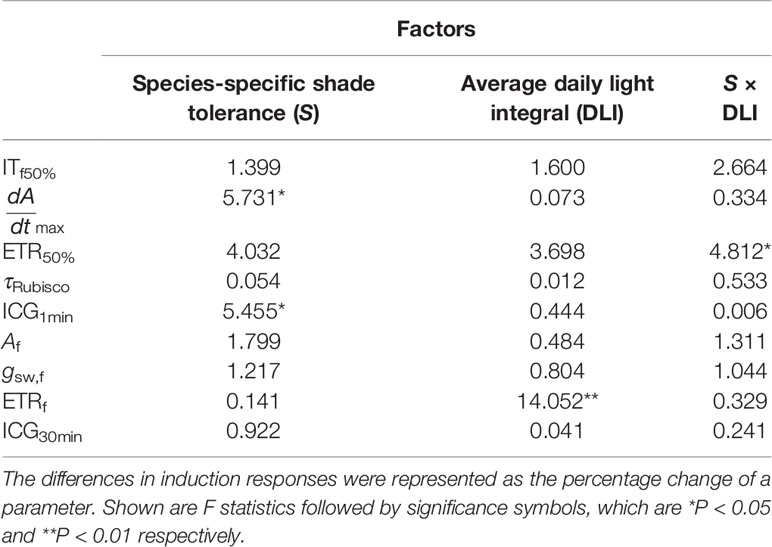
Table 3 The influences of species-specific shade tolerance (S) and average DLI on the differences in induction responses between T30 and Tdyn.
Discussion
A Gradual Increase in Leaf Temperature Affects Photosynthetic Induction Process
Photosynthesis consists of a number of temperature-dependent biochemical processes (Berry and Björkman, 1980), and the induction process of photosynthesis thus depends on temperature. Recent studies showed that photosynthetic induction can be greatly altered by steady-state environmental temperature (Kaiser et al., 2017; Wachendorf and Küppers, 2017). It is however important to know how changing leaf temperature, accompanied with light changes, would affect photosynthetic induction rate. By comparing gradually increasing leaf temperature with two constant leaf temperatures after an increase in light, it is evident that an elevating leaf temperature from 30 to 40°C accelerates photosynthetic rate at the early-stage induction more than the two extreme constant temperatures of 30 and 40°C (Figure 1). This conclusion can be confirmed by the smaller ITf50% and larger (Table 1). The increase in simulated ETR at the early stage of the induction response also supports the conclusion (Figure 2). It should be also noticed that photosynthetic rate reached the steady-state much faster under the gradual increasing leaf temperature than either constant leaf temperatures, particularly in the shade-tolerant species (Figure 1). A full induction state of photosynthetic rate was achieved (within 2–3 min often) even before the leaf temperature reached its steady-state (about 10 min). This fact may indicate that a combined effect of changing leaf temperature, associated with an increase in light, on photosynthetic induction could include some different thermal processes rather than only under constant temperature conditions, which, to our knowledge, is being observed for the first time and deserves further clarification.
Factors Involved in the Induction Process Under Different Temperature Conditions
During the first several min after an increase in light intensity, the increase in photosynthetic rate is often constrained by RuBP regeneration, which is further limited by ETR, light activation of Rubisco, and stomatal opening (Way and Pearcy, 2012; Kaiser et al., 2015; Yamori et al., 2020). All these factors are thermal sensitive, but the time constants of temperature and light stimulations could be considerably different (Leakey et al., 2003; Kaiser et al., 2017; Wachendorf and Küppers, 2017). It is difficult to elucidate individual effects of these factors only based on the gas change and chlorophyll fluorescence observations in this study. We tried to address how these factors contribute to photosynthetic induction under Tdyn using photosynthetic limitation analysis.
The acceleration of linear electron transport between photosystem II and I plays an evident role in the acceleration of early-stage induction of photosynthetic rate after increase of light, particularly in the shade-intolerant species (Table 2). In this study, the limitation of Aj dominates over the first 4–5 min under T30 (Figure 3 and Figure S3), which was longer than those reported for soybean before (Sassenrath-Cole and Pearcy, 1992; Way and Pearcy, 2012). Crop plants grown under controlled environments may have higher RuBP concentration and/or higher activation rate of RuBP regeneration in comparison with plants growing within tropical forests. Decreased ETR50% under Tdyn also indicated that accelerated induction of ETR was related to faster photosynthetic induction at the early stage under Tdyn. Constant temperatures strongly affect RuBP regeneration during photosynthetic induction process (Kaiser et al., 2017). Thus, accelerated induction of ETR II is expected to benefit faster relaxation of limitation through RuBP regeneration process.
An increase in leaf temperature will result in increases in VPD in natural environment. Changes in VPD will affect photosynthetic induction by itself. For example, an increase in VPD reduced gsw and thus increased diffusional limitation (Kaiser et al., 2017). On the other hand, when VPD was held constant, gsw and Ci would increase with increasing Tleaf (Urban et al., 2017). In our study, if we assume that gsw and Ci should remain the same as those reached under T30, then Af under Tdyn would increase by 16% on average. If we focus on the early-stage of induction, then effects of changes in VPD can be neglected since stomatal opening and photosynthetic induction didn’t change much by VPD at this stage (Tinoco-Ojanguren and Pearcy, 1993; Kaiser et al., 2017). Therefore, concurrent increases in VPD with rising Tleaf will not significantly change our current conclusion in this study.
The overshoots during photosynthetic induction under Tdyn may be due to inhibition of some physiological processes by high VPD and Tleaf. At the early-stage of induction when VPD and Tleaf were not so high, Rubisco was activated and stomata gradually opened. As VPD and Tleaf rose over a critical point, gsw (Figures 1E–H), ETR II (Figures 2A–D), and possibly activation state of Rubisco (Yamori et al., 2006; Scafaro et al., 2016; Busch and Sage, 2017) decreased and thus A decreased. Nonetheless, the overshoots need to be clarified in the future.
Photosynthetic Limitation Analysis
As discussed above, we determined the limiting process imposed on photosynthetic induction by comparing Ac and Aj after Farquhar et al. (1980). The classic photosynthetic limitation analysis defines photosynthetic limitation as a reduction in actual transient A compared with that estimated if biochemical or diffusional limitation was removed in one step. On the contrary, a stepwise method, which compares previous and subsequent photosynthesis state, produces smaller error than the one-step method, especially when time intervals between two states are small enough (Deans et al., 2019). The limitation analysis developed in this study is a stepwise method. Dynamic A-Ci analyses use high time-resolution dynamics of Vc and J by constructing induction curves at a wide range of different CO2 concentrations (Soleh et al., 2016; Taylor and Long, 2017; Salter et al., 2019). This method is time-consuming and risky due to the dependency of Rubisco activation state on CO2 concentration (Mott and Woodrow, 1993; Woodrow et al., 1996; Tomimatsu et al., 2019). Our method provides a compromise between convenience and accuracy and can be promoted with higher time-resolution fluorescence signals for both PSI and PSII.
Our observations showed that Tleaf changed by <0.2°C/s for the first min and <0.05°C/s for the rest of induction (Figure 1). Such changes in Tleaf should result in small changes in the steady-state RL and Г*. Thus, assuming instantaneous response of both parameters imposed little influence (<0.1%) on estimated Ac or Aj. The effect of a time lag in Km response is also limited. If Km changes by 50% of difference between two consecutive steady-states, Ac under Tdyn changes by less than 5%, in comparison with that assuming instantaneous response of Km. A decrease in leaf absorptance and/or fraction of absorbed light allocation to PSII is likely to occur when a shaded leaf is exposed to high light for long (Davis et al., 2011; Dutta et al., 2015; Mekala et al., 2015). A survey from 24 species indicates that leaf absorptance of PAR decreased by ~5% after 2 h exposure to high light (Davis et al., 2011), which alone may lead to an overestimation of Aj by ~5% and hence underestimation of Aj limitation. Simulation from Morales et al. (2018) also indicate small influences on A from changes in leaf absorptance. If allocation fraction should be 0.45 from the very beginning of induction, then Aj decreased by ~10%. This would increase the duration of Aj limitation, thus the dominant role of Aj over the early-stage of induction still holds.
Ecological Consequences of Changing Leaf Temperature With PAR
Concurrent change of leaf temperature with PAR may play an important role in leaf carbon uptake and energy balance under temporally variable light environments. Leakey et al. (2003) reported a decrease in ICG in S. leprosula seedlings at elevated constant temperature. In this study, we demonstrate that leaf carbon gain is enhanced within the first several min under Tdyn, although photosynthetic rate was depressed at the steady-state under 40°C (Table 1). Since most sunflecks occurring under dense forest canopies last only a few min (Pearcy, 1983; Chazdon and Pearcy, 1986b), the acceleration of photosynthetic rate accompanied with the increase in leaf temperature at the early stage of the induction suggests that short sunflecks may contribute more leaf carbon gain than previously estimated under constant temperature.
Moreover, it is still debated whether shade-tolerant species can use sunflecks more efficiently than shade-intolerant species (Naumburg and Ellsworth, 2000; Rijkers et al., 2000; Way and Pearcy, 2012). However, the argument is based on the knowledge obtained only under single constant temperature. When taking variation of leaf temperature into account, more leaf carbon gain may be achieved for shade-tolerant species because these species showed higher acceleration of photosynthetic rate than the shade-intolerant species under the changing leaf temperature in this study.
ecent studies suggest that shade-intolerant species from tropical regions have higher photosynthetic temperature optimum, lower Tleaf, and a wider temperature range for photosynthesis (Cheesman and Winter, 2013; Slot and Winter, 2017a; Slot and Winter, 2017b) and thus seem more competitive than shade-tolerant species in a warming world. A less strong reduction in ICG found in the shade-tolerant species under Tdyn and T40 (Figure 5), however, provides some contrasting evidence. Detailed assessments on photosynthetic response and energy balance under dynamic environments, particularly under changing light and temperature conditions, are urgently needed to understand the effect of climate change on plants in tropical forests.
Conclusion
We provide the first evidence that increase in leaf temperature, associated with increase in light, accelerates photosynthetic rate at the early stage of induction process. We further demonstrated that the acceleration is likely to be mainly due to accelerated induction of ETR II. These results extend our understanding of dynamic photosynthesis to cover the effects of concurrent changes in leaf temperature and light. However, there are a number of limitations in this preliminary study, and further studies are needed to understand physiological controls of the concurrent changes, particularly in relation to leaf energy budget.
Data Availability Statement
The raw data supporting the conclusions of this article will be made available by the authors, without undue reservation.
Author Contributions
H-XK and Y-HT contributed to conception and design of the study. H-XK performed the experiments and the statistical analysis. H-XK wrote the manuscript. X-GZ, WY, and Y-HT provided editorial and scientific advice. All authors contributed to the article and approved the submitted version.
Funding
This study was funded by the Key Research of Plant Functional Ecology Program of Peking University (no. 7101302307). This work was supported in part by JSPS KAKENHI (grant numbers JP16H06552, JP18H02185 and JP18KK0170 to W.Y).
Conflict of Interest
The authors declare that the research was conducted in the absence of any commercial or financial relationships that could be construed as a potential conflict of interest.
Acknowledgments
We thank Kouki Hikosaka for his constructive comments and stimulating discussion. We thank Azizi Ripin for identifying plant species. Our thanks are also due to Yao Tze-Leong and other staff at the Pasoh Forest Reserve for their generous help.
Supplementary Material
The Supplementary Material for this article can be found online at: https://www.frontiersin.org/articles/10.3389/fpls.2020.01216/full#supplementary-material
References
Bellasio, C., Beerling, D. J., Griffiths, H. (2016). An Excel tool for deriving key photosynthetic parameters from combined gas exchange and chlorophyll fluorescence: theory and practice. Plant Cell Environ. 39 (6), 1180–1197. doi: 10.1111/pce.12560
Bernacchi, C. J., Singsaas, E. L., Pimentel, C., Portis, A. R., Long, S. P. (2001). Improved temperature response functions for models of Rubisco-limited photosynthesis. Plant Cell Environ. 24, 253–259. doi: 10.1111/j.1365-3040.2001.00668.x
Berry, J., Björkman, O. (1980). Photosynthetic response and adaptation to temperature in higher plants. Annu. Rev. Plant Biol. 31, 491–543. doi: 10.1146/annurev.pp.31.060180.002423
Busch, F. A., Sage, R. F. (2017). The sensitivity of photosynthesis to O2 and CO2 concentration identifies strong Rubisco control above the thermal optimum. New Phytol. 213 (3), 1036–1051. doi: 10.1111/nph.14258
Chazdon, R. L., Pearcy, R. W. (1986a). Photosynthetic responses to light variation in rainforest species II. Carbon gain and photosynthetic efficiency during lightflecks. Oecologia 69, 524–531. doi: 10.1007/BF00410358
Chazdon, R. L., Pearcy, R. W. (1986b). Photosynthetic responses to light variation in rainforest species: I. Induction under constant and fluctuating light conditions. Oecologia 69, 517–523. doi: 10.1007/BF00410357
Cheesman, A. W., Winter, K. (2013). Growth response and acclimation of CO2 exchange characteristics to elevated temperatures in tropical tree seedlings. J. Exp. Bot. 64 (12), 3817–3828. doi: 10.1093/jxb/ert211
Davis, P. A., Caylor, S., Whippo, C. W., Hangarter, R. P. (2011). Changes in leaf optical properties associated with light-dependent chloroplast movements. Plant Cell Environ. 34 (12), 2047–2059. doi: 10.1111/j.1365-3040.2011.02402.x
De Kauwe, M. G., Lin, Y. S., Wright, I. J., Medlyn, B. E., Crous, K. Y., Ellsworth, D. S., et al. (2016). A test of the ‘one-point method’ for estimating maximum carboxylation capacity from field-measured, light-saturated photosynthesis. New Phytol. 210 (3), 1130–1144. doi: 10.1111/nph.13815
Deans, R. M., Farquhar, G. D., Busch, F. A. (2019). Estimating stomatal and biochemical limitations during photosynthetic induction. Plant Cell Environ. 42 (12), 3227–3240. doi: 10.1111/pce.13622
Drake, P. L., Froend, R. H., Franks, P. J. (2013). Smaller, faster stomata: scaling of stomatal size, rate of response, and stomatal conductance. J. Exp. Bot. 64 (2), 495–505. doi: 10.1093/jxb/ers347
Dutta, S., Cruz, J. A., Jiao, Y., Chen, J., Kramer, D. M., Osteryoung, K. W. (2015). Non-invasive, whole-plant imaging of chloroplast movement and chlorophyll fluorescence reveals photosynthetic phenotypes independent of chloroplast photorelocation defects in chloroplast division mutants. Plant J. 84 (2), 428–442. doi: 10.1111/tpj.13009
Farquhar, G. D., von Caemmerer, S., Berry, J. A. (1980). A biochemical model of photosynthetic CO2 assimilation in leaves of C3 species. Planta 149, 78–90. doi: 10.1007/BF00386231
Fauset, S., Freitas, H. C., Galbraith, D. R., Sullivan, M. J. P., Aidar, M. P. M., Joly, C. A., et al. (2018). Differences in leaf thermoregulation and water use strategies between three co-occurring Atlantic forest tree species. Plant Cell Environ. 41 (7), 1618–1631. doi: 10.1111/pce.13208
Kaiser, E., Morales, A., Harbinson, J., Kromdijk, J., Heuvelink, E., Marcelis, L. F. (2015). Dynamic photosynthesis in different environmental conditions. J. Exp. Bot. 66 (9), 2415–2426. doi: 10.1093/jxb/eru406
Kaiser, E., Kromdijk, J., Harbinson, J., Heuvelink, E., Marcelis, L. F. (2017). Photosynthetic induction and its diffusional, carboxylation and electron transport processes as affected by CO2 partial pressure, temperature, air humidity and blue irradiance. Ann. Bot. 119 (1), 191–205. doi: 10.1093/aob/mcw226
Kalaji, H. M., Schansker, G., Brestic, M., Bussotti, F., Calatayud, A., Ferroni, L., et al. (2017). Frequently asked questions about chlorophyll fluorescence, the sequel. Photosynth. Res. 132 (1), 13–66. doi: 10.1007/s11120-016-0318-y
Leakey, A. D., Press, M. C., Scholes, J. D. (2003). High-temperature inhibition of photosynthesis is greater under sunflecks than uniform irradiance in a tropical rain forest tree seedling. Plant Cell Environ. 26, 1681–1690. doi: 10.1046/j.1365-3040.2003.01086.x
Mailly, D., Turbis, S., Chazdon, R. L. (2013). solarcalc 7.0: An enhanced version of a program for the analysis of hemispherical canopy photographs. Comput. Electron. Agric. 97, 15–20. doi: 10.1016/j.compag.2013.06.004
Mekala, N. R., Suorsa, M., Rantala, M., Aro, E. M., Tikkanen, M. (2015). Plants Actively Avoid State Transitions upon Changes in Light Intensity: Role of Light-Harvesting Complex II Protein Dephosphorylation in High Light. Plant Physiol. 168 (2), 721–734. doi: 10.1104/pp.15.00488
Morales, A., Kaiser, E., Yin, X., Harbinson, J., Molenaar, J., Driever, S. M., et al. (2018). Dynamic modelling of limitations on improving leaf CO2 assimilation under fluctuating irradiance. Plant Cell Environ. 41 (3), 589–604. doi: 10.1111/pce.13119
Mott, K. A., Woodrow, I. E. (1993). Effects of O2 and CO2 on nonsteady-state photosynthesis. Further evidence for ribulose-l,5-bisphosphate carboxylase/oxygenase limitation. Plant Physiol. 102, 859–866. doi: 10.1104/pp.102.3.859
Naumburg, E., Ellsworth, D. S. (2000). Photosynthetic sunfleck utilization potential of understory saplings growing under elevated CO2 in FACE. Oecologia 122, 163–174. doi: 10.1007/PL00008844
Pearcy, R. W. (1983). The light environment and growth of C3 and C4 tree species in the understory of a Hawaiian forest. Oecologia 58, 19–25. doi: 10.1007/BF00384537
Pearcy, R. W. (1990). Sunflecks and photosynthesis in plant canopies. Annu. Rev. Plant Physiol. Plant Mol. Biol. 41, 421–453. doi: 10.1146/annurev.pp.41.060190.002225
R Core Team. (2018). R: A language and environment for statistical computing. (Vienna, Austria: R Foundation). https://www.r-project.org/
Rijkers, T., de Vries, P. J., Pons, T. L., Bongers, F. (2000). Photosynthetic induction in saplings of three shade-tolerant tree species: comparing understorey and gap habitats in a French Guiana rain forest. Oecologia 125 (3), 331–340. doi: 10.1007/s004420000459
Salter, W. T., Merchant, A. M., Richards, R. A., Trethowan, R., Buckley, T. N. (2019). Rate of photosynthetic induction in fluctuating light varies widely among genotypes of wheat. J. Exp. Bot. 70 (10), 2787–2796. doi: 10.1093/jxb/erz100
Sassenrath-Cole, G. F., Pearcy, R. W. (1992). The role of Ribulose-1,5-Bisphosphate regeneration in the induction requirement of photosynthetic CO2 exchange under transient light conditions. Plant Physiol. 99, 227–234. doi: 10.1104/pp.99.1.227
Scafaro, A. P., Galle, A., Van Rie, J., Carmo-Silva, E., Salvucci, M. E., Atwell, B. J. (2016). Heat tolerance in a wild Oryza species is attributed to maintenance of Rubisco activation by a thermally stable Rubisco activase ortholog. New Phytol. 211 (3), 899–911. doi: 10.1111/nph.13963
Singsaas, E. L., Sharkey, T. D. (1998). The regulation of isoprene emission responses to rapid leaf temperature fluctuations. Plant Cell Environ. 21, 1181–1188. doi: 10.1046/j.1365-3040.1998.00380.x
Slot, M., Winter, K. (2017a). In situ temperature relationships of biochemical and stomatal controls of photosynthesis in four lowland tropical tree species. Plant Cell Environ. 40 (12), 3055–3068. doi: 10.1111/pce.13071
Slot, M., Winter, K. (2017b). Photosynthetic acclimation to warming in tropical forest tree seedlings. J. Exp. Bot. 68 (9), 2275–2284. doi: 10.1093/jxb/erx071
Slot, M., Garcia, M. N., Winter, K. (2016). Temperature response of CO2 exchange in three tropical tree species. Funct. Plant Biol. 43 (5), 468-478. doi: 10.1071/fp15320
Soleh, M. A., Tanaka, Y., Nomoto, Y., Iwahashi, Y., Nakashima, K., Fukuda, Y., et al. (2016). Factors underlying genotypic differences in the induction of photosynthesis in soybean [Glycine max (L.) Merr]. Plant Cell Environ. 39 (3), 685–693. doi: 10.1111/pce.12674
Tang, Y. H., Kachi, N., Furukawa, A., Awang, M. B. (1999). Heterogeneity of light availability and its effects on simulated carbon gain of tree leaves in a small gap and the understory in a tropical rain forest. Biotropica 31 (2), 268–278. doi: 10.1111/j.1744-7429.1999.tb00138.x
Tani, M., Nik, A. R., Ohtani, Y., Yasuda, Y., Sahat, M. M., Kasran, B., et al. (2003a). “Characteristics of energy exchanges and surface conductance of a tropical rain forest in Peninsular Malaysia,” in Pasoh: Ecology of a Lowland Rain Forest in Southeast Asia. Eds. Okuda, T., Manokaran, N., Matsumoto, Y., Niiyama, K., Thomas, S. C., Ashton, P. S. (Tokyo, Japan: Springer), 73–89.
Tani, M., Nik, A. R., Yasuda, Y., Noguchi, S., Shamsuddin, S. A., Sahat, M. M., et al. (2003b). “Long-term estimation of evapotranspiration from a tropical rain forest in Peninsular Malaysia,” in Water Resource Systems - Water Availablity and Global Change. Eds. S. Franks, G. Bloschl, M. Kumagai, K. Musiake and D. Rosbjerg (IAHS Publication), 280, 267–274.
Taylor, S. H., Long, S. P. (2017). Slow induction of photosynthesis on shade to sun transitions in wheat may cost at least 21% of productivity. Philos. Trans. R. Soc. B: Biol. Sci. 372 (1730), 1–9. doi: 10.1098/rstb.2016.0543
Thomas, S. C., Noor, N. S. M., Mansor, M., Nadarajan, J., Cheng, K. A., Ishida, A., et al. (2003). Part III. Plant population and functional biology (Tokyo: Springer-Verlag).
Tinoco-Ojanguren, C., Pearcy, R. W. (1993). Stomatal dynamics and its importance to carbon gain in two rainforest Piper species I. VPD effects on the transient stomatal response to lightflecks. Oecologia 94, 388–394. doi: 10.1007/BF00317115
Tomimatsu, H., Tang, Y. (2016). Effects of high CO2 levels on dynamic photosynthesis: carbon gain, mechanisms, and environmental interactions. J. Plant Res. 129 (3), 365–377. doi: 10.1007/s10265-016-0817-0
Tomimatsu, H., Sakata, T., Fukayama, H., Tang, Y. (2019). Short-term effects of high CO2 accelerate photosynthetic induction in Populus koreana x trichocarpa with always-open stomata regardless of phenotypic changes in high CO2 growth conditions. Tree Physiol. 39 (3), 474–483. doi: 10.1093/treephys/tpy078
Urban, O., Košvancová, M., Marek, M. V., Lichtenthaler, H. K. (2007). Induction of photosynthesis and importance of limitations during the induction phase in sun and shade leaves of five ecologically contrasting tree species from the temperate zone. Tree Physiol. 27, 1207–1215. doi: 10.1093/treephys/27.8.1207
Urban, J., Ingwers, M. W., McGuire, M. A., Teskey, R. O. (2017). Increase in leaf temperature opens stomata and decouples net photosynthesis from stomatal conductance in Pinus taeda and Populus deltoides x nigra. J. Exp. Bot. 68 (7), 1757–1767. doi: 10.1093/jxb/erx052
Vanderwel, M. C., Slot, M., Lichstein, J. W., Reich, P. B., Kattge, J., Atkin, O. K., et al. (2015). Global convergence in leaf respiration from estimates of thermal acclimation across time and space. New Phytol. 207 (4), 1026–1037. doi: 10.1111/nph.13417
Wachendorf, M., Küppers, M. (2017). Effects of leaf temperature on initial stomatal opening and their roles in overall and biochemical photosynthetic induction. Trees 31 (5), 1667–1681. doi: 10.1007/s00468-017-1577-8
Way, D. A., Pearcy, R. W. (2012). Sunflecks in trees and forests: from photosynthetic physiology to global change biology. Tree Physiol. 32 (9), 1066–1081. doi: 10.1093/treephys/tps064
Way, D. A., Aspinwall, M. J., Drake, J. E., Crous, K. Y., Campany, C. E., Ghannoum, O., et al. (2019). Responses of respiration in the light to warming in field-grown trees: a comparison of the thermal sensitivity of the Kok and Laisk methods. New Phytol. 222 (1), 132–143. doi: 10.1111/nph.15566
Wise, R. R., Olson, A. J., Schrader, S. M., Sharkey, T. D. (2004). Electron transport is the functional limitation of photosynthesis in field-grown Pima cotton plants at high temperature. Plant Cell Environ. 27, 717–724. doi: 10.1111/j.1365-3040.2004.01171.x
Woodrow, I. E., Mott, K. A. (1989). Rate limitation of non-steady-state photosynthesis by ribulose-1,5-bisphosphate carboxylase in spinach. Aust. J. Plant Physiol. 16, 487–500. doi: 10.1071/PP9890487
Woodrow, I. E., Kelly, C. K., Mott, K. A. (1996). Limitation of the rate of ribulosebisphosphate carboxylase activation by carbamylation and ribulosebisphosphate carboxylase activase activity: development and tests of a mechanistic model. Aust. J. Plant Physiol. 23, 141–149. doi: 10.1071/PP9960141
Yamori, W., Suzuki, K., Noguchi, K. O., Nakai, M., Terashima, I. (2006). Effects of Rubisco kinetics and Rubisco activation state on the temperature dependence of the photosynthetic rate in spinach leaves from contrasting growth temperatures. Plant Cell Environ. 29 (8), 1659–1670. doi: 10.1111/j.1365-3040.2006.01550.x
Yamori, W., Masumoto, C., Fukayama, H., Makino, A. (2012). Rubisco activase is a key regulator of non-steady-state photosynthesis at any leaf temperature and, to a lesser extent, of steady-state photosynthesis at high temperature. Plant J. 71 (6), 871–880. doi: 10.1111/j.1365-313X.2012.05041.x
Yamori, W., Kusumi, K., Iba, K., Terashima, I. (2020). Increased stomatal conductance induces rapid changes to photosynthetic rate in response to naturally fluctuating light conditions in rice. Plant Cell Environ. 43, 1230–1240. doi: 10.1111/pce.13725
Keywords: dynamic photosynthesis, photosynthetic induction, Rubisco, shade tolerance, sunflecks, temperature
Citation: Kang H-X, Zhu X-G, Yamori W and Tang Y-H (2020) Concurrent Increases in Leaf Temperature With Light Accelerate Photosynthetic Induction in Tropical Tree Seedlings. Front. Plant Sci. 11:1216. doi: 10.3389/fpls.2020.01216
Received: 04 June 2020; Accepted: 27 July 2020;
Published: 07 August 2020.
Edited by:
Jeremy Harbinson, Wageningen University and Research, NetherlandsReviewed by:
Elias Kaiser, Wageningen University and Research, NetherlandsTao Li, Institute of Environment and Sustainable Development in Agriculture (CAAS), China
Copyright © 2020 Kang, Zhu, Yamori and Tang. This is an open-access article distributed under the terms of the Creative Commons Attribution License (CC BY). The use, distribution or reproduction in other forums is permitted, provided the original author(s) and the copyright owner(s) are credited and that the original publication in this journal is cited, in accordance with accepted academic practice. No use, distribution or reproduction is permitted which does not comply with these terms.
*Correspondence: Yan-Hong Tang, tangyh@pku.edu.cn