Article

Experimental Study of the Effect of Hydrotreated Vegetable Oil and Oxymethylene Ethers on Main Spray and Combustion Characteristics under Engine Combustion Network Spray A Conditions

by
José V. Pastor
1,
José M. García-Oliver
1,
Carlos Micó
1,*,
Alba A. García-Carrero
1 and
Arantzazu Gómez
2
1
CMT–Motores Térmicos/Universitat Politècnica de València, Camino de Vera s/n. 46022 Valencia, Spain
2
Universidad de Castilla-La Mancha, Campus de Excelencia Internacional en Energía y Medioambiente, Escuela de Ingeniería Industrial y Aeroespacial de Toledo, Real Fábrica de Armas. Edificio Sabatini. Av. Carlos III, s/n, 45071 Toledo, Spain
*
Author to whom correspondence should be addressed.
Appl. Sci. 2020, 10(16), 5460; https://doi.org/10.3390/app10165460
Submission received: 14 July 2020 / Revised: 31 July 2020 / Accepted: 2 August 2020 / Published: 7 August 2020

Abstract

:

Featured Application

This work contributes to the understanding of the macroscopic characteristics of the spray as well as to the evolution of the combustion process for alternative fuels. All these fuels have been studied under the same operating conditions than diesel therefore the comparison can be made directly, leaving in evidence that some fuels can achieve a similar behavior to diesel in terms of auto ignition but avoiding one of the biggest disadvantages of diesel such as the soot formation. Moreover, the quantification of characteristic parameters such as ignition delay, liquid length, vapor penetration and flame lift-off length represent the most important data to adjust and subsequently validate the computational models that simulate the spray evolution and combustion development of these alternative fuels inside the combustion chamber.

Abstract

The stringent emission regulations have motivated the development of cleaner fuels as diesel surrogates. However, their different physical-chemical properties make the study of their behavior in compression ignition engines essential. In this sense, optical techniques are a very effective tool for determining the spray evolution and combustion characteristics occurring in the combustion chamber. In this work, quantitative parameters describing the evolution of diesel-like sprays such as liquid length, spray penetration, ignition delay, lift-off length and flame penetration as well as the soot formation were tested in a constant high pressure and high temperature installation using schlieren, OH∗ chemiluminescence and diffused back-illumination extinction imaging techniques. Boundary conditions such as rail pressure, chamber density and temperature were defined using guidelines from the Engine Combustion Network (ECN). Two paraffinic fuels (dodecane and a renewable hydrotreated vegetable oil (HVO)) and two oxygenated fuels (methylal identified as OME1 and a blend of oxymethylene ethers, identified as OMEx) were tested and compared to a conventional diesel fuel used as reference. Results showed that paraffinic fuels and OMEx sprays have similar behavior in terms of global combustion metrics. In the case of OME1, a shorter liquid length, but longer ignition delay time and flame lift-off length were observed. However, in terms of soot formation, a big difference between paraffinic and oxygenated fuels could be appreciated. While paraffinic fuels did not show any significant decrease of soot formation when compared to diesel fuel, soot formed by OME1 and OMEx was below the detection threshold in all tested conditions.

1. Introduction

Pollutant emission regulations are becoming more stringent every year and strategies to reduce them in compression ignition (CI) engines are being constantly investigated. Among them, active and passive solutions can be found. These latter strategies or after-treatment systems, such as diesel particle filters (DPF), catalytic oxidizers and selective catalytic reduction systems (SCR), are focused on retaining the pollutant emissions prior being expelled through the tail pipe [1]. However, the efficiency and life cycle of the after-treatment systems are deeply related to the fuel behavior inside the combustion chamber. In this sense, active strategies to avoid pollutant formation, as the redesign of the combustion chamber or the study of new combustion concepts [2], the improvement of the mixing formation and injection systems [3], the study of new exhaust gas recirculation schemes as well as the development of cleaner alternative fuels, have great interest and importance to the automotive manufacturers [4].
Biodiesel is the most used biofuel in conventional compression ignition engines because of its potential for reducing the particulate matter due to its oxygenated nature without aromatic compounds [5]. However, lower heating value and higher viscosity, as well as a negative effect on nitrogen oxides (NOx) are important drawbacks compared to conventional diesel fuel [6,7]. These have promoted the study of more appropriate alternative fuels. Among them, hydrotreated vegetable oil (HVO), gas-to-liquid (GTL) and new oxygenated fuels like the oxymethylene ethers with the general structure CH3–O–(CH2–O)n–CH3, are the most promising alternatives to replace conventional diesel [8,9,10].
HVO and GTL are paraffinic fuels without oxygen on their composition and similar chain length. They are obtained by a hydrotreatment of vegetable oils at controlled temperature or by a Fischer-Tropsch process of natural gas or gasified biomass, respectively. Due to their analogous molecular structure, their physical-chemical properties are also similar. However, while viscosity and heating value are comparable to conventional diesel fuel, their higher cetane number, lower cold filter plugging point (CFPP) and the absence of aromatic compounds make these paraffinic fuels very attractive. Moreover, several studies in CI engines agree on their potential for reducing the particulate matter in the exhaust without NOx penalization [11,12,13].
Just as HVO or GTL, OMEx presents a molecular structure without double bonds and can be generated from methanol or formaldehyde by a synthetic process that consumes CO2 and water [14]. Depending on the chain length their physical-chemical properties differ, increasing the density, viscosity, oxygen content and cetane number as carbon number increases from 1 to 5 [15]. Although with different molecular structure, HVO and OMEx coincide in their higher cetane number and exhaust emissions benefits, even better than paraffinic fuels in terms of soot emissions [16]. However, the low viscosity and boiling point of the simplest OME (methylal, usually called OME1) limits its use in diesel engines without injection system and storage modifications [15,17].
Even though, these alternative fuels have proved to be environmentally friendly, the study of their spray characteristics and combustion behavior is of importance for a complete understanding of their effects on the exhaust emissions [18]. In this sense, optical techniques are very helpful and effective tools to evaluate combustion progress and soot formation and oxidation [7,19]. Therefore, in this work, an exhaustive study of spray and combustion behavior of alternative fuels has been carried out in a high pressure and high temperature combustion chamber under diesel-like conditions.
The objective of this study was to define the differences on combustion behavior of four alternative fuels in comparison to conventional diesel fuel: on the one hand, dodecane and HVO with paraffinic structures and, on the other hand, OME1 and OMEx as oxygenated fuels. The experiments were carried out under an operating condition known as “Spray A conditions” settled as standard by the Engine Combustion Network (ECN) [20]. Experimental data about the fundamental behavior of these fuels under these conditions is a novelty of this study, due to the lack of this type of information in the current literature.
Quantitative parameters describing the evolution of diesel-like sprays such as liquid length, spray penetration, ignition delay, lift-off length and flame length as well as the soot formation were determined using schlieren, OH* chemiluminescence and diffused back-illumination extinction high-speed imaging techniques. The results can provide a useful information to better understanding of factors that dominate the combustion of these alternative fuels and therefore contributing to the upgrade of combustion models. Furthermore, the results will expand the database available in the ECN [20].

2. Experimental and Theoretical Tools

2.1. High Pressure and High Temperature Rig

The experiments were carried out in a high pressure and high temperature (HPHT) rig. Parameters such as the composition of the gas, the pressure and the temperature of the ambient gas can be controlled independently to obtain oxygen concentration between 0 and 21%, pressures up to 15 MPa and temperatures up to 1100 K. Thereby, it is possible to replicate the thermodynamic conditions of the cylinder of an internal combustion engine when the fuel is injected. Furthermore, as the temperature field is homogeneous and constant in the area of interest, this reduces the uncertainties that could be associated to engine transients. The HPHT rig has wide optical accesses, which allow the application of different visualization techniques. The installation can operate as an open circuit with air or, in order to reduce O2 concentration, as a closed loop circuit with a mixture of air and Nitrogen. The regulation and control system ensures steady thermodynamic conditions during long time periods with the aim of getting reliable statistical results of many injections and combustion events. Additionally, one injection is performed every 4 s to avoid any temperature transients. The boundary conditions have been detailed widely in [21] where a full description of the facility is given.
The common-rail used is capable to achieve injection pressures up to 230 MPa and is equipped with a solenoid-activated single-hole nozzle injector. It is worth mentioning that the injection system pump used is made by polymerizing tetrafluoroethylene material. This material has shown compatibility with oxymethylene ether fuels according to the investigation reported in [22].

2.2. Fuel and Test Matrix

2.2.1. Fuel Description and Properties

A set of two different groups of pure alternative fuels were tested and compared to a low sulfur diesel fuel without biodiesel, which was used as reference. First, two paraffinic fuels with different molecular structure: a renewable hydrotreated vegetable oil (HVO) and a single component n-paraffinic fuel (dodecane) were tested. The last is used as standard surrogate for diesel by the engine combustion network (ECN) [20] and, in this work, dodecane is tested to compare the results with ECN database and validate the current experiments. Then, two oxymethylene ethers, with the general structure CH3–O–(CH2–O)n–CH3 were tested under the same thermodynamic conditions as HVO and dodecane. The first one was a single component one corresponding to the shortest carbon chain (n = 1) of the family, which will be denoted here as OME1. The second one is a multi-component fuel, which will be denoted here as OMEx, which is a blend of components of different chain lengths. Table 1 compiles the main properties for all five fuels and Table 2 shows the OMEx actual composition.

2.2.2. Operating Conditions

For the five tested fuels, a set of parametric studies was performed. Oxygen concentration, ambient temperature and injection pressure were defined as variables. Table 3 shows the test matrix.
The nominal condition is based on Spray A specification from the ECN [20]. It corresponds to 900 K as ambient temperature, 15% of oxygen concentration and 1500 bar as injection pressure and air density of 22.8 kg/m3. The whole test matrix is shown in Table 3.
A single-hole nozzle was used, which has been extensively studied in previous ECN studies [23,24]. The injector serial number is 210,675, with an actual nozzle diameter of 89.4 µm. A single injection was used as injection strategy. The energizing time was 2000 µs, which provides an injection event long enough to study the spray evolution and flame development under stabilized mixing-controlled combustion.

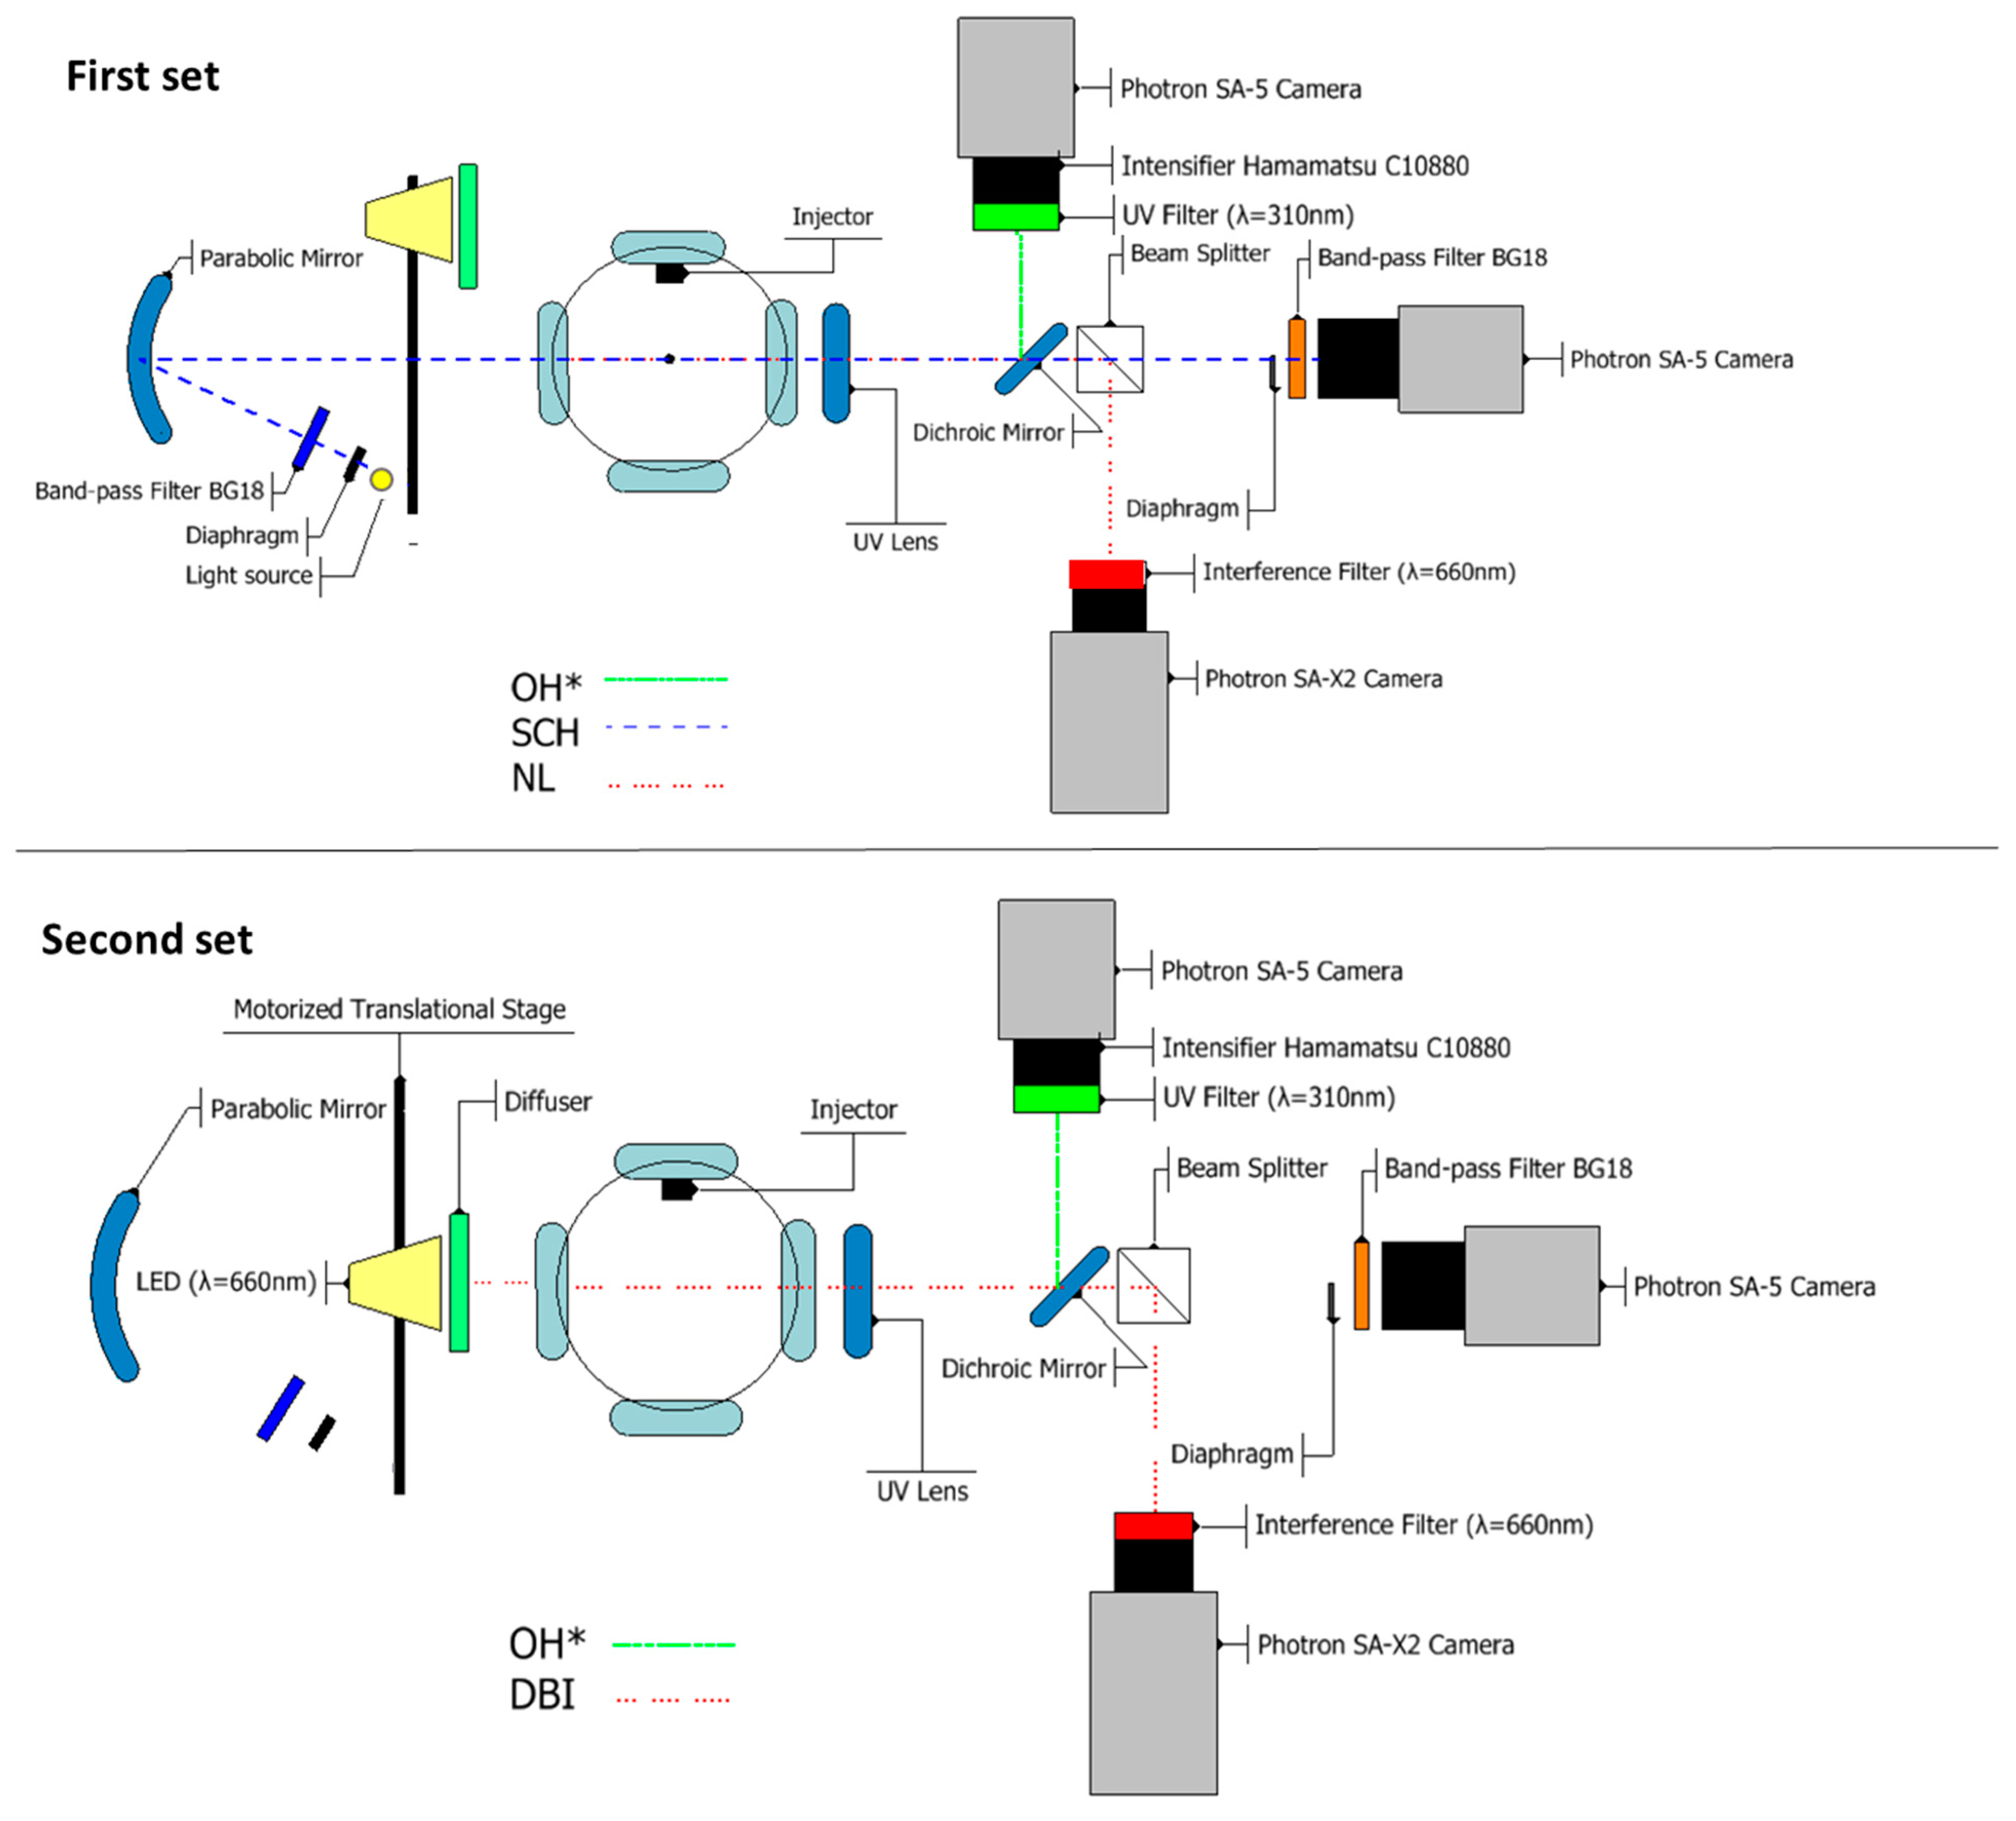
2.3. Diagnostic Techniques

Aiming to analyze the spray development, the ignition delay, the combustion behavior and the soot formation for each fuel, four visualization techniques have been implemented using the two opposed optical access windows in the installation. The measurements were carried out in two sets with the slightly different setups shown in Figure 1. The change from one setup to the other was made in few seconds, thanks to the use of an automated translational stage. Consequently, it can be assumed that measurements will all the techniques were performed nearly simultaneously for any given condition of the test matrix.
In the first set of measurements, the sketch shown at the top of Figure 1 was used for simultaneous recording of images from schlieren, and OH* chemiluminescence optical techniques. A minimum of 20 injection events were recorded with each camera in this first set of measurements. Immediately after recording and saving these images for each operating conditions, an illumination device based on LEDs was placed in front of the vessel’s window in the illumination side using a motorized translational stage (sketch at the bottom of Figure 1). Then, in this second set, images from OH* chemiluminescence and diffused back illumination (DBI) optical technique were recorded for 100 injections in the nominal case and 40 injections for the other operating conditions. The OH* images were recorded in both cases and these results were used to verify consistency between both measurement sets.
The configuration used for the application of each optical technique will be described below.

2.3.1. Schlieren Imaging

The schlieren technique is based on the fact that when a light ray travels through a medium with refractive index gradients, it suffers a deflection due to the refraction phenomenon [25]. Accordingly, any variations of refractive index such as those produced by density variations at the injection of fuel can be recorded as different gray levels in an image. Consequently, this technique allows to observe the local density variations that the fuel air mixing, auto ignition or flame development provoke. In this experiments, a high-speed single-pass schlieren imaging configuration was implemented to visualize the spray and flame boundaries at any operating conditions, with an optical arrangement similar as that described in [26].
On the illumination side, light from a xenon lamp is driven with a liquid light guide into an iris diaphragm, to generate a point light source at the focal length plane of a parabolic mirror (f = 610 mm, D = 150 mm) so that the measurement area is illuminated with a collimated beam. In addition, to avoid interference and restrict the spectrum of the xenon lamp in the DBI and NL images commented later, a BG18 band pass filter was used. On the other side of the chamber, a spherical lens (f = 750 mm) was placed very close to optical access. This lens focusses the light onto the Fourier plane where an iris diaphragm with a cut-off diameter of around 3 mm was located. Additionally, another BG18 band pass filter was placed just before the Photron Fastcam SA-5 camera (Photron, San Diego, CA, USA) to minimize undesired light from sources other than the schlieren illumination lamp. The camera was equipped with a Carl Zeiss Makro-Planar T 100 mm f/2 ZF2 camera lens (Carl Zeiss, Aalen, Germany). Images were recorded at 25 kfps. The shutter time was 4.24 µs and it was kept constant throughout all the experiments. The resolution was 800 × 320 pixel with a total magnification of 6.9 pixel/mm. 20 injection cycles per test were recorded in all cases. The schlieren images have been used to describe the spray tip penetration under nonreactive, as well as the penetration under reactive conditions and the ignition delay. Image segmentation from the background has been performed by using the standard methodology developed by ECN [20].
In this paper, ignition delay (ID) is obtained from schlieren images as the time at which the derivative of the accumulated pixel intensity within the spray boundaries is 50% of range between the minimum and maximum ones. This criterion was defined and explained in [27].

2.3.2. High-Speed OH* Chemiluminescence (OH*) Imaging

Excited hydroxyl radicals (OH*) are good tracers of high temperature combustion regions in a flame [28]; therefore, visualization of OH* chemiluminescence at the base of the flame allows to quantifying the lift-off length (LOL). Moreover, if an intensified high-speed camera is used, the ID can be measured too. In these experiments, a high-speed image intensifier (Hamamatsu C10880 by Hamamatsu, Hamamatsu city, Japan) was used, with gain set between 700 and 850 depending on fuel and operating condition. It was coupled to a Photron Fastcam SA5 camera with a 1:1 relay lens. The system was equipped with a UV f/4 100mm focal length lens. An interference filter centered at 310 nm (10 nm FWHM) was placed in front of the camera to remove most of the radiation of the flame while keeping OH* chemiluminescence. As shown in Figure 1, a dichroic mirror, which reflects UV spectrum and transmit the visible light spectrum, is used to reflect the UV flame radiation to the intensified camera.
Images were taken at 25 kfps. The resolution was 704 × 416 pixels and the magnification was 5.43 pixel/ mm. The shutter time was adapted between 19.97 µs and 39.75 µs to accommodate the camera dynamic range to the flame radiation intensity as a function of the fuel and operating condition. Again, 20 injection cycles per test were recorded in any case. ID was obtained determining the first frame with detectable light intensity, and it was used as a check on the results obtained with the schlieren technique.
The algorithm used to obtain the LOL is based on the procedure described in [29] and recommended by the engine combustion network (ECN). Thus, the LOL was as the distance between the injector tip and the first axial locations above and below the spray centerline with intensity greater than 50% of the intensity peak of that zone.

2.3.3. Diffused Back Illumination (DBI) Extinction Imaging

Diffused back-illumination (DBI) is a technique based on measuring the amount of light attenuated by liquid droplets or by soot particles within the flame, which is related to the liquid and soot concentration, respectively. A red LED (λ = 660 nm) was used in these experiments as the light source to create short flashes synchronized with the camera frames. An engineered diffuser (EDC-20 by RPC Photonics, Henrietta, NY, USA) was placed in front of the LED to create a diffused Lambertian intensity profile [30]. On the collection side, the transmitted light from the LED and the flame radiation went through a beam splitter with a 50% reflection rate. Then, half of the light was collected by the Photron SA-X2 camera. The exposure time was 1 µs and the resolution was 896x384 with a magnification of 6.85 pixel/mm. The sampling frequency was 25 kfps.
The images taken were analyzed considering that the total light registered by the camera has two contributions: the transmitted LED light intensity and the flame radiation. Due to the use of a bandpass filter centered at 660 nm (FWHM = 10 nm), the crosstalk of flame radiation into the DBI signal is minimized. However, the flashing frequency of the LED was set as quarter of the camera frame rate to capture a LED image between every three consecutive dark images. This configuration was used to deal with the non-ideal CMOS sensor behavior, that occurs when the camera is exposed to a sudden change in light intensity between two consecutive frames [18]. The flame luminosity from dark image before the LED image (third dark image) was quantified and used to isolate the transmitted LED light from the total registered radiation. Then, the light attenuation can be related with the optical properties of the soot cloud by means of Lambert-Beer’s law, as described in Equation (1):
I o n I o f f I o = e K L                
where I o n is the light intensity recorded by the camera when the LED is on, i.e., the sum of the transmitted LED intensity and the flame luminosity. I o f f     is the intensity of the flame acquired when the LED is off. I O     is the LED light intensity obtained from images recorded before the start of injection (SOI). K is the soot dimensional extinction coefficient and L is the light beam path length through the soot cloud. Thus, the product KL represents the integral value of the soot extinction coefficient along the light path, which is related with the soot concentration [24].
Besides determining soot production through the KL factor, DBI is also suggested as an experimental standard to measure the liquid length (LL) of fuels by ECN [20]. The method uses the extinction produced by the spray droplets to provide a quantitative parameter related to the liquid volume fraction along the path of the light. ECN recommends also taking care with vapor phase beam steering from temperature gradients, which could disturb the measurement. In the current work, the liquid length has been determined only at 800 K and 900 K. It was observed that at higher temperature the measurement is not reliable because the flame lift-off zone is close to the liquid jet zone and more intense beam steering exists there.
The image processing method to get KL was based on creating a mask from the dark image I o f f with the aim of collecting the information only corresponding to flame radiation. Based upon this mask, attenuation ( I o n I O f f ) is calculated, from which Equation (1) is applied. Figure 2 shows a KL profile along the spray axis at a time instant where the flame is well developed (3500 µs), within the quasi- steady period chosen in this study (between 3000 µs and 4000 µs). The confidence interval at 95% (red shadow) for the measurement of the ensemble averaged KL value and the standard deviation (blue shadow) have been represented. The operating condition shown is the nominal case and the fuel chosen is the diesel.
Similarly, the total soot mass ( s m a s s ) at a given time was determined from Equation (2) as the sum of the values of over all the pixels of the average image taken at that time, and corrected with the other factors indicated. In this equation, ρ s o o t corresponds to the soot density defined as 1.8 g/cm3 by Choi [31], λ is the wavelength used in the current work (660 nm), r is the pixel-mm ratio (6.85 in this work) and ke is the dimensionless extinction coefficient equal to 7.27 determined in this study through the ratio of scattering and absorption cross-sections which is used in small particle Mie theory:
s m a s s = K L · ρ s o o t · λ k e · r 2
In Figure 3 the temporal evolution of total soot mass for diesel at nominal condition is shown. The standard deviation (blue shadow) and confidence interval at 95% for the ensemble average soot mass value (red shadow) have been represented too. In the results section, these values will be shown for the other fuels and operating conditions tested.

3. Results and Discussion

Before entering the quantification and detailed analysis on the effect that fuel has upon the spray characteristics, the combustion process and soot formation, a comparison between results for the dodecane fuel from current study and from similar studies available in the ECN database [20] is presented. Table 4 summarizes the mean values obtained under the Spray A condition (15% of Oxygen concentration, 900 K of temperature and 1500 bar of injection pressure) by different research centers members of the ECN. It can be observed that results obtained for liquid length (LL), ignition delay (ID), and flame lift-off length (LOL) in this work are very close to those previously obtained. This makes possible to confirm the reliability of current results and extending the methods in the current work for the experiments with the other fuels tested.

3.1. Maximum Liquid Length
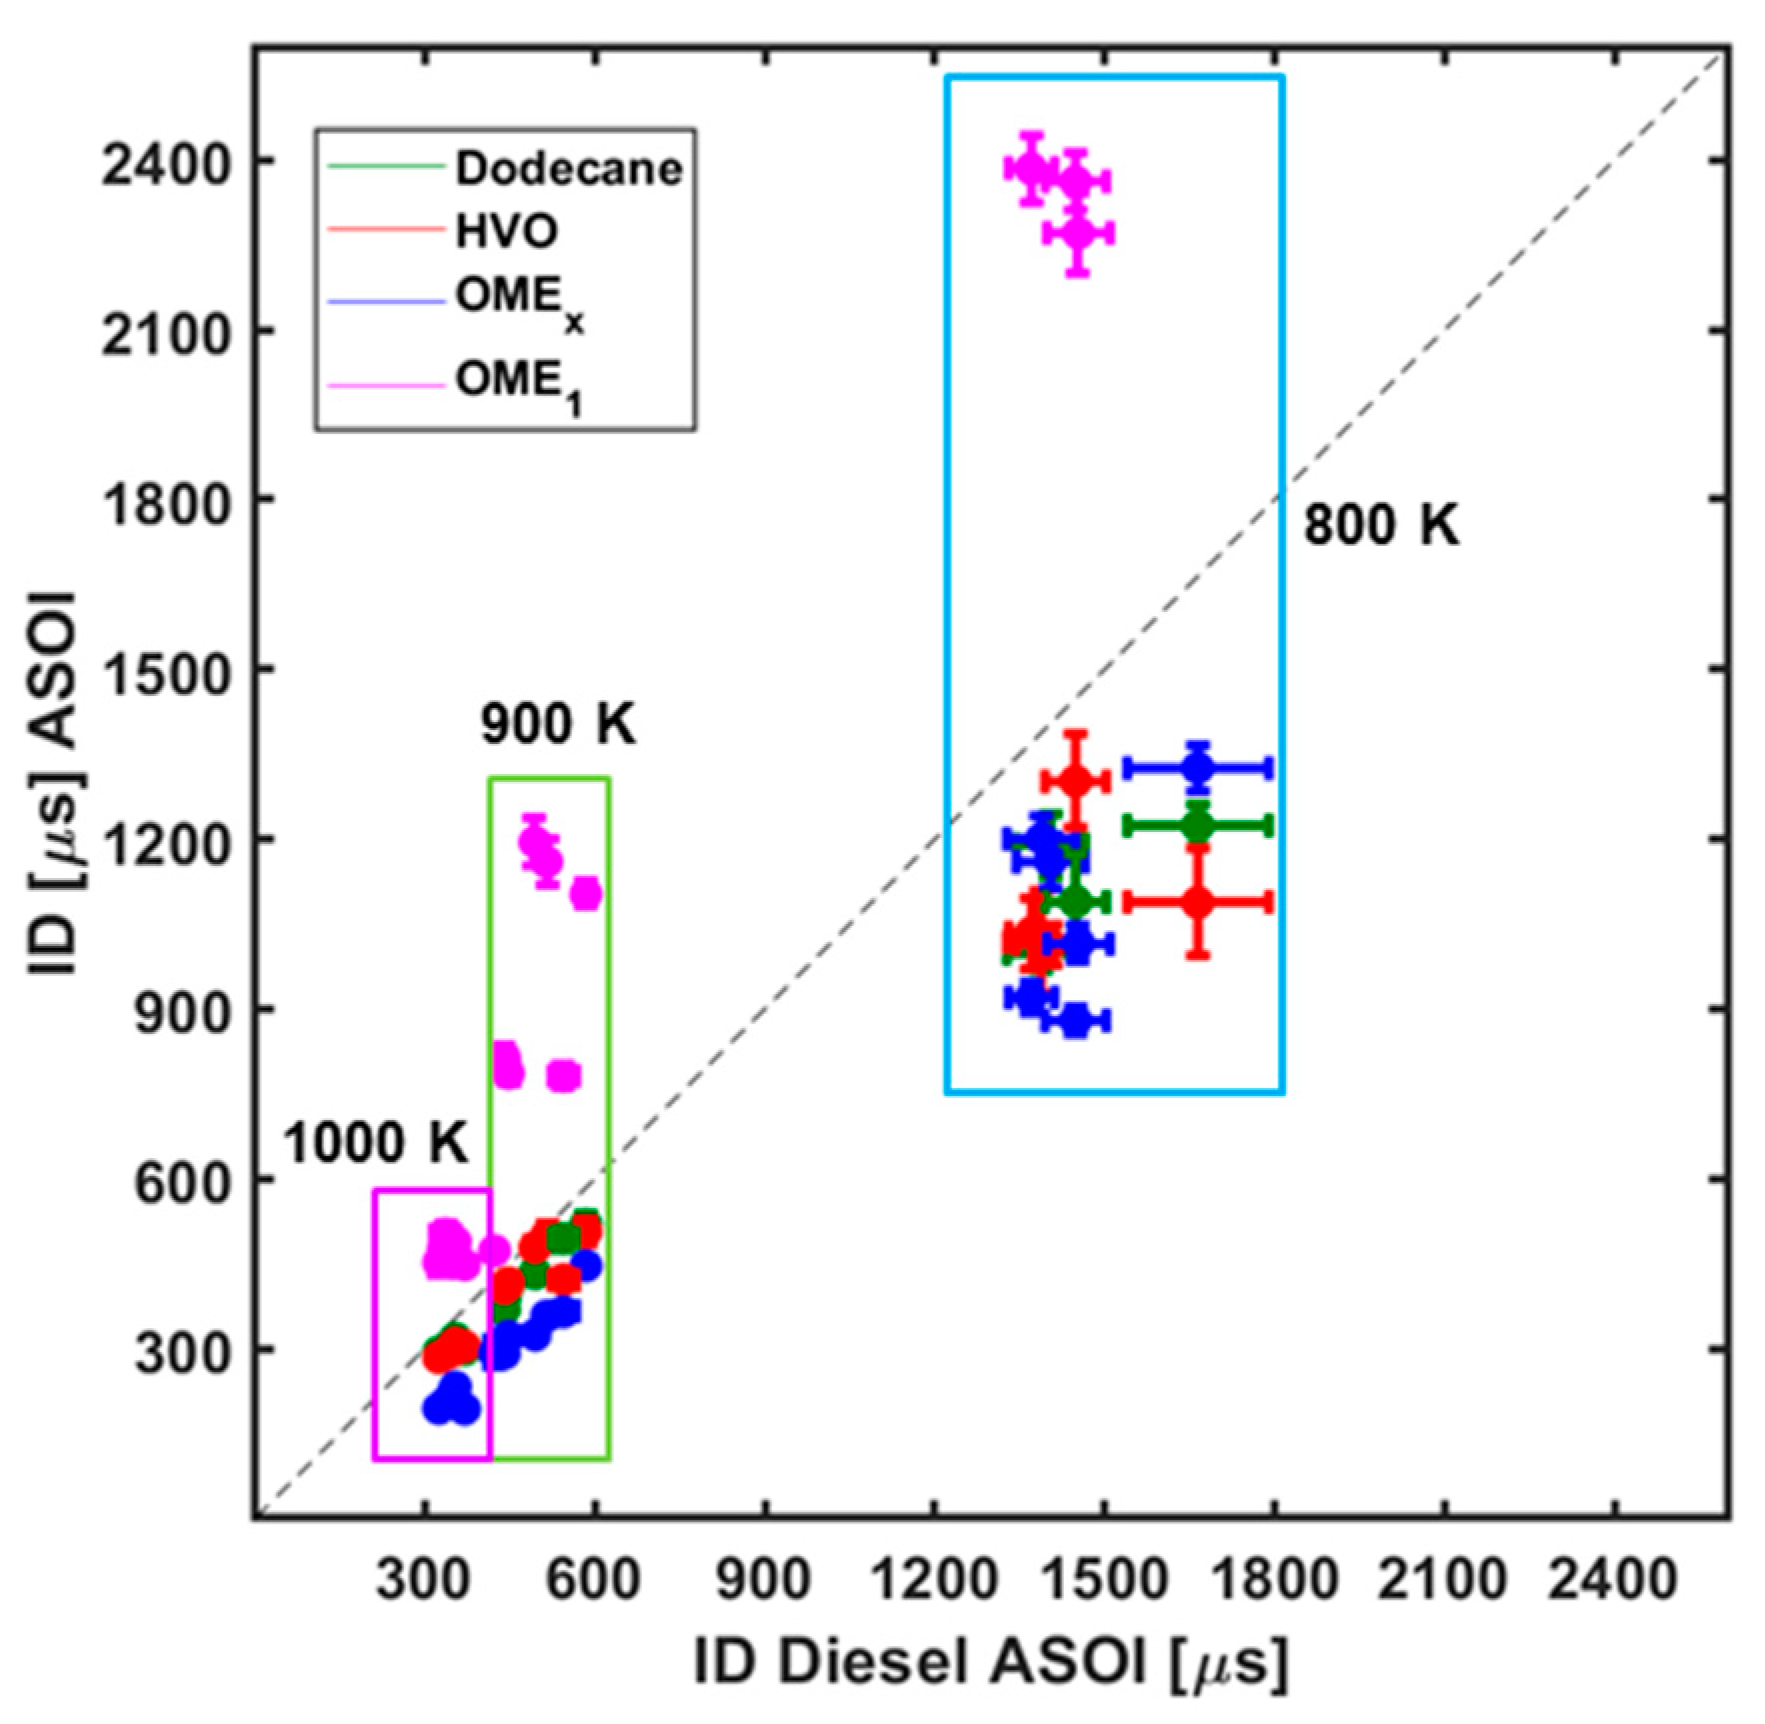
Spray liquid length is the maximum axial penetration of the liquid phase fuel. Previous studies have demonstrated that a shorter spray liquid length leads to a better air-fuel mixing, because the fuel vaporization is completed before the fuel reaches the combustion region [32]. On the other hand, too long liquid length leads to fuel wall impingement on the cylinder, which could produce large soot emission with reduced engine efficiency [33]. Figure 4 shows the liquid length (LL) at 800 K and 900 K for the tested fuels. The injection pressure is 1500 bar and the oxygen concentration is 15%. The LL is constant in time; therefore, the values correspond to an average between 800 µs and 4000 µs. From this figure, it can be seen that the spray liquid length of OME1 is shorter, which could be due to the lower distillation temperature of OME1 (37.40 °C) compared to the other fuels. Additionally, as Kook indicated in a previous study [34], low viscosities and high densities lead to shorter liquid lengths. This could explain why OMEx (υ = 1.082 mm2/s; ρ = 1057.1 kg/m3) shows shorter LL than diesel and HVO (υ = 2.7 mm2/s; ρ = 779.1 kg/m3).

3.2. Ignition Delay

Ignition delay (ID) is defined as the time elapsed from the start of injection (SOI) to the start of combustion. Figure 5 shows the ignition delay comparison obtained from schlieren technique and from OH* chemiluminescence imaging. It can be seen that ID values for both techniques are almost identical, therefore, any ID value used in the current work is valid. Hereafter, the represented ID values correspond to those from the schlieren technique.
In Figure 6, ID for dodecane, HVO, OMEx and OME1 have been compared against diesel. All the operation conditions have been presented with their standard deviation. The results attend to the trend found in previous studies [23,35]. When the air temperature, injection pressure, and ambient oxygen concentration are increased, the ID values decrease. It is a common behavior for all the tested fuels.
Furthermore, Figure 6 shows that dodecane, HVO, and OMEx ignite before diesel does. The three fuels have a higher cetane number than diesel (see Table 1), and the results confirm the relevance of this parameter on autoignition. Based on this, one could expect OMEx to ignite later than HVO and dodecane. However, its molecular structure has high oxygen content, which makes it more reactive. This explains that OMEx ignites earlier than HVO and dodecane, despite its lower cetane number. For OME1, although its molecular structure also contains oxygen, its cetane number is much lower when compared to the other fuels tested. Thus, it is the last one to ignite as shown in Figure 6. It is important to mention that the OME1 at 800 K and 15% of O2 does not ignite and at 21% of O2, the ignition occurs very late (around 2400 µs).

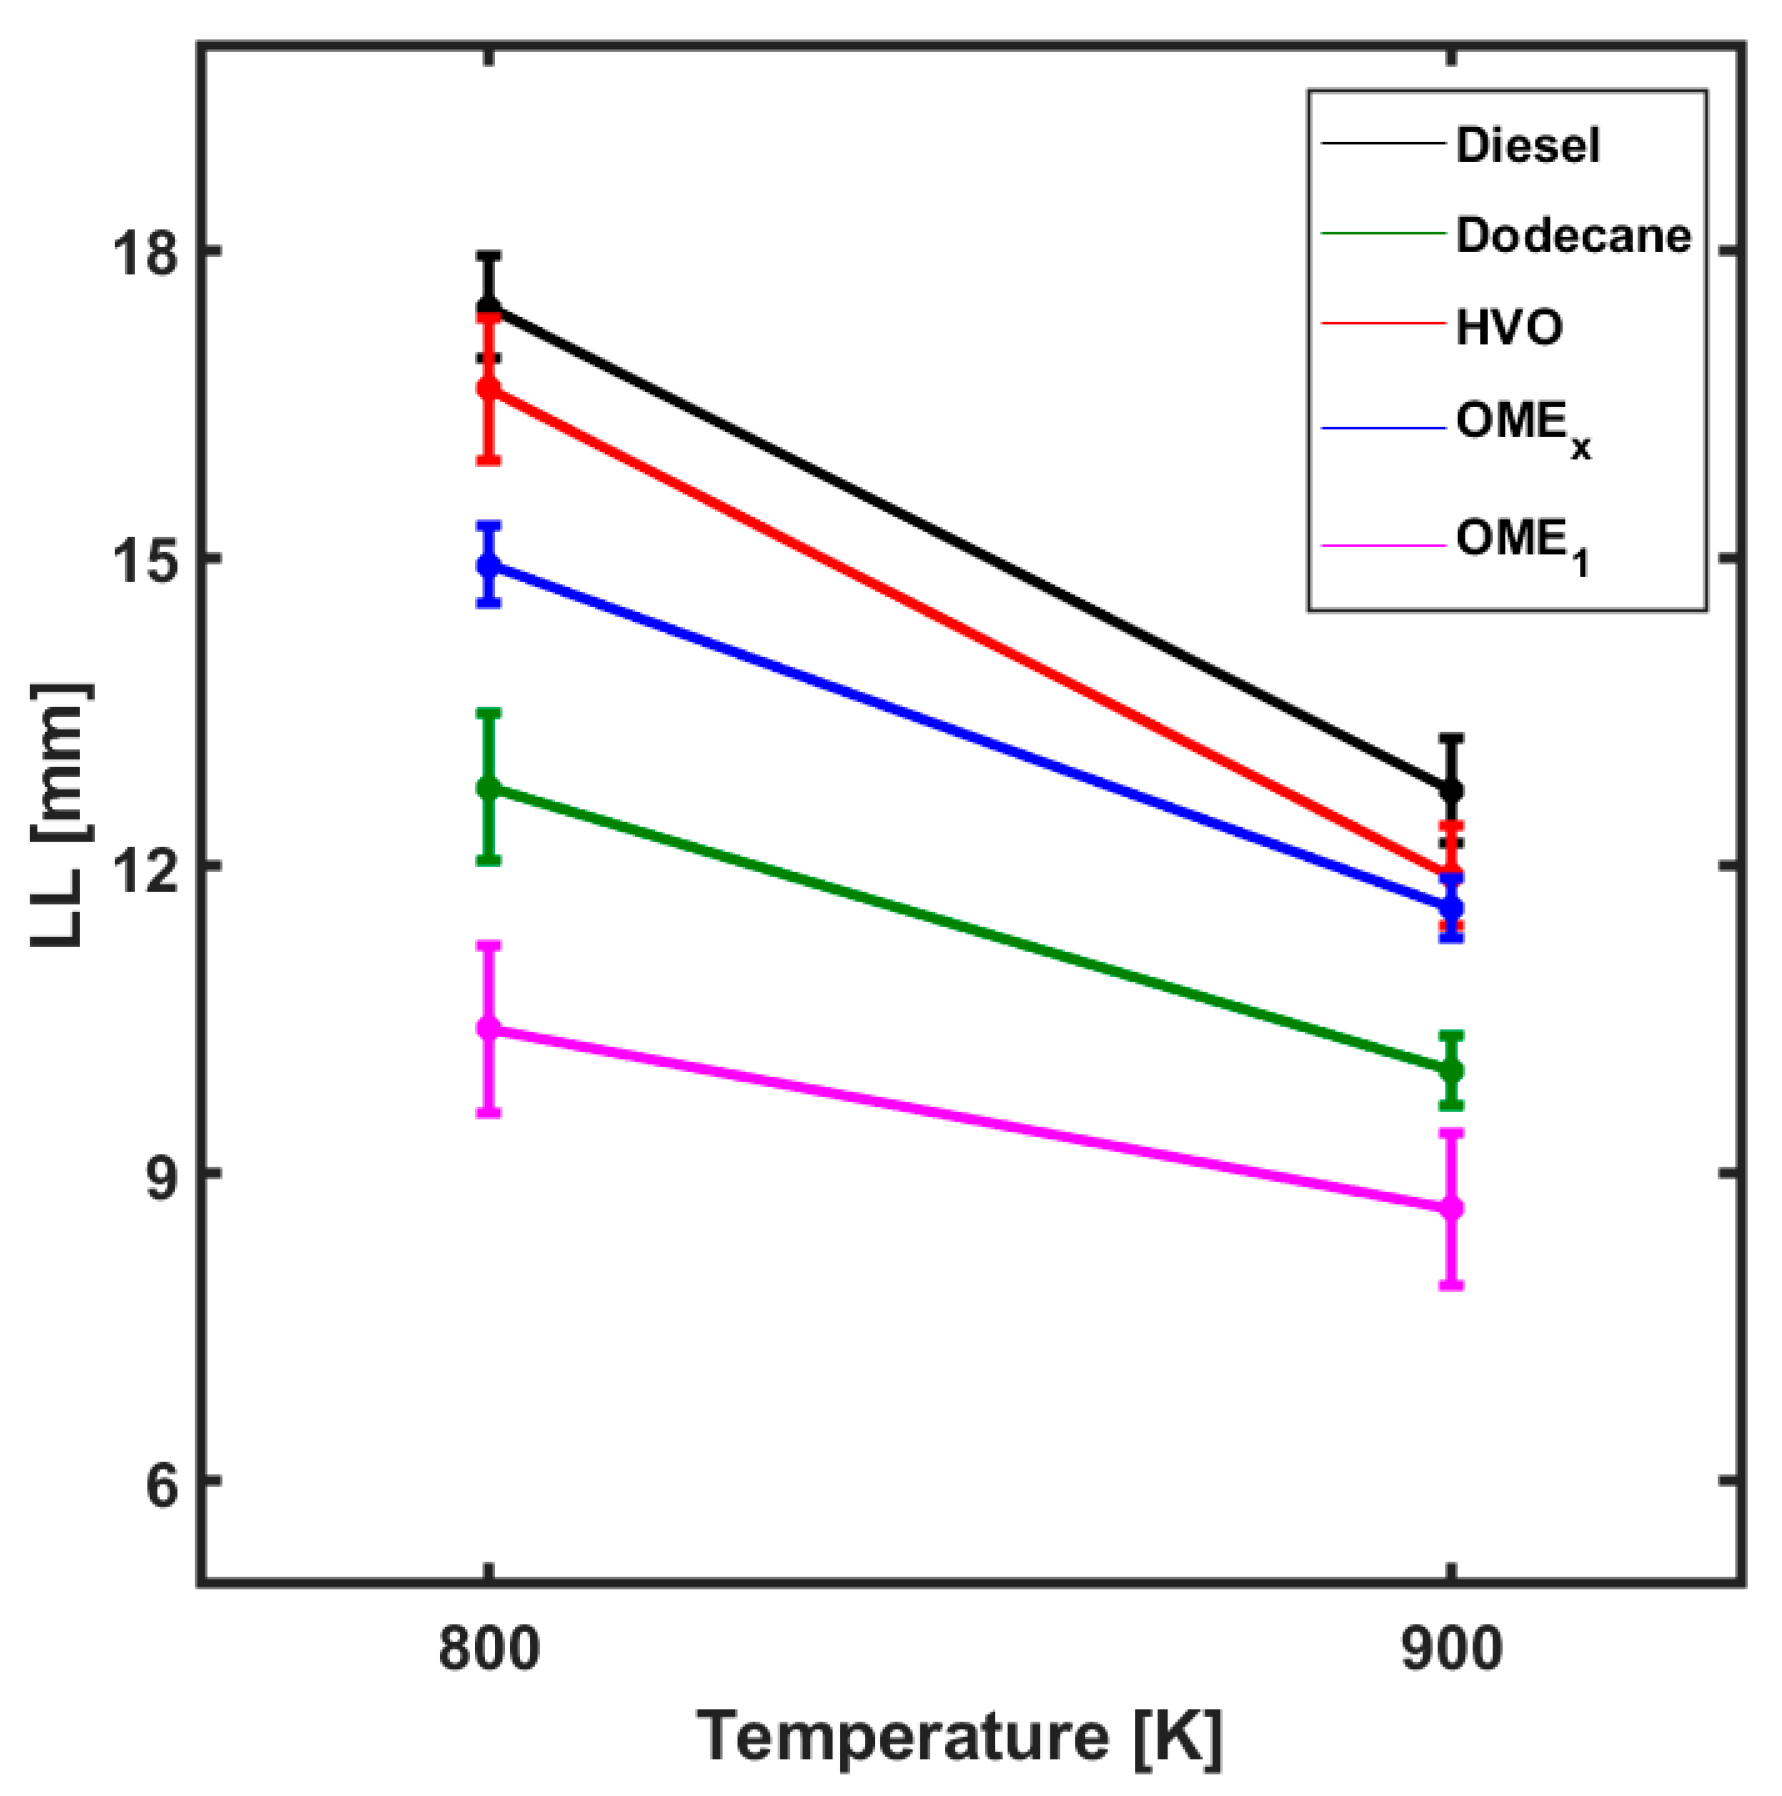
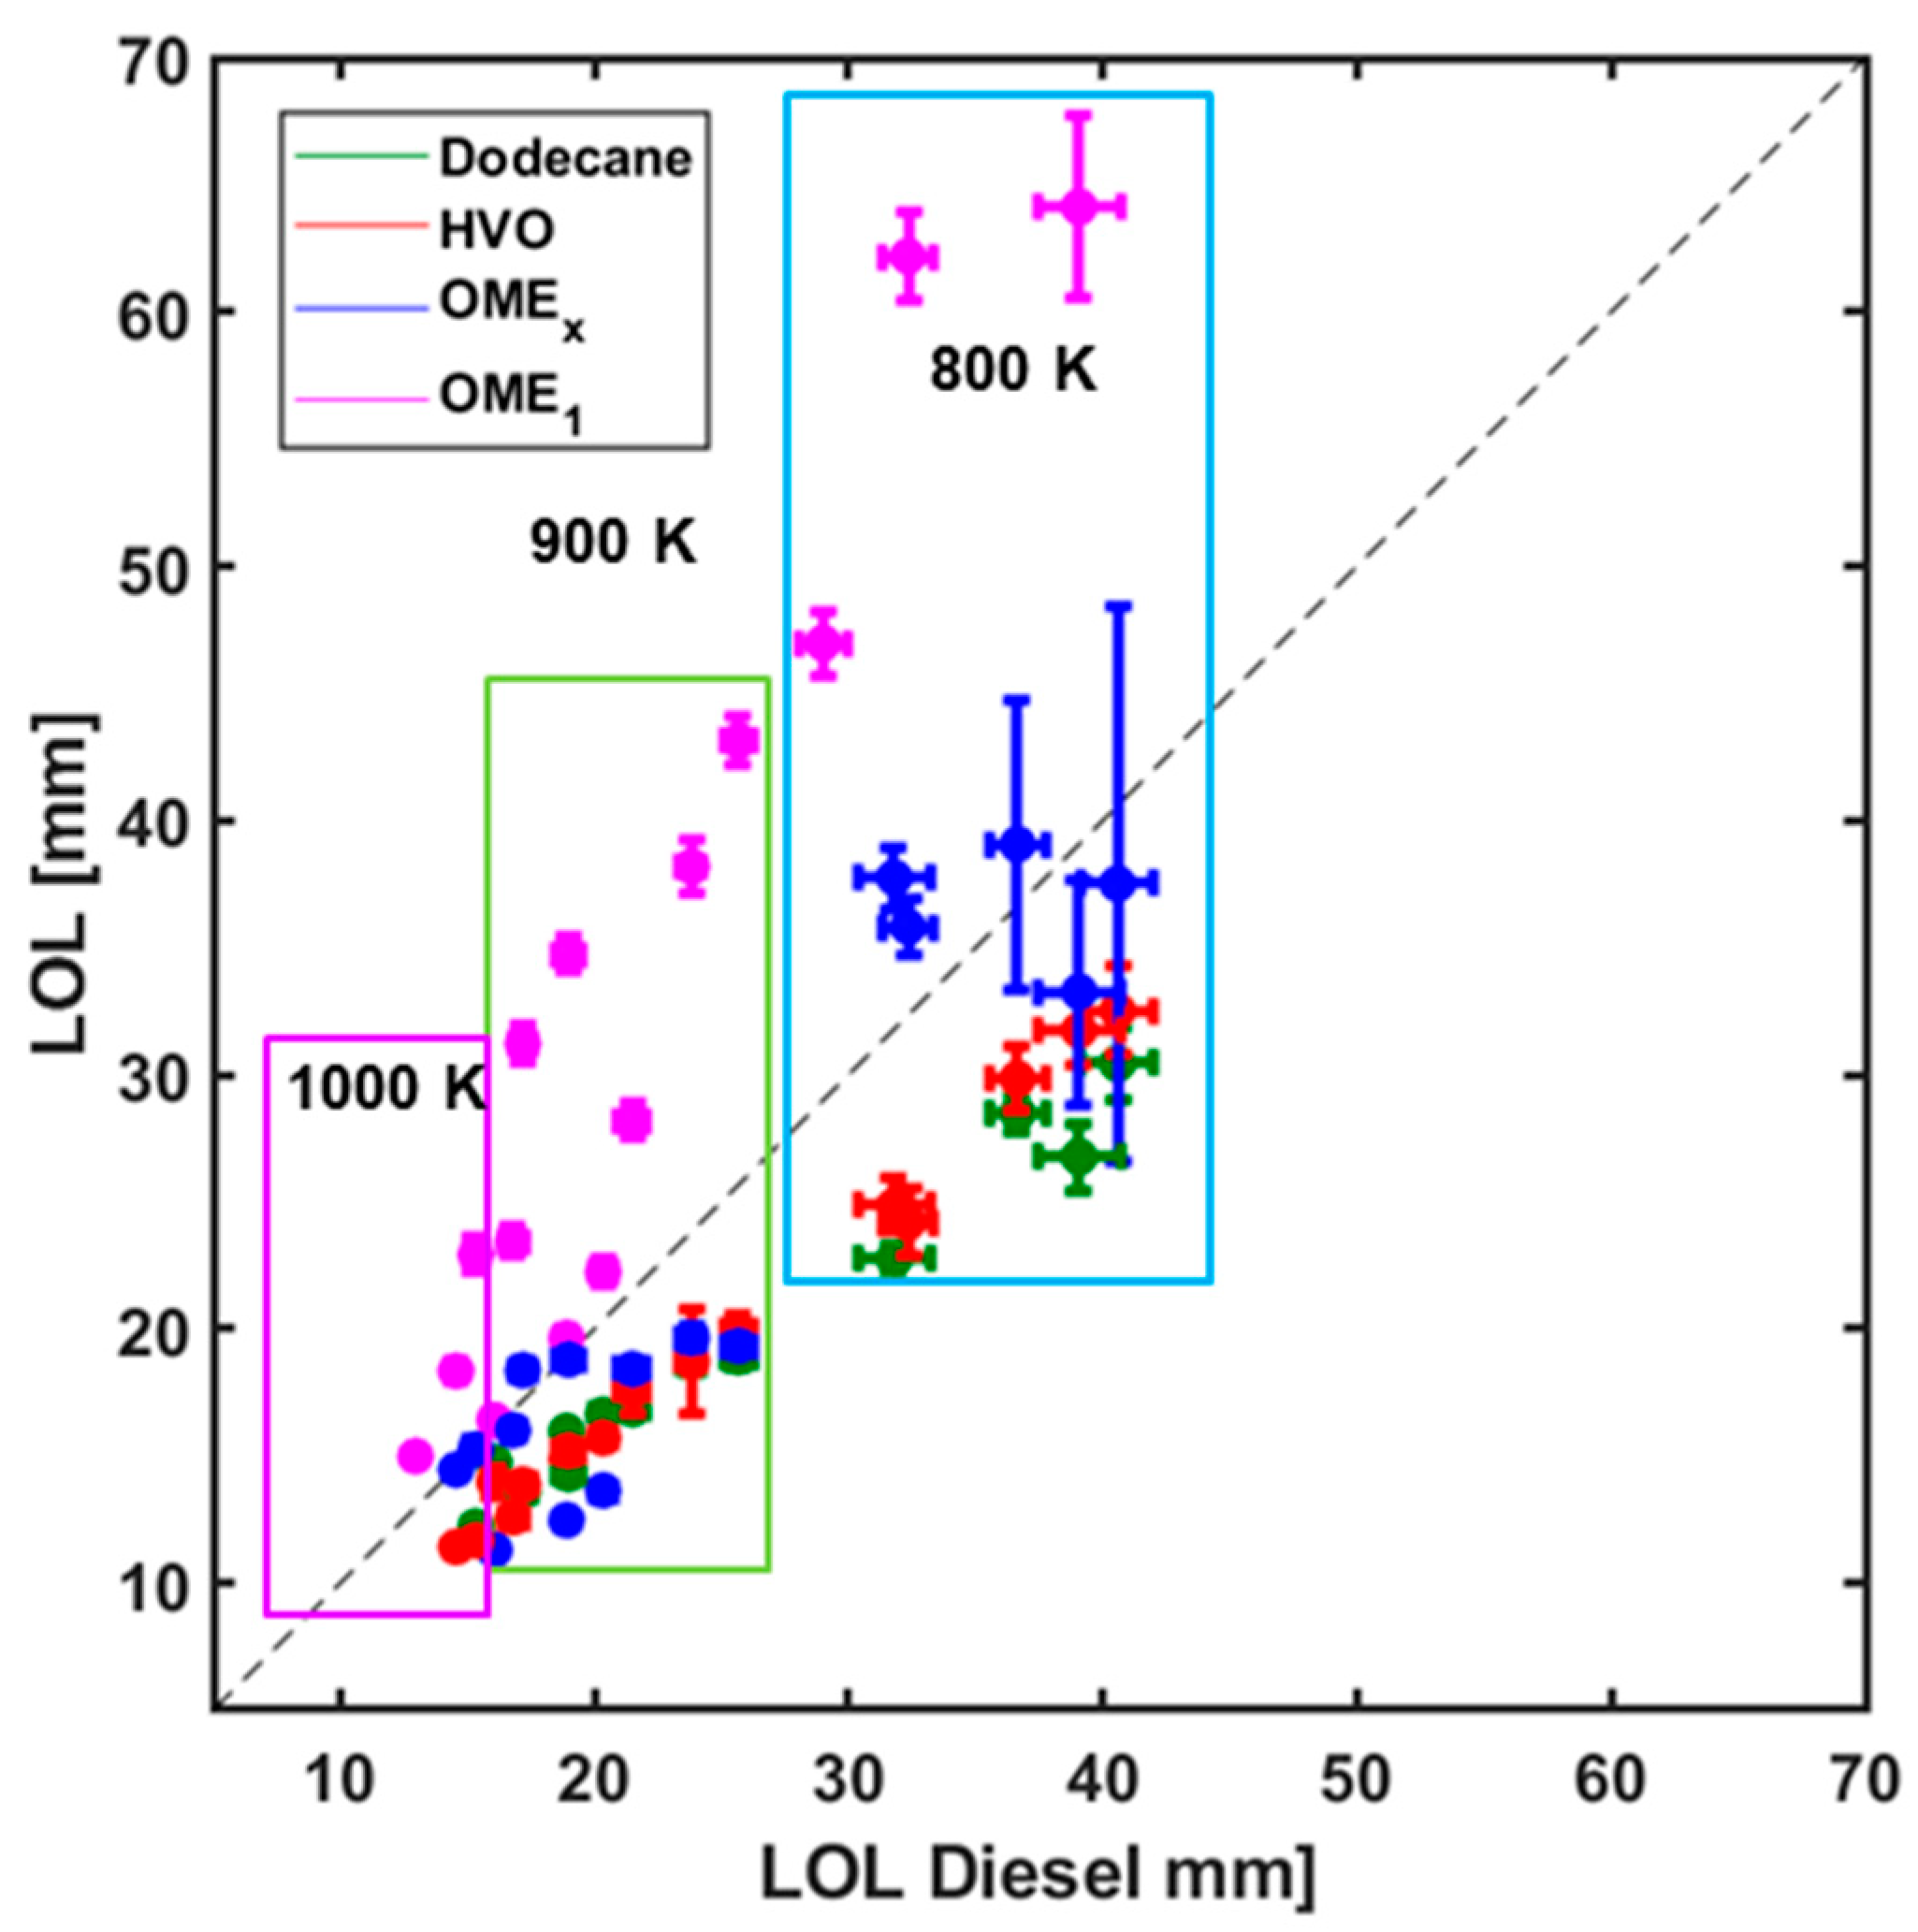
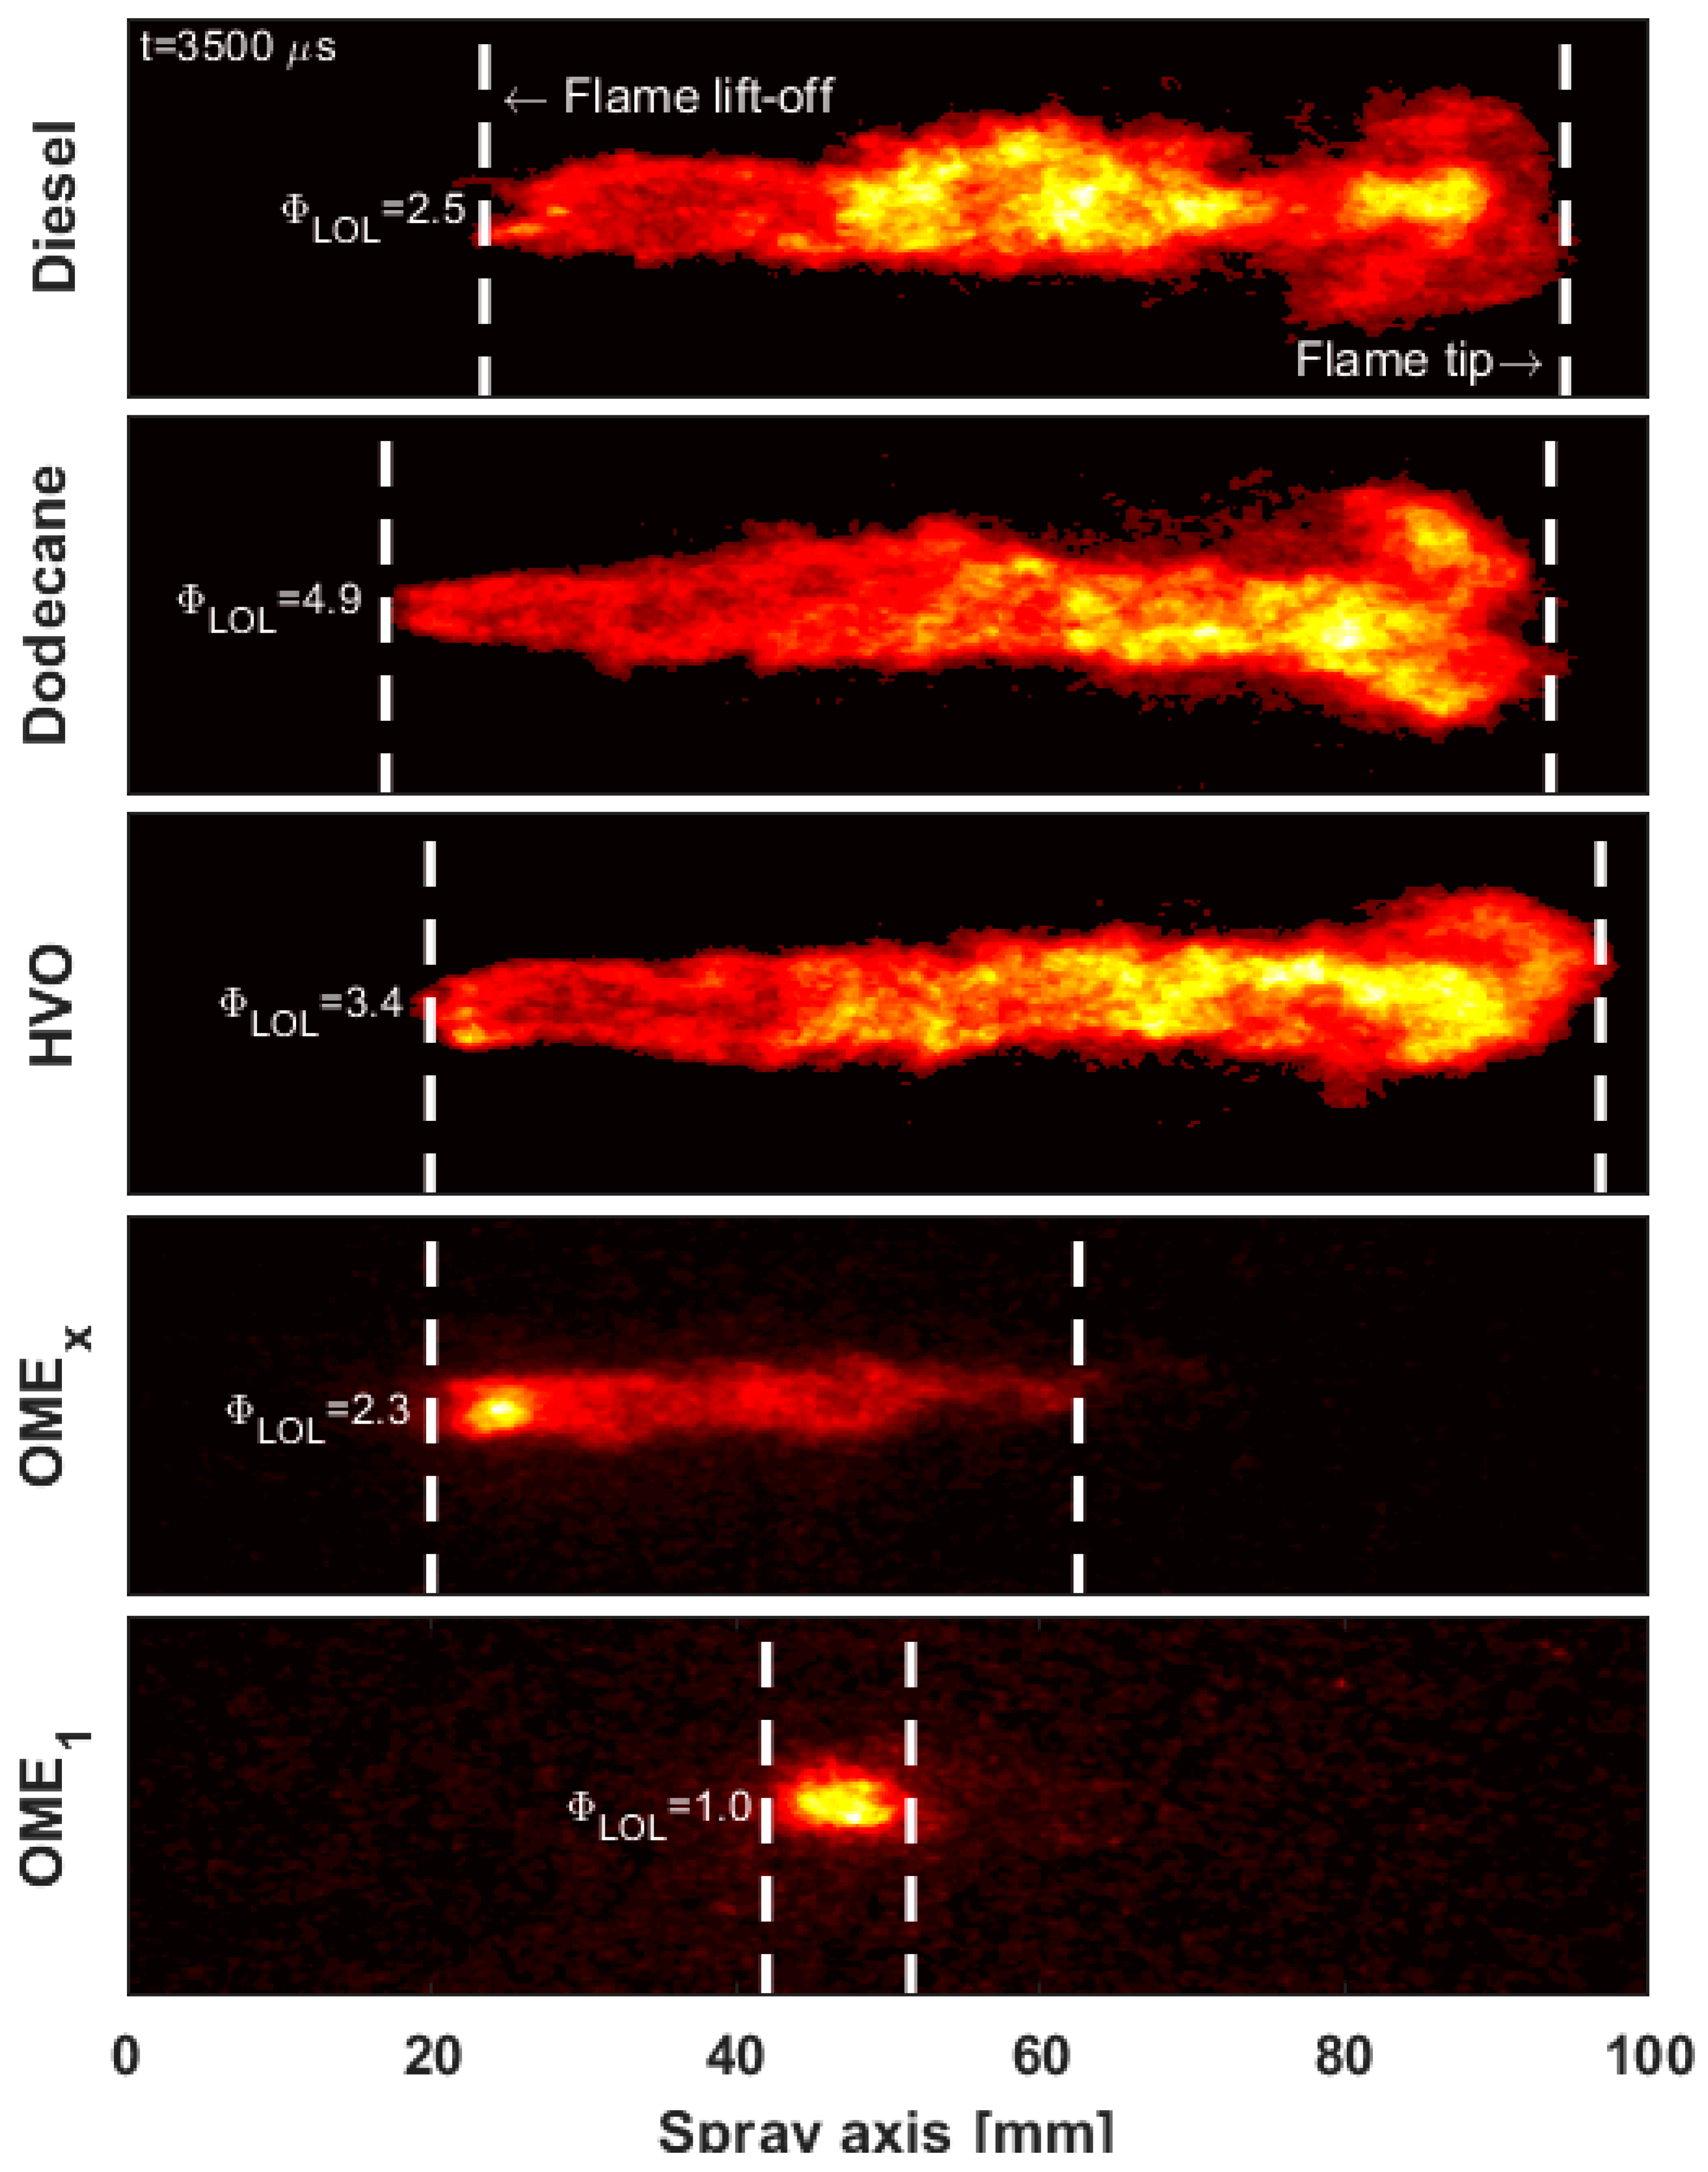
3.3. Lift-Off Length

An important parameter in the combustion and soot production processes is the flame lift-off length (LOL). This is strongly related with the amount of fuel–air mixing process upstream the combustion region. Enough air entrained reduces the average equivalence ratio at the LOL [29] and this result in less soot production. Consequently, flame LOL is worth to be studied for the different fuels tested in current work.
As previously done with the ignition delay, the LOL for the diesel compared to the other fuels is shown in the Figure 7, for the whole test matrix. The interval time to average the LOL corresponds to that in which the flame is “quasi steady” (between 3000 µs and 4000 µs). The HVO and dodecane present a very close behavior, showing smaller LOL than diesel. However, the tendency is not so clear for OMEx since at 800 K its LOL is slightly longer that diesel, at 900 K it is similar but at 1000 K is smaller, close to HVO and dodecane. It is also possible to observe that at 800 K and 15% of O2 the LOL of OMEx has the highest standard deviation, indicating a lower combustion stability. The OME1 cases show longer LOL than the other fuels because of its lower reactivity (higher ignition delay). However, at 1000 K the difference between LOL of diesel and LOL of OME1 is smaller compared with the other operating conditions.

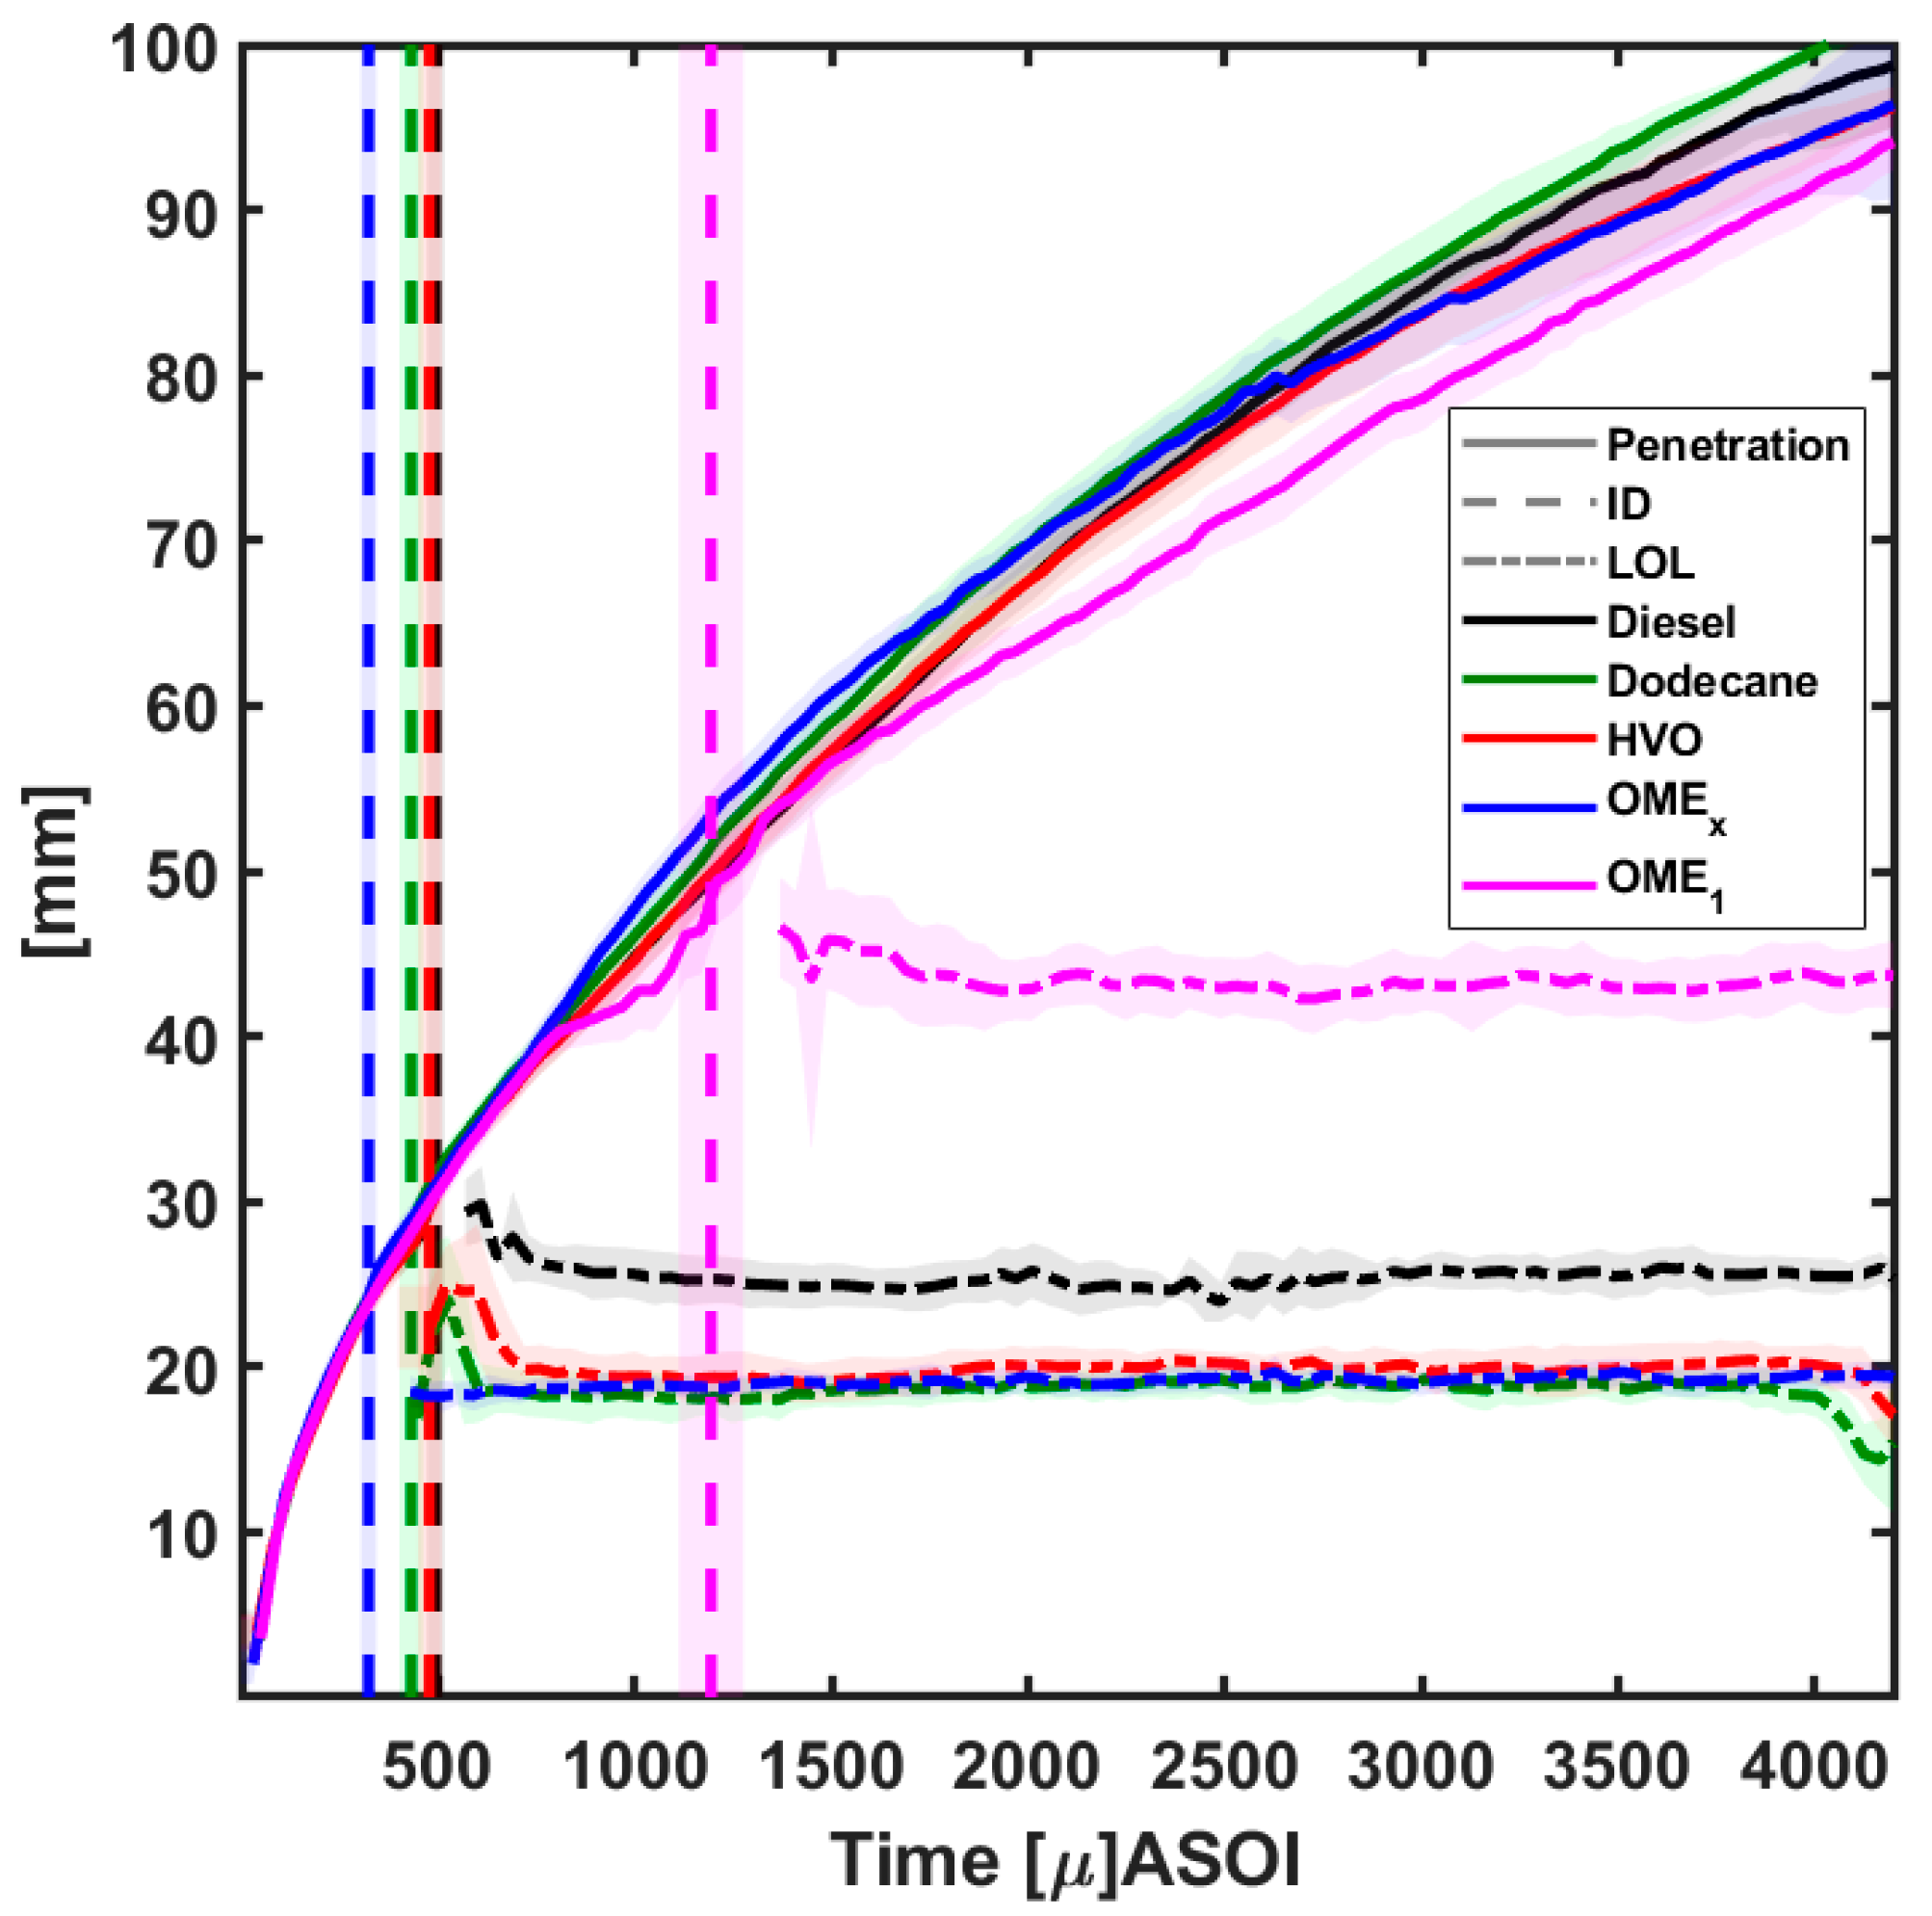
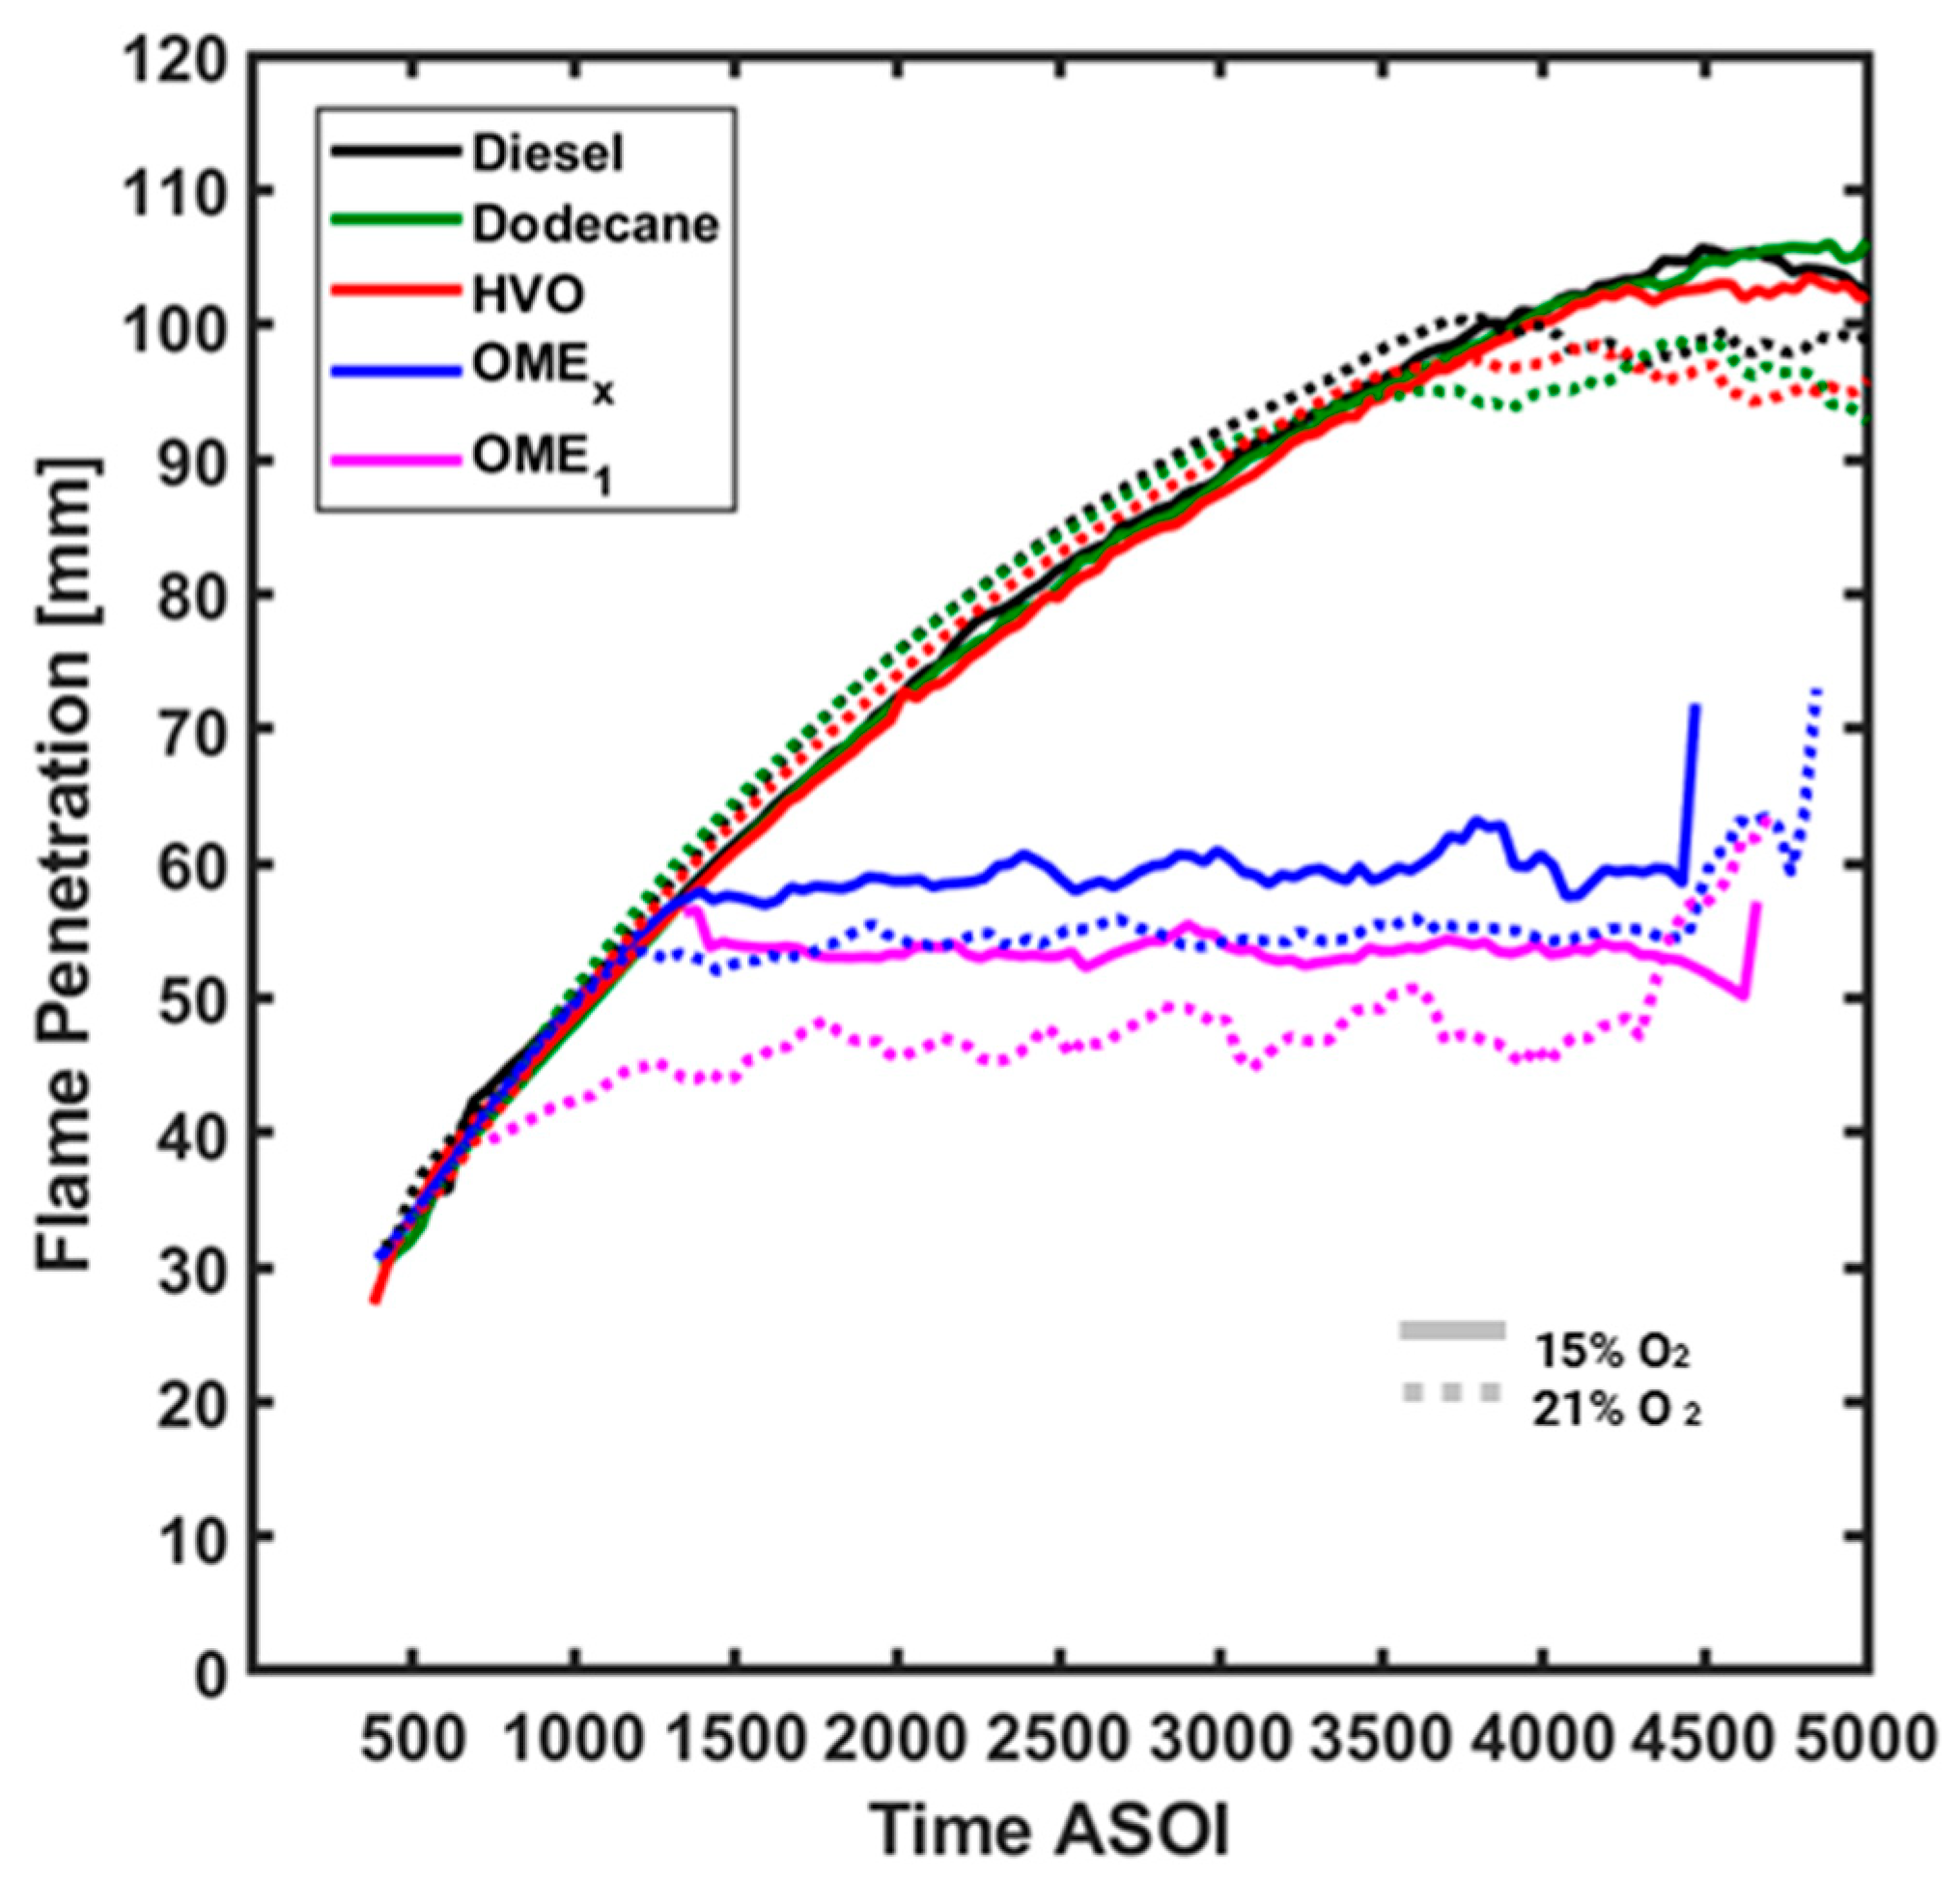
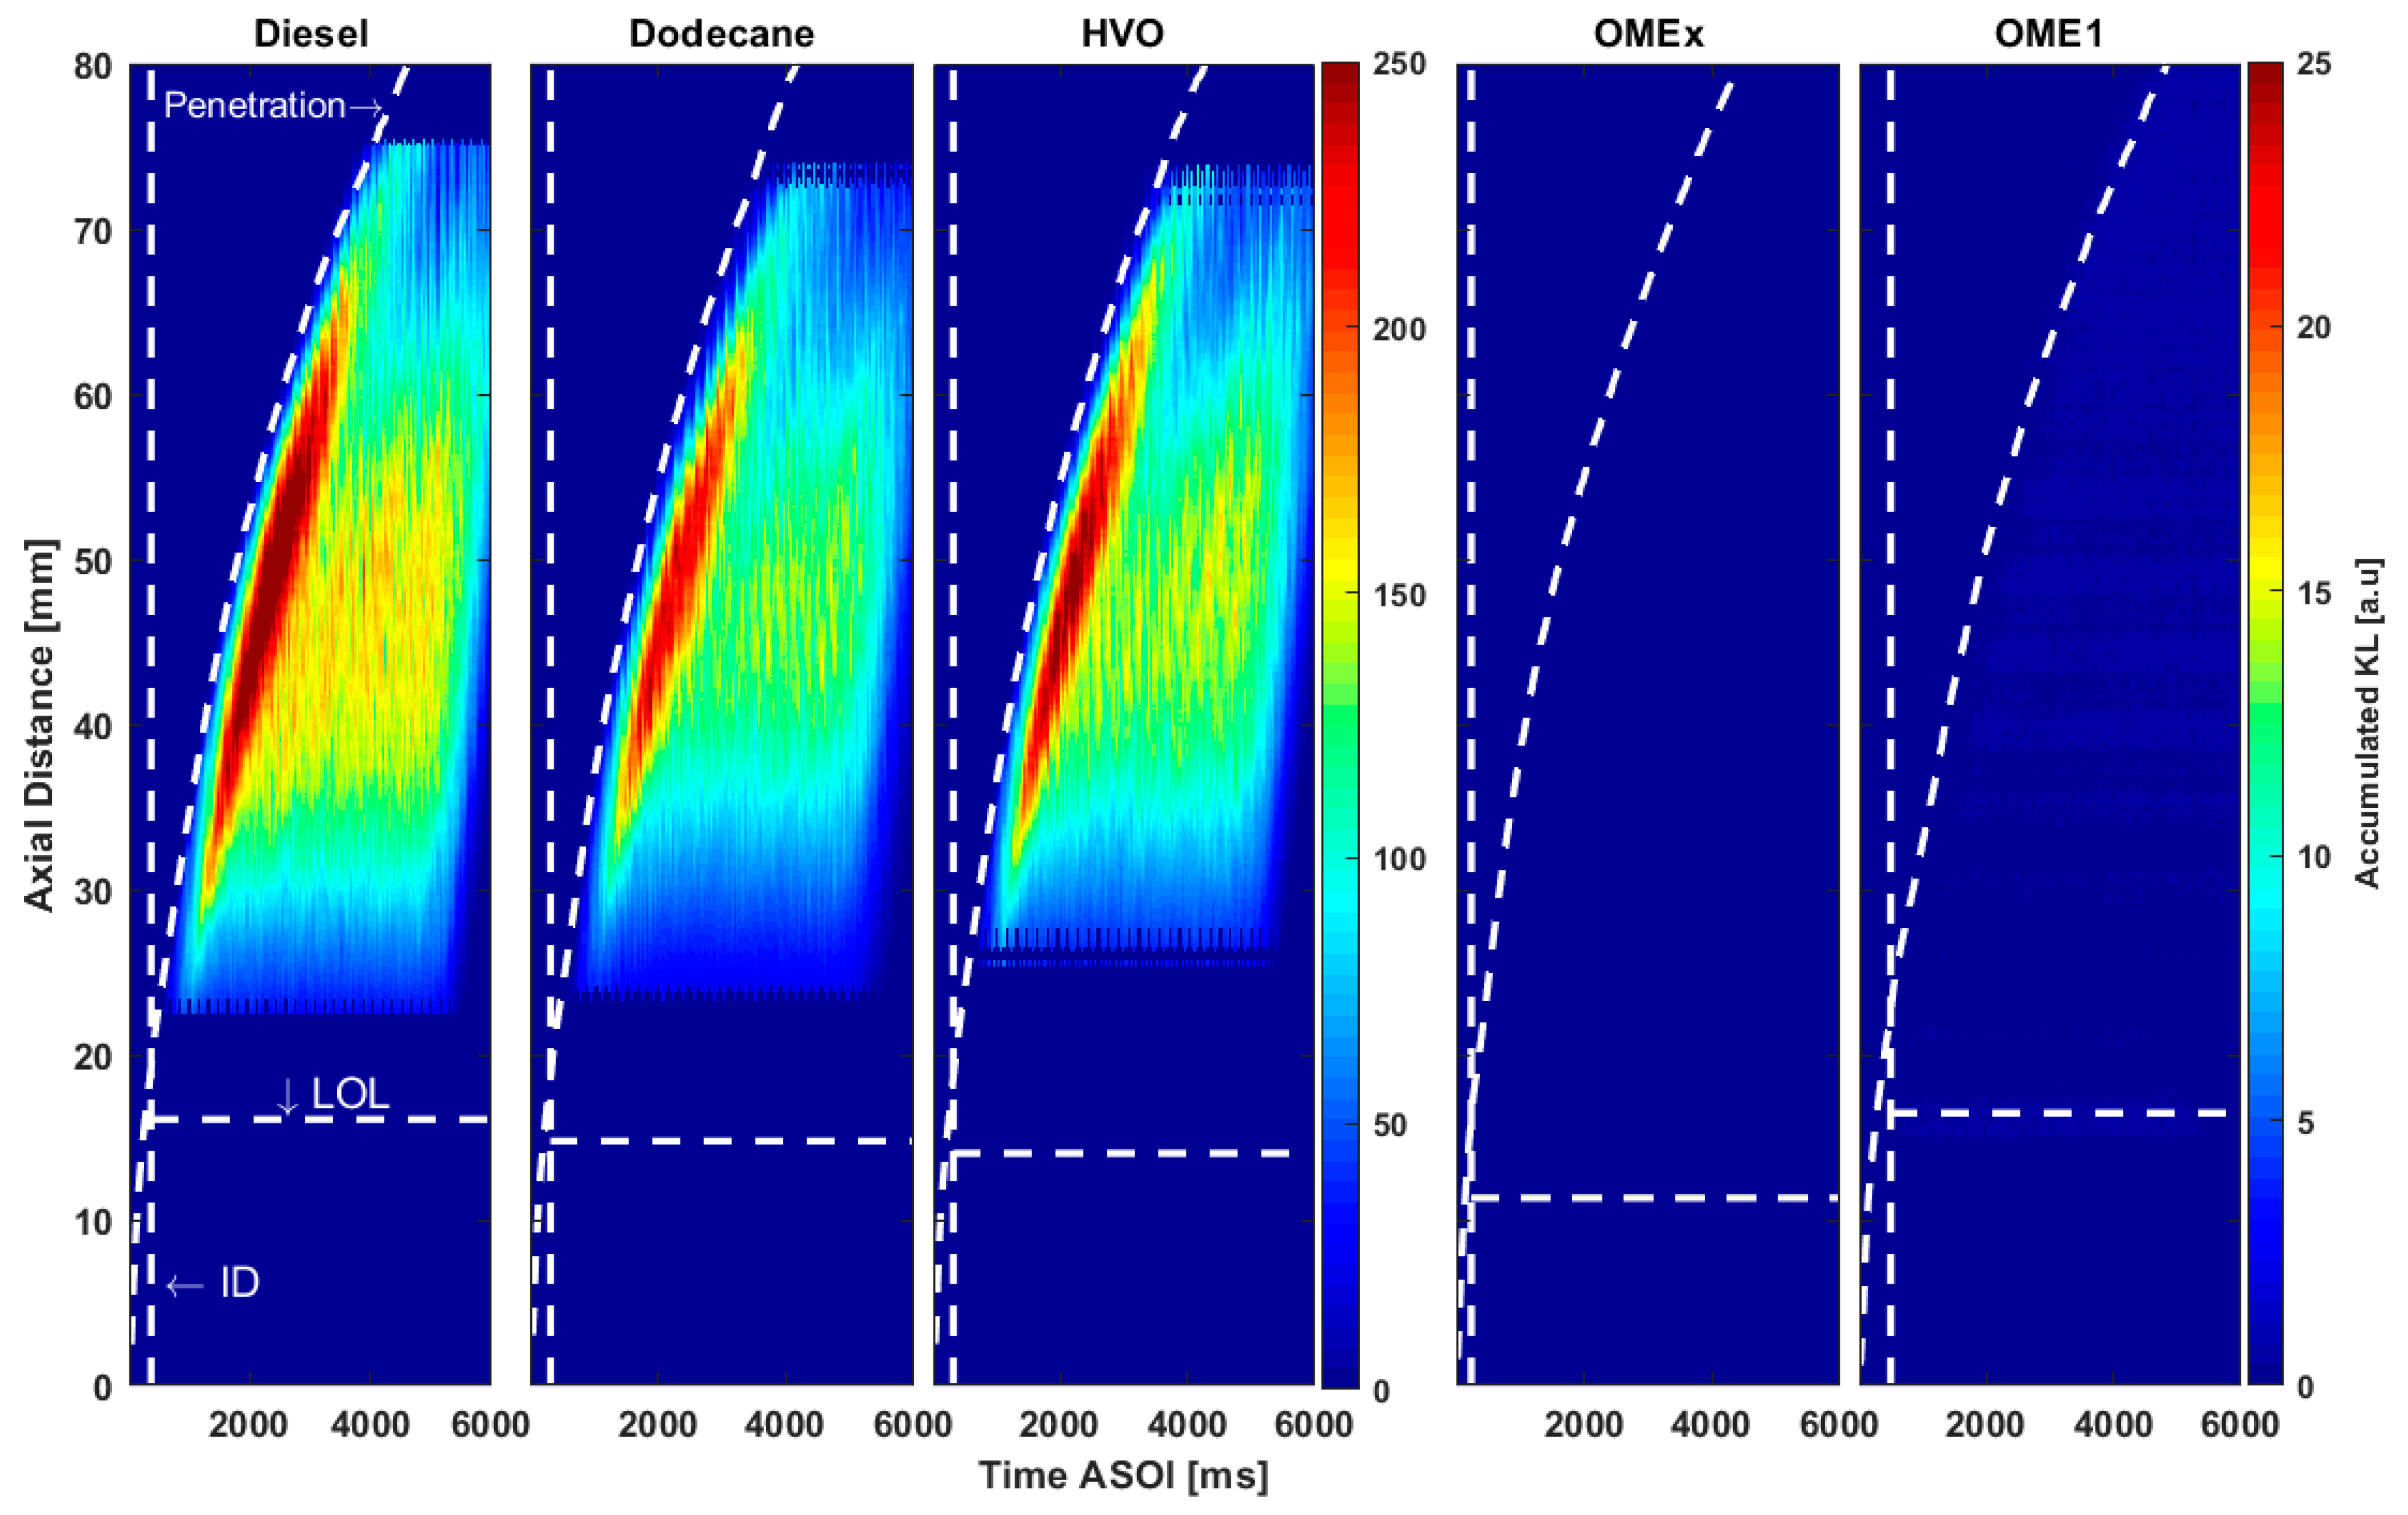
3.4. Spray Tip and Flame Penetration

The temporal evolutions of vapor penetration and LOL, as well as the ID for all the fuels at nominal condition have been shown in Figure 8. The vapor penetration and ID have been measured from schlieren images and LOL from OH* chemiluminescence, as was mentioned previously. The standard deviation for each parameter is represented by shaded areas. A first stage from start of injection until ignition can be observed, where vapor penetration is identical for all the fuels. Only at certain time after ignition differences appear. This first stage corresponds to the ignition delay phase, which extends for each fuel until combustion starts. The ignition delay time has been marked in the figure as a dashed vertical line for each fuel. During the period until ignition, there are not effects on the spray behavior, as expected because the penetration is governed by the momentum flux at the nozzle [34] which only depends on the pressure drop across the nozzle and on the orifice area, fuel effects are negligible. In addition, in Figure 8 the effect of the different fuels upon the indicated parameters can be observed. The dashed-dot horizontal lines correspond to the temporal evolution of LOL. After the ignition, the fuel that ignites first penetrates faster than the others do. In general, it is possible to see that while OMEx has similar behavior to the paraffinic fuels, OME1 is quite far from them.
On the other hand, from OH* images, the flame tip penetration can be measured also from the high-speed OH* chemiluminescence imaging as the axial distance from tip injector until the flame front. In Figure 9, the temporal evolution of the flame penetration for all fuels at 900 K and 1500 bar and both oxygen concentrations has been represented. The solid lines correspond to the case of 15% of oxygen concentration and the dotted lines to 21% case
From this figure, flame tip penetration is seen to undergo a similar time evolution as spray tip penetration during most of the injection period. However, for all cases flame tip becomes constant after a given period, which depends on fuel type and oxygen concentration. For oxygenated fuels, this occurs between 1000 to 1500 µs, while for all other paraffinic fuels it happens close to the end of injection event (around 4200 µs). During that period, the stoichiometric reacting surface stabilizes, and hence the maximum distance where OH* chemiluminescence is recorded does not change with time. For constant ambient and injection conditions this distance has been shown to scale inversely with the stoichiometric mixture fraction, i.e., directly with the stoichiometric A/F ratio [36,37], which depends on oxygen concentration and fuel composition. Table 1 shows stoichiometric air-fuel ratios, from which one can observe that paraffinic fuels have similar values, resulting in the similar long stabilization distance, while the oxygenated fuels approximately a 50% lower (A/F)st, resulting in a much shorter flame length.
Furthermore, differences among Diesel/HVO/Dodecane are small, in agreement with the small (A/F)st differences, OME1 shows a consistently roughly 10% shorter penetration compared to OMEx. Figure 10 has been used to depict the differences in flame structure for each fuel at the nominal operating condition in an instant of time where the combustion is quasi steady (3500 µs). Such images confirm the previously plotted trends among fuels in stabilized flame length, with paraffinic fuels having a similar length, and a shorter one is observed for oxygenated fuels. On the other hand, observed differences in lift-off length also point out at interesting features. As shown above, this quantity is quite similar for all paraffinic fuels and OMEx, while it is far longer for OME1. The equivalence ratio at the lift-off length ( Φ L O L ) can be estimated for all fuels using Equation (3), and the values are shown in the Figure 10:
Φ L O L = f L O L 1 f L O L A / F s t                
In the Equation (3), the term f L O L represents the fuel mixture fraction along spray axis and it is calculated using the equation (4), where K is a constant equal to 7, do is the nozzle diameter and ρf and ρa correspond to the density of the fuel and the ambient respectively.
f L O L = K · d o · ρ f ρ a L O L
Results show that the flame is rich at the lift-off for all fuels except for the OME1, and hence a typical lifted diffusion flame stabilized at stoichiometric conditions is observed for all fuels except for the latter one. OME1 flame stabilizes at lean conditions, where all needed air is already available, which explains the previously observed differences in flame length between OMEx and OME1. Similar lean stabilized flames were observed for an oxygenated fuel (70% tetraethoxypropane 30% heptamethylnonane) with a 100 um orifice at 21% O2, 850 K and 14.8 kg/m3 ambient conditions in [38].

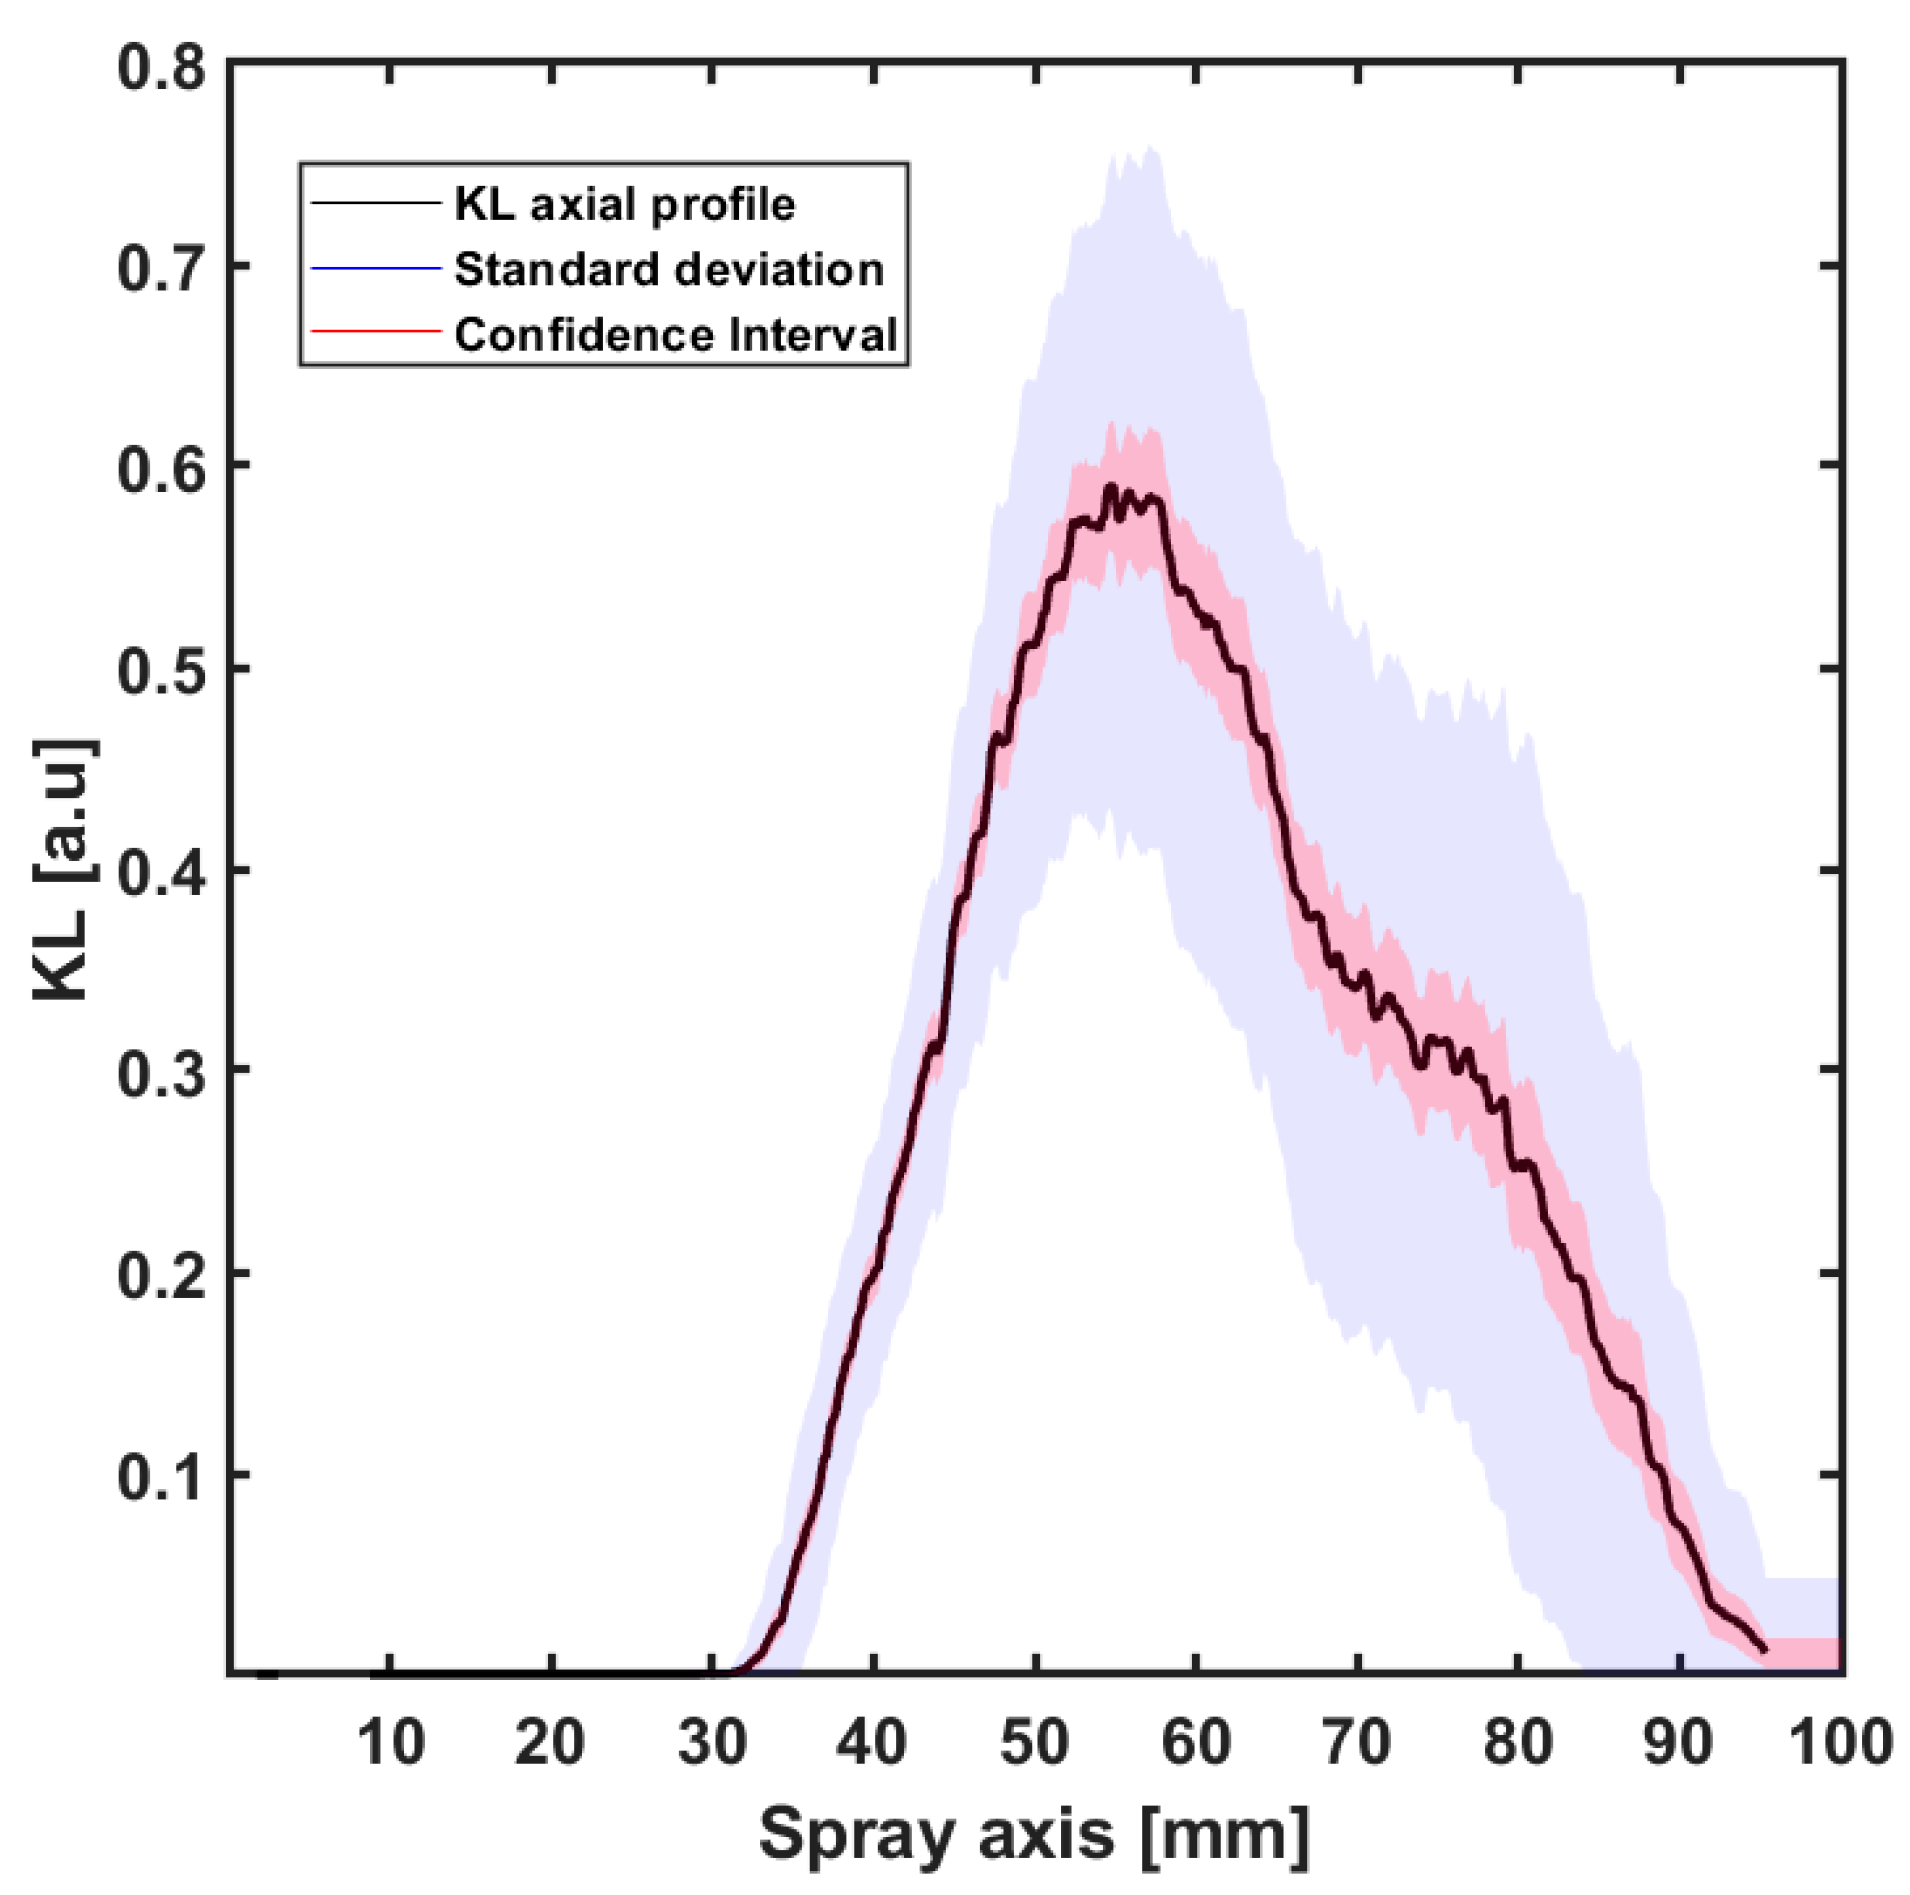
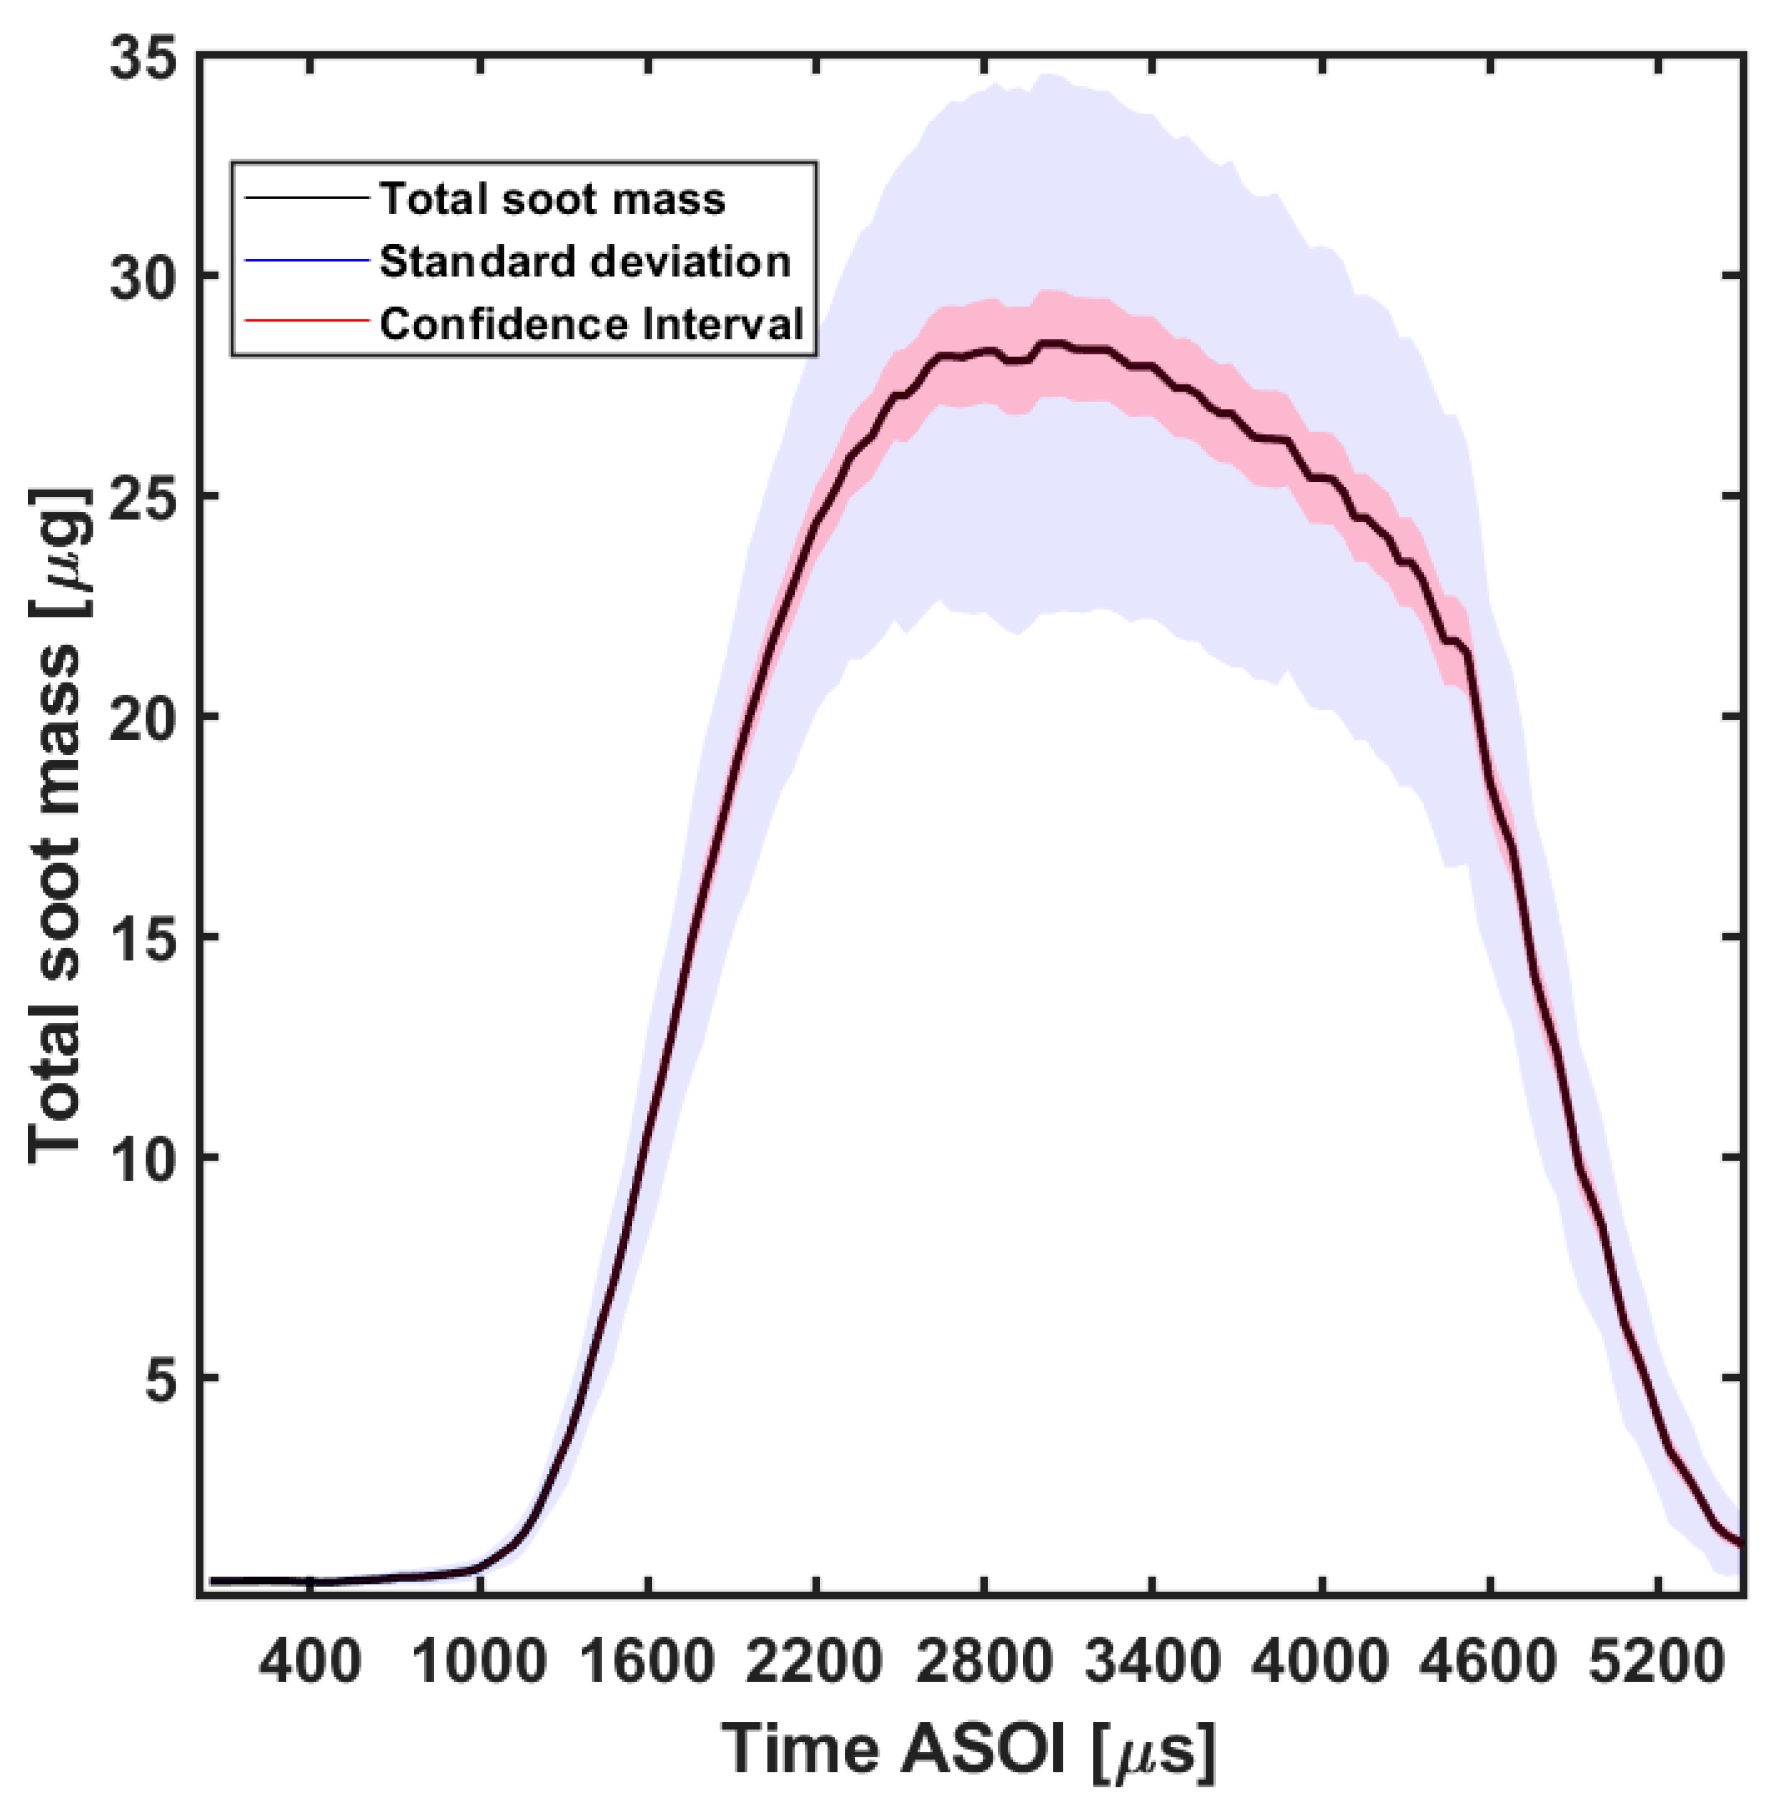
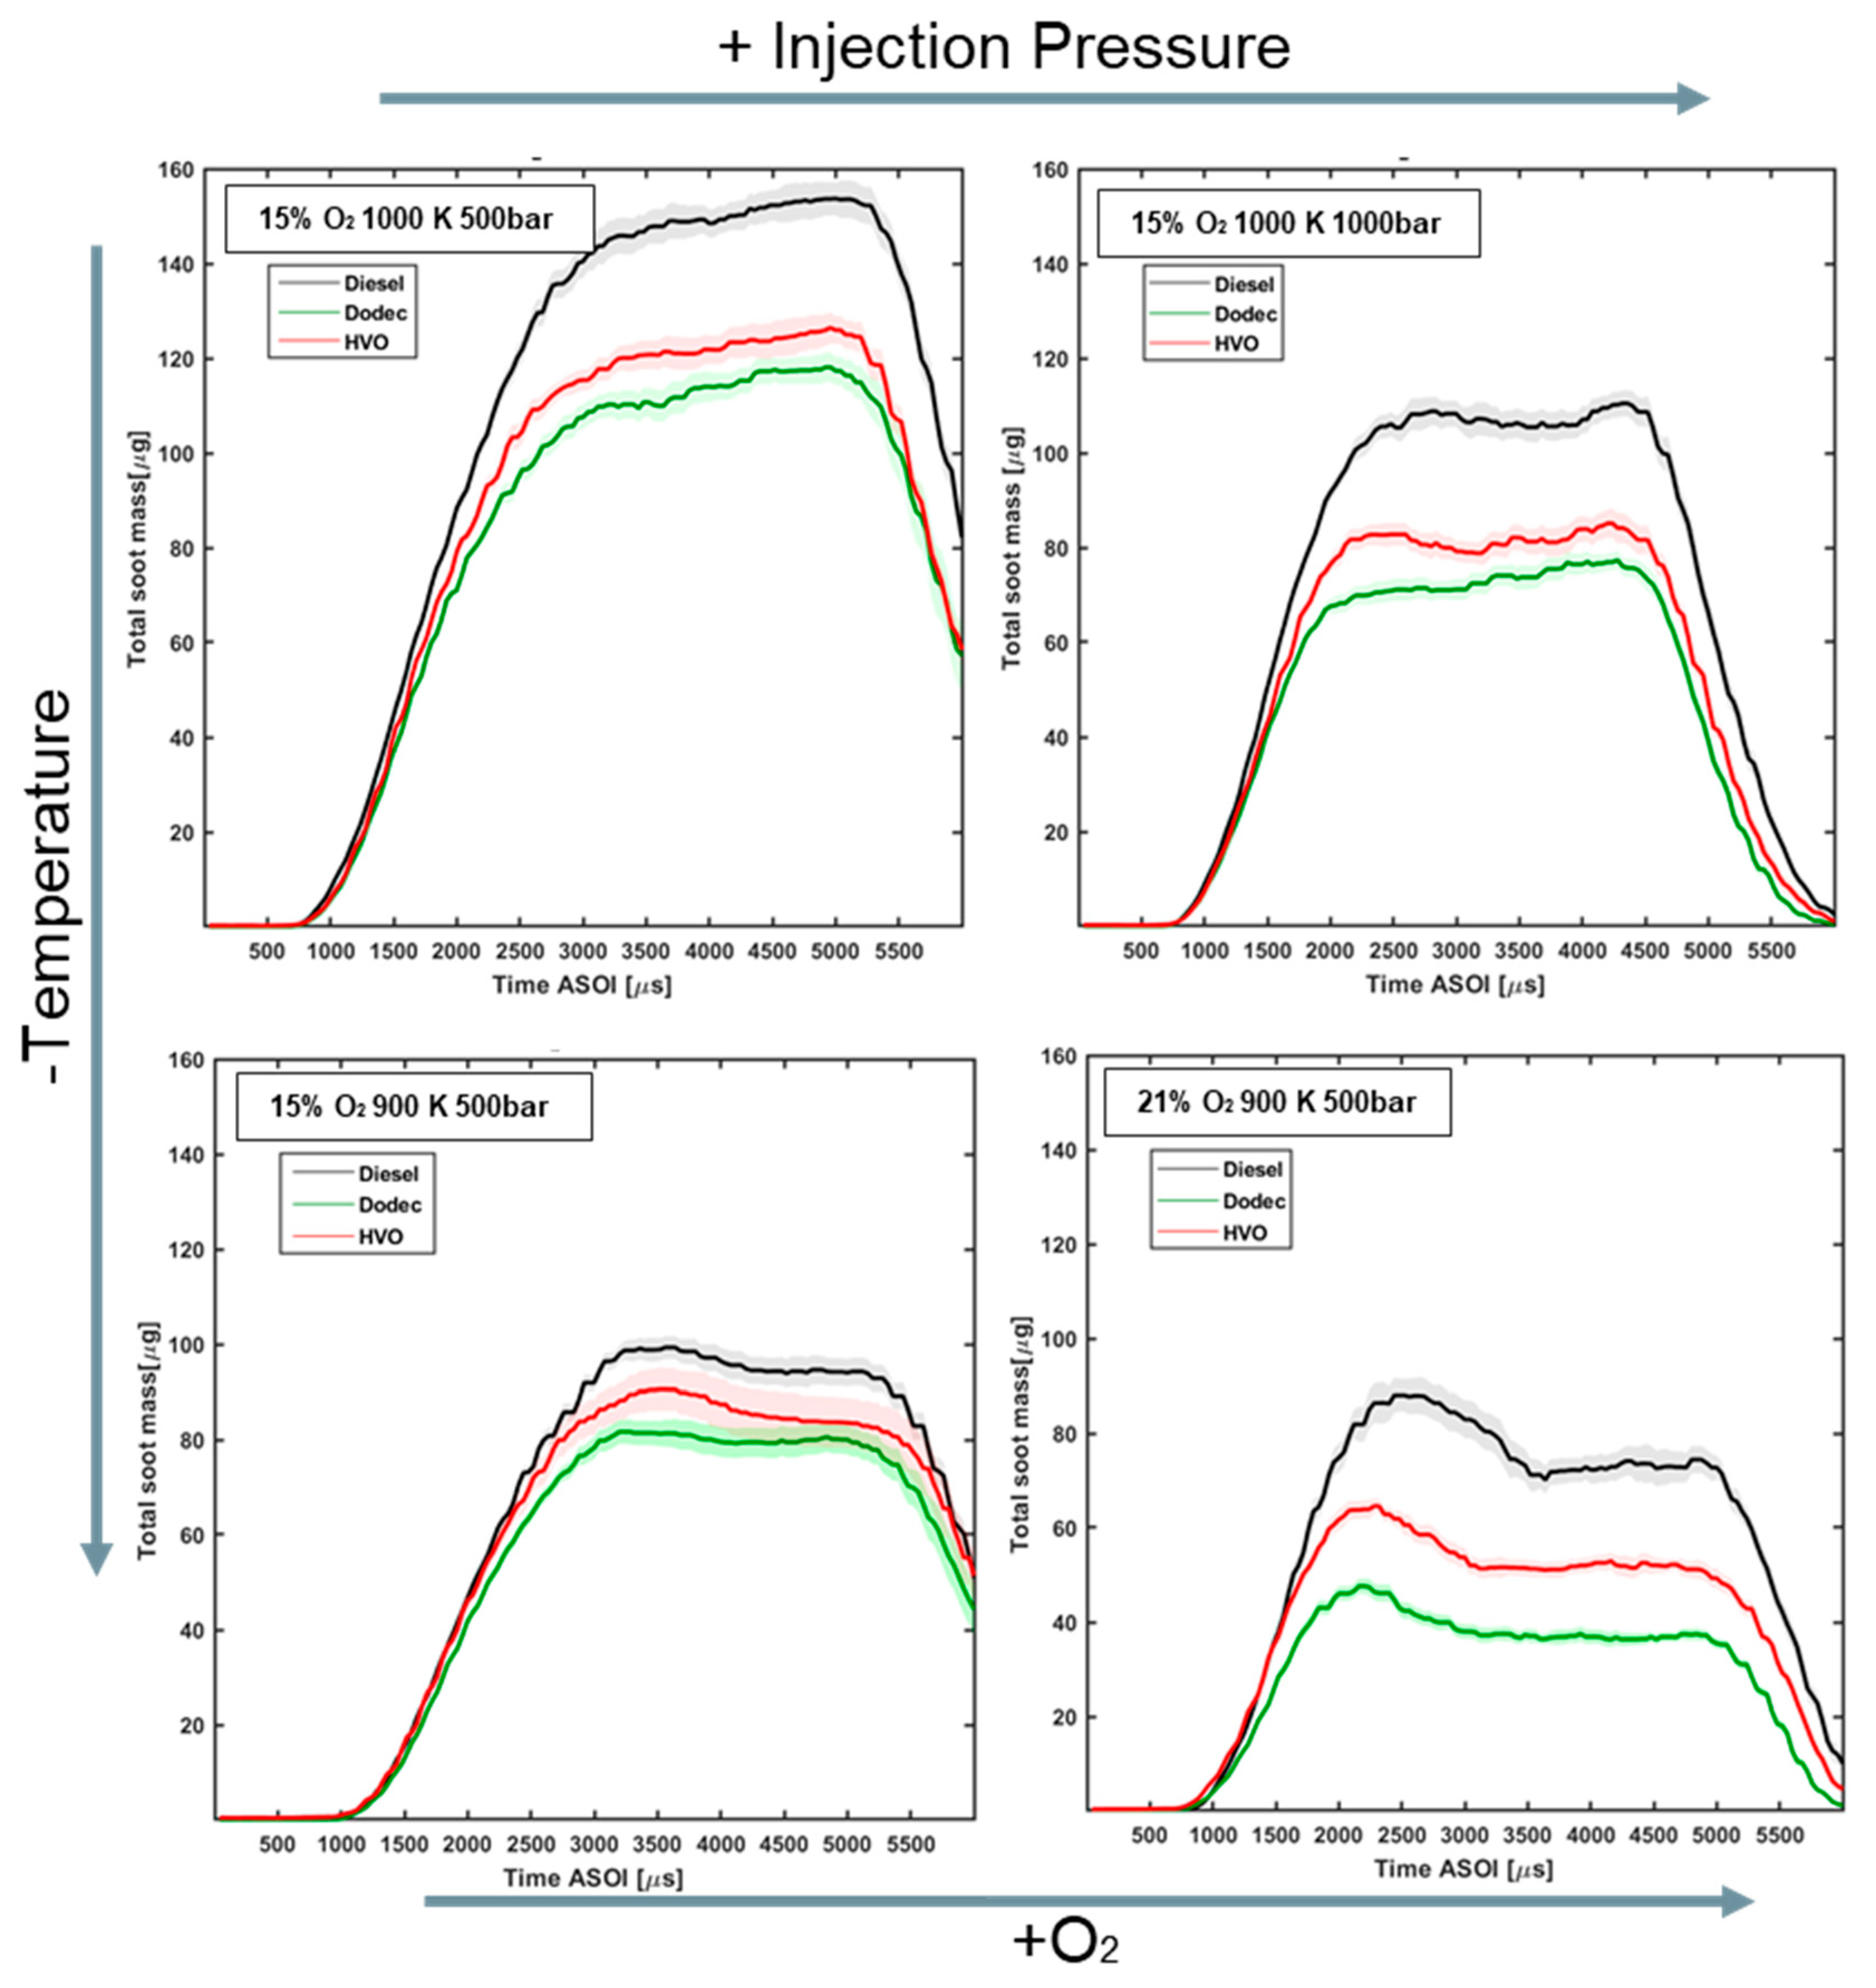
3.5. Soot Production

As was indicated in methodology section, the DBI technique was used to determine the soot production. The DBI images were collected after schlieren. However, OH* chemiluminescence was recorded with the two sets. To verify that both sets are consistent and there are no experimental discrepancies among them, the results obtained for ID from OH* images measured with the first and in the second set are compared in Figure 11. The grey shadow in the bisector represents the uncertainty associated to the time interval between consecutive frames. It can be observed that ID differences between both sets are always less than the time elapsed between two consecutives frames (40 µs). Thus, it is possible to conclude that both sets are consistent and results can be analyzed together.
DBI images were processed to calculate the flame soot in terms of the optical thickness (KL). KL maps were constructed to depict soot evolution throughout the combustion event, by calculating the KL for each axial distance and time-step. A good way to simultaneously evaluate the KL evolution in time and space is transforming the KL map at any given instant into a 1D vector where KL values at any given cross section from the nozzle are accumulated into a single value. Thus, each KL map at any instant is converted into a vector of “accumulated KL” values along the flame axis. By compiling those vectors at every time step (i.e., at every frame), a plot such as those of Figure 12 can be obtained. In any of those plots, the abscissa axis reads for time, the ordinates axis indicates axial distance from the nozzle and the color at any point (X,Y) in the plot indicates the accumulated KL at a cross section at distance Y from the nozzle, of frames taken at time X after SOI.
In Figure 12, the accumulated KL has been represented for the operating condition with greater tendency to soot formation, that is, at the highest temperature (1000 K), the lowest injection pressure (500 bar) and the lowest oxygen concentration (15%). Dashed lines have been used to depict ID, vapor penetration and the flame lift off length. In this figure, it is possible to observe that soot production for OME1 and OMEx is below the detection threshold. The color scale for these two fuels has been modified in other to enhance this fact. Therefore, a sootless flame seems to be established. This holds for all operating conditions and, consequently, KL values for those fuels cannot be analyzed further. Dodecane, HVO and OMEx show smaller KL values than diesel. As for the time evolution, in all three cases it can be observed that initially the largest soot amount is located at the spray tip, in the head vortex area, but when reaching a distance around 70 mm, this soot disappears due to the establishment of the quasi-steady flame The highest KL region appears for the three fuels from 40 to 50 mm from the nozzle.
For a given fuel composition, the soot production is related to the amount of air entrainment that occurs upstream of the lift-off [29]. Longer LOL suggests less soot formation, but this depends also on fuel composition. This can be observed in Figure 12, where diesel has the longest lift-off length but also the largest soot formation. The stoichiometric air/fuel ratio (ma/mf) for dodecane and OME1 is quite different. At 15% of oxygen concentration, stoichiometric air-fuel ratio for dodecane is 20.72 versus 10.03 for OME1 indicating that oxygenated fuels require less air to oxidize. This explains that OMEx, although with LOL closer to diesel, does not produce soot. This statement is supported by the equivalence ratio (Φ) at LOL. For dodecane, Φ is 4.9 at baseline operating conditions, while for the OME1 is 1.0. Furthermore, OME fuels do not have carbon-carbon (C-C) bonds, which contribute to the absence of soot.
In the case of HVO, its aromatic free composition suggests that less polycyclic aromatic hydrocarbons (PAH) are formed [39]. This could explain the lower soot production for HVO compared to diesel, as they can be considered as the building blocks for particulates in flames [40].
The total soot mass production was calculated from instantaneous KL, following the procedure described in Section 2.3.3. Figure 3 depicts the total soot mass for diesel, dodecane and HVO at different operating conditions with the aim of showing the effect of decreasing temperature, increasing injection pressure and increasing the ambient oxygen content. The shown temperatures are 1000 K and 900 K, from top to bottom; the injection pressures are 500 bar and 1000 bar, from left to right; and 15% and 21% of oxygen have been represented for 900 K and 500 bar at the bottom of the figure.
It can be seen that when decreasing the temperature from 1000 K to 900 K (from top to bottom, at the left side of the Figure 13), the maximum value of soot production is reduced 40% for diesel and 30% for dodecane and HVO. When the injection pressure is increased from 500 bar to 1000 bar (from left to right at the top of figure), the soot reduction is around 30% for all fuels. When the oxygen concentration is increased from 15% to 21% (from left to right at the bottom of figure) the total average soot production is reduced 30% for diesel, 40% for HVO and 50% for dodecane. Results for all conditions show that the parametric variation in terms of soot tendency always holds, with diesel showing the largest soot production, while HVO and dodecane present similar soot production. In fact, considering all results presented in this work regarding combustion and soot formation characteristics, it can be concluded that n-dodecane is a good surrogate to model the HVO due to its similarities.

4. Conclusions

In this study, the main spray parameters and combustion characteristics for diesel, HVO, dodecane, OMEx and OME1 were evaluated in an ambient at High Pressure and High Temperature installation, with controlled oxygen concentration. The parameters studied were liquid and spray tip penetration, ignition delay, flame lift-off length, flame length, flame tip penetration and soot production. These were assessed using four high-speed imaging based optical techniques: schlieren, OH* chemiluminescence and diffused back illumination. The operating conditions were defined using as baseline the “Spray A” targets recommended by the Engine Combustion Network (ECN). The main conclusions of this study are summarized below.
Results obtained for the dodecane at the baseline condition (900 K 1500 bar and 15% of O2) for ignition delay, liquid length and flame lift-off length are consistent with those found in the ECN database, which provides confidence in the reliability of the results of this study:
-
The maximum liquid length of all five fuels correlates with the corresponding distillation temperature, stratified in increasing order: OME1-dodecane-OMEx-HVO-diesel.
-
ID trend matches the cetane number rating of paraffinic fuels. HVO and dodecane ignite very close and earlier than diesel. However, OMEx ignites before the other fuels although its cetane number is not the highest, but its shorter ID is due to the oxygen in its molecular structure, which improves its ignition. The only fuel that ignites after diesel does is OME1. However, at 1000 K, OME1 shows a similar behavior than diesel.
-
The longest flame lift-off length is for OME1 and at 800 K and 900 K, which is quite far from OMEx and paraffinic fuels. Conversely, OMEx has a closer behavior to paraffinic fuels in all operating conditions.
-
During the period until ignition, all fuels show the same behavior in terms of penetration, since the spray tip penetration is known to be governed by the momentum flux conservation at the nozzle orifice, which only depends on the pressure drop across the nozzle and the orifice area.
-
The difference of flame penetration between paraffinic fuel and oxygenated fuel is very marked. Oxygenated fuels stabilize early while paraffinic fuels reach the flame stabilization later as a consequence of the fuel’s stoichiometry. Furthermore, an important difference between OME1 and OMEx at nominal operating condition exists due to the OME1 flame stabilizes at lean air-fuel ratio.
-
Regarding soot production, the oxygenated fuels (OMEx and OME1) did not produce detectable soot at any operating condition tested. This can be explained by the very low equivalence ratio at lift-off owing to the oxygen content in the molecule as well as by the absence of C-C bonds.
-
HVO produces less soot than diesel, but more than dodecane. This behavior can be rel0ated with the absence of aromatic compounds in HVO formulation.

Author Contributions

Conceptualization, J.M.G.-O.; Data curation, A.A.G.-C.; Formal analysis, A.A.G.-C. and A.G.; Methodology, J.V.P. and C.M.; Project administration, J.M.G.-O.; Resources, J.V.P.; Supervision, J.M.G.-O.; Writing–original draft, A.A.G.-C. and A.G.; Writing–review & editing, J.V.P., J.M.G.-O., C.M., A.A.G.-C. and A.G. All authors have read and agree to the published version of the manuscript.

Funding

This research has been partly funded by the European Union’s Horizon 2020 Programme through the ENERXICO project, grant agreement n° 828947, and from the Mexican Department of Energy, CONACYT-SENER Hidrocarburos grant agreement n° B-S-69926 and by Universitat Politècnica de València through the Programa de Ayudas de Investigación y Desarrollo (PAID-01-18).

Conflicts of Interest

The authors declare no conflict of interest.

Abbreviations

(A/F)stStoichiometric air–fuel ratio
ASOEAfter Start of Energizing
ASOIAfter Start of Injection
CATCaterpillar
CFPPCold Filter Plugging Point
CICompression Ignition
CMTCMT-Motores Térmicos
DDiameter of lens
DPFDiesel Particle Filter
ECNEngine Combustion Network
FFocal length
FWHMFull Width at Half Maximum
GTLGas to Liquid
HVOHydrotreated Vegetable Oil
ICCDIntensified Charge –Coupled Device
IFPEnInstitut Français du Pétrole Énergies Nouvelles
KLOptical Thickness
LEDLight-Emitting Diode
NOxNitrogen Oxides
OH*Excited state of hydroxyl radical
OME1Methylal
OMExA blend of oxymethylene ethers
PMParticle Matter
SCRSelective Catalytic Reduction
SNLSandia National Laboratory
SOIStart of Injection
TU/eEindhoven University of Technology

References

  1. Reşitoğlu, İ.A.; Altinişik, K.; Keskin, A. The pollutant emissions from diesel-engine vehicles and exhaust aftertreatment systems. Clean Technol. Environ Policy 2015, 17, 15–27. [Google Scholar] [CrossRef] [Green Version]
  2. Pundir, B.P. IC Engines: Combustion and Emissions; Alpha Science International: Oxford, UK, 2010. [Google Scholar]
  3. Mohan, B.; Yang, W.; Chou, S. kiang Fuel injection strategies for performance improvement and emissions reduction in compression ignition engines—A review. Renew. Sustain. Energy Rev. 2013, 28, 664–676. [Google Scholar] [CrossRef]
  4. Leach, F.; Kalghatgi, G.; Stone, R.; Miles, P. The scope for improving the efficiency and environmental impact of internal combustion engines. Transp. Eng. 2020, 1, 100005. [Google Scholar] [CrossRef]
  5. Kim, H.Y.; Ge, J.C.; Choi, N.J. Application of Palm Oil Biodiesel Blends under Idle Operating Conditions in a Common-Rail Direct-Injection Diesel Engine. Appl. Sci. 2018, 8, 2665. [Google Scholar] [CrossRef] [Green Version]
  6. Tziourtzioumis, D.N.; Stamatelos, A.M. Experimental Investigation of the Effect of Biodiesel Blends on a DI Diesel Engine’s Injection and Combustion. Energies 2017, 10, 970. [Google Scholar] [CrossRef] [Green Version]
  7. Merola, S.S.; Tornatore, C.; Iannuzzi, S.E.; Marchitto, L.; Valentino, G. Combustion process investigation in a high speed diesel engine fuelled with n-butanol diesel blend by conventional methods and optical diagnostics. Renew. Energy 2014, 64, 225–237. [Google Scholar] [CrossRef]
  8. Choi, K.; Park, S.; Roh, H.G.; Lee, C.S. Combustion and Emission Reduction Characteristics of GTL-Biodiesel Fuel in a Single-Cylinder Diesel Engine. Energies 2019, 12, 2201. [Google Scholar] [CrossRef] [Green Version]
  9. Dimitriadis, A.; Seljak, T.; Vihar, R.; Žvar Baškovič, U.; Dimaratos, A.; Bezergianni, S.; Samaras, Z.; Katrašnik, T. Improving PM-NOx trade-off with paraffinic fuels: A study towards diesel engine optimization with HVO. Fuel 2020, 265, 116921. [Google Scholar] [CrossRef]
  10. Pastor, J.V.; García, A.; Micó, C.; Lewiski, F. An optical investigation of Fischer-Tropsch diesel and Oxymethylene dimethyl ether impact on combustion process for CI engines. Appl. Energy 2020, 260, 114238. [Google Scholar] [CrossRef]
  11. Bergthorson, J.M.; Thomson, M.J. A review of the combustion and emissions properties of advanced transportation biofuels and their impact on existing and future engines. Renew. Sustain. Energy Rev. 2015, 42, 1393–1417. [Google Scholar] [CrossRef]
  12. Yehliu, K.; Boehman, A.L.; Armas, O. Emissions from different alternative diesel fuels operating with single and split fuel injection. Fuel 2010, 89, 423–437. [Google Scholar] [CrossRef]
  13. Gómez, A.; Soriano, J.A.; Armas, O. Evaluation of sooting tendency of different oxygenated and paraffinic fuels blended with diesel fuel. Fuel 2016, 184, 536–543. [Google Scholar] [CrossRef]
  14. Benajes, J.; García, A.; Monsalve-Serrano, J.; Martínez-Boggio, S. Potential of using OMEx as substitute of diesel in the dual-fuel combustion mode to reduce the global CO2 emissions. Trans. Eng. 2020, 1, 100001. [Google Scholar] [CrossRef]
  15. Burger, J.; Siegert, M.; Ströfer, E.; Hasse, H. Poly(oxymethylene) dimethyl ethers as components of tailored diesel fuel: Properties, synthesis and purification concepts. Fuel 2010, 89, 3315–3319. [Google Scholar] [CrossRef]
  16. Iannuzzi, S.E.; Barro, C.; Boulouchos, K.; Burger, J. POMDME-diesel blends: Evaluation of performance and exhaust emissions in a single cylinder heavy-duty diesel engine. Fuel 2017, 203, 57–67. [Google Scholar] [CrossRef]
  17. Omari, A.; Heuser, B.; Pischinger, S. Potential of oxymethylenether-diesel blends for ultra-low emission engines. Fuel 2017, 209, 232–237. [Google Scholar] [CrossRef]
  18. Bjørgen, K.O.P.; Emberson, D.R.; Løvås, T. Combustion and soot characteristics of hydrotreated vegetable oil compression-ignited spray flames. Fuel 2020, 266, 116942. [Google Scholar] [CrossRef]
  19. Marchitto, L.; Merola, S.S.; Tornatore, C.; Valentino, G. An Experimental Investigation of Alcohol/Diesel Fuel Blends on Combustion and Emissions in a Single-Cylinder Compression Ignition Engine; SAE Technical Paper 2016-01-0738; SAE: Warrendale, PA, USA, 2016. [Google Scholar] [CrossRef]
  20. Engine Combustion Network | Engine Combustion Network Website. Available online: https://ecn.sandia.gov/ (accessed on 14 July 2020).
  21. Payri, R.; Gimeno, J.; Bardi, M.; Plazas, A.H. Study liquid length penetration results obtained with a direct acting piezo electric injector. Appl. Energy 2013, 106, 152–162. [Google Scholar] [CrossRef] [Green Version]
  22. Crusius, S.; Müller, M.; Stein, H.; Goral, T. Oxy-methylen-di-methylether (OMEx) as an alternative for diesel fuel and blend compound: Properties, additizing and compatibility with fossil and renewable fuels. In Proceedings of the 12th International Colloquium Fuels-Conventional and Future Energy for Automobiles, Esslingen, Germany, 25 June 2019; p. 8. [Google Scholar]
  23. Benajes, J.; Payri, R.; Bardi, M.; Martí-Aldaraví, P. Experimental characterization of diesel ignition and lift-off length using a single-hole ECN injector. Appl. Ther. Eng. 2013, 58, 554–563. [Google Scholar] [CrossRef] [Green Version]
  24. Xuan, T.; Desantes, J.M.; Pastor, J.V.; Garcia-Oliver, J.M. Soot temperature characterization of spray a flames by combined extinction and radiation methodology. Combust. Flame 2019, 204, 290–303. [Google Scholar] [CrossRef]
  25. Settles, G.S. Schlieren and Shadowgraph Techniques: Visualizing Phenomena in Transparent Media; Springer Science & Business Media: Berlin/Heidelberg, Germany, 2012; ISBN 978-3-642-56640-0. [Google Scholar]
  26. Pastor, J.V.; Payri, R.; Garcia-Oliver, J.M.; Briceño, F.J. Schlieren Methodology for the Analysis of Transient Diesel Flame Evolution. SAE Int. J. Engines 2013, 6, 1661–1676. [Google Scholar] [CrossRef] [Green Version]
  27. Pastor, J.V.; García, A.; Micó, C.; García-Carrero, A.A. Experimental study of influence of Liquefied Petroleum Gas addition in Hydrotreated Vegetable Oil fuel on ignition delay, flame lift off length and soot emission under diesel-like conditions. Fuel 2020, 260, 116377. [Google Scholar] [CrossRef]
  28. Reyes, M.; Tinaut, F.V.; Giménez, B.; Pastor, J.V. Effect of hydrogen addition on the OH* and CH* chemiluminescence emissions of premixed combustion of methane-air mixtures. Int. J. Hydrogen Energy 2018, 43, 19778–19791. [Google Scholar] [CrossRef]
  29. Siebers, D.; Higgins, B. Flame Lift-Off on Direct-Injection Diesel Sprays Under Quiescent Conditions. SAE Trans. 2001, 110, 400–421. [Google Scholar]
  30. Xuan, T.; Pastor, J.V.; García-Oliver, J.M.; García, A.; He, Z.; Wang, Q.; Reyes, M. In-flame soot quantification of diesel sprays under sooting/non-sooting critical conditions in an optical engine. Appl. Ther. Eng. 2019, 149, 1–10. [Google Scholar] [CrossRef]
  31. Choi, M.Y.; Mulholland, G.W.; Hamins, A.; Kashiwagi, T. Comparisons of the soot volume fraction using gravimetric and light extinction techniques. Combust. Flame 1995, 102, 161–169. [Google Scholar] [CrossRef]
  32. Li, D.; He, Z.; Xuan, T.; Zhong, W.; Cao, J.; Wang, Q.; Wang, P. Simultaneous capture of liquid length of spray and flame lift-off length for second-generation biodiesel/diesel blended fuel in a constant volume combustion chamber. Fuel 2017, 189, 260–269. [Google Scholar] [CrossRef]
  33. Lequien, G.; Berrocal, E.; Gallo, Y.; Themudo e Mello, A.; Andersson, O.; Johansson, B. Effect of Jet-Jet Interactions on the Liquid Fuel Penetration in an Optical Heavy-Duty DI Diesel Engine, SAE Technical Paper 2013-01-1615; SAE: Warrendale, PA, USA, 2013. [CrossRef]
  34. Kook, S.; Pickett, L.M. Liquid length and vapor penetration of conventional, Fischer–Tropsch, coal-derived, and surrogate fuel sprays at high-temperature and high-pressure ambient conditions. Fuel 2012, 93, 539–548. [Google Scholar] [CrossRef]
  35. Payri, R.; Salvador, F.J.; Manin, J.; Viera, A. Diesel ignition delay and lift-off length through different methodologies using a multi-hole injector. Appl. Energy 2016, 162, 541–550. [Google Scholar] [CrossRef] [Green Version]
  36. Pickett, L.M.; Siebers, D.L. Orifice Diameter Effects on Diesel Fuel Jet Flame Structure. J. Eng. Gas Turbines Power 2005, 127, 187–196. [Google Scholar] [CrossRef]
  37. Pastor, J.V.; García-Oliver, J.M.; López, J.J.; Vera-Tudela, W. An experimental study of the effects of fuel properties on reactive spray evolution using Primary Reference Fuels. Fuel 2016, 163, 260–270. [Google Scholar] [CrossRef]
  38. Pickett, L.M.; Siebers, D.L. Non-Sooting, Low Flame Temperature Mixing-Controlled DI Diesel Combustion, SAE Technical Paper 2004-01-1399; SAE: Warrendale, PA, USA, 2004. [CrossRef] [Green Version]
  39. Aatola, H.; Larmi, M.; Sarjovaara, T.; Mikkonen, S. Hydrotreated Vegetable Oil (HVO) as a Renewable Diesel Fuel: Trade-off between NOx, Particulate Emission, and Fuel Consumption of a Heavy Duty Engine. SAE Int. J. Engines 2008, 1, 1251–1262. [Google Scholar] [CrossRef] [Green Version]
  40. Marinov, N.M.; Pitz, W.J.; Westbrook, C.K.; Vincitore, A.M.; Castaldi, M.J.; Senkan, S.M.; Melius, C.F. Aromatic and Polycyclic Aromatic Hydrocarbon Formation in a Laminar Premixed n-Butane Flame. Combust. Flame 1998, 114, 192–213. [Google Scholar] [CrossRef]
Figure 1. Optical arrangement for the first set up (top) and second setup (bottom).
Applsci 10 05460 g001
Figure 2. KL profile on the spray axis for diesel at nominal case in the time instant 3500 µs.
Applsci 10 05460 g002
Figure 3. Total soot mass for the diesel at nominal condition.
Applsci 10 05460 g003
Figure 4. Liquid length for 15% O2 and 1500 bar of injection pressure.
Applsci 10 05460 g004
Figure 5. Comparison between ignition delay measured from schlieren and from OH* chemiluminescence images.
Applsci 10 05460 g005
Figure 6. Comparison between ignition delay of diesel and the ignition delay for the other fuels tested.
Applsci 10 05460 g006
Figure 7. Comparison between lift-off length (LOL) of diesel and the other fuels tested.
Applsci 10 05460 g007
Figure 8. Spray tip penetration and lift-off length at 900 K 15% O2 and 1500 bar (Spray A condition by ECN). Vertical dashed lines represent ignition delay.
Applsci 10 05460 g008
Figure 9. Flame penetration at 900 K and 1500 bar. The solid lines correspond to 15% of Oxygen and dotted lines to 21%.
Applsci 10 05460 g009
Figure 10. Flame images from OH* chemiluminescence for all fuels at the nominal operating condition at 3500 µs ASOI.
Applsci 10 05460 g010
Figure 11. Comparison of ignition delay (ID) obtained in the first set and in the second one.
Applsci 10 05460 g011
Figure 12. Accumulated KL map at the operating condition with the greatest tendency to soot formation (1000 K of temperature, 500 bar of injection pressure and 15% of O2).
Applsci 10 05460 g012
Figure 13. Influence of the variation of injection pressure, temperature and oxygen concentration on the total soot mass.
Applsci 10 05460 g013
Table 1. Fuel properties.
Characteristic [unit]DieselDodecaneHVOOME1OMEx
Density [kg/m3] (T= 15 °C)835.20751.20779.10866.701057.10
Viscosity [mm2/s] (T= 40 °C)2.801.442.700.361.08
Cetane number [–]54.187475.52868.6
Lubricity [µm]386563316747320
Flash point [°C]-8370<4065
Lower heating value [MJ/kg]39.7944.2043.9019.2519.21
Initial Boiling Point [°C]155.10214.00185.5037.40144.90
Final Boiling Point [°C]363.121830238242.4
Total contamination [mg/kg]<24-6.0<1<1
Carbon content [% m/m]85.3 8485.748.444.2
Hydrogen Content [% m/m]13.4 1614.310.48.8
Oxygen content [% m/m]00042.145
(A/F)st at 21% of O214.3914.92:114.55:17.22:15.89:1
(A/F)st at 15% of O219.9820.72:120.20:1-10.03:18.18:1
Table 2. Composition of OMEx used in this study.
MoleculeContent (wt%)
OME10.01
OME2<0.01
OME357.90
OME428.87
OME510.08
OME61.91
Table 3. Variation of parameters to evaluate for each fuel.
Oxygen Concentration (%)Temperature [K]Injection Pressure [bar]
15
21
800
900
1000
500
1000
1500
Table 4. Comparison of main spray parameters between database available in the ECN [20] and current work for dodecane under Spray A conditions (900 K, 1500 bar and 15% O2).
ParameterCurrent WorkCMT
(2012)
SNL
(2017)
TU/e
(2012)
IFPEn
(2012)
CAT
(2010)
LL [mm]10.010.89.60-118.67
ID [ms]0.4050.4350.4280.410.4-
LOL [mm]18.8917.7317.6615.814.516.1

