Feasibility of Low-Cost Thermal Imaging for Monitoring Water Stress in Young and Mature Sweet Cherry Trees

 , , ,
, , ,
Abstract
:1. Introduction
2. Materials and Methods
2.1. Study Site
2.2. Treatments
2.3. Field Data
2.4. Statistical Analysis
3. Results and Discussion
3.1. Environmental Conditions
3.2. Midday Stem Water Potential
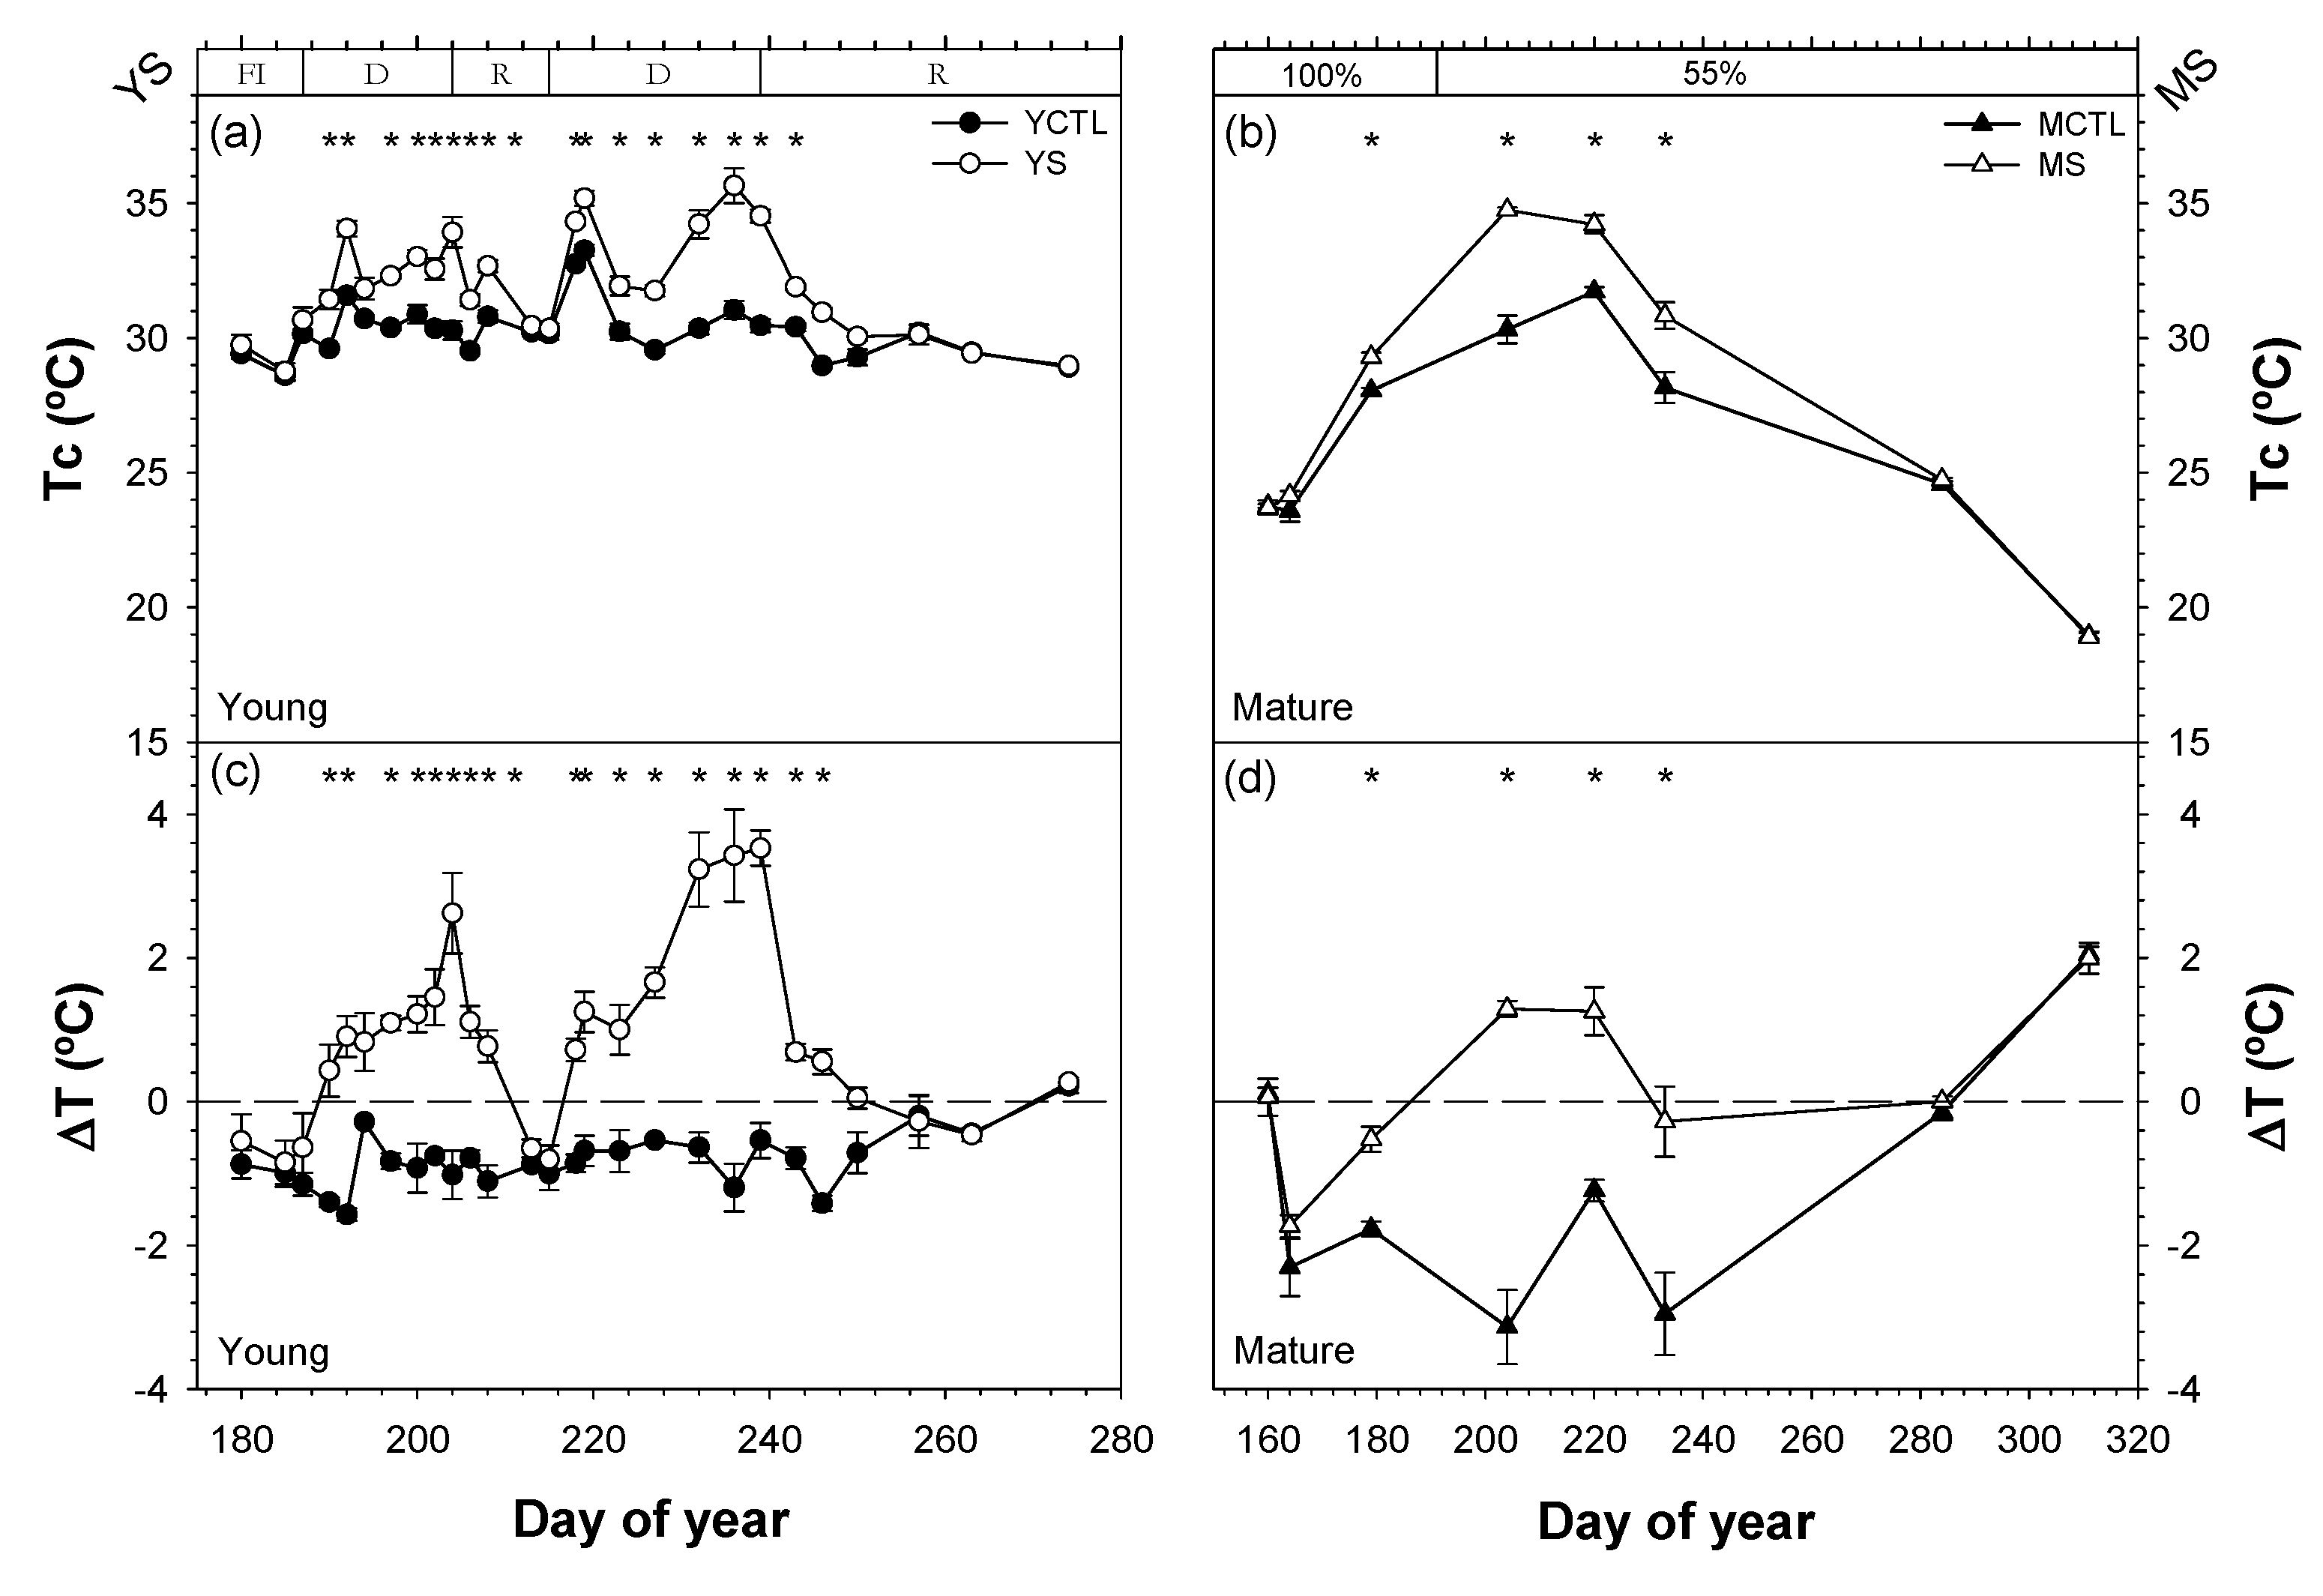
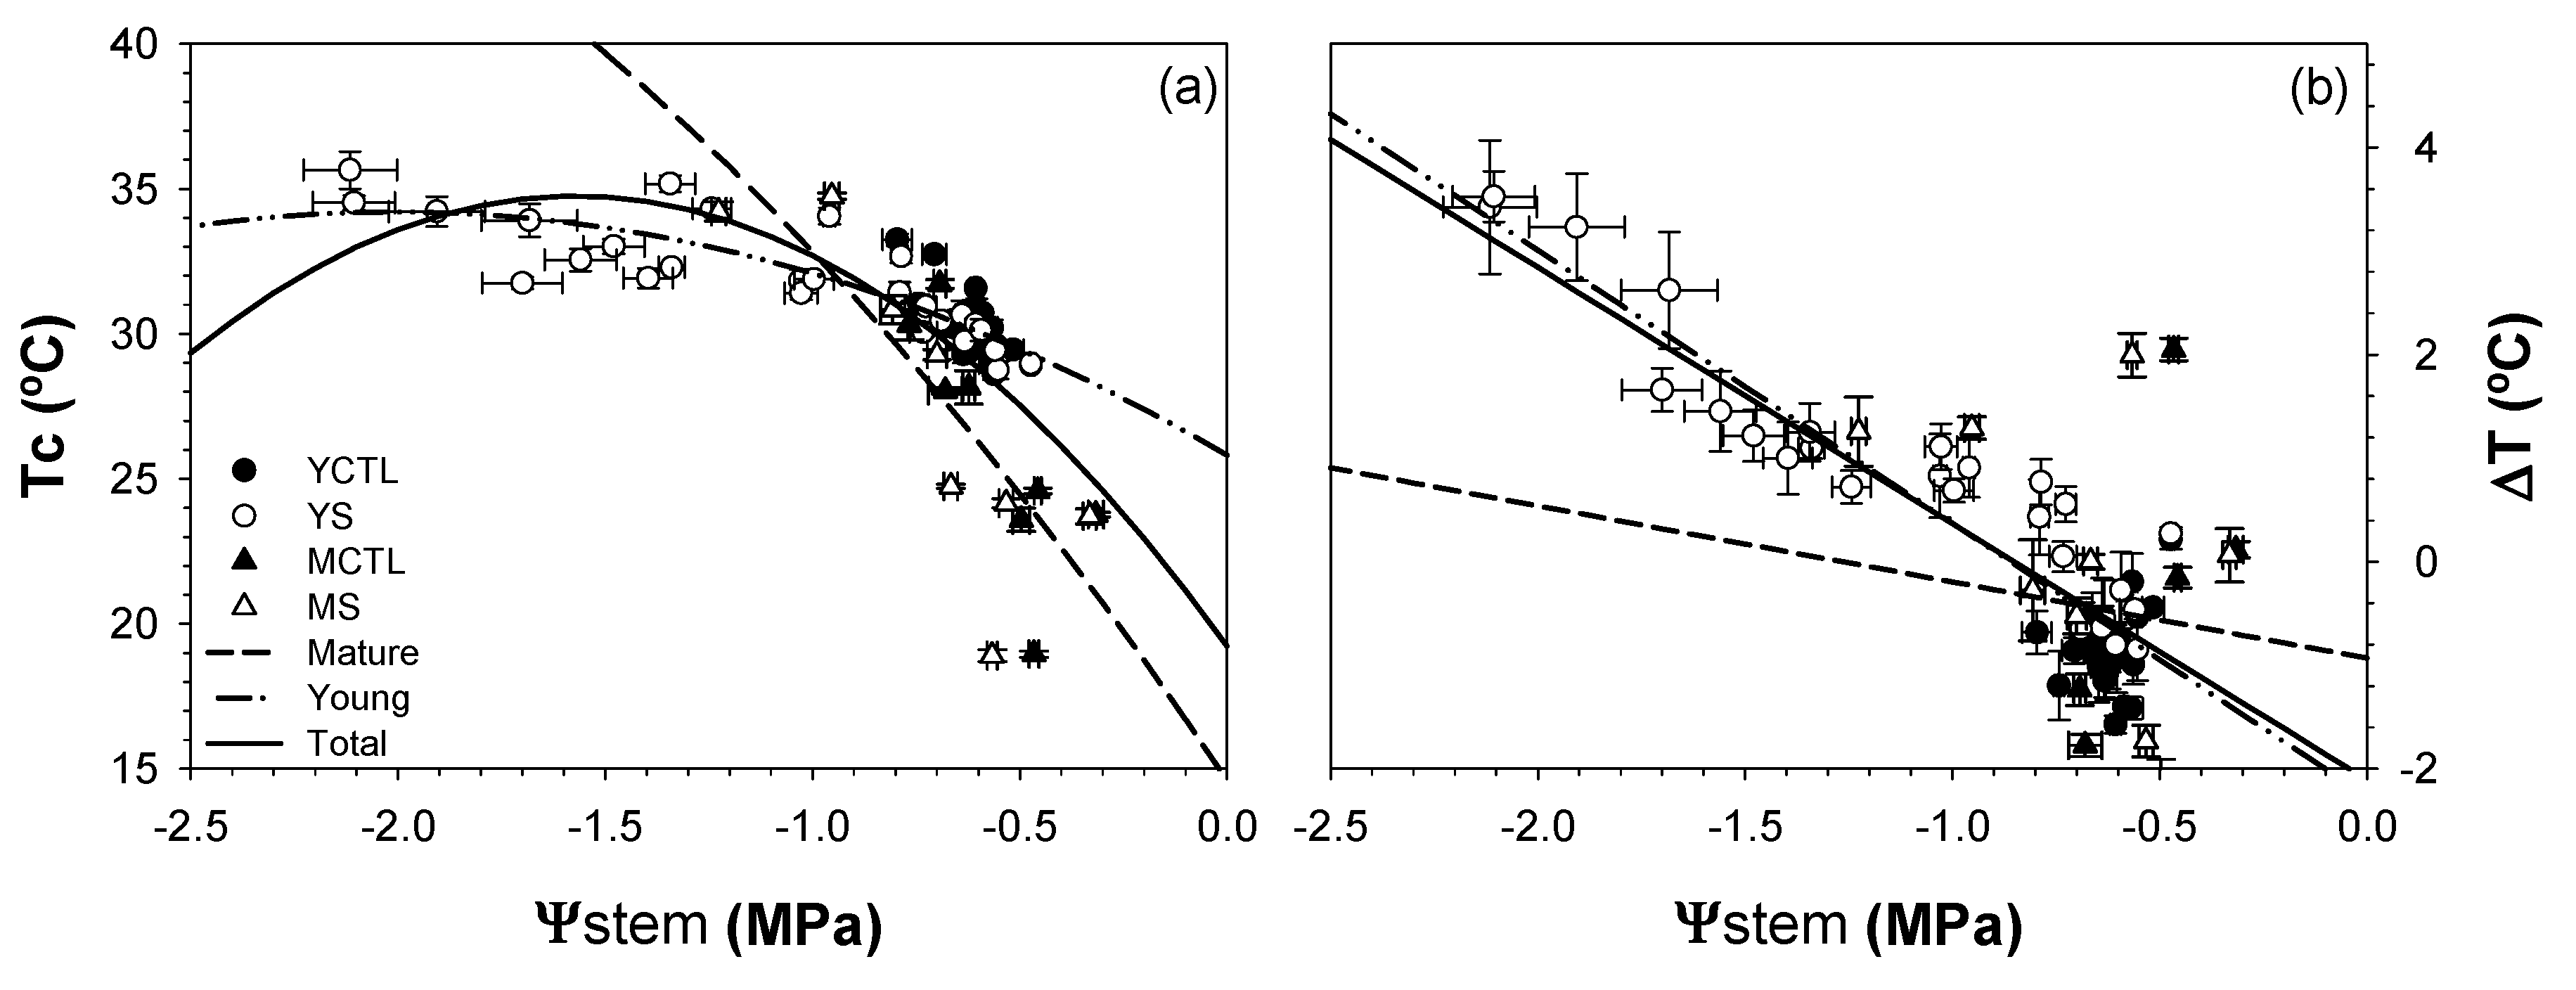
3.3. Canopy Temperature
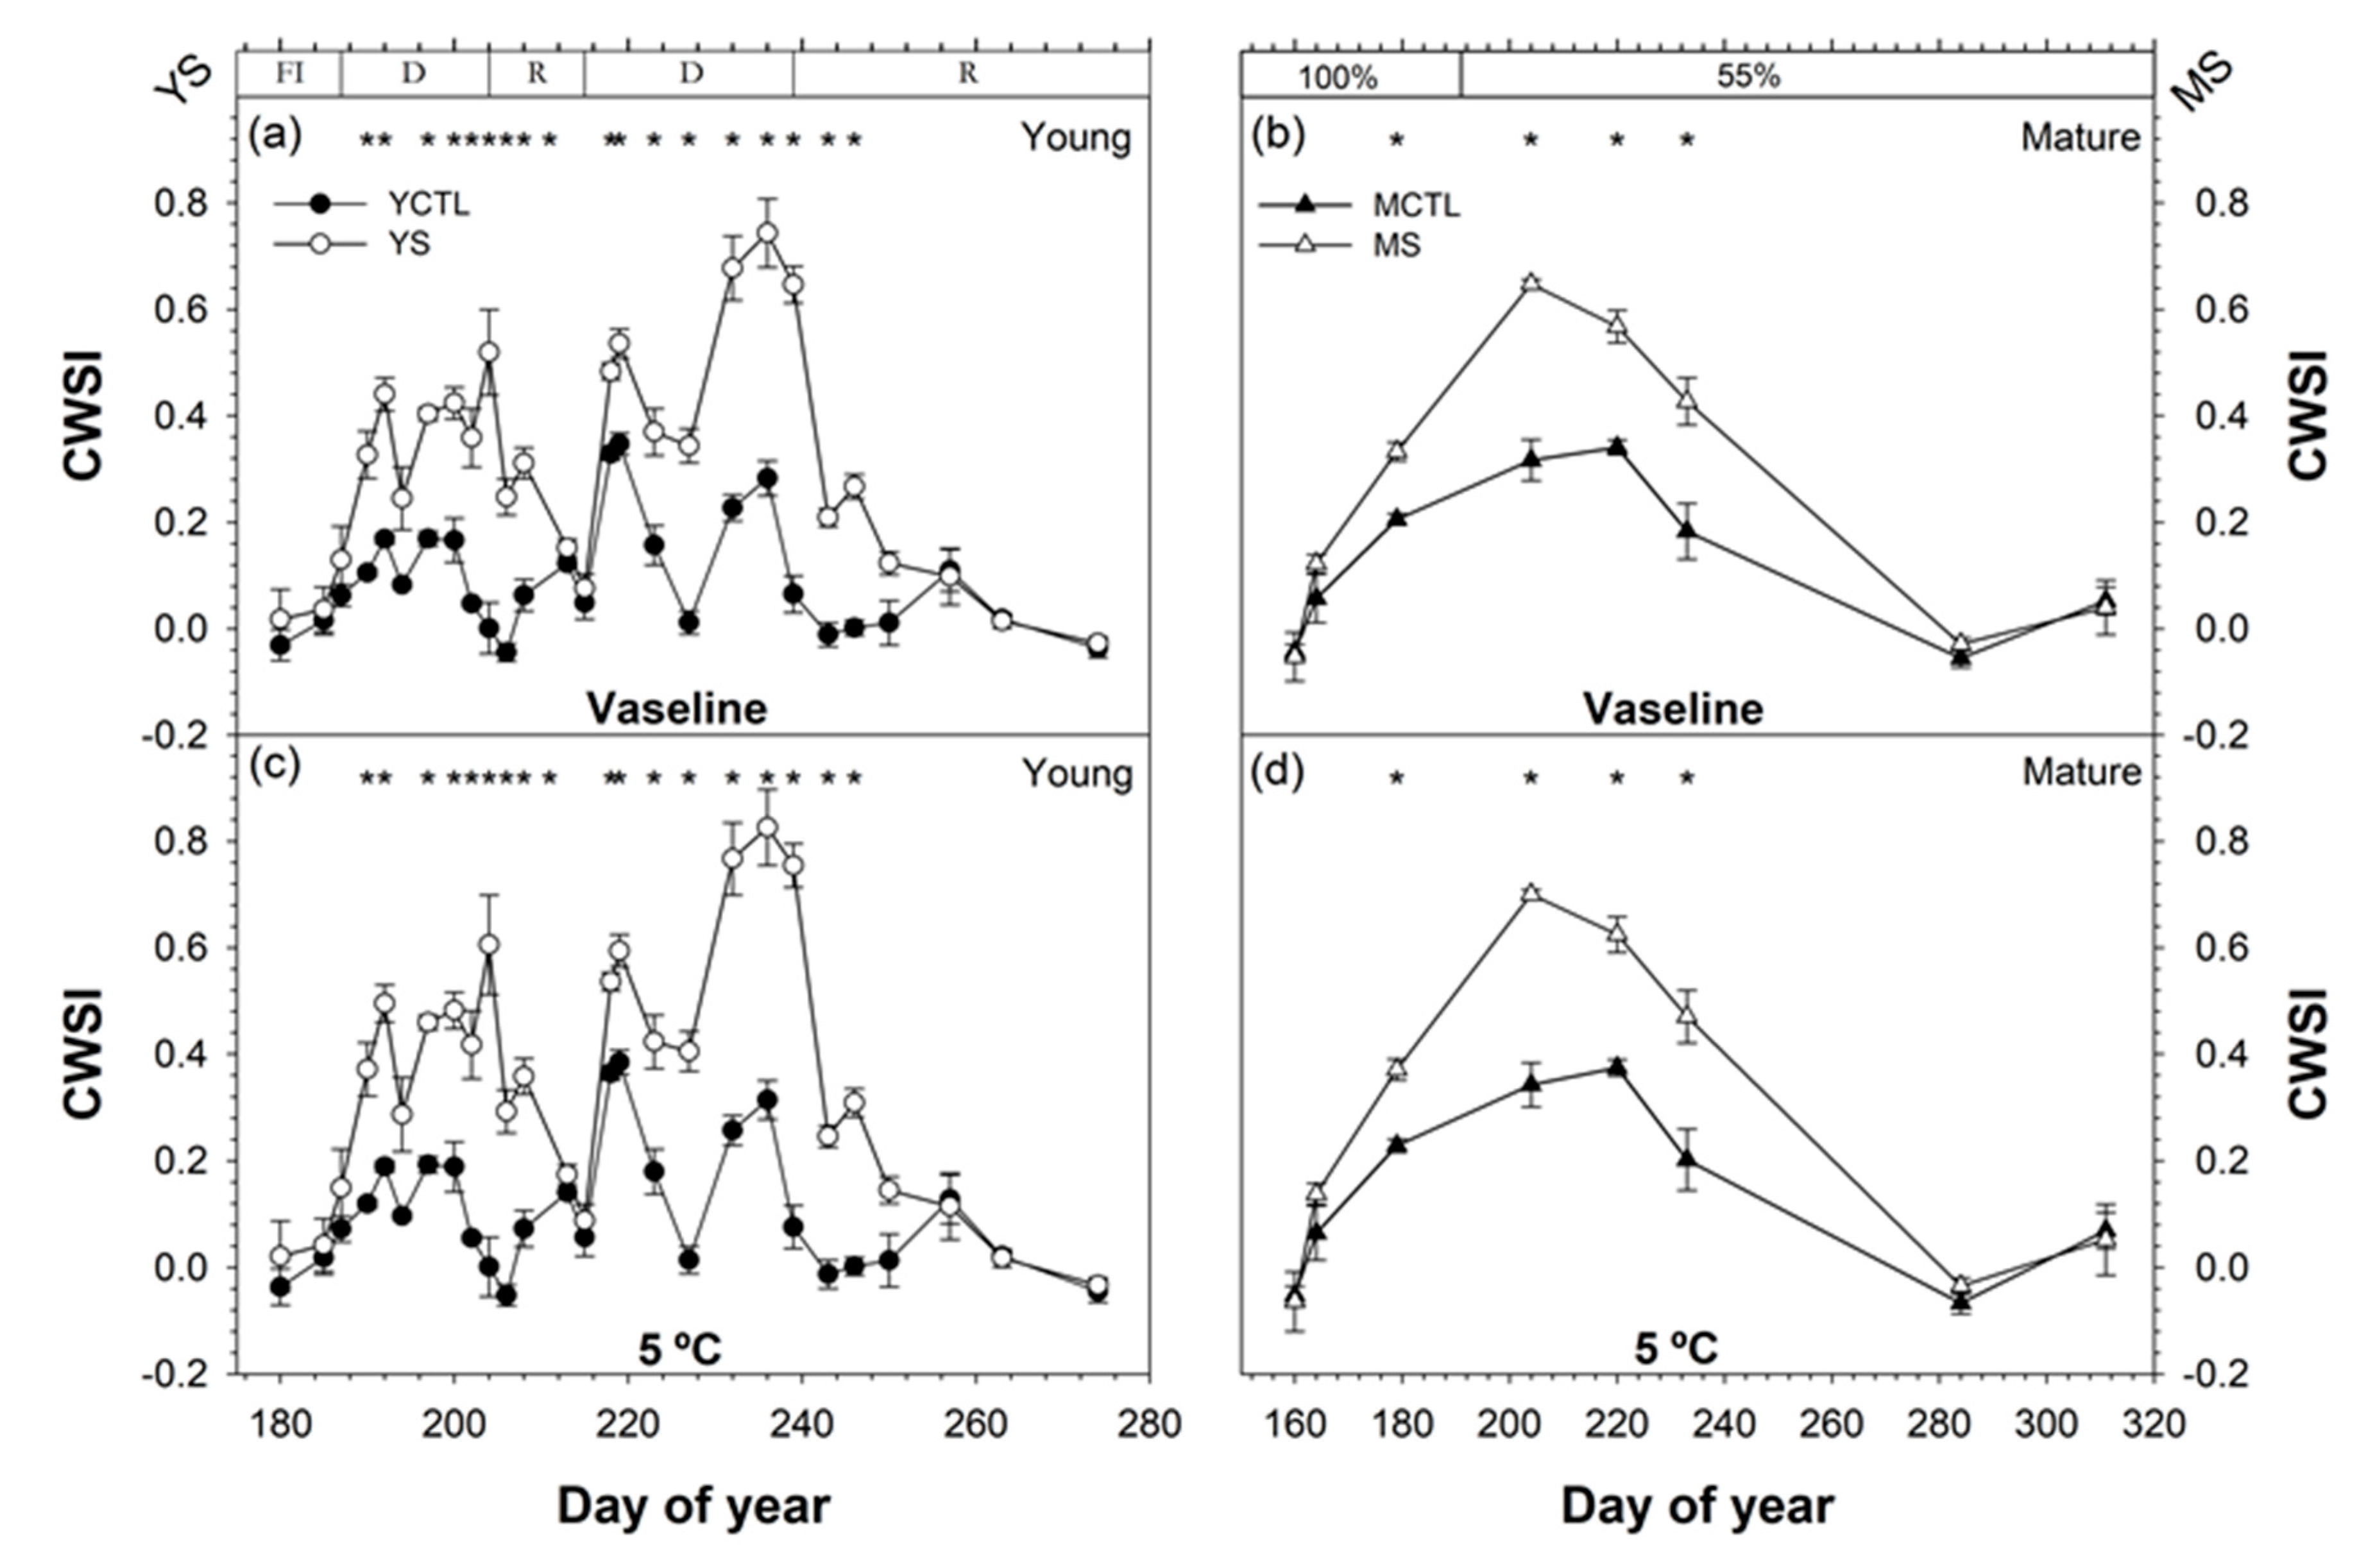
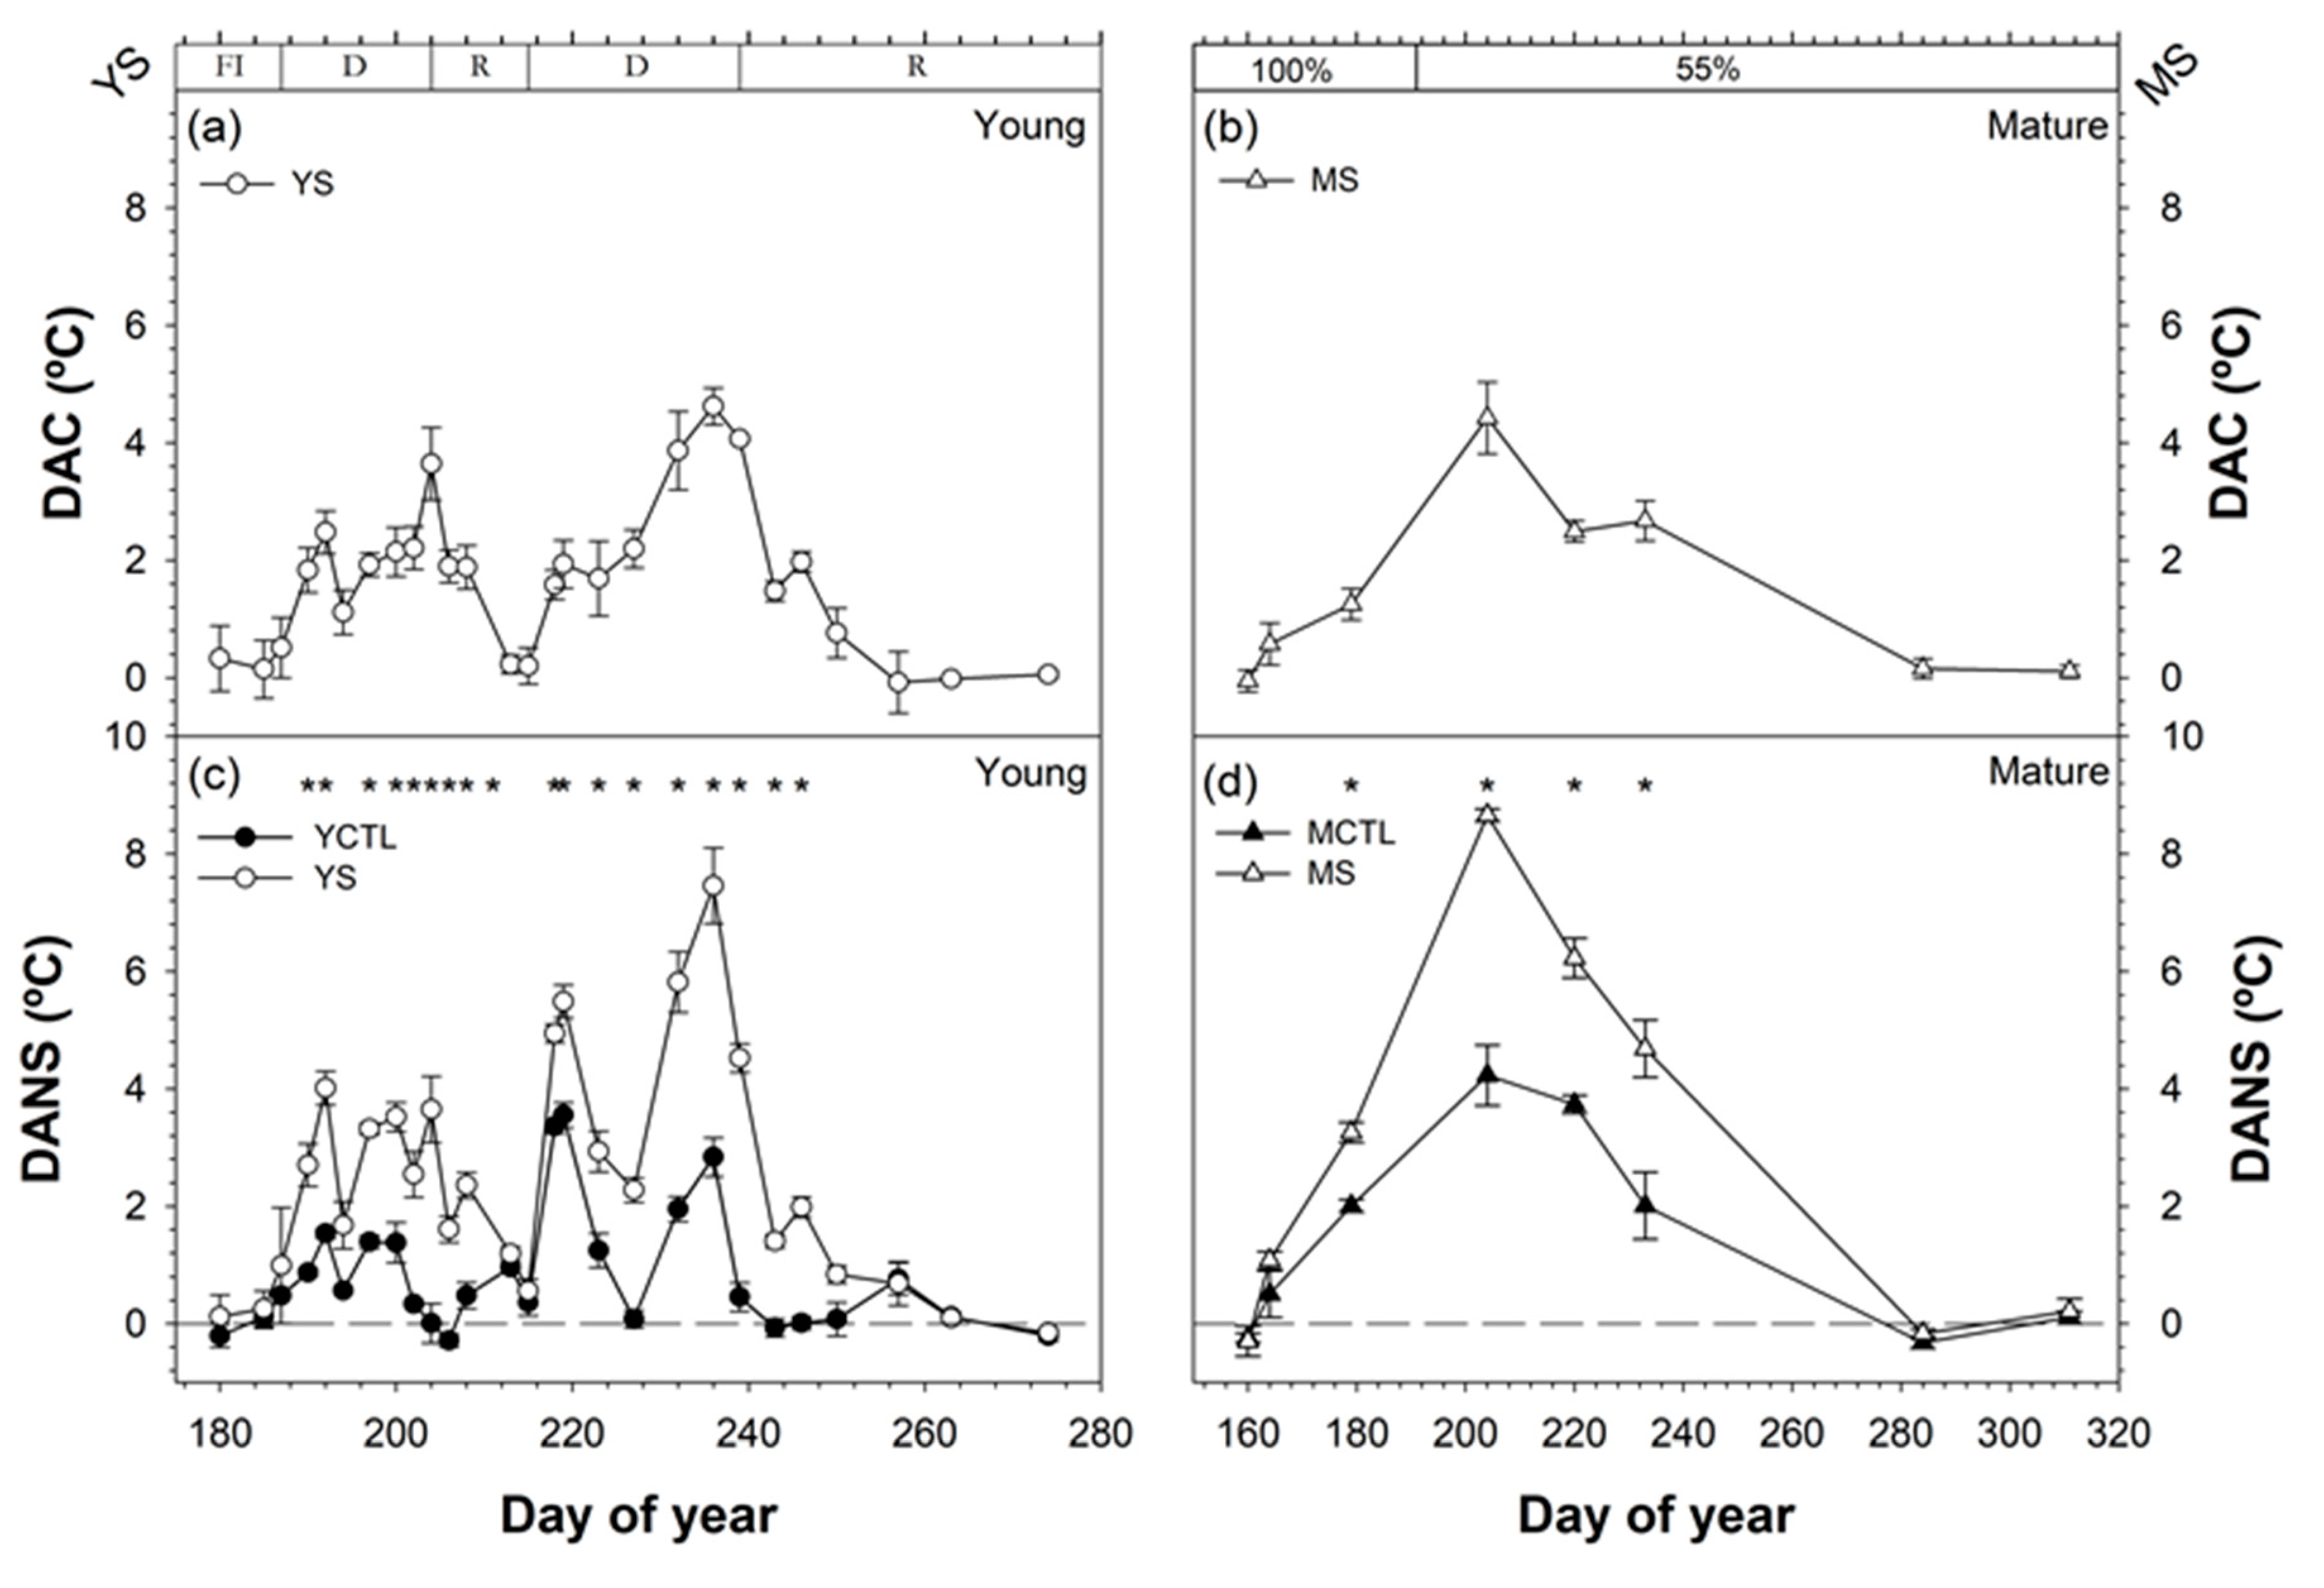
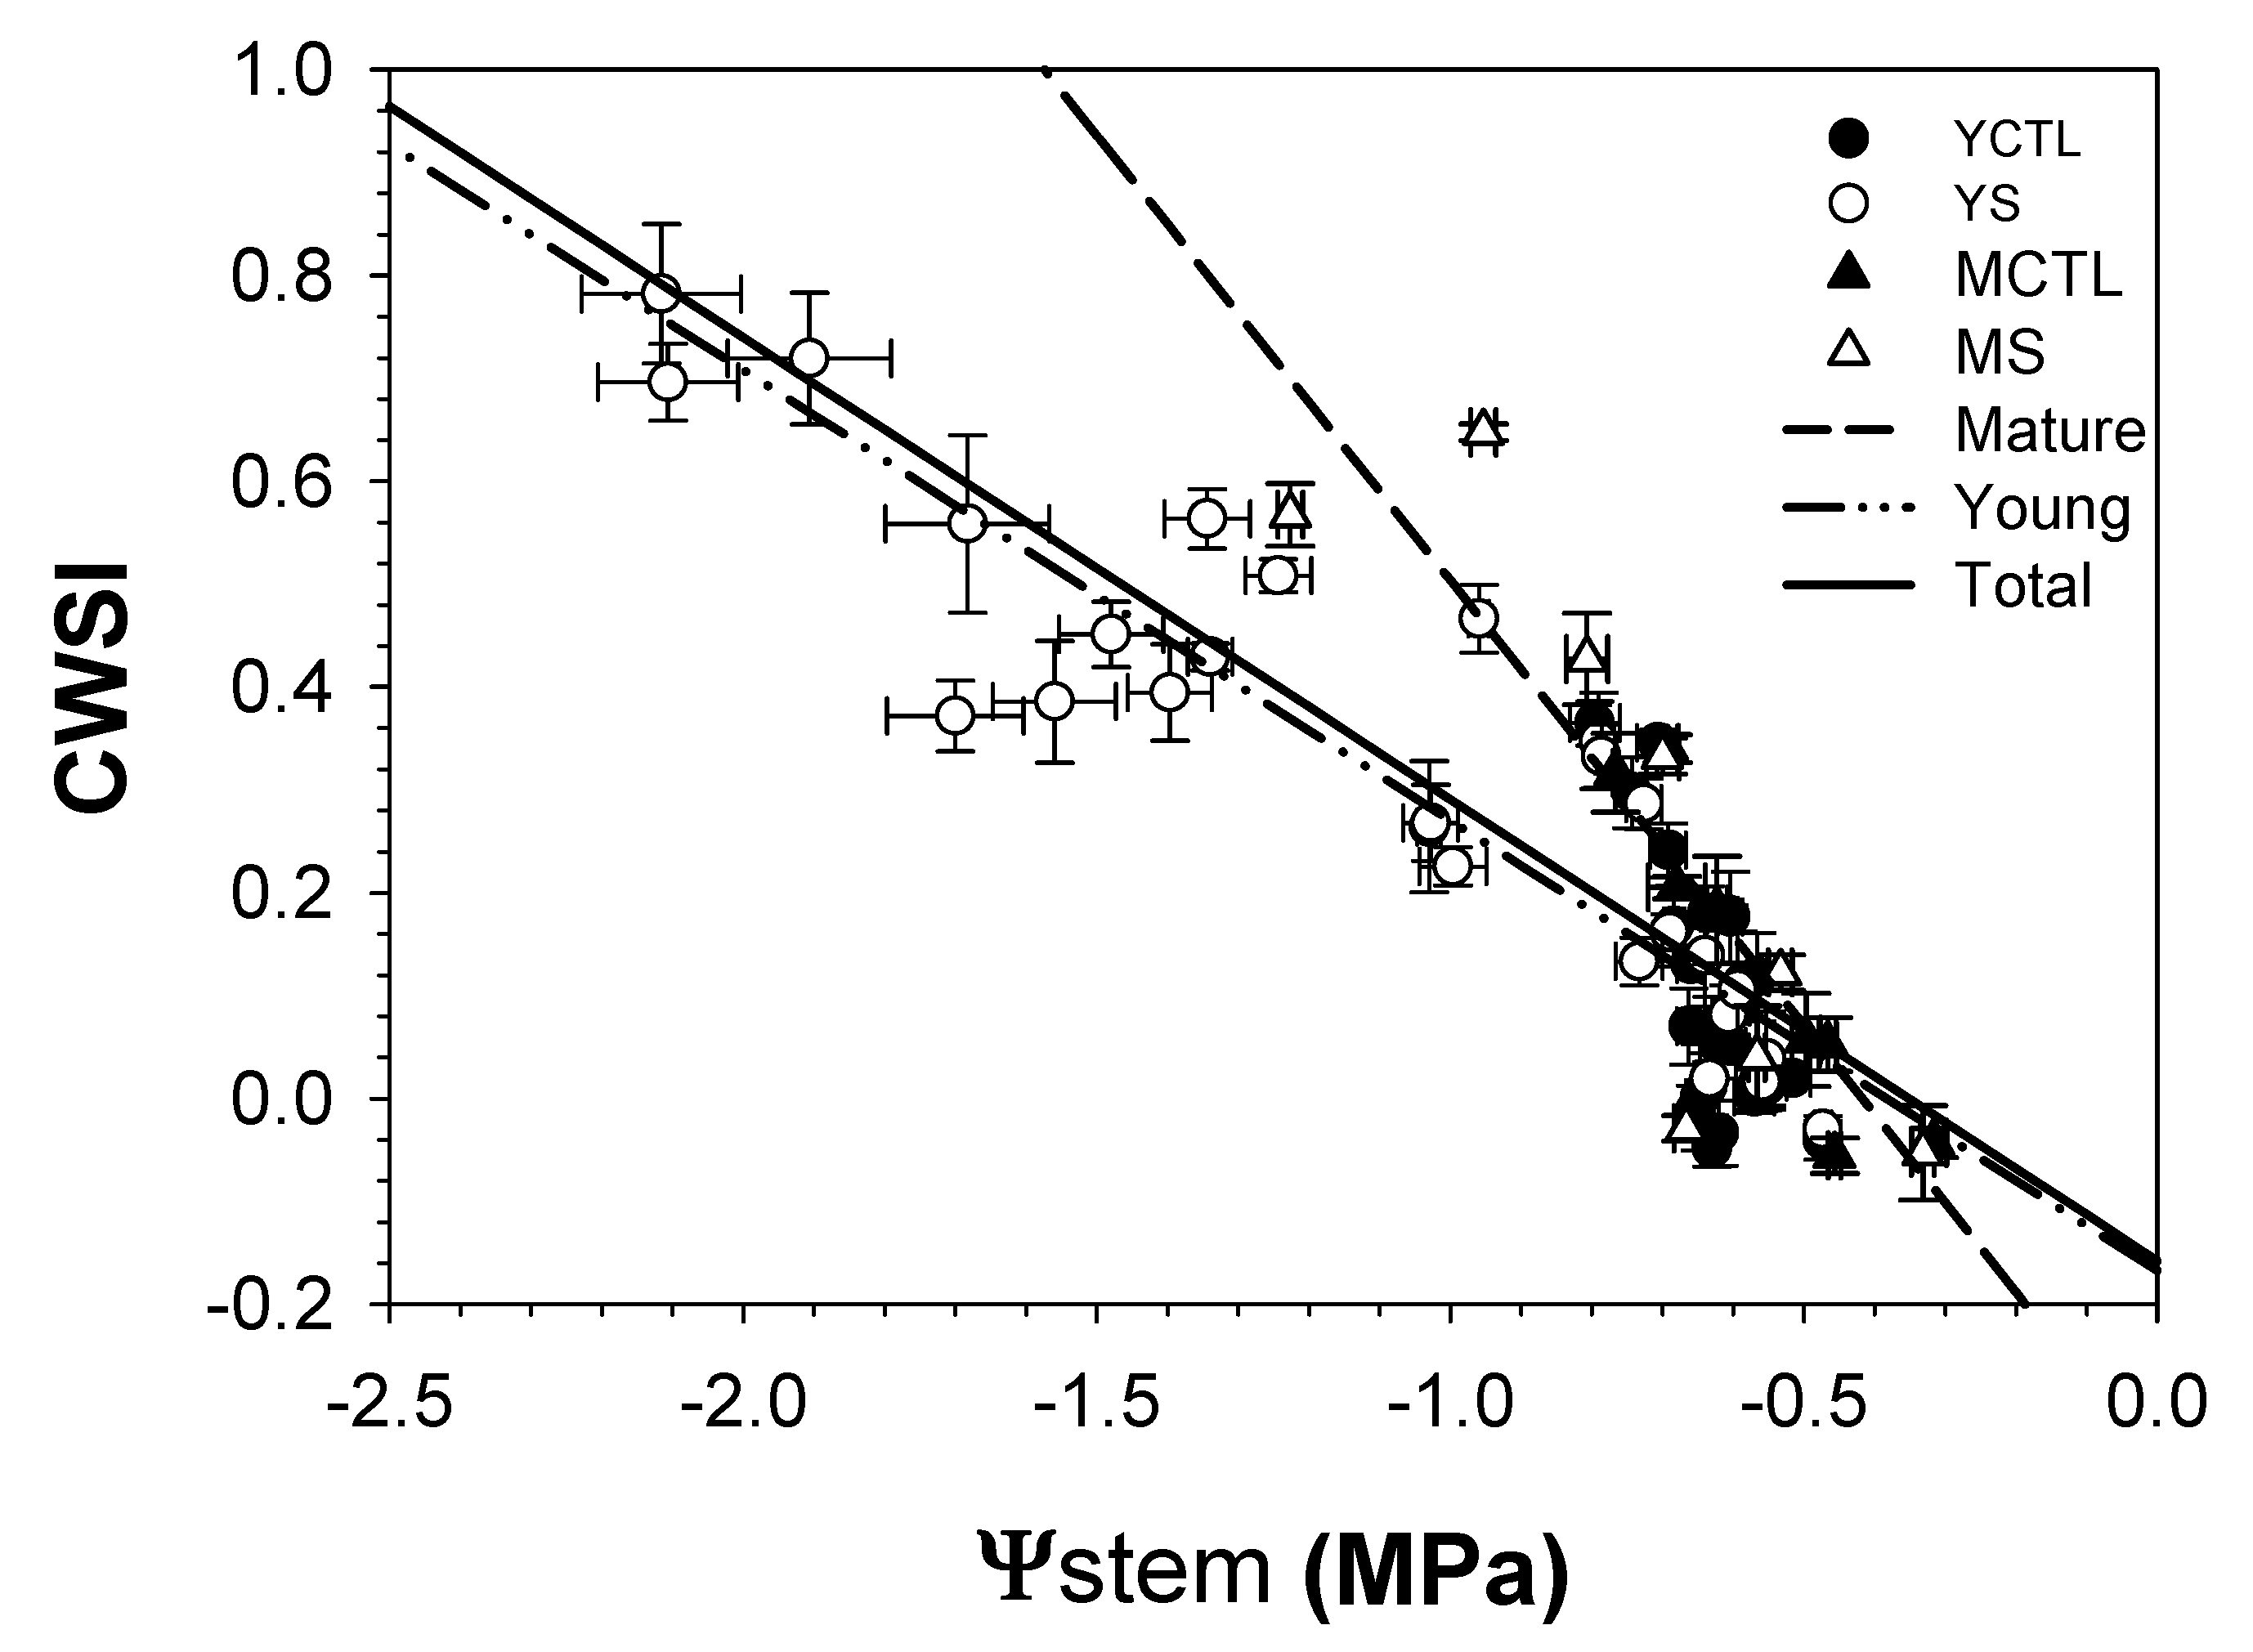
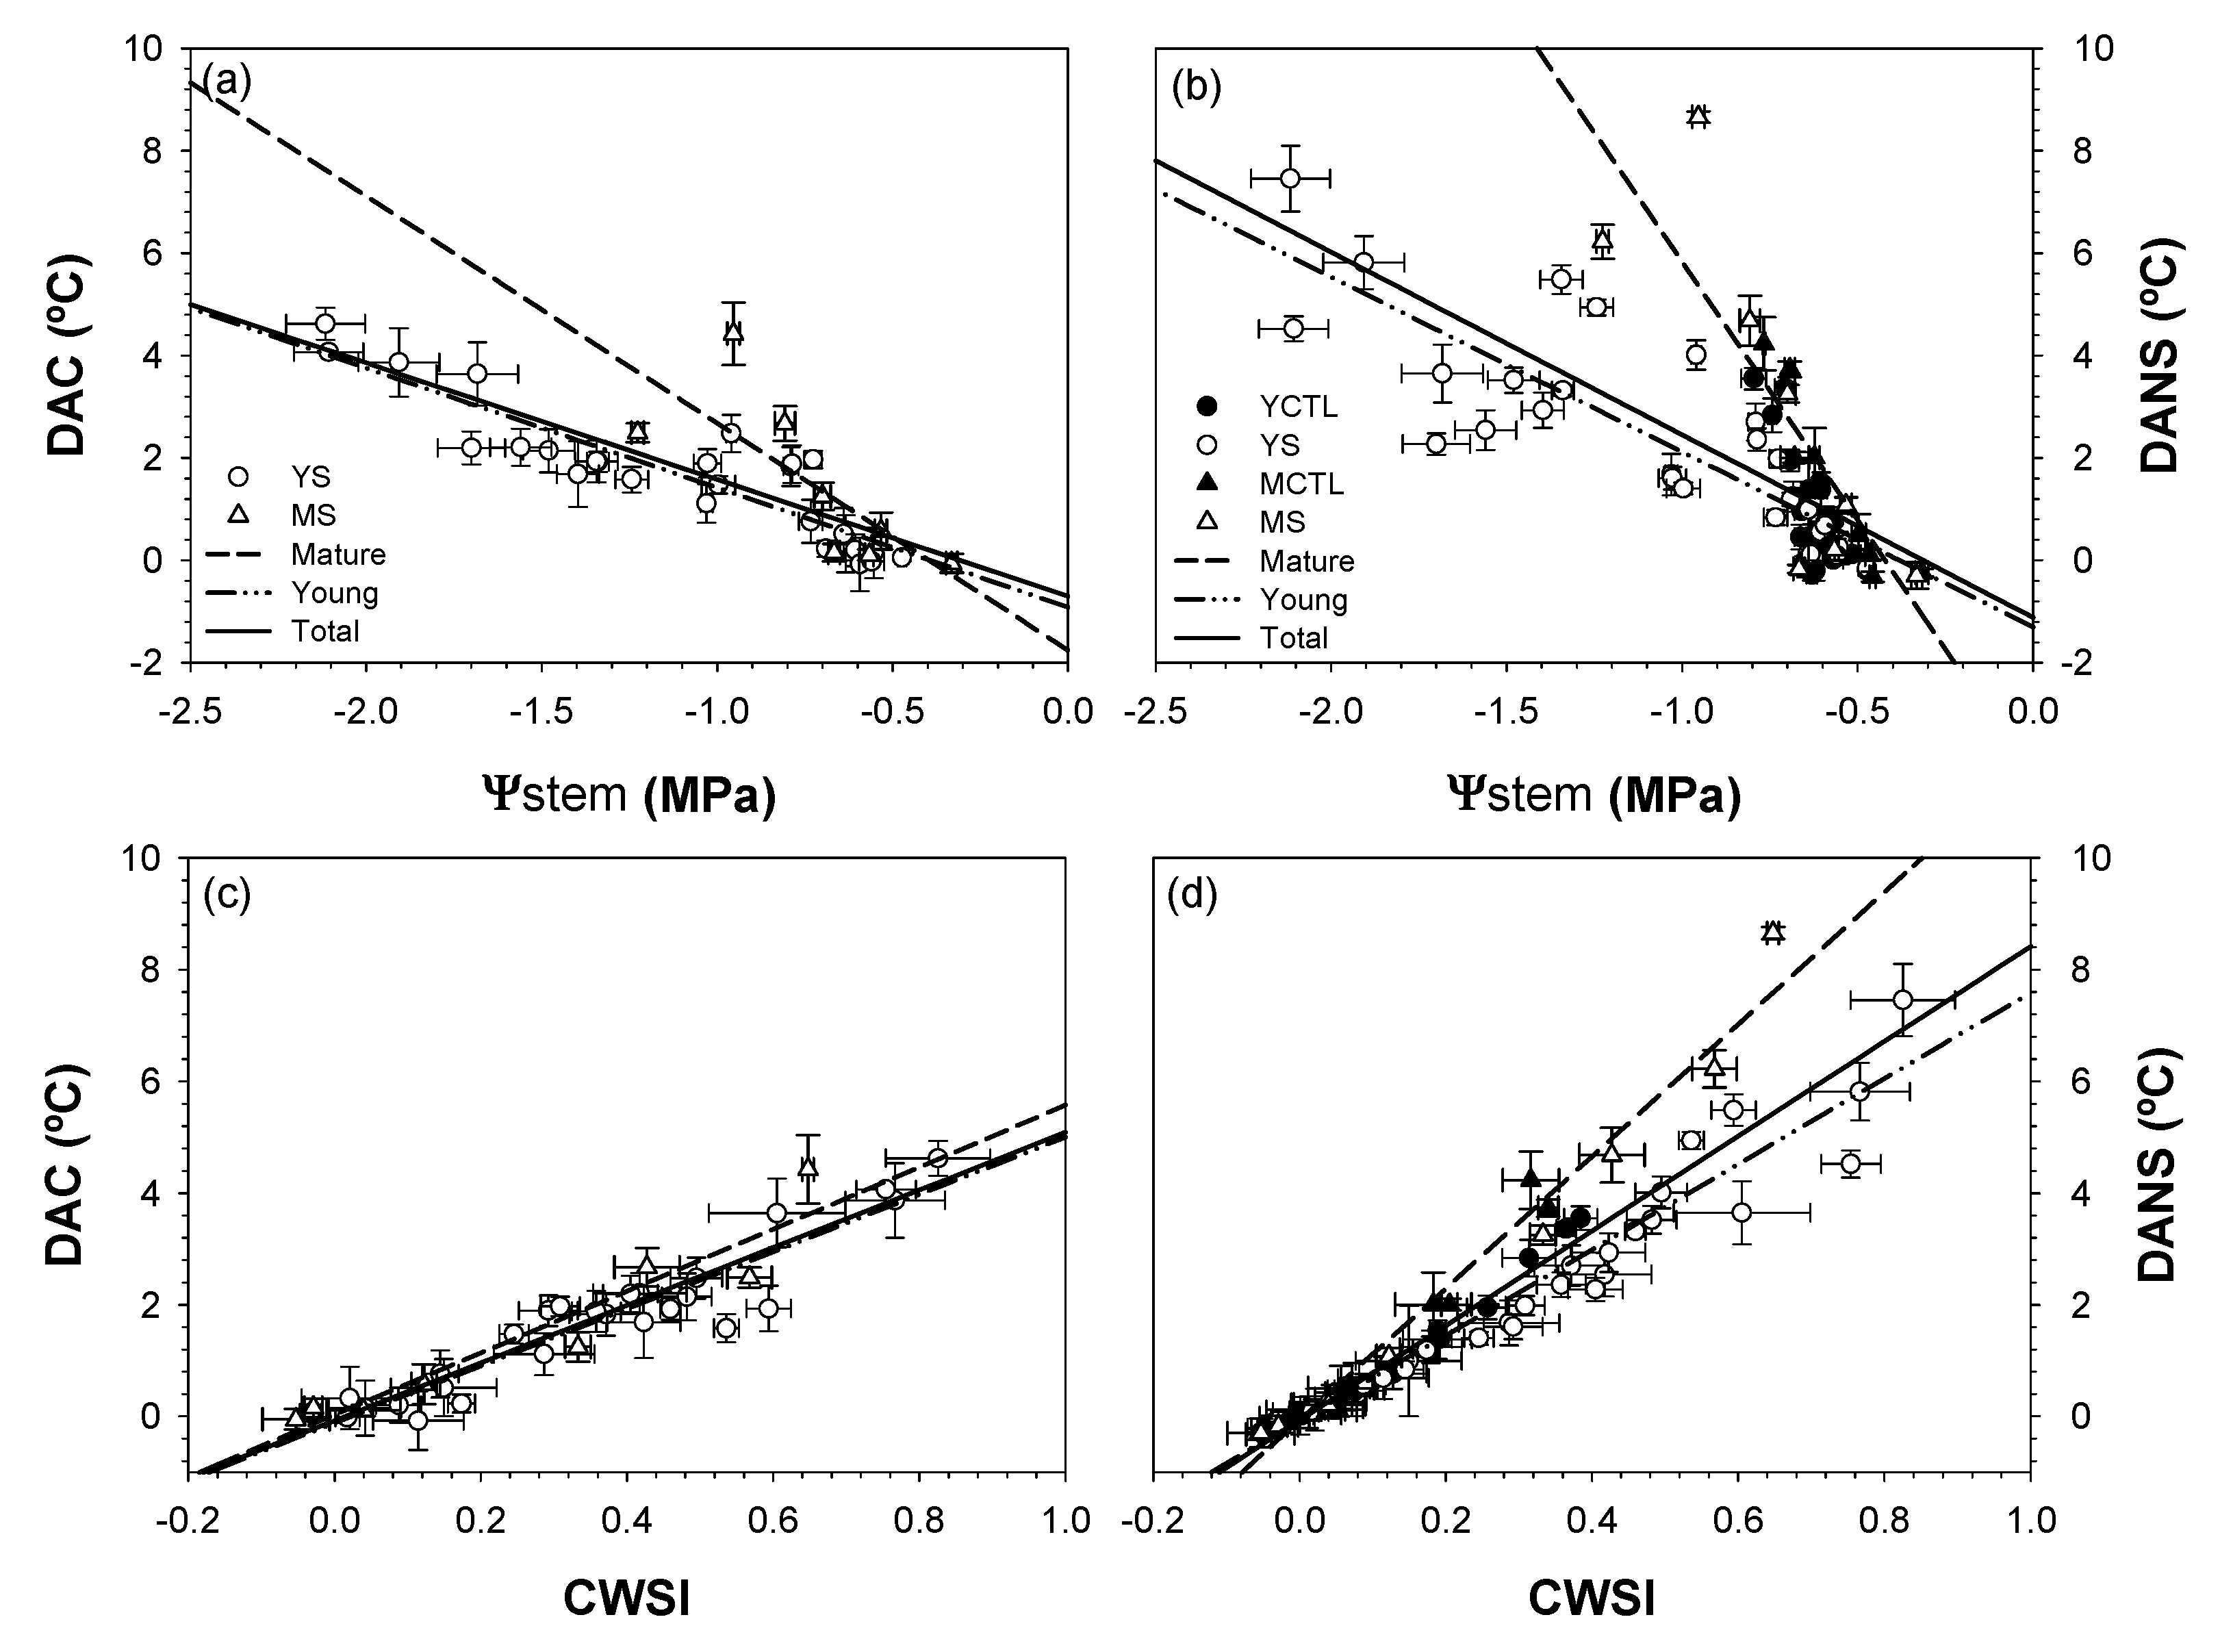
3.4. Crop Water Stress Index and Degrees above Non-Stress
4. Conclusions
Author Contributions
Funding
Acknowledgments
Conflicts of Interest
References
- Fereres, E.; Soriano, M.A. Deficit irrigation for reducing agricultural water use. J. Exp. Bot. 2007, 58, 147–159. [Google Scholar] [CrossRef] [PubMed] [Green Version]
- García-Tejero, I.F.; Gutiérrez-Gordillo, S.; Ortega-Arévalo, C.; Iglesias-Contreras, M.; Moreno, J.M.; Souza-Ferreira, L.; Durán-Zuazo, V.H. Thermal imaging to monitor the crop-water status in almonds by using the non-water stress baselines. Sci. Hortic. 2018, 238, 91–97. [Google Scholar] [CrossRef]
- Ruiz-Sánchez, M.C.; Domingo, R.; Castel, J. Review. Deficit irrigation in fruit trees and vines in Spain. Span. J. Agric. Res. 2010, 8, 5–20. [Google Scholar] [CrossRef] [Green Version]
- EUROSTAT. Structure of Orchards in 2017; Newsrelease 32/2019; Eurostat Press Office: Luxembourg City, Luxembourg, 2019. [Google Scholar]
- Blanco, V.; Torres-Sánchez, R.; Blaya-Ros, P.J.; Pérez-Pastor, A.; Domingo, R. Vegetative and reproductive response of ‘Prime Giant’ sweet cherry trees to regulated deficit irrigation. Sci. Hortic. 2019, 249, 478–489. [Google Scholar] [CrossRef]
- Marsal, J.; Lopez, G.; del Campo, J.; Mata, M.; Arbones, A.; Girona, J. Postharvest regulated deficit irrigation in “Summit” sweet cherry: Fruit yield and quality in the following season. Irrig. Sci. 2010, 28, 181–189. [Google Scholar] [CrossRef]
- Blanco, V.; Martínez-Hernández, G.B.; Artés-Hernández, F.; Blaya-Ros, P.J.; Torres-Sánchez, R.; Domingo, R. Water relations and quality changes throughout fruit development and shelf life of sweet cherry grown under regulated deficit irrigation. Agric. Water Manag. 2019, 217, 243–254. [Google Scholar] [CrossRef]
- Blanco, V.; Domingo, R.; Pérez-Pastor, A.; Blaya-Ros, P.J.; Torres-Sánchez, R. Soil and plant water indicators for deficit irrigation management of field-grown sweet cherry trees. Agric. Water Manag. 2018, 208, 83–94. [Google Scholar] [CrossRef]
- Shackel, K.A.; Ahmadi, H.; Biasi, W.; Buchner, R.; Goldhamer, D.; Gurusinghe, S.; Hasey, J.; Kester, D.; Krueger, B.; Lampinen, B.; et al. Plant water status as an index of irrigation need in deciduous fruit trees. Horttechnology 1997, 7, 23–29. [Google Scholar] [CrossRef] [Green Version]
- Naor, A. Irrigation scheduling and evaluation of tree water status in deciduous orchards. Hortic. Rev. 2010, 32, 111–165. [Google Scholar]
- Puerto, P.; Domingo, R.; Torres, R.; Pérez-Pastor, A.; García-Riquelme, M. Remote management of deficit irrigation in almond trees based on maximum daily trunk shrinkage. Water relations and yield. Agric. Water Manag. 2013, 126, 33–45. [Google Scholar] [CrossRef]
- Jones, H.G.; Stoll, M.; Santos, T.; de Sousa, C.; Chaves, M.M.; Grant, O.M. Use of infrared thermography for monitoring stomatal closure in the field: Application to grapevine. J. Exp. Bot. 2002, 53, 2249–2260. [Google Scholar] [CrossRef] [PubMed]
- Jones, H.G. Thermal imaging and infrared sensing in plant ecophysiology. In Advances in Plant Ecophysiology Techniques, 1st ed.; Sánchez-Moreiras, A.M., Reigosa, M.J., Eds.; Springer: Cham, Switzerland, 2018; pp. 135–151. [Google Scholar]
- DeJonge, K.C.; Taghvaeian, S.; Trout, T.J.; Comas, L.H. Comparison of canopy temperature-based water stress indices for maize. Agric. Water Manag. 2015, 156, 51–62. [Google Scholar] [CrossRef]
- Taghvaeian, S.; Comas, L.; DeJonge, K.C.; Trout, T.J. Conventional and simplified canopy temperature indices predict water stress in sunflower. Agric. Water Manag. 2014, 144, 69–80. [Google Scholar] [CrossRef]
- García-Tejero, I.F.; Rubio, A.E.; Viñuela, I.; Hernández, A.; Gutiérrez-Gordillo, S.; Rodríguez-Pleguezuelo, C.R.; Durán-Zuazo, V.H. Thermal imaging at plant level to assess the crop-water status in almond trees (cv. Guara) under deficit irrigation strategies. Agric. Water Manag. 2018, 208, 176–186. [Google Scholar] [CrossRef]
- Idso, S.B.; Jackson, R.D.; Reginato, R.J. Remote-Sensing of Crop Yields. Science 1977, 196, 19–25. [Google Scholar] [CrossRef] [PubMed]
- Idso, S.B.; Jackson, R.; Pinter, P.J.; Reginato, R.J.; Hatfield, J.L. Normalizing the stress-degree-day parameter for environmental variability. Agric. Meteorol. 1981, 24, 45–55. [Google Scholar] [CrossRef]
- Jackson, R.D.; Idso, S.B.; Reginato, R.J.; Pinter, P.J. Canopy temperature as a Crop Water Stress Indicator. Water Resour. Res. 1981, 17, 1133–1138. [Google Scholar] [CrossRef]
- Conesa, M.R.; Conejero, W.; Vera, J.; Ramírez-Cuesta, J.M.; Ruiz-Sánchez, M.C. Terrestrial and remote indexes to assess moderate deficit irrigation in early-maturing nectarine trees. Agronomy 2019, 9, 630. [Google Scholar] [CrossRef] [Green Version]
- Puértolas, J.; Johnson, D.; Dodd, I.C.; Rothwell, S.A. Can we water crops with our phones? Smartphone technology application to infrared thermography for use in irrigation management. Acta Hortic. 2019, 1253, 443–448. [Google Scholar] [CrossRef]
- García-Tejero, I.F.; Ortega-Arévalo, C.J.; Iglesias-Contreras, M.; Moreno, J.M.; Souza, L.; Tavira, S.C.; Durán-Zuazo, V.H. Assessing the crop-water status in almond (Prunus dulcis Mill.) trees via thermal imaging camera connected to smartphone. Sensors 2018, 18, 1050. [Google Scholar] [CrossRef] [Green Version]
- Giménez-Gallego, J.; González-Teruel, J.D.; Jiménez-Buendía, M.; Toledo-Moreo, A.B.; Soto-Valles, F.; Torres-Sánchez, R. Segmentation of multiple tree leaves pictures with natural backgrounds using deep learning for image-based agriculture applications. Appl. Sci. 2020, 10, 202. [Google Scholar] [CrossRef] [Green Version]
- Noguera, M.; Millán, B.; Pérez-Paredes, J.J.; Ponce, J.M.; Aquino, A.; Andújar, J.M. A new low-cost device based on thermal infrared sensors for olive tree canopy temperature measurement and water status monitoring. Remote Sens. 2020, 12, 723. [Google Scholar] [CrossRef] [Green Version]
- Jones, H.G.; Sirault, X.R.R. Scaling of thermal images at different spatial resolution: The mixed pixel problem. Agronomy 2014, 4, 380–396. [Google Scholar] [CrossRef] [Green Version]
- Blanco, V.; Blaya-Ros, P.J.; Torres-Sanchez, R.; Domingo, R. Influence of regulated deficit Irrigation and environmental conditions on reproductive response of sweet cherry trees. Plants 2020, 9, 94. [Google Scholar] [CrossRef] [PubMed] [Green Version]
- Allen, R.G.; Pereira, L.S.; Raes, D.; Smith, M. Irrigation and drainage paper 56. In Crop Evapotranspiration. Guidelines for Computing Crop Water Requirements; FAO: Rome, Italy, 1998. [Google Scholar]
- Marsal, J. FAO irrigation and drainage paper 66. In Crop Yield Response Water. Sweet Cherry; FAO: Rome, Italy, 2012; pp. 449–457. [Google Scholar]
- Fereres, E.; Castel, J.R. Drip irrigation saves money in young almond orchards. Calif. Agric. 1982, 36, 12–13. [Google Scholar]
- McCutchan, H.; Shackel, K.A. Stem-water Potential as a Sensitive Indicator of Water Stress in Prune Trees (Prunus domestica L. cv. French). J. Am. Soc. Hortic. Sci. 1992, 117, 607–611. [Google Scholar] [CrossRef] [Green Version]
- Costa, J.M.; Grant, O.M.; Chaves, M.M. Thermography to explore plant-environment interactions. J. Exp. Bot. 2013, 64, 3937–3949. [Google Scholar] [CrossRef]
- Stoll, M.; Jones, H.G. Thermal imaging as a viable tool for monitoring plant stress. J. Int. Sci. Vigne Vin 2007, 41, 77–84. [Google Scholar] [CrossRef]
- Gómez-Bellot, M.J.; Nortes, P.A.; Sánchez-Blanco, M.J.; Ortuño, M.F. Sensitivity of thermal imaging and infrared thermometry to detect water status changes in Euonymus japonica plants irrigated with saline reclaimed water. Biosyst. Eng. 2015, 133, 21–32. [Google Scholar] [CrossRef]
- Jones, H.G. Use of thermography for quantitative studies of spatial and temporal variation of stomatal conductance over leaf surfaces. Plant Cell Environ. 1999, 22, 1043–1055. [Google Scholar] [CrossRef] [Green Version]
- Jones, H.G.; Hutchinson, P.A.; May, T.; Jamali, H.; Deery, D.M. A practical method using a network of fixed infrared sensors for estimating crop canopy conductance and evaporation rate. Biosyst. Eng. 2018, 165, 59–69. [Google Scholar] [CrossRef] [Green Version]
- Jackson, R.D. Canopy temperature and crop water stress. Adv. Irrig. 1982, 1, 43–85. [Google Scholar]
- Abdelfatah, A.; Aranda, X.; Savé, R.; de Herralde, F.; Biel, C. Evaluation of the response of maximum daily shrinkage in young cherry trees submitted to water stress cycles in a greenhouse. Agric. Water Manag. 2013, 118, 150–158. [Google Scholar] [CrossRef]
- Livellara, N.; Saavedra, F.; Salgado, E. Plant based indicators for irrigation scheduling in young cherry trees. Agric. Water Manag. 2011, 98, 684–690. [Google Scholar] [CrossRef]
- Higgs, K.H.; Hipps, N.A.; Collard, L.G. Effects of irrigation and nitrogen fertilization on the water relations of Prunus avium and Colt’ (P. avium L. x P. pseudocerasus Lind.) in the nursery, and residual effects after outplanting. J. Hortic. Sci. 1995, 70, 235–243. [Google Scholar] [CrossRef]
- Carrasco-Benavides, M.; Espinoza Meza, S.; Olguín-Cáceres, J.; Muñoz-Concha, D.; von Bennewitz, E.; Ávila-Sánchez, C.; Ortega-Farías, S. Effects of regulated post-harvest irrigation strategies on yield, fruit quality and water productivity in a drip-irrigated cherry orchard. N. Z. J. Crop Hortic. Sci. 2020, 48, 97–116. [Google Scholar] [CrossRef]
- Ballester, C.; Jiménez-Bello, M.A.; Castel, J.R.; Intrigliolo, D.S. Usefulness of thermography for plant water stress detection in citrus and persimmon trees. Agric. For. Meteorol. 2013, 168, 120–129. [Google Scholar] [CrossRef]
- Wang, D.; Gartung, J. Infrared canopy temperature of early-ripening peach trees under postharvest deficit irrigation. Agric. Water Manag. 2010, 97, 1787–1794. [Google Scholar] [CrossRef]
- Gonzalez-Dugo, V.; Zarco-Tejada, P.; Berni, J.A.J.; Suárez, L.; Goldhamer, D.; Fereres, E. Almond tree canopy temperature reveals intra-crown variability that is water stress-dependent. Agric. For. Meteorol. 2012, 154, 156–165. [Google Scholar] [CrossRef]
- Ribeiro, R.V.; Eduardo, C.M.; Santos, M.G. Leaf temperature in sweet orange plants under field condition:influence of meteorlogical elements. Rev. Bras. Agrometeorol. 2005, 13, 353–368. [Google Scholar]
- Nicolás, E.; Barradas, V.L.; Ortuño, M.F.; Navarro, A.; Torrecillas, A.; Alarcón, J.J. Environmental and stomatal control of transpiration, canopy conductance and decoupling coefficient in young lemon trees under shading net. Environ. Exp. Bot. 2008, 63, 200–206. [Google Scholar] [CrossRef]
- Mira-García, A.B.; Conejero, W.; Vera, J.; Ruiz-Sánchez, M.C. Leaf water relations in lime trees grown under shade netting and open-air. Plants 2020, 9, 510. [Google Scholar] [CrossRef] [Green Version]
- Paltineanu, C.; Septar, L.; Moale, C. Crop water stress in peach orchards and relationships with soil moisture content in a chernozem of dobrogea. J. Irrig. Drain. Eng. 2013, 139, 20–25. [Google Scholar] [CrossRef]
- González-Dugo, V.; López-López, M.; Espadafor, M.; Orgaz, F.; Testi, L.; Zarco-Tejada, P.; Lorite, I.J.; Fereres, E. Transpiration from canopy temperature: Implications for the assessment of crop yield in almond orchards. Eur. J. Agron. 2019, 105, 78–85. [Google Scholar] [CrossRef]
- Park, S.; Ryu, D.; Fuentes, S.; Chung, H.; Hernández-Montes, E.; O’Connell, M. Adaptive estimation of crop water stress in nectarine and peach orchards using high-resolution imagery from an unmanned aerial vehicle (UAV). Remote Sens. 2017, 9, 828. [Google Scholar] [CrossRef] [Green Version]
- Bellvert, J.; Adeline, K.; Baram, S.; Pierce, L.; Sanden, B.L.; Smart, D.R. Monitoring crop evapotranspiration and crop coefficients over an almond and pistachio orchard throughout remote sensing. Remote Sens. 2018, 10, 2001. [Google Scholar] [CrossRef] [Green Version]
- Leuzinger, S.; Körner, C. Tree species diversity affects canopy leaf temperatures in a mature temperate forest. Agric. For. Meteorol. 2007, 146, 29–37. [Google Scholar] [CrossRef]
- García-Tejero, I.; Durán-Zuazo, V.H.; Arriaga, J.; Hernández, A.; Vélez, L.M.; Muriel-Fernández, J.L. Approach to assess infrared thermal imaging of almond trees under water-stress conditions. Fruits 2012, 67, 463–474. [Google Scholar] [CrossRef]
- Köksal, E.S.; Candogan, B.N.; Yazgan, S.; Yildirim, Y.E. Determination of water use and water stress of cherry trees based on canopy temperature, leaf water potential and resistance. Zemdirbyste 2010, 97, 57–64. [Google Scholar]
- Oberhuber, W.; Hammerle, A.; Kofler, W. Tree water status and growth of saplings and mature Norway spruce (Picea abies) at a dry distribution limit. Front. Plant Sci. 2015, 6, 703. [Google Scholar] [CrossRef] [Green Version]
- Ortuño, M.F.; Conejero, W.; Moreno, F.; Moriana, A.; Intrigliolo, D.S.; Biel, C.; Mellisho, C.D.; Pérez-Pastor, A.; Domingo, R.; Ruiz-Sánchez, M.C.; et al. Could trunk diameter sensors be used in woody crops for irrigation scheduling? A review of current knowledge and future perspectives. Agric. Water Manag. 2010, 97, 1–11. [Google Scholar] [CrossRef]
- Bellvert, J.; Marsal, J.; Girona, J.; Gonzalez-Dugo, V.; Fereres, E.; Ustin, S.L.; Zarco-Tejada, P.J. Airborne thermal imagery to detect the seasonal evolution of crop water status in peach, nectarine and Saturn peach orchards. Remote Sens. 2016, 8, 39. [Google Scholar] [CrossRef] [Green Version]
- Ballester, C.; Zarco-Tejada, P.J.; Nicolás, E.; Alarcón, J.J.; Fereres, E.; Intrigliolo, D.S.; Gonzalez-Dugo, V. Evaluating the performance of xanthophyll, chlorophyll and structure-sensitive spectral indices to detect water stress in five fruit tree species. Precis. Agric. 2017, 19, 178–193. [Google Scholar] [CrossRef]
- González-Dugo, V.; Zarco-Tejada, P.J.; Fereres, E. Applicability and limitations of using the crop water stress index as an indicator of water deficits in citrus orchards. Agric. For. Meteorol. 2014, 198, 94–104. [Google Scholar] [CrossRef]


| Location | Parameter | May. (121–151) 1 | Jun. (152–181) | Jul. (182–212) | Aug. (213–243) | Sep. (244–273) | Oct. (274–304) | Nov. (305–334) |
|---|---|---|---|---|---|---|---|---|
| Plot 1 | VPD (kPa) | 0.88 | 1.16 | 1.10 | 1.42 | 0.99 | 0.71 | 0.51 |
| ET0 (mm d−1) | 4.99 | 5.78 | 6.11 | 5.34 | 3.81 | 2.54 | 1.60 | |
| P (mm) | 3.60 | 14.00 | 0.00 | 0.00 | 70.20 | 42.60 | 106.60 | |
| T (°C) | 18.69 | 22.79 | 25.62 | 26.89 | 24.42 | 18.91 | 14.62 | |
| Plot 2 | VPD (kPa) | 0.76 | 1.27 | 2.07 | 1.44 | 0.83 | 0.61 | 0.34 |
| ET0 (mm d−1) | 4.25 | 5.21 | 6.07 | 4.81 | 3.09 | 2.09 | 1.25 | |
| P (mm) | 22.95 | 35.27 | 0.00 | 21.17 | 35.21 | 22.06 | 27.95 | |
| T (°C) | 15.44 | 20.44 | 24.97 | 23.99 | 20.61 | 14.19 | 9.65 |
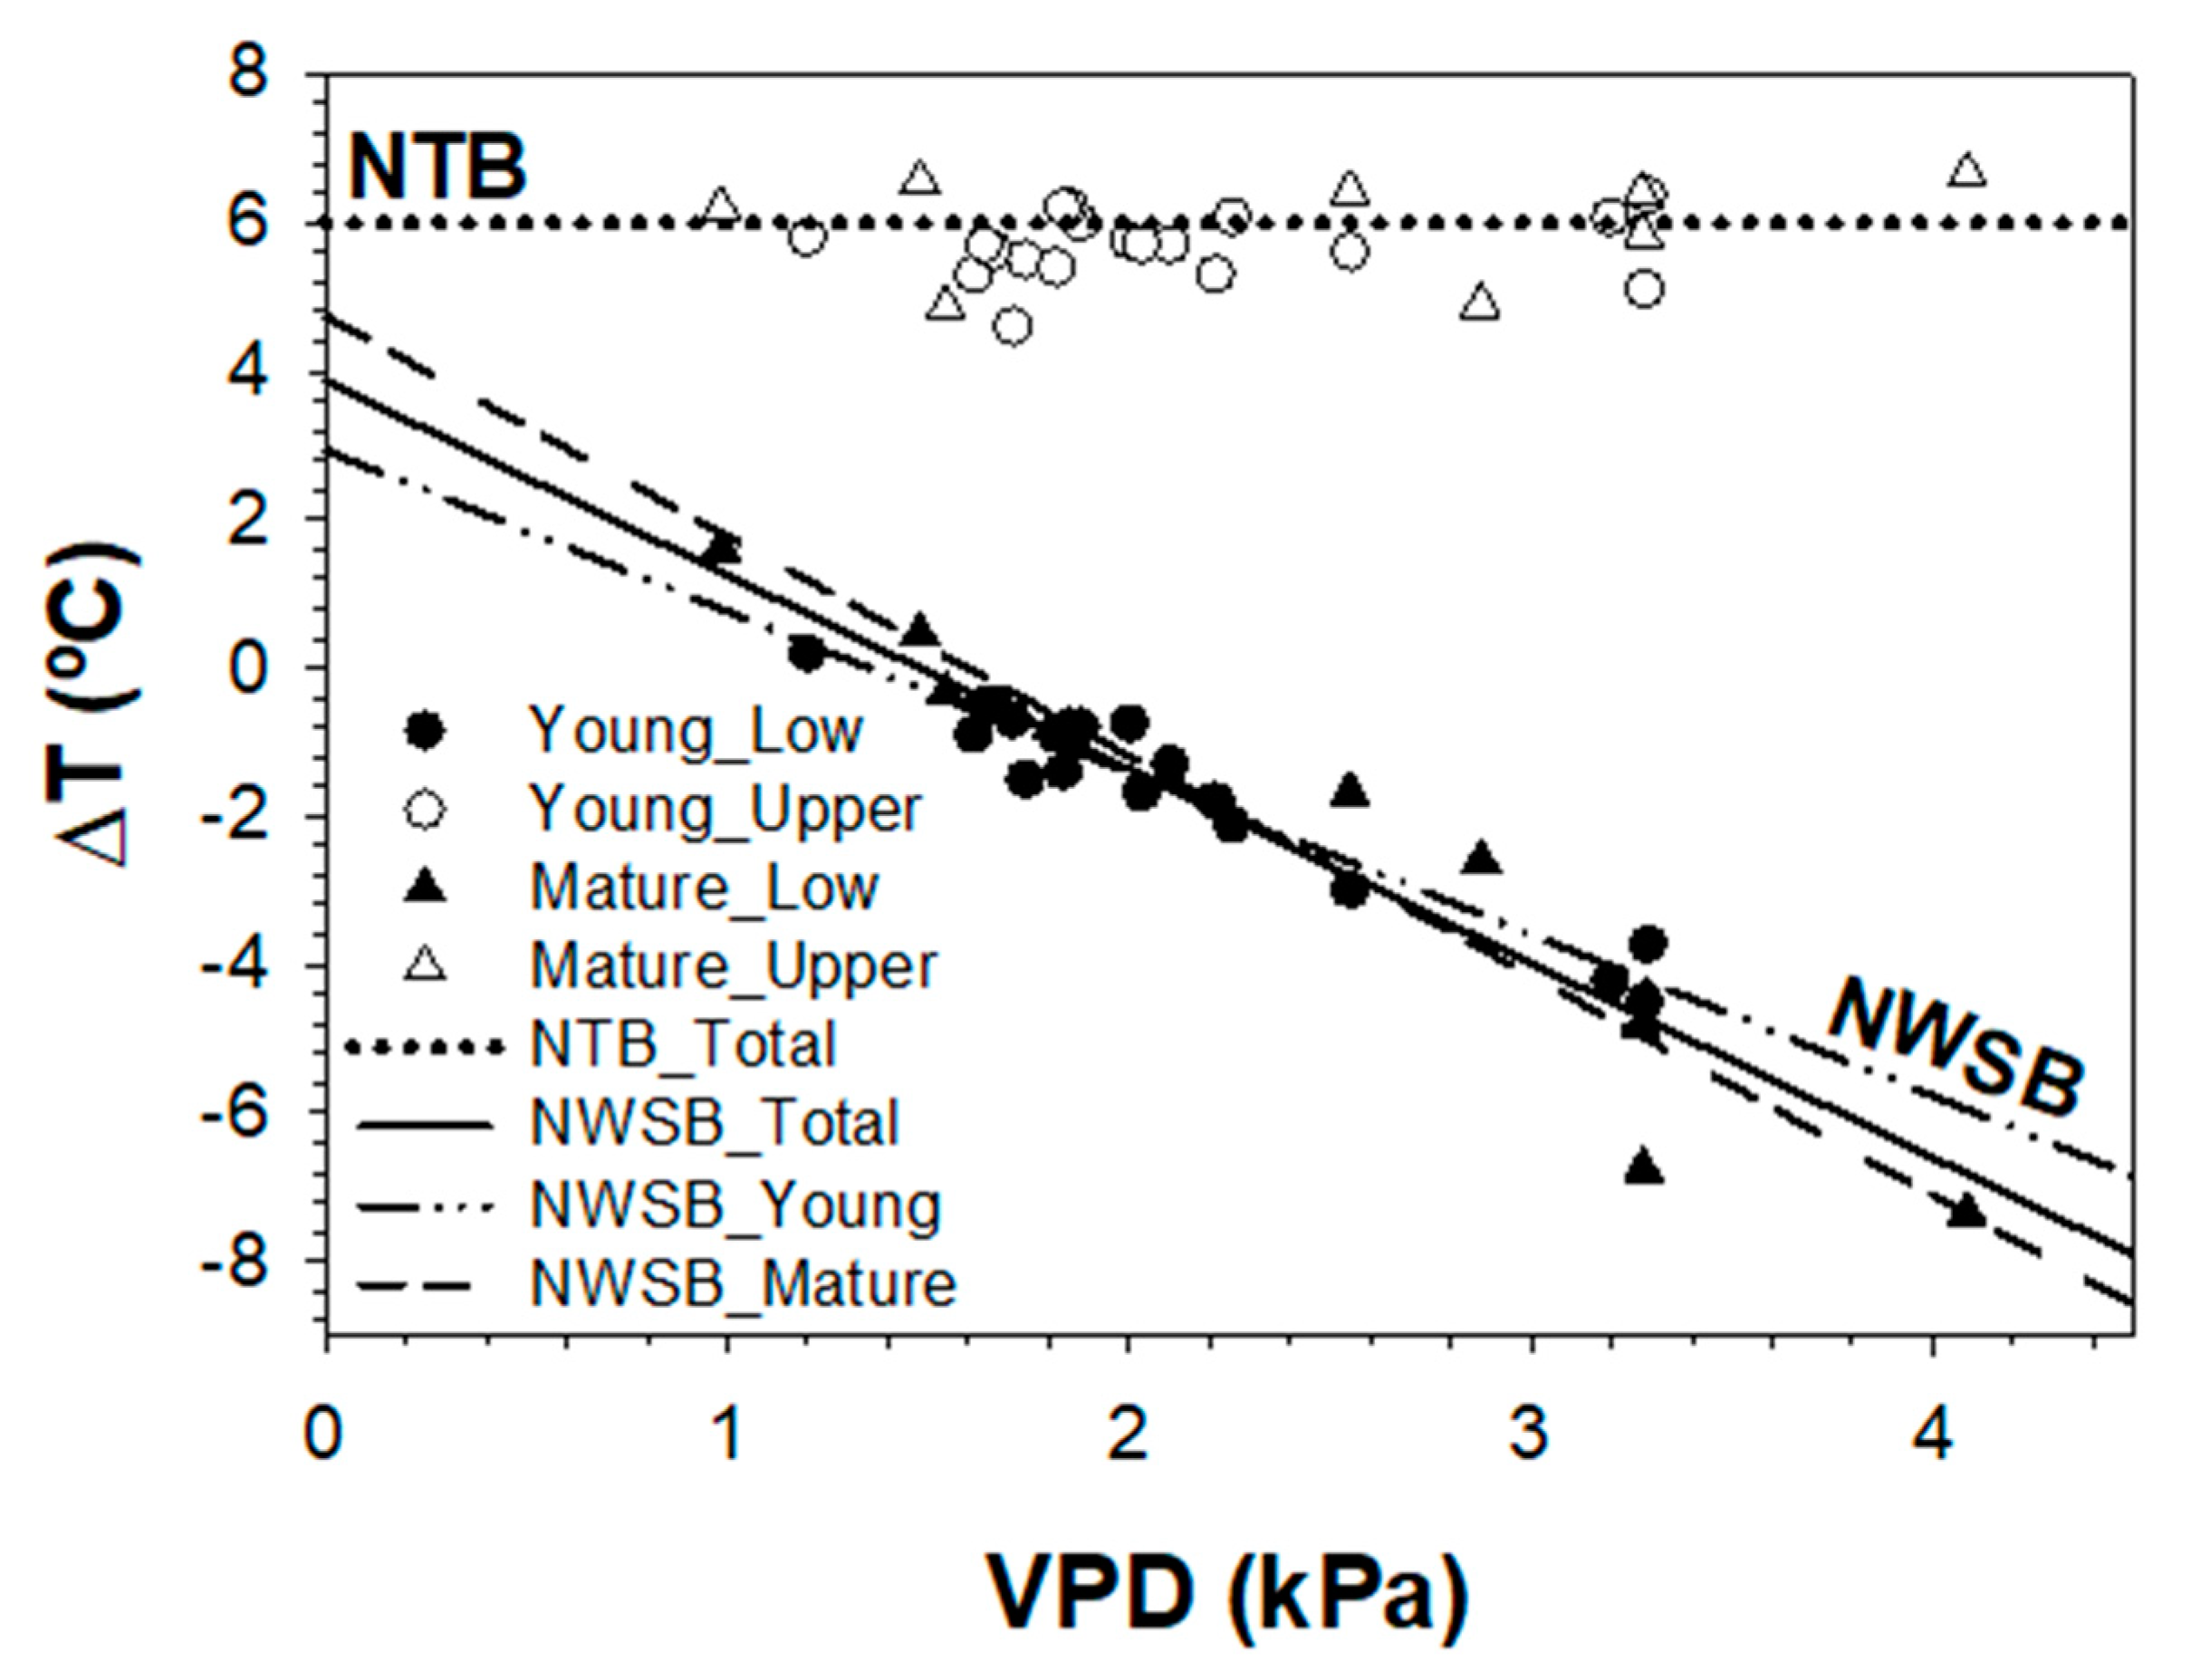
| Treatment | Slope (°C kPa−1) | Intercept (°C) | R2 |
|---|---|---|---|
| Young sweet cherry trees | −2.174 | 2.936 | 0.93 |
| Mature sweet cherry trees | −2.962 | 4.738 | 0.92 |
| Global relationship | −2.618 | 3.868 | 0.91 |
© 2020 by the authors. Licensee MDPI, Basel, Switzerland. This article is an open access article distributed under the terms and conditions of the Creative Commons Attribution (CC BY) license (http://creativecommons.org/licenses/by/4.0/).
Share and Cite
Blaya-Ros, P.J.; Blanco, V.; Domingo, R.; Soto-Valles, F.; Torres-Sánchez, R. Feasibility of Low-Cost Thermal Imaging for Monitoring Water Stress in Young and Mature Sweet Cherry Trees. Appl. Sci. 2020, 10, 5461. https://doi.org/10.3390/app10165461
Blaya-Ros PJ, Blanco V, Domingo R, Soto-Valles F, Torres-Sánchez R. Feasibility of Low-Cost Thermal Imaging for Monitoring Water Stress in Young and Mature Sweet Cherry Trees. Applied Sciences. 2020; 10(16):5461. https://doi.org/10.3390/app10165461
Chicago/Turabian StyleBlaya-Ros, Pedro José, Víctor Blanco, Rafael Domingo, Fulgencio Soto-Valles, and Roque Torres-Sánchez. 2020. "Feasibility of Low-Cost Thermal Imaging for Monitoring Water Stress in Young and Mature Sweet Cherry Trees" Applied Sciences 10, no. 16: 5461. https://doi.org/10.3390/app10165461