Article

Detection of Neurological and Ophthalmological Pathologies with Optical Coherence Tomography Using Retinal Thickness Measurements: A Bibliometric Study

by
F. Javier Povedano-Montero
1,2,3,
Robert N. Weinreb
4,5,
Isidoro Raga-Martínez
6,
Alejandro Romero
7 and
Francisco López-Muñoz
3,6,8,9,*
1
Faculty of Optics and Optometry, Complutense University of Madrid, 28040 Madrid, Spain
2
Centro Óptico Montero, 28032 Madrid, Spain
3
Hospital Doce de Octubre Research Institute (i+12), 28041 Madrid, Spain
4
Viterbi Family Department of Ophthalmology, and Shiley Eye Institute, University of California San Diego, La Jolla, CA 92093, USA
5
Hamilton Glaucoma Center, University of California San Diego, La Jolla, CA 92037, USA
6
Faculty of Health Sciences, University Camilo José Cela, 28692 Madrid, Spain
7
Department of Pharmacology and Toxicology, Faculty of Veterinary Medicine, Complutense University of Madrid, 28040 Madrid, Spain
8
Portucalense Institute of Neuropsychology and Cognitive and Behavioural Neurosciences (INPP), Portucalense University, 4200072 Porto, Portugal
9
Thematic Network for Cooperative Health Research (RETICS), Addictive Disorders Network, Health Institute Carlos III, MICINN and FEDER, 28029 Madrid, Spain
*
Author to whom correspondence should be addressed.
Appl. Sci. 2020, 10(16), 5477; https://doi.org/10.3390/app10165477
Submission received: 14 June 2020 / Revised: 31 July 2020 / Accepted: 5 August 2020 / Published: 7 August 2020
(This article belongs to the Special Issue Optical Coherence Tomography: From OCT-A to All Latest Advances)

Abstract

:
We carry out a bibliometric analysis on neurological and ophthalmological pathologies based on retinal nerve fiber layer (RNFL) thickness measured with optical coherence tomography (OCT). Documents were selected from Scopus database. We have applied the most commonly used bibliometric indicators, both for production and dispersion, as Price’s law of scientific literature growth, Lotka’s law, the transient index, and the Bradford model. Finally, the participation index of the different countries and affiliations was calculated. Two-hundred-and-forty-one documents from the period 2000–2019 were retrieved. Scientific production was better adjusted to linear growth (r = 0.88) than exponential (r = 0.87). The duplication time of the documents obtained was 5.6 years. The transience index was 89.62%, which indicates that most of the scientific production is due to very few authors. The signature rate per document was 5.2. Nine journals made up the Bradford core. USA and University of California present the highest production. The most frequently discussed topics on RNFL thinning are glaucoma and neurodegenerative diseases (NDD). The growth of the scientific literature on RNFL thickness was linear, with a very high rate of transience, which indicates low productivity and the presence of numerous authors who sporadically publish on this topic. No evidence of a saturation point was observed. In the last 10 years, there has been an increase in documents relating the decline of RNFL to NDD.

1. Introduction

Optical coherence tomography (OCT) is a non-invasive imaging technique based on the principle of low-coherence light interferometry. It uses infrared light to obtain tomographic images on a micrometric scale. The light reflected on the tissue produces images of cross-sections with an axial resolution of less than 10 microns [1]. The high resolution and different intensities of reflected light allow an almost histological segmentation of the different layers of the retina, as well as other anatomic structures. During the past two decades, OCT technology has been used to evaluate a variety of optic neuropathies, including glaucoma and non-glaucomatous optic neuropathies, as well as other neurodegenerative diseases (NDD) [2,3,4,5].
OCT devices provide accurate and reproducible measurements of the peripapillary retinal nerve fiber layer (RNFL), ganglion cell layer (GCL), and also retinal and macular thickness [6,7]. The RNFL is composed of axons from the retinal ganglion cells, so the measurement of the thickness of this layer indicates optic nerve damage. Assessment of the RNFL provides an accessible means to diagnose and monitor optic nerve damage.
OCT technology is widely used to diagnose and monitor a wide variety of ophthalmological conditions including retinal diseases and glaucoma [8,9,10]. The images provide objective information that can be evaluated for abnormality and tracked to detect disease progression [11]. It is important to mention that OCT technology has improved in recent years, going from time domain to spectral domain, which provides a speed improvement of around 100 times. One of the fundamental problems that the researchers found with the previous equipments was the “speckle noise” and the quality of the images that the OCT offered. However, in the early 2000s, some techniques appeared to improve it, such as wavelet analysis [12], deconvolution methods [13], anisotropic diffusion [14] and rotating kernel transformation [15]. However, these methods had the limitation of edge blur, which was a problem when speckle noise was vital. To overcome this, different algorithms have emerged to improve the image in low light and precise contrast [16], and also to improve the images accompanied by “speckle noise” [17].
Moreover, it has been demonstrated that OCT-measured RNFL, GCL and Bruch’s membrane opening (BMO) thickness correlate with brain atrophy, and this often is associated clinically with visual dysfunction, allowing the eye to be an appropriate model for studying the mechanisms of ophthalmological and NDD [18,19,20,21].
The current study uses bibliometric analysis to evaluate the growth of scientific literature that reports the use of OCT technology for assessing optic neuropathies and NDD. Bibliometric studies are devoted to examining a specific scientific discipline by analyzing the publications on this subject, using a wide variety of evaluation tools [22], both qualitative and quantitative [23].
The term bibliometry refers to a group of bibliographic searches and scientific information that allows analysis of production and dispersion of a specific topic in a statistically quantitative way [24]. Bibliometric statistical indicators allow measurement of the amount of scientific publications and their characteristics [25].
The parameters that are used in the evaluation process of any activity can be defined as indicators. Both production and dispersion are indicators of impact [26]. The production allows one to know if a specific topic is widely disseminated or not. Moreover, it shows which authors write more about the topic. The dispersion shows where these manuscripts are published. The impact factor (IF) is used to measure the visibility and usefulness of the source publications. It also allows one to determine the interest that documents have in terms of their greater or lesser use by different users. The IF, devised by Eugene Garfield [27], is published annually as part of the Journal Citation Report. Such studies provide guidance to know the social and scientific importance of a discipline or a specific field. From this point of view, the objective of the present study is to analyze the evolution of research on the detection of certain neurological and ophthalmological pathologies based on the reduction of the thickness of the retina using the OCT technique.

2. Materials and Methods
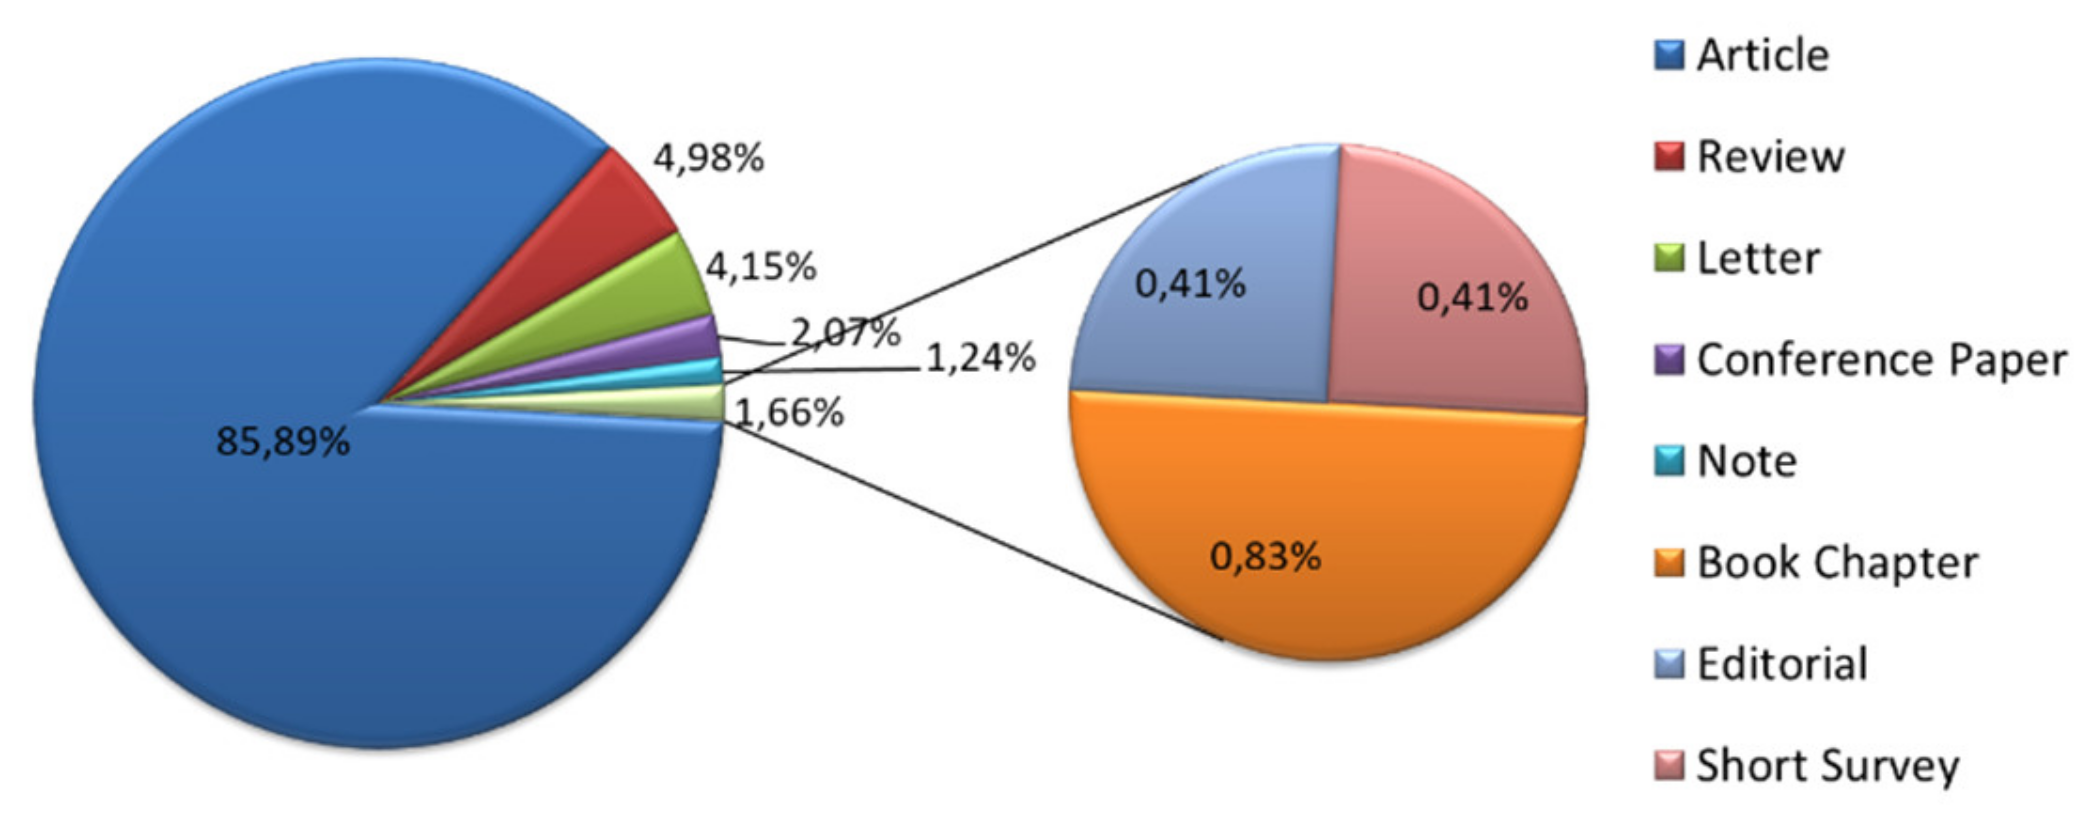
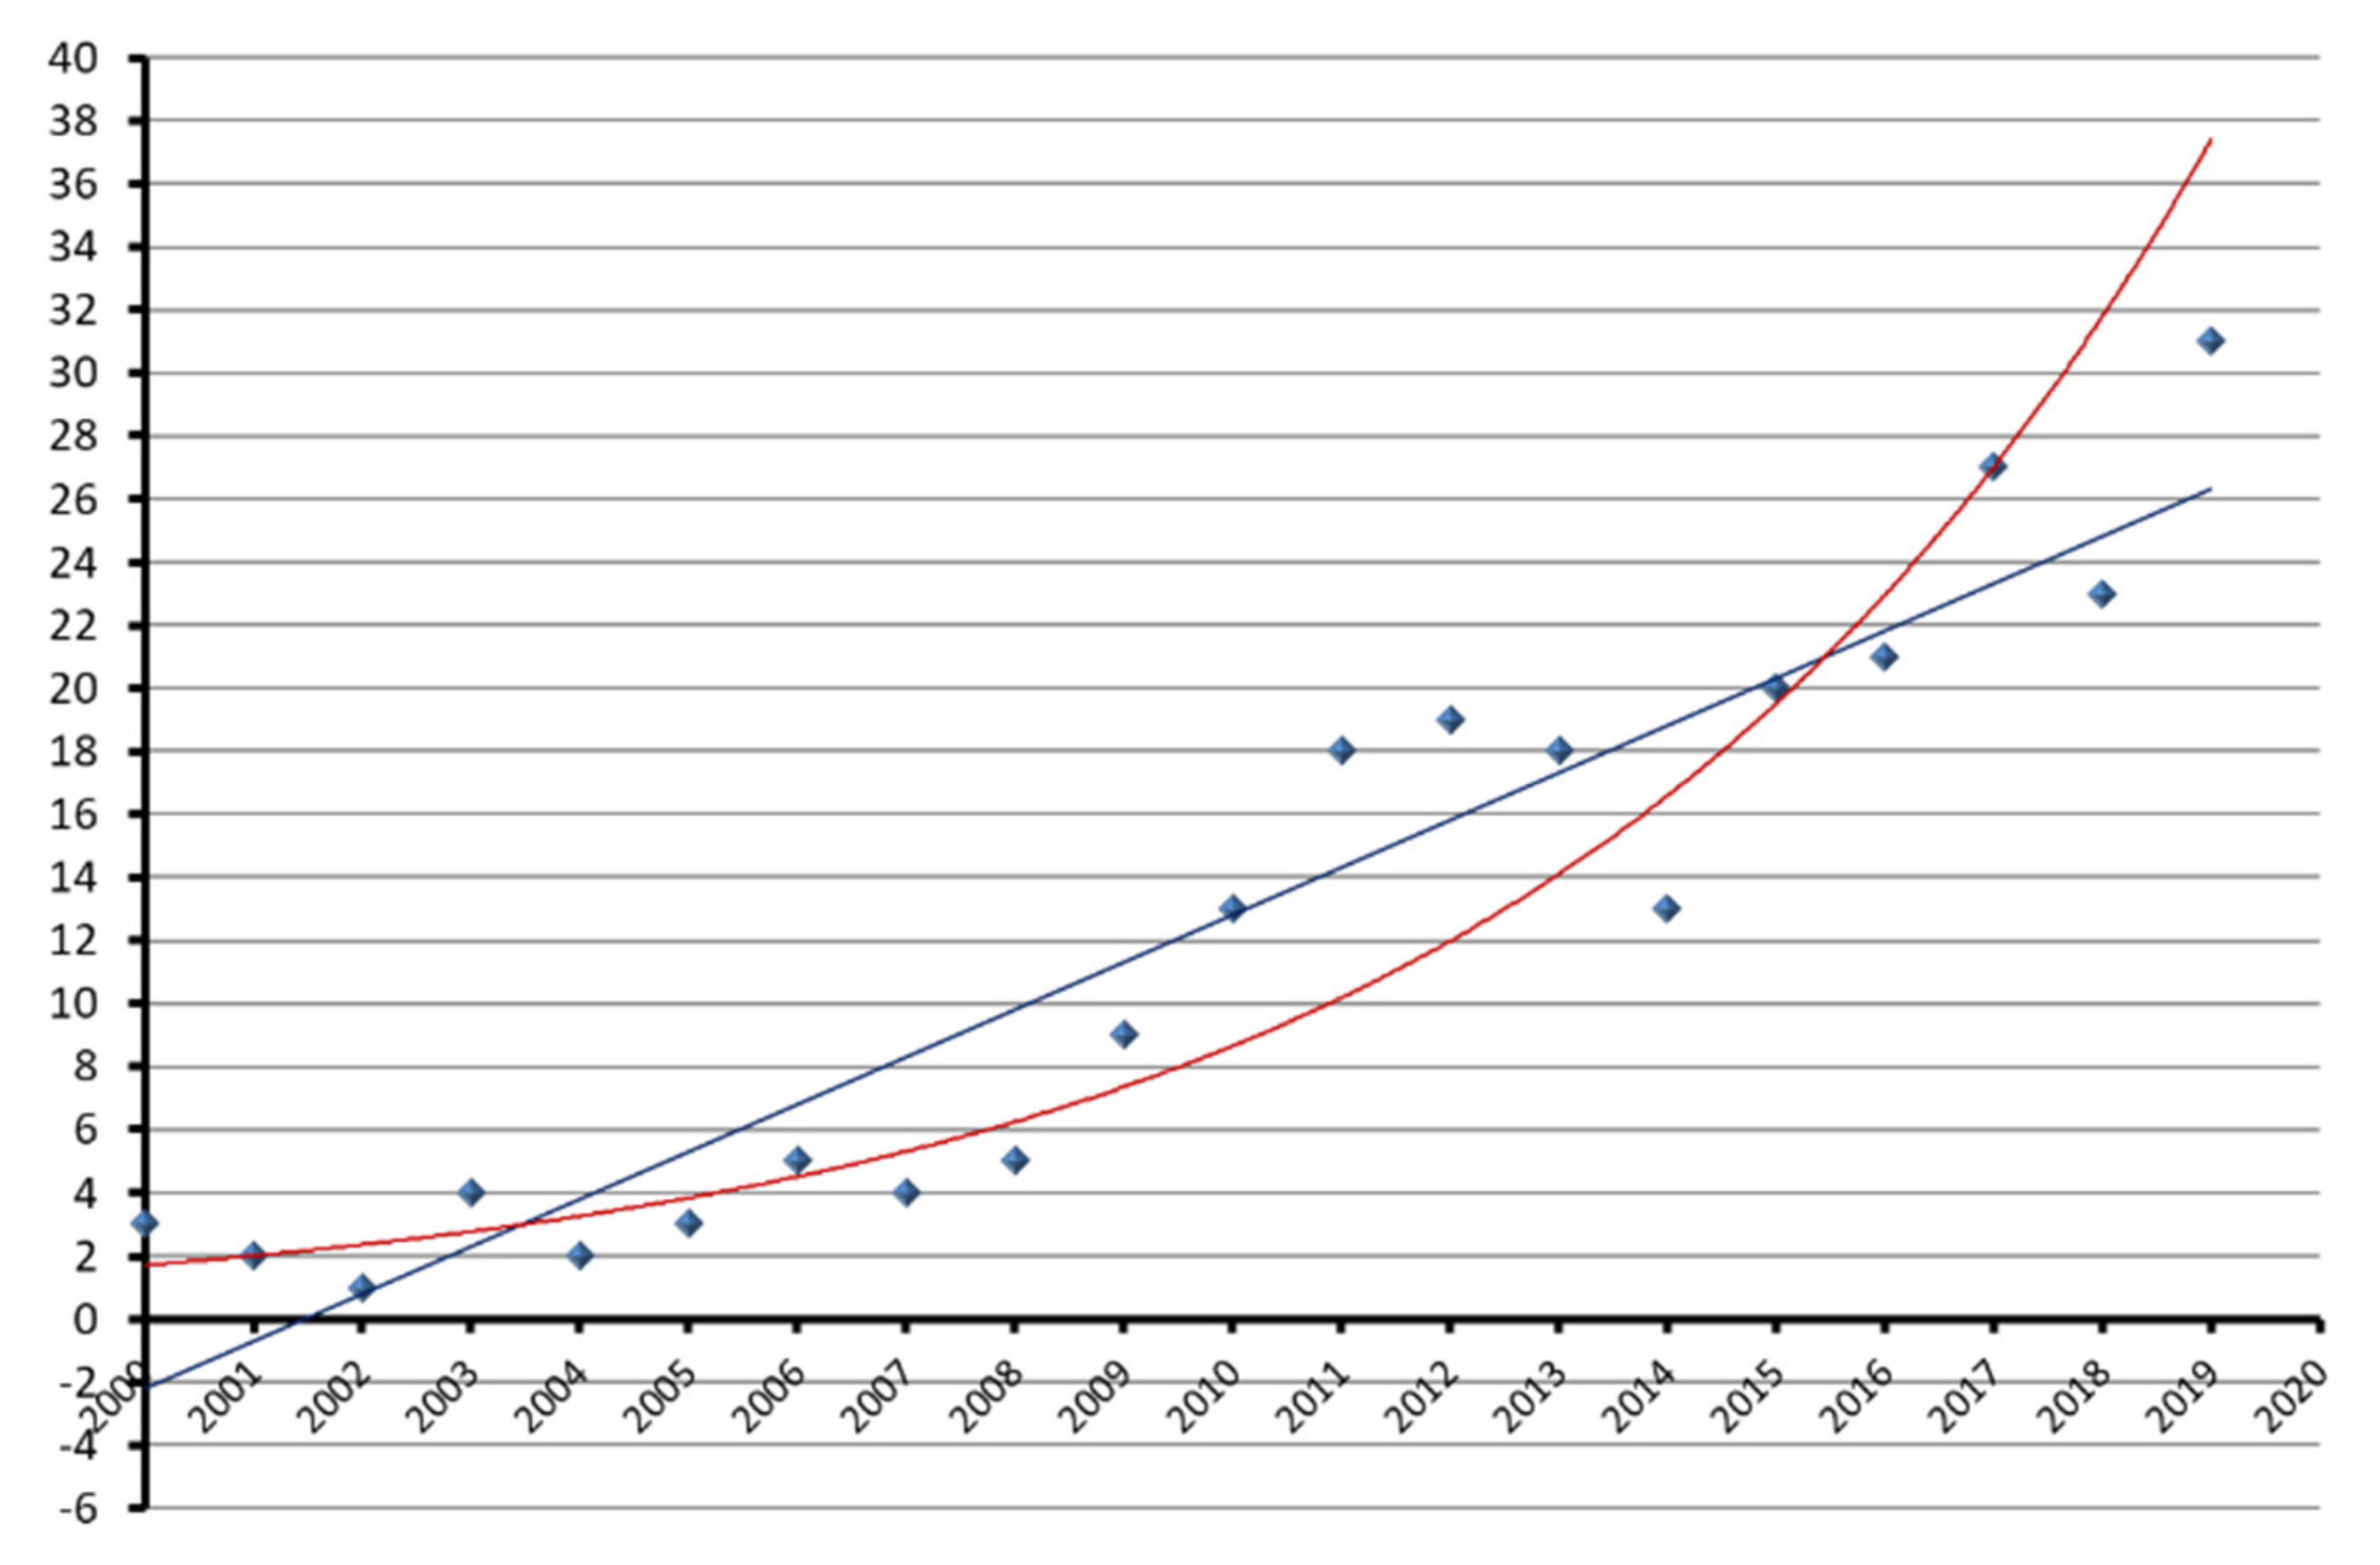
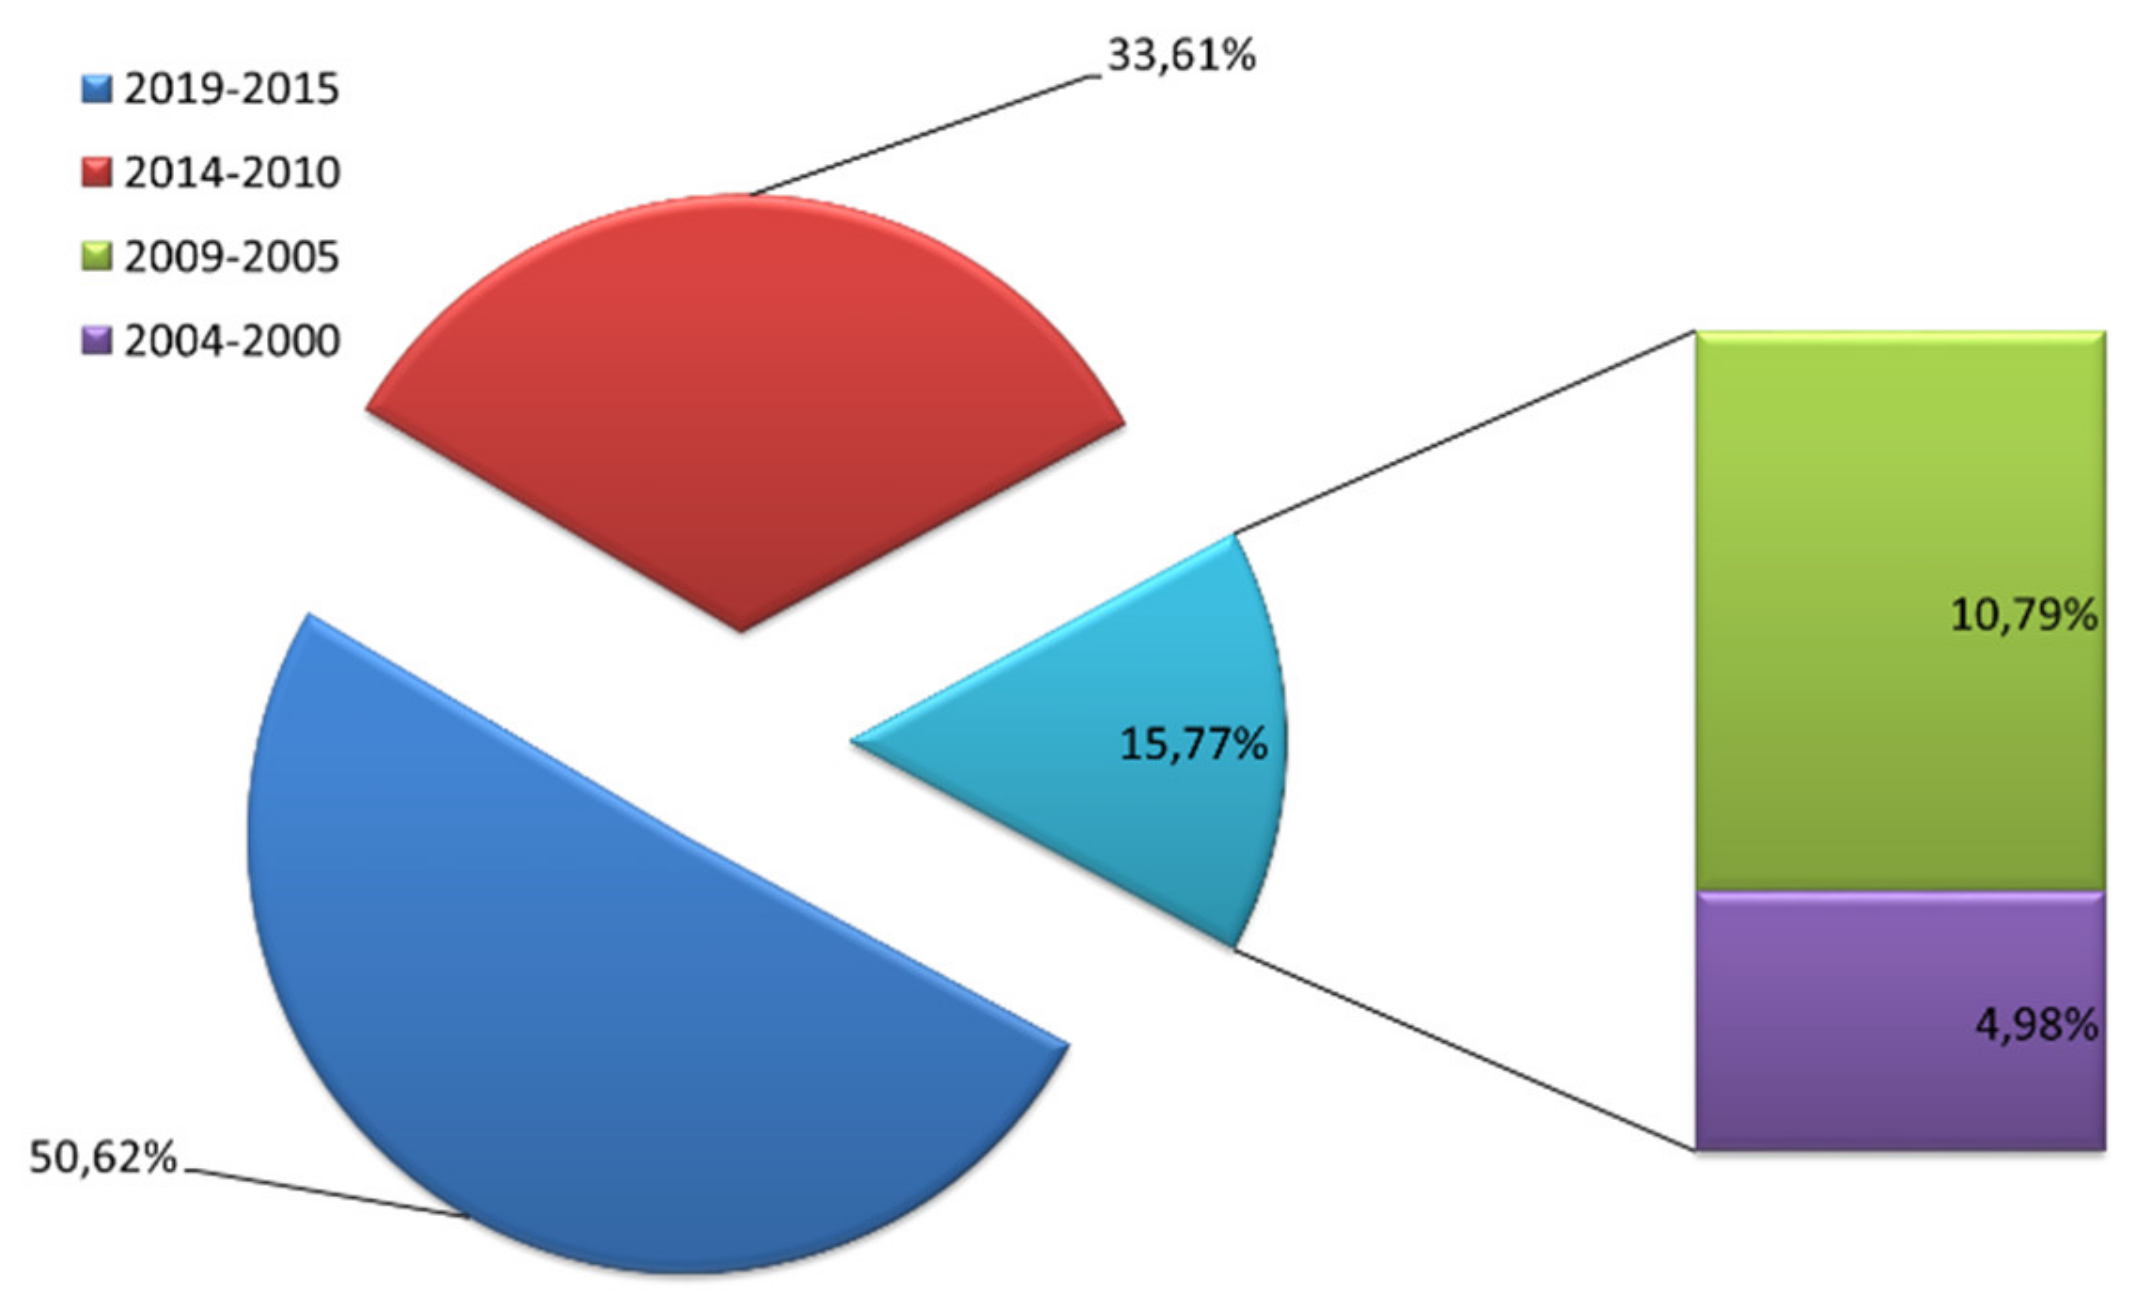
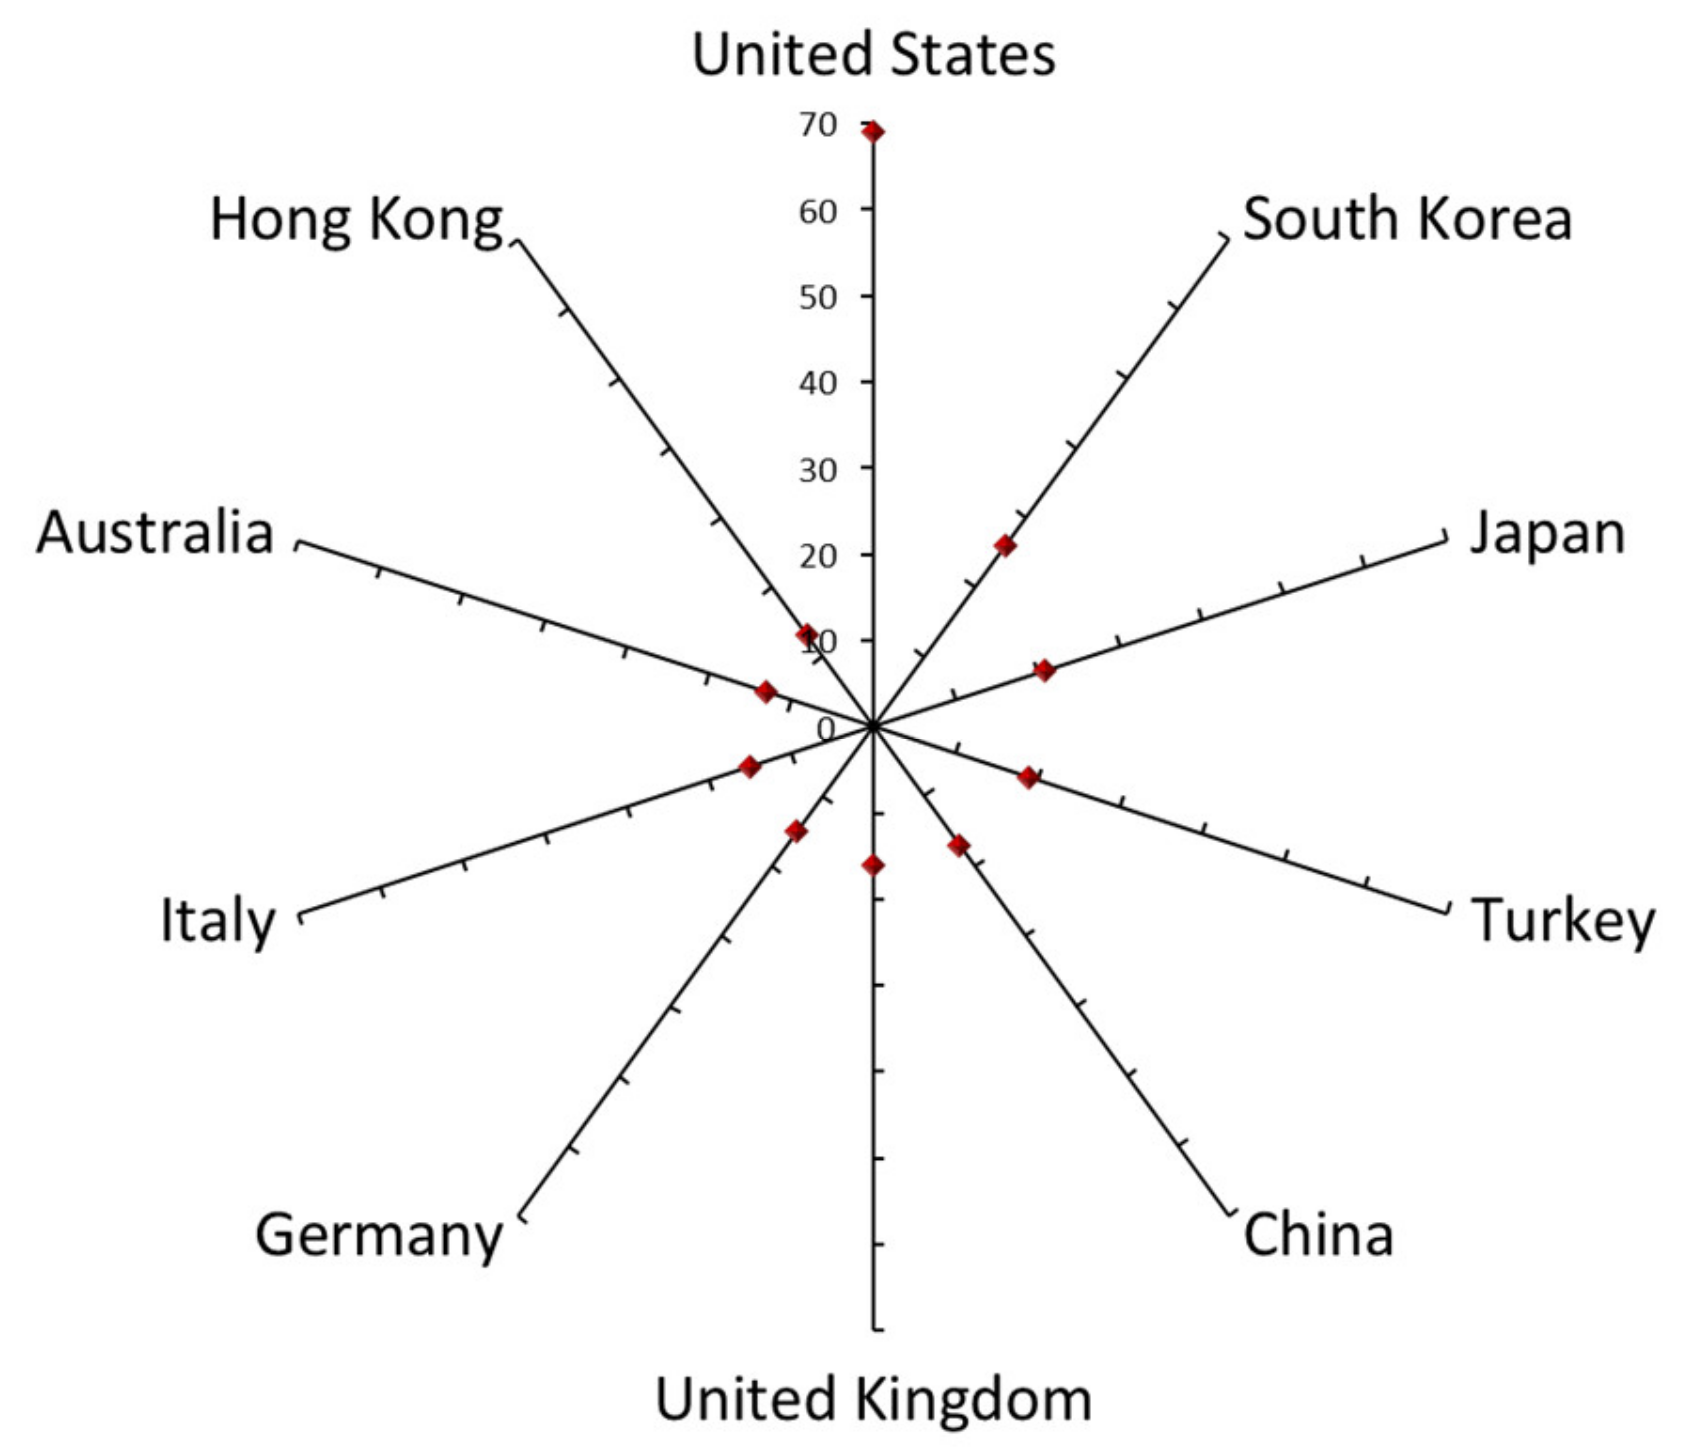
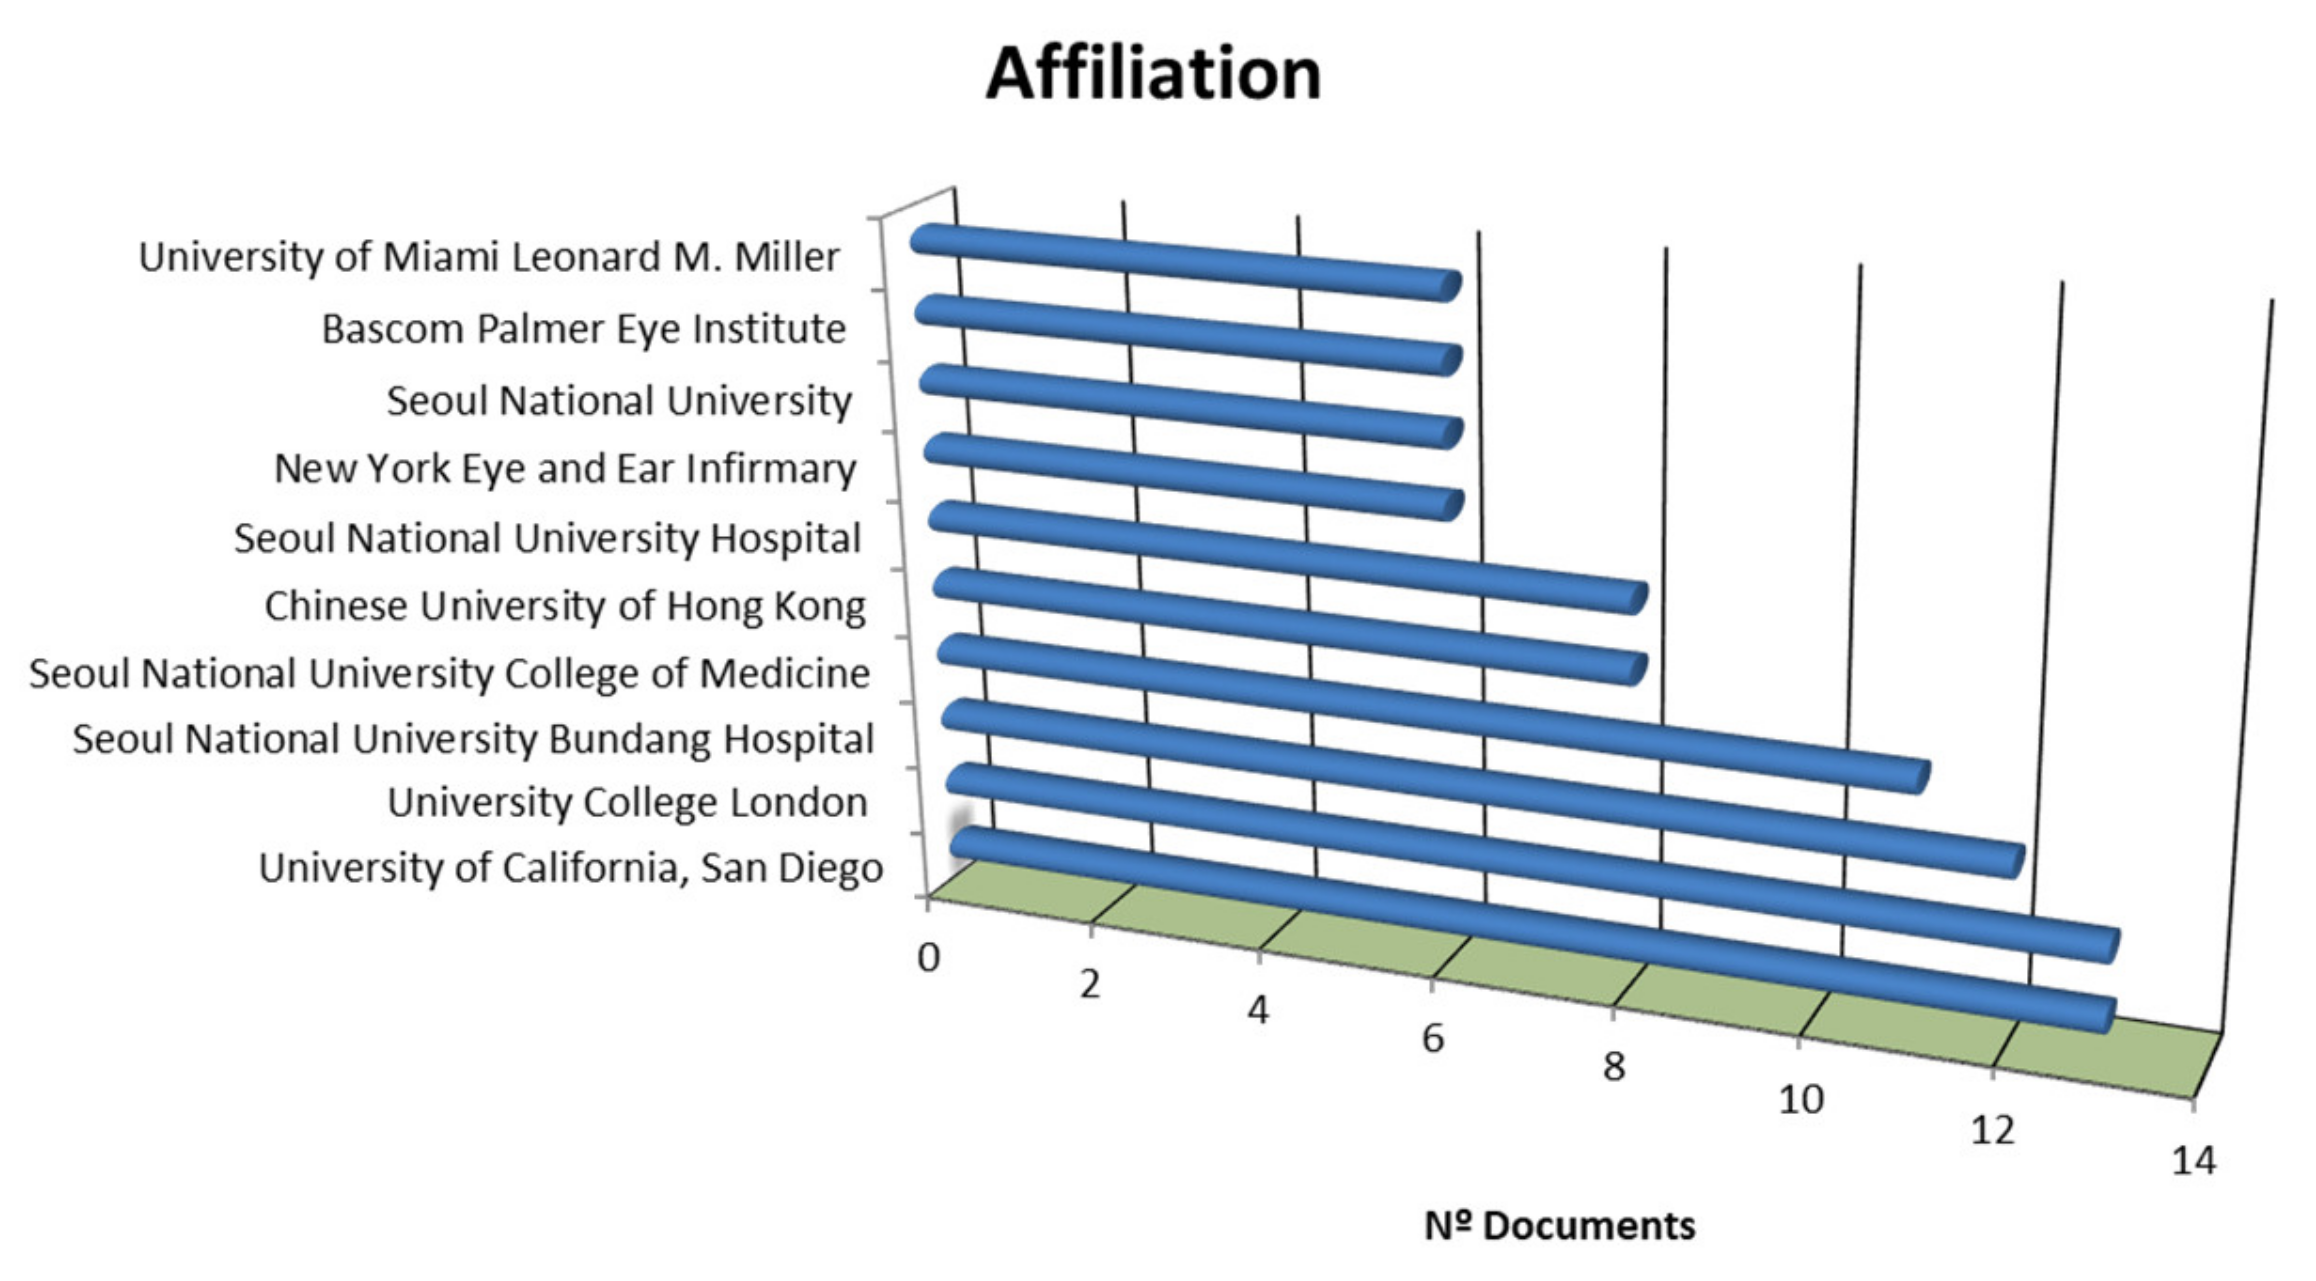
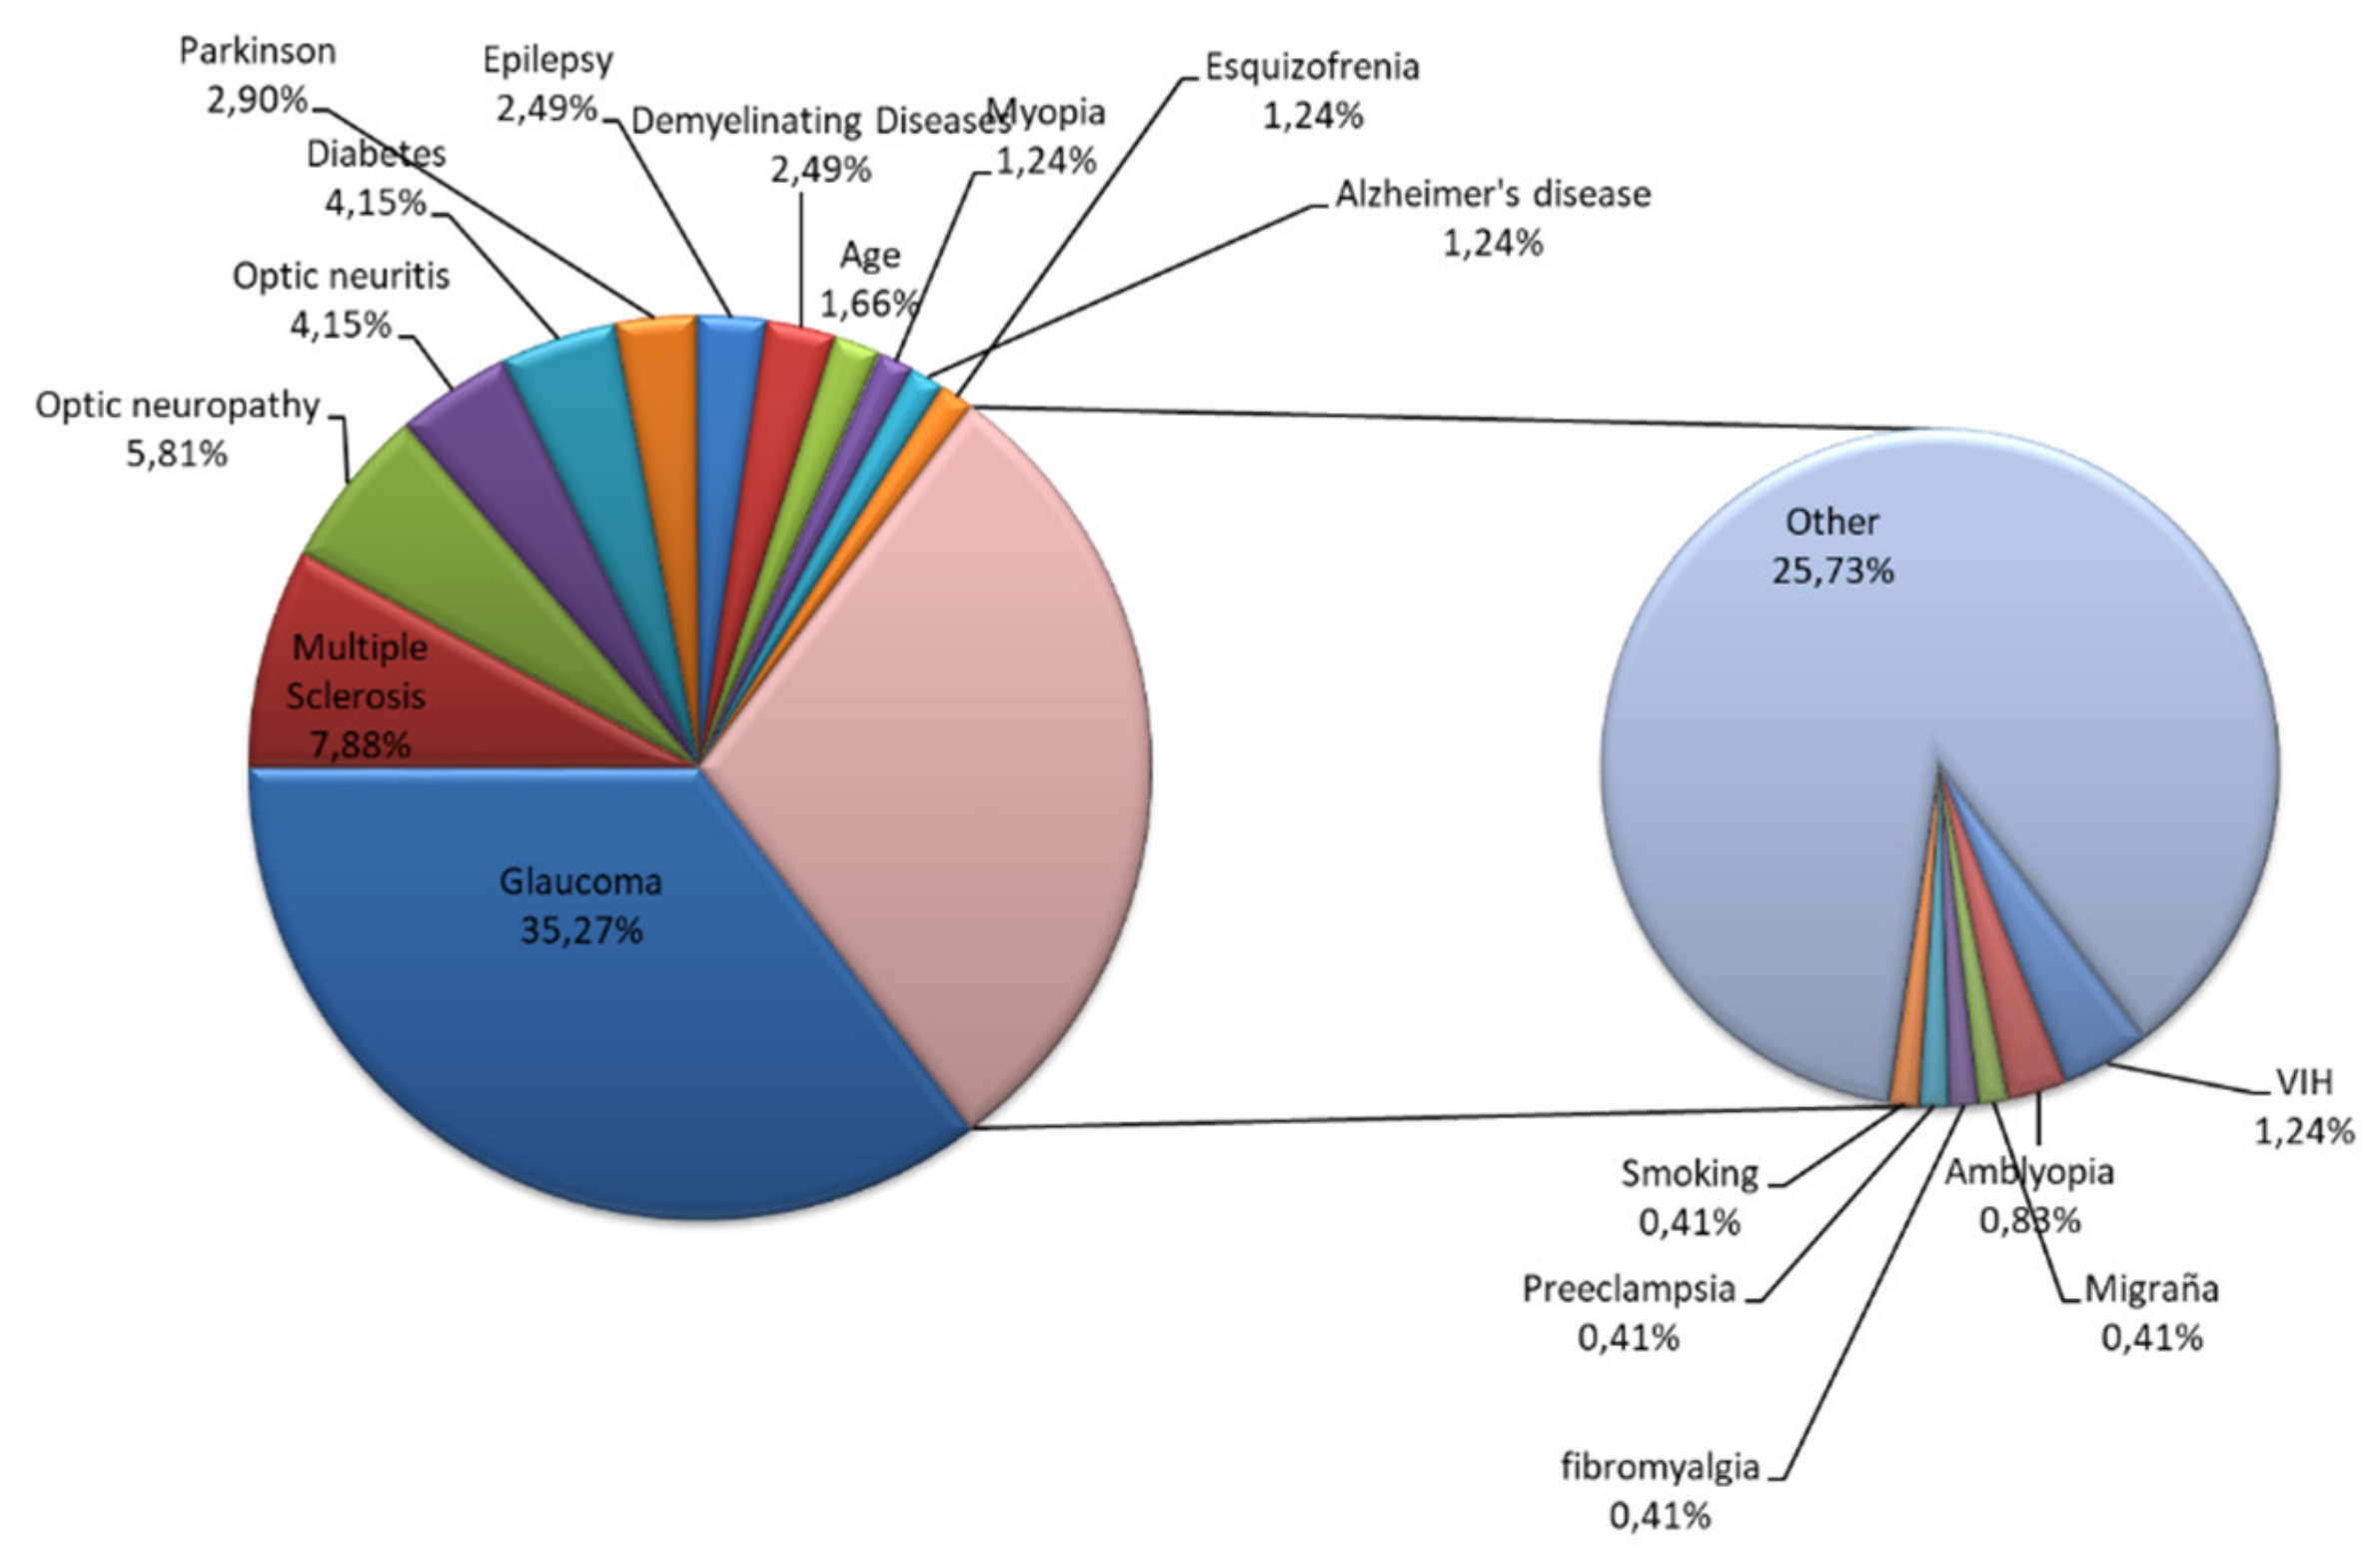
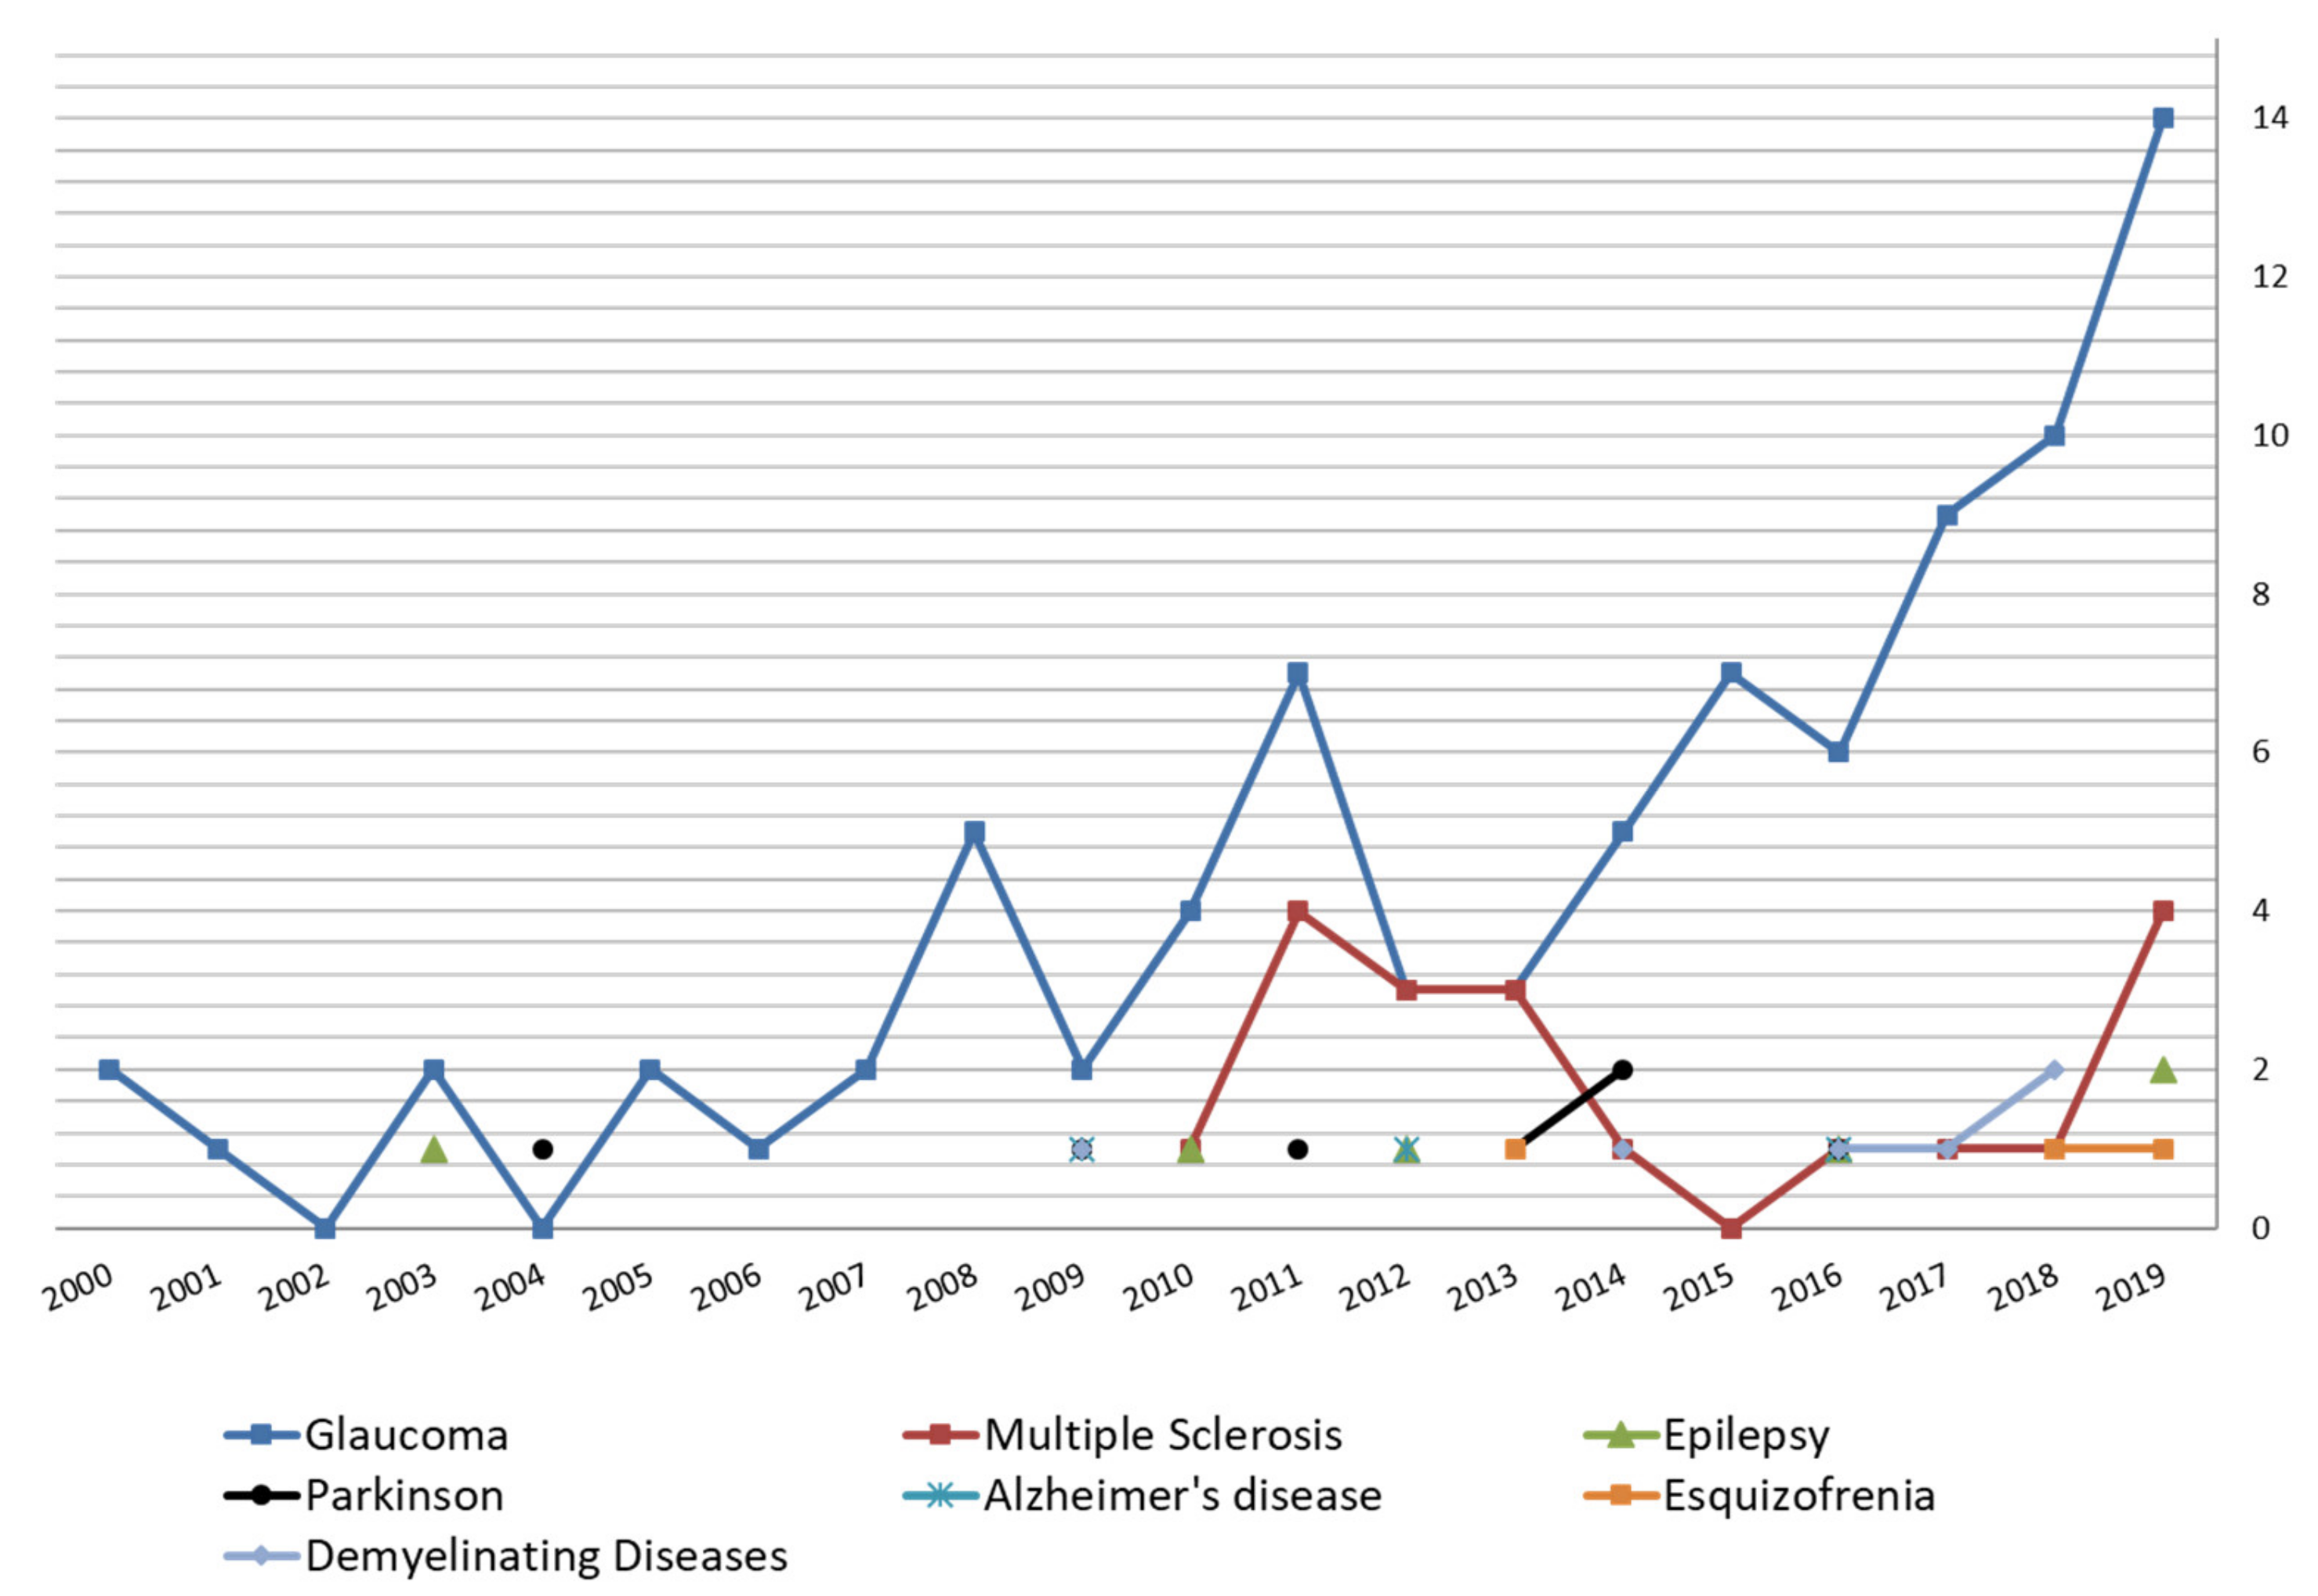
To carry out this study, the main biomedical databases were consulted, such as the Web of Science, PubMed and Scopus. Taking into account the search strategy, the number of documents retrieved was higher for Scopus. Therefore, Scopus database was chosen to carry out the present bibliometric analysis. This is one of the most relevant scientific literature databases, covering almost 22,000 titles from more than 5000 publishers, including jounals, books, and scientific conferences, of which 21,500 are scientific, technical, medical, and social science journals (this includes arts and humanities). Scopus is considered one of the most comprehensive and complete databases in the field of biomedical scientific production, being used regularly by researchers in this area of knowledge, and is commonly used by researchers to perform bibliometric analysis [28,29].
Remote downloading techniques were used to select papers published between 2000 and 2019, which contained in the Article title, Abstract, Keywords field (Article Title), the main descriptor “retinal nerve fiber layer thinning” or “retinal nerve fiber thickness”.
In this study, the most common bibliometric indicators were used: Price law, doubling time, annual growth rate, Price transience index, Lotka law, and the Bradford zones.
We have applied the Price law as the most representative indicator of scientific production [24]. This indicator allows us to know if the scientific production of a certain discipline experiences, during a specific period of time, an exponential or linear growth. For this purpose, a graph is constructed, with the chronological distribution of the documents, applying the linear and exponential trend lines. Thus, according to the correlation index, it is checked if the growth of literature is more similar to a type of linear or exponential growth. To assess if the scientific production on retinal nerve fiber thinning follows the Price law, a linear trend curve was created that is expressed in the following way y = 1.5015x − 3005.2 and another for the exponential trend line according to the equation y = 8E-142e0.1627x.
Time of duplication and the annual growth rate is related to the growth of a subject of study. The first is an indicator that informs us of the time required for the scientific production of a given subject to double. The form of growth was studied from the equation of Egghe and Ravichandra [30], this function is represented mathematically as:
C t = c g t
where C (t) is the total number of documents produced at time t; c and g represent estimated constants of the observed data, taking into account that c > 0, g > 1, and t ≥ 0; t is the number of chronological years studied in the research period (t = 0, 1, 2, …, n). The model not only provides an average rate of growth, but also offers a rate of duplication. To estimate the duplication time (D) of the scientific literature, the following equation is used:
D = L N 2 L N g
Among the bibliometric indicators of dispersion, we have applied the Bradford zones. Bradford evidenced the concentration in a small number of journals, the majority of the pertinent bibliography in a subject, this implies a rapid fall in the performance of expanding the search for references outside this nucleus [31].
To know the influence of publications, the Impact Factor (IF) is used. This indicator is calculated taking into account the times a journal has been cited in the Science Citation Index database in the last 2 years and the total number of articles published in this journal in those same years. The list of scientific journals of the Journal Citation Report, divided into different areas, attributes to each one an IF. The IF is related directly to journal prestige [32].
Finally, the Lokta indicator was used. This provides information on the distribution of authors based on the number of articles published [33], also known as the “inverse quadratic of scientific production”. It aims to calculate the number of authors expected for a given number of works produced. From a mathematical perspective, this law is expressed by the formula (where A is the number of authors, and n is the number of articles):
A n = A 1 n 2
According to this index, authors are categorized into three levels of productivity: small producers, those who publish one article; medium-sized producers, those who publish between 2–9 articles; and large-scale producers, those publishing 10 or more articles.
It is also interesting to know the number of authors with only one work. It is what is known as a transience or price index. Its calculation is given as the percentage of the quotient of the authors with a single job among the total. Mathematically it would be expressed:
T I = A u t h o r s   w i t h   o n l y   o n e   p u b l i c a t i o n T o t a l   n u m b e r   o f   a u t h o r s   *   100
We have used the h-index to quantify the authors’ activity. This index is one of the bibliometric indicators most widely used to rate the success of a researcher’s performance [34]. Nevertheless, the h-index also has its limitations, as it tends to penalize those authors that prioritize quality over quantity and do not publish extensively, while favoring others with a more protracted career [35], who have managed to publish more [36,37]. The g-index was introduced to measure the global citation performance of a set of articles [38], together with the p index, which stems from the interrelationship between the two, and is calculated as its coefficient [38,39].
p = h g

3. Results

Through the above-mentioned search criteria, 241 research publications were retrieved within the 20 years period (2000–2019). Of these, 85.89% (n = 207) were Original articles, while the others, 14.11%, correspond to Reviews, Letters, Conference Papers, Notes, Book chapters, Editorials, and Short Surveys respectively (Figure 1).
Figure 2 shows the increase in the number of documents in the area on retinal nerve fiber thickness research over time. After applying the mathematical adjustments to a linear curve, we have obtained a correlation coefficient of 0.885, which indicates 11.50% of variability unexplained by this adjustment, and a correlation coefficient of 0.869 after performing an exponential adjustment (13.1% of variability unexplained). These data allow us to confirm that the analyzed sample fits the linear model more than the exponential model, therefore, it does not comply with the postulates of the Price law.
The distribution in 5-year periods shows that the time frame 2019–2015 contains the most documents, with more than 50% of the total, as displayed in Figure 3. It also reflects a 34.78% increase with respect to the previous period, and an average of 42.32% in the last 4 five years, illustrating the great interest that this topic has lately generated.
Table 1 shows the parameters and values obtained from the application of the exponential model by the non-linear regression method. The value of c is 3.018 and that of g 1.131. With these values, the Egghe and Ravichandra Rao equation can be established, and thus, predict the growth of the published literature on retinal nerve fiber thickness:
C t = 3.018     1.131 t
From this method, it is inferred that the literature on detection of NDD based on decreased retinal thickness has grown at a rate of 13.1% per year with a production that doubles its size every 5.6 years. We have obtained that the model is explained at 89.3%.
Figure 4 shows the geographical distribution of the documents analyzed, while Figure 5 shows the most important institutions in scientific production in this field. From this analysis, it should be noted that four countries account for about 50% of total production. The United States was the most productive (n = 69), whose Participation Index (PI) is 28.63, followed by South Korea (n = 26; PI = 10.79) and Japan (n = 21; PI = 8.71). As for the most productive institutions, they are University of California San Diego, Seoul National University Bundang Hospital and Seoul National University College of Medicine (Figure 5).
The authors’ productivity level (PL) is shown in Table 2. It can be seen that the most important group of authors (almost 90%) is responsible for a single publication (PI = 0). This is the so-called Price transient index. In contrast, only 0.16% of the authors have published more than 10 documents (PI ≥ 1). The total number of authors is 1,253, which represents a co-authorship index of 5.2 for 241 retrieved publications.
Table 3 shows the top 10 most productive authors in the detection of optic nerve and NDD based on decreased retinal thickness research. It should be noted that among the 10 most productive authors, five are from South Korea. Likewise, the importance of the authors who research on this topic is demonstrated, since among the first 10 we find seven with an h index above 30 and four above 40. If we take into account the p index, there are three authors above 1.6.
The distribution of journals, according to the Bradford zones, is shown in Table 4. In this analysis, we find the core zone, where nine journals are included (7.69% of the total) and there are two other zones, 1 and 2, made up, respectively, of 31 and 77 journals (26.50% and 65.81% of the entire repertoire). Table 5 contains IF data for that core at the date of 2018, as well as other data of interest.
If we take into account the main theme of the repertoire, most of it deals with glaucoma with 35.27% of the documents (Figure 6); if we take into account NDD, these represent about 20%, with a chronological distribution, basically in the last 10 years (Figure 7).

4. Discussion

Bibliometry has been widely developed in recent years as an interesting tool to analyze the social and scientific relevance of different scientific topics. In 1969, Alan Pritchard introduced the term “bibliometrics” to refer to the use of statistical and mathematical tools to analyze the diffusion of scientific communication [22]. These tools allow us to study how the scientific literature of a certain subject, and over a period of time, grows and is distributed, and what is the role played by the authors, research groups, institutions, etc. [26].
Previous bibliometric studies have drawn attention to a series of limitations distinctive of this kind of sociometric approach [40]. In this regard, it is obvious, for example, that the international scientific production in a particular field, such as detection of neuro pathologies based on decreased retinal thickness in this case, is much more extensive, because the databases do not include all the journals, as well as other documents from congresses, scientific conferences and meetings. Likewise, bibliometric analyses are based on the number of records retrieved, but do not provide data on their quality, so it is of great interest to combine these indicators with those of impact [26]. Furthermore, comparisons between different subject areas should not be made, since the productivity of the authors, the citation, the publication habits, as well as the rate of aging of the literature are different.
The lack of standardization of the name of the authors and institutions as well as other limitations that derive from the incorrect use of methodological filtering also should be mentioned [41,42]. Nevertheless, the acknowledged quality of the publications included in the database employed in the present study (which collects not only articles written in English but also in other languages), together with its wide coverage, denote that the documents selected constitute a more than representative sample of the international research in the area in question.
Taking these points into account, the design of the present analysis enables a global assessment of the growth of scientific literature in the domain of detection of neurological pathologies based on decreased retinal thickness. In this regard, it should be stressed how, as Figure 2 displays, the number of scientific publications has undergone linear growth over the last 20 years with average annual increase of 13.1%, particularly after 2009 (coinciding with advances in OCT technology since the mid-2000s), without evidence of the saturation point that Price established in his theory of the growth of the scientific literature [43], at least until the end of the studied timeframe. It is necessary to indicate, as mentioned above, that articles published in journals not regularly indexed in databases and contributions made at scientific meetings or conferences are not included in this analysis. We can also highlight a low duplication time of only 5.7 years, which shows the interest of the researchers, as well as its great dynamism. This time of duplication of the scientific literature is less than that of other areas of medical research [44,45,46,47].
As mentioned above, OCT is used to diagnose and monitor the progression of glaucoma [9,48,49], 35% of the repertoire studied is about this subject. However, it is notable that in the last 10 years there has been an increase in documents linking decreased RNFL thickness with other NDD, and this now accounts for about 20% of the total. In this regard, it is worth noting the document of Fang Ko et al. [50], which highlights its sample size, with more than 30,000 participants, and in which cognitive decline due to age is related to the thinning of RNFL. In this article, its main conclusion is the relationship between a decrease in RNFL with a worse cognitive performance.
In this sense, it is necessary to mention different studies in which a decrease in the average thickness of the RNFL is related to Alzheimer’s disease (AD) [51,52], even generating interest on the part of the researchers for the use of this biomarker to early detection of AD. We also found studies that are more specific and that indicate a decrease in the GCL [53]. This could indicate that the eye damage would start in this layer [54]. These studies suggest that decreases in GCL thicknesses may reflect neuronal atrophy and may be associated with neurodegeneration [55]. It is important to indicate that the OCT measurement of the GLC-IPL layer corresponds to the thickness of the ganglion cell bodies and the retinal dendrites.
However, in relation to glaucoma, there are studies that indicate a greater specificity of thickness measurement the Bruch’s membrane opening–minimum rim width (BMO-MRW) [56,57,58], compared to RNFL, with a significantly lower false positive rate. This argument, in terms of the sensitivity [59] and specificity of this measure, could be valid for the study of other pathologies, and opens a line of research in this sense.
Based solely on documents related to the detection of neurological diseases, just over 40% corresponds to multiple sclerosis (MS), Parkinson’s and epilepsy follow, with 15.22 and 13.04% of the documents respectively. In MS, which is the most studied NDD in relation to the decrease in RNFL, it has been concluded that this thinning is due to autoimmune inflammation and axonal degeneration itself, so the thickness of RNFL could become a biomarker in the course of the disease [60]. In this way, the data provided by the OCT could become a fast and economical method to check the progression and therapeutic efficacy in MS.
The first documents referring to neurological diseases are from 2003 and 2004 (epilepsy and Parkinson’s respectively). In the 2003 study by Viestenz et al. [61], vigabatrin, used in epilepsy, was reported to damage the optic nerve. However, subsequent studies showed decreased RNFL thickness in patients without prior exposure to this drug [5,62]. Also in Parkinson’s disease, studies suggest that there is a decrease in RNFL [2,63].
As for the most productive authors (Table 4) we find that most, specifically eight, deal with glaucoma, while in only two authors, A.V. Brandt and F. Paul, their works are related to neurological diseases. It is worth noting the importance of the authors who have researched on the subject, with an author, R.N. Weinreb, who has an h-index of 98 and 2 (H. Kim and F. Paul) with a p-index of 1.71.
This importance too can be transferred to the journals of choice for publication. Among the top 10, we find two with an IF > of 6 and five greater than 3. In this sense, we check in Table 5 how the number of citations in relation to the number of articles published in these journals, agrees with the value given by the IF. If we add to this a time of duplication of the scientific literature of only 5.7 years, it shows us the importance and the great dynamism generated by this type of research and leads us to expect a sharp increase in documents in the next 5 years.

5. Conclusions

Despite the above limitations, we provide an overview on scientific production in the area of the RNFL thickness study over the past 20 years. This study showed that there is rapid growth of research in this area, linearly, unlike in other biomedical areas. Although OCT has traditionally been used for glaucoma screening and monitoring, in the last 10 years there has been an increase in studies linking the decline of RNFL to NDD, which can become a useful marker for the detection and monitoring of such diseases.
Therefore, because this condition requires interdisciplinary care, this study provides a useful reference for different specialties, such as ophthalmology, neurology, and optometry.

Author Contributions

All authors made contributions to this work. Conceptualization, F.L.-M. and F.J.P.-M.; Literature Search Perform, F.J.P.-M.; Data analysis, F.J.P.-M. and I.R.-M.; Writing—Original Draft Preparation, F.L.-M.; Writing—Review and Editing, F.L.-M., F.J.P.-M., A.R. and R.N.W.; Supervision, F.L.-M., F.J.P.-M., R.N.W., A.R. and I.R.-M. All authors have read and agreed to the published version of the manuscript.

Funding

This research received no external funding.

Conflicts of Interest

The authors declare no conflict of interest.

Glossary

ADAlzheimer disease
BMOBruch’s membrane opening
GCLGanglion cell layer
IFImpact factor
IPLInter plexiform layer
JCRJournal Citation Report
MRWMinimun rim width
MSMultiple sclerosis
NDDNeurodegenerative diseases
OCTOptical coherence tomography
PIParticipation index
PLProductivity level
RNFLRetinal nerve fiber layer

References

  1. Fercher, A.F.; Drexle, W.; Hitzenberger, C.K.; Lasser, T. Optical coherence tomography—Principles and applications. Rep. Progr. Phys. 2003, 66, 239–303. [Google Scholar] [CrossRef]
  2. Hajee, M.E.; March, W.F.; Lazzaro, D.R.; Wolintz, A.H.; Shrier, E.M.; Glazman, S.; Bodis-Wollner, I.G. Inner retinal layer thinning in Parkinson disease. Arch. Ophthalmol. 2009, 127, 737–741. [Google Scholar] [CrossRef] [PubMed] [Green Version]
  3. Wojtkowski, M.; Sikorski, B.L.; Gorczynska, I.; Gora, M.; Szkulmowski, M.; Bukowska, D.; Kałuzny, J.; Fujimoto, J.G.; Kowalczyk, A. Comparison of reflectivity maps and outer retinal topography in retinal disease by 3-D Fourier domain optical coherence tomography. Opt. Express. 2009, 17, 4189–4207. [Google Scholar] [CrossRef]
  4. Álvarez-Sesmero, S.; Povedano-Montero, F.J.; Arias-Horcajadas, F.; Marín-Mayor, M.; Navarrete-Chamorro, P.; Raga-Martínez, I.; Rubio, G.; López-Muñoz, F. Retinal nerve fiber layer in patients with alcohol use disorder. Appl. Sci. 2019, 9, 5331. [Google Scholar] [CrossRef] [Green Version]
  5. De la Aleja, J.G.; Guerrero-Molina, M.; Saíz-Díaz, R.A.; López-Muñoz, F.; Raga-Martínez, I.; Hernández-Gallego, J.; Navarrete-Chamorro, P.; Povedano-Montero, F.J. Peripapillary retinal nerve fibre layer thinning in genetic generalized epilepsy. Seizure 2019, 71, 201–206. [Google Scholar] [CrossRef]
  6. Huang, D.; Swanson, E.A.; Lin, C.P.; Schuman, J.S.; Stinson, W.G.; Chang, W.; Hee, M.R.; Flotte, T.; Gregory, K.; Puliafito, C.A. Optical coherence tomography. Science 1991, 254, 1178–1181. [Google Scholar] [CrossRef] [Green Version]
  7. Blumenthal, E.Z.; Williams, J.M.; Weinreb, R.N.; Girkin, C.A.; Berry, C.C.; Zangwill, L.M. Reproducibility of nerve fiber layer thickness measurements by use of optical coherence tomography. Ophthalmology 2000, 107, 2278–2282. [Google Scholar] [CrossRef]
  8. Medeiros, F.A.; Zangwill, L.M.; Bowd, C.; Vessani, R.M.; Susanna, R., Jr.; Weinreb, R.N. Evaluation of retinal nerve fiber layer, optic nerve head, and macular thickness measurements for glaucoma detection using optical coherence tomography. Am. J. Ophthalmol. 2005, 139, 44–55. [Google Scholar] [CrossRef]
  9. Ran, A.R.; Cheung, C.Y.; Wang, X.; Chen, H.; Luo, L.Y.; Chan, P.P.; Wong, M.O.; Chang, R.T.; Mannil, S.S.; Young, A.L.; et al. Detection of glaucomatous optic neuropathy with spectral-domain optical coherence tomography: A retrospective training and validation deep-learning analysis. Lancet Dig. Health 2019, 1, e172–e182. [Google Scholar] [CrossRef] [Green Version]
  10. Daneshvar, R.; Yarmohammadi, A.; Alizadeh, R.; Henry, S.; Law, S.K.; Caprioli, J.; Nouri-Mahdavi, K. Prediction of glaucoma progression with structural parameters: Comparison of optical coherence tomography and clinical disc parameters. Am. J. Ophthalmol. 2019, 208, 19–29. [Google Scholar] [CrossRef]
  11. Thomas, D.; Duguid, G. Optical coherence tomography—A review of the principles and contemporary uses in retinal investigation. Eye 2004, 18, 561–570. [Google Scholar] [CrossRef] [PubMed] [Green Version]
  12. Mayer, M.A.; Borsdorf, A.; Wagner, M.; Hornegger, J.; Mardin, C.Y.; Tornow, R.P. Wavelet denoising of multiframe optical coherence tomography data. Biomed. Opt. Express. 2012, 3, 3231–3239. [Google Scholar] [CrossRef] [PubMed] [Green Version]
  13. Rogowska, J.; Bryant, C.M.; Brezinski, M.E. Cartilage thickness measurements from optical coherence tomography. J. Opt. Soc. Am. A Opt. Image Sci. Vis. 2003, 20, 357–367. [Google Scholar] [CrossRef] [PubMed]
  14. Wang, R.K. Reduction of speckle noise for optical coherence tomography by the use of nonlinear anisotropic diffusion. In Proceedings of the SPIE 5690, Coherence Domain Optical Methods and Optical Coherence Tomography in Biomedicine IX, San Jose, CA, USA, 22–27 January 2005. [Google Scholar] [CrossRef]
  15. Rogowska, J.; Brezinski, M. Evaluation of rotational kernel transformation technique for enhancement of coronary optical coherence tomography images. IEEE Trans. Med. Imaging 2000, 12, 1261–1266. [Google Scholar] [CrossRef] [PubMed]
  16. Li, M.; Liu, J.; Yang, W.; Sun, X.; Guo, Z. Structure-revealing low-light image enhancement via robust retinex model. IEEE Trans. Image Process 2018, 6, 2828–2841. [Google Scholar] [CrossRef] [PubMed]
  17. Chitchian, S.; Mayer, M.A.; Boretsky, A.R.; van Kuijk, F.J.; Motamedi, M. Retinal optical coherence tomography image enhancement via shrinkage denoising using double-density dual-tree complex wavelet transform. J. Biomed. Opt. 2012, 17, 116009. [Google Scholar] [CrossRef]
  18. Ratchford, J.N.; Saidha, S.; Sotirchos, E.S.; Oh, J.A.; Seigo, M.A.; Eckstein, C.; Durbin, M.K.; Oakley, J.D.; Meyer, S.A.; Conger, A.; et al. Active MS is associated with accelerated retinal ganglion cell/inner plexiform layer thinning. Neurology 2013, 80, 47–54. [Google Scholar] [CrossRef] [Green Version]
  19. Saidha, S.; Al-Louzi, O.; Ratchford, J.N.; Bhargava, P.; Oh, J.; Newsome, S.D.; Prince, J.L.; Pham, D.; Roy, S.; Van Zijl, P.; et al. Optical coherence tomography reflects brain atrophy in multiple sclerosis: A four-year study. Ann. Neurol. 2015, 78, 801–813. [Google Scholar] [CrossRef]
  20. Maldonado, R.S.; Mettu, P.; El-Dairi, M.; Bhatti, M.T. The application of optical coherence tomography in neurologic diseases. Neurol. Clin. Pract. 2015, 5, 460–469. [Google Scholar] [CrossRef] [Green Version]
  21. Ascaso, F.J.; Cruz, N.; Modrego, P.J.; Bhatti, M.T. Retinal alterations in mild cognitive impairment and Alzheimer’s disease: An optical coherence tomography study. J. Neurol. 2014, 261, 1522–1530. [Google Scholar] [CrossRef]
  22. Pritchard, A. Statistical bibliograhy or bibliometrics? J. Doc. 1969, 4, 348–369. [Google Scholar]
  23. Moed, H.F.; Burger, W.J.M.; Frankfort, J.G.; Van Raan, A.F.J. A comparative study of bibliometric past performance analysis and judgement. Scienciometrics 1985, 8, 149–159. [Google Scholar] [CrossRef]
  24. Price, D.J. Little Science, Big Science; Columbia University Press: New York, NY, USA, 1963. [Google Scholar]
  25. López Piñero, J.M. El Análisis Estadístico y Sociométrico de la Literatura Científica; Centro de Documentación e Informática Medica, Facultad de Medicina: Valencia, Spain, 1972. [Google Scholar]
  26. Bordons, M.; Zulueta, M.A. Evaluación de la actividad científica a través de indicadores bibliometricos. Rev. Esp. Cardiol. 1999, 52, 790–800. [Google Scholar] [CrossRef]
  27. Garfield, E. Citation indexes for science. A new dimension in documentation through association of ideas. Science 1955, 122, 108–111. [Google Scholar] [CrossRef]
  28. Falagas, M.E.; Pitsouni, E.I.; Malietzis, G.A.; Pappas, G. Comparison of PubMed, Scopus, Web of Science, and Google Scholar: Strengths and weaknesses. FASEB J. 2008, 22, 338–342. [Google Scholar] [CrossRef]
  29. Kulkarni, A.V.; Aziz, B.; Shams, I.; Busse, J.W. Comparisons of citations in Web of Science, Scopus, and Google Scholar for articles published in general medical journals. JAMA 2009, 302, 1092–1096. [Google Scholar] [CrossRef]
  30. Egghe, L.; Ravichandra Rao, I.K. Classification of growth models based on growth rates and its applications. Scientometrics 1992, 25, 5–46. [Google Scholar] [CrossRef]
  31. Bradford, S.C. Sources of informations on specific subjects. J. Inf. Sci. 1934, 137, 85–86. [Google Scholar]
  32. Garfield, E. Citation Indexing. Its Theory and Application in Science, Technology and Humanities; John Wiley & Sons: New York, NY, USA, 1979. [Google Scholar]
  33. Lotka, A.J. The frecuency distribution of scientific productivity. J. Wash. Acad. Sci. 1926, 12, 317–323. [Google Scholar]
  34. Ball, P. Index aims for fair ranking of scientists. Nature 2005, 436, 900. [Google Scholar] [CrossRef]
  35. Kelly, C.D.; Jennions, M.P. The h-index and career assessment by numbers. Trends Ecol. Evol. 2006, 41, 167–170. [Google Scholar] [CrossRef] [PubMed]
  36. Van Raan, A.F.J. Comparasions of the Hirsch-index with estándar bibliometric indicators and with peer judgement for 147 chemistre research groups. Scientometrics 2006, 67, 491–502. [Google Scholar] [CrossRef]
  37. Cronin, B.; Meho, L.I. Using the h-index to rank influential scientist. J. Am. Soc. Inf. Sci. Technol. 2006, 57, 1275–1278. [Google Scholar] [CrossRef]
  38. Egghe, L. Theory and practise of the g-index. Scientometrics 2006, 69, 131–152. [Google Scholar] [CrossRef]
  39. Povedano-Montero, F.J. Análisis Bibliométrico de la Producción Científica Española en el Campo de la Optometría. Ph.D. Thesis, Universidad Camilo José Cela, Madrid, Spain, 2015. [Google Scholar]
  40. Johnson, M.H.; Cohen, J.; Grudzinskas, G. The uses and abuses of bibliometrics. Reprod. Biomed. Online 2012, 24, 485–486. [Google Scholar] [CrossRef] [Green Version]
  41. Sanz-Valero, J.; Veiga de Cabo, J.; Rojo-Alonso, C.; Wanden-Berghe, C.; Espulgues Pellicer, J.X.; Rodrigues Guilam, C. Los filtros metodológicos: Aplicación a la búsqueda bibliográfica en la medicina del trabajo española. Med. Segur. Trab. 2008, 54, 75–83. [Google Scholar] [CrossRef]
  42. Povedano-Montero, F.J.; López-Muñoz, F.; Hidalgo Santa Cruz, F. Análisis bibliométrico de la producción científica española en el área de la Optometría. Arch. Soc. Esp. Oftalmol. 2016, 91, 160–169. [Google Scholar] [CrossRef]
  43. Price, D.J. Networks of scientific papers. Science 1965, 149, 510–515. [Google Scholar] [CrossRef]
  44. López-Muñoz, F.; Vieta, E.; Rubio, G.; García-García, P.; Álamo, G. Bipolar disorder as an emerging pathology in the scientific literature: A bibliometric approach. J. Affect. Disord. 2006, 92, 161–170. [Google Scholar] [CrossRef]
  45. López-Muñoz, F.; Rubio, G.; Molina Martín, J.D.D.; Shen, W.W.; Perez Nieto, M.Á.; Moreno, R.; Huelves, L.; Noriega, C.; Garcia-Garcia, P.; Álamo González, C. Mapping the scientific research on atypical antipsychotic drugs in Spain: A bibliometric assessment. Actas Esp. Psiquiatr. 2013, 41, 349–360. [Google Scholar]
  46. García-García, P.; López-Muñoz, F.; Callejo, J.; Martín Águeda, B.; Álamo, C. Evolution of Spanish scientific production in international obstetrics and gynecology journals during the period 1986–2002. Eur. J. Obstet. Gyn. Reprod. Biol. 2005, 123, 150–156. [Google Scholar] [CrossRef]
  47. Okoroiwu, H.U.; López-Muñoz, F.; Povedano-Montero, F.J. Bibliometric analysis of global Lassa fever research (1970–2017): A 47-year study. BMC Infect. Dis. 2018, 18, 639. [Google Scholar] [CrossRef] [Green Version]
  48. Koh, V.; Tham, Y.C.; Cheung, C.Y.; Mani, B.; Wong, T.Y.; Aung, T.; Cheng, C.Y. Diagnostic accuracy of macular ganglion cell-inner plexiform layer thickness for glaucoma detection in a population-based study: Comparison with optic nerve head imaging parameters. PLoS ONE 2018, 13, e0199134. [Google Scholar] [CrossRef] [PubMed]
  49. Mwanza, J.C.; Budenz, D.L.; Godfrey, D.G.; Neelakantan, A.; Sayyad, F.E.; Chang, R.T.; Lee, R.K. Diagnostic performance of optical coherence tomography ganglion cell—Inner plexiform layer thickness measurements in early glaucoma. Ophthalmology 2014, 121, 849–854. [Google Scholar] [CrossRef] [PubMed]
  50. Ko, F.; Muthy, Z.A.; Gallacher, J.; Sudlow, C.; Rees, G.; Yang, Q.; Keane, P.A.; Petzold, A.; Khaw, P.T.; Reisman, C.; et al. Association of retinal nerve fiber layer thinning with current and future cognitive decline: A study using optical coherence tomography. JAMA Neurol. 2018, 75, 1198–1205. [Google Scholar] [CrossRef]
  51. Zabel, P.; Kałużny, J.J.; Wiłkość-Dębczyńska, M.; Gębska-Tołoczko, M.; Suwała, K.; Kucharski, R.; Araszkiewicz, A. Peripapillary retinal nerve fiber layer thickness in patients with Alzheimer’s Disease: A comparison of eyes of patients with Alzheimer’s Disease, primary open-angle glaucoma, and preperimetric glaucoma and healthy controls. Med. Sci. Monit. 2019, 25, 1001–1008. [Google Scholar] [CrossRef] [PubMed]
  52. Kwon, J.Y.; Yang, J.H.; Han, J.S.; Kim, D.G. Analysis of the retinal nerve fiber layer thickness in Alzheimer Disease and mild cognitive impairment. Korean J. Ophthalmol. 2017, 31, 548–556. [Google Scholar] [CrossRef] [PubMed] [Green Version]
  53. López-de-Eguileta, A.; Lage, C.; López-García, S.; Pozueta, A.; García-Martínez, M.; Kazimierczak, M.; Bravo, M.; de Arcocha-Torres, M.; Banzo, I.; Jimenez-Bonilla, J.; et al. A Ganglion cell layer thinning in prodromal Alzheimer’s disease defined by amyloid PET. Alzheimers Dement. (NY) 2019, 5, 570–578. [Google Scholar] [CrossRef]
  54. Vidinova, C.N.; Gouguchkova, P.T.; Vidinov, K.N. Ganglienzellkomplexkarte beim Hochdruck- und Normaldruckglaukom und die Beziehung zu Morbus Alzheimer. Klin. Monbl. Augenheilkd. 2016, 233, 72–78. [Google Scholar] [CrossRef]
  55. Kalenderoglu, A.; Sevgi-Karadag, A.; Celik, M.; Egilmez, O.B.; Han-Almis, B.; Ozen, M.E. Can the retinal ganglion cell layer (GCL) volume be a new marker to detect neurodegeneration in bipolar disorder? Compr. Psychiatry 2016, 67, 66–72. [Google Scholar] [CrossRef]
  56. Rebolleda, G.; Casado, A.; Oblanca, N.; Muñoz-Negrete, F.J. The new Bruch’s membrane opening—Minimum rim width classification improves optical coherence tomography specificity in tilted discs. Clin. Ophthalmol. 2016, 10, 2417–24125. [Google Scholar] [CrossRef] [PubMed] [Green Version]
  57. Chauhan, B.C.; O’Leary, N.; AlMobarak, F.A.; Reis, A.S.C.; Yang, H.; Sharpe, G.P.; Hutchison, D.M.; Nicolela, M.T.; Burgoyne, C.F. Enhanced detection of open-angle glaucoma with an anatomically accurate optical coherence tomography-derived neuroretinal rim parameter. Ophthalmology 2013, 120, 535–543. [Google Scholar] [CrossRef] [Green Version]
  58. Enders, P.; Schaub, F.; Adler, W.; Nikoluk, R.; Hermann, M.; Heindl, L. The use of Bruch’s membrane opening-based optical coherence tomography of the optic nerve head for glaucoma detection in microdiscs. Br. J. Ophthalmol. 2017, 101, 530–535. [Google Scholar] [CrossRef] [PubMed]
  59. Danthurebandara, V.M.; Sharpe, G.P.; Hutchison, D.M.; Denniss, J.; Nicolela, M.T.; McKendrick, A.M. Enhanced structure-function relationship in glaucoma with an anatomically and geometrically accurate neuroretinal rim measurement. Invest. Ophthalmol. Vis. Sci. 2014, 56, 98–105. [Google Scholar] [CrossRef] [PubMed]
  60. Montolío, A.; Cegoñino, J.; Orduña, E.; Sebastián, B.; García-Martín, E.; Pérez del Palomar, A. A mathematical model to predict the evolution of retinal nerve fiber layer thinning in multiple sclerosis patients. Comput. Biol. Med. 2019, 111, 103357. [Google Scholar] [CrossRef]
  61. Viestenz, A.; Mardin, C.Y. Vigabatrin-associated bilateral simple optic nerve atrophy with visual field constriction. A case report and a survey of the literature. Ophthalmologe 2003, 100, 402–405. [Google Scholar] [CrossRef]
  62. Balestrini, S.; Clayton, L.M.; Bartmann, A.P.; Chinthapalli, K.; Novy, J.; Coppola, A.; Wandschneider, B.; Stern, W.M.; Acheson, J.; Bell, G.S.; et al. Retinal nerve fibre layer thinning is associated with drug resistance in epilepsy. J. Neurol. Neurosurg. Psychiatry 2016, 87, 396–401. [Google Scholar] [CrossRef] [Green Version]
  63. Yang, Z.J.; Wei, J.; Mao, C.J.; Zhang, J.R.; Chen, J.; Ji, X.Y.; Liu, J.Y.; Shen, Y.; Xiong, K.P.; Huang, J.Y.; et al. Retinal nerve fiber layer thinning: A window into rapid eye movement sleep behavior disorders in Parkinson’s disease. Sleep Breath. 2016, 20, 1285–1292. [Google Scholar] [CrossRef]
Figure 1. Literature contribution of different types of papers.
Applsci 10 05477 g001
Figure 2. Chronological distribution of scientific Production. Linear adjustment (blue): y = 1.5015x – 3005.2 (r = 0.8856). Exponential adjustment (red): y = 8E-142e0.1627x (r = 0.8695).
Applsci 10 05477 g002
Figure 3. Literature distribution by 5-year periods.
Applsci 10 05477 g003
Figure 4. More productive countries in the generation of scientific literature on retinal nerve fiber thickness.
Applsci 10 05477 g004
Figure 5. More productive institutions in the generation of scientific literature on retinal nerve fiber thickness.
Applsci 10 05477 g005
Figure 6. Distribution of the documents according to the main topic.
Applsci 10 05477 g006
Figure 7. Chronological distribution of the documents according to the main topic.
Applsci 10 05477 g007
Table 1. Values of the parameters obtained with the exponential model.
Parameter Estimates
ParameterEstimateStd. Error95% Confidence Interval
Lower BoundUpper Bound
c3.0180.6261.7024.334
g1.1310.0151.1001.162
ANOVA a
SourceSum of SquaresdfMean Squares
Regression4415.94222207.971
Residual181.0581810.059
Uncorrected Total4597.00020
Corrected Total1692.95019
Dependent variable: Docs. a R squared = 1 − (Residual Sum of Squares)/(Corrected Sum of Squares) = 0.893
Table 2. Classification of authors based on productivity.
PI ≥ 10 < PI < 1PI = 0Total
(10 or More Articles) (2–9 Articles) (1 Article)
Number of authors212811231253
%0.1610.2289.62100.00
Mean (SD) value of the average peripapillary RNFL thickness (μm) for each of the 90° quadrants of the control and patient groups. Confidence intervals for the difference in means (Difference CI). Significance of difference t-test: p-value. * Statistically significant data (p < 0.05).
Table 3. Most productive authors.
AuthorNº DocumentsIP *h-Index **g-Indexp-IndexCountry
Weinreb, R.N.104.15981501.53United States
Kim, T.W.104.1531461.48South Korea
Park, K.H.83.3234521.53South Korea
Lee, E.J.72.9023371.61South Korea
Zangwill, L.M.72.90701061.51United States
Leung, C.K.S.62.4947711.51Hong Kong
Brandt, A.U.52.0735541.54Germany
Kim, D.M.41.6629451.55South Korea
Kim, H.41.6617291.71South Korea
Paul, F.41.6648821.71Germany
* IP: Participation Index; ** Scopus 2020 data.
Table 4. Distribution of journals in Bradford’s zones.
Nº Journals% JournalsNº Articles% ArticlesBradford Multiplier
Core97.698535.27
Zone 1º3126.507932.783.04
Zone 2º7765.817731.952.48
Total117100.00241100.002.76
Table 5. Journals with highest number of publications on optical coherence tomography retinal thickness measurements.
SourceNº of DocumentsProductivity
Index
Impact
Factor *
Citations
in 2019
Country
of Origin
Ophthalmology239.547.7323337USA
Investigative Ophthalmology and Visual Science114.563.8124844USA
Journal of Glaucoma114.561.661944USA
British Journal of Ophthalmology83.323.6152170UK
Eye (Basingstoke)72.902.3661100UK
PLoS ONE72.902.776104,864USA
Neuro-Ophthalmology62.490.184 **146 **USA
Graefe’s Archive for Clinical and Experimental Ophthalmology62.492.251318USA
JAMA Ophthalmology62,496.1671816USA
Retina52.073.8152153USA
* JCR 2018 data; ** JCR 2012 data.

