Article

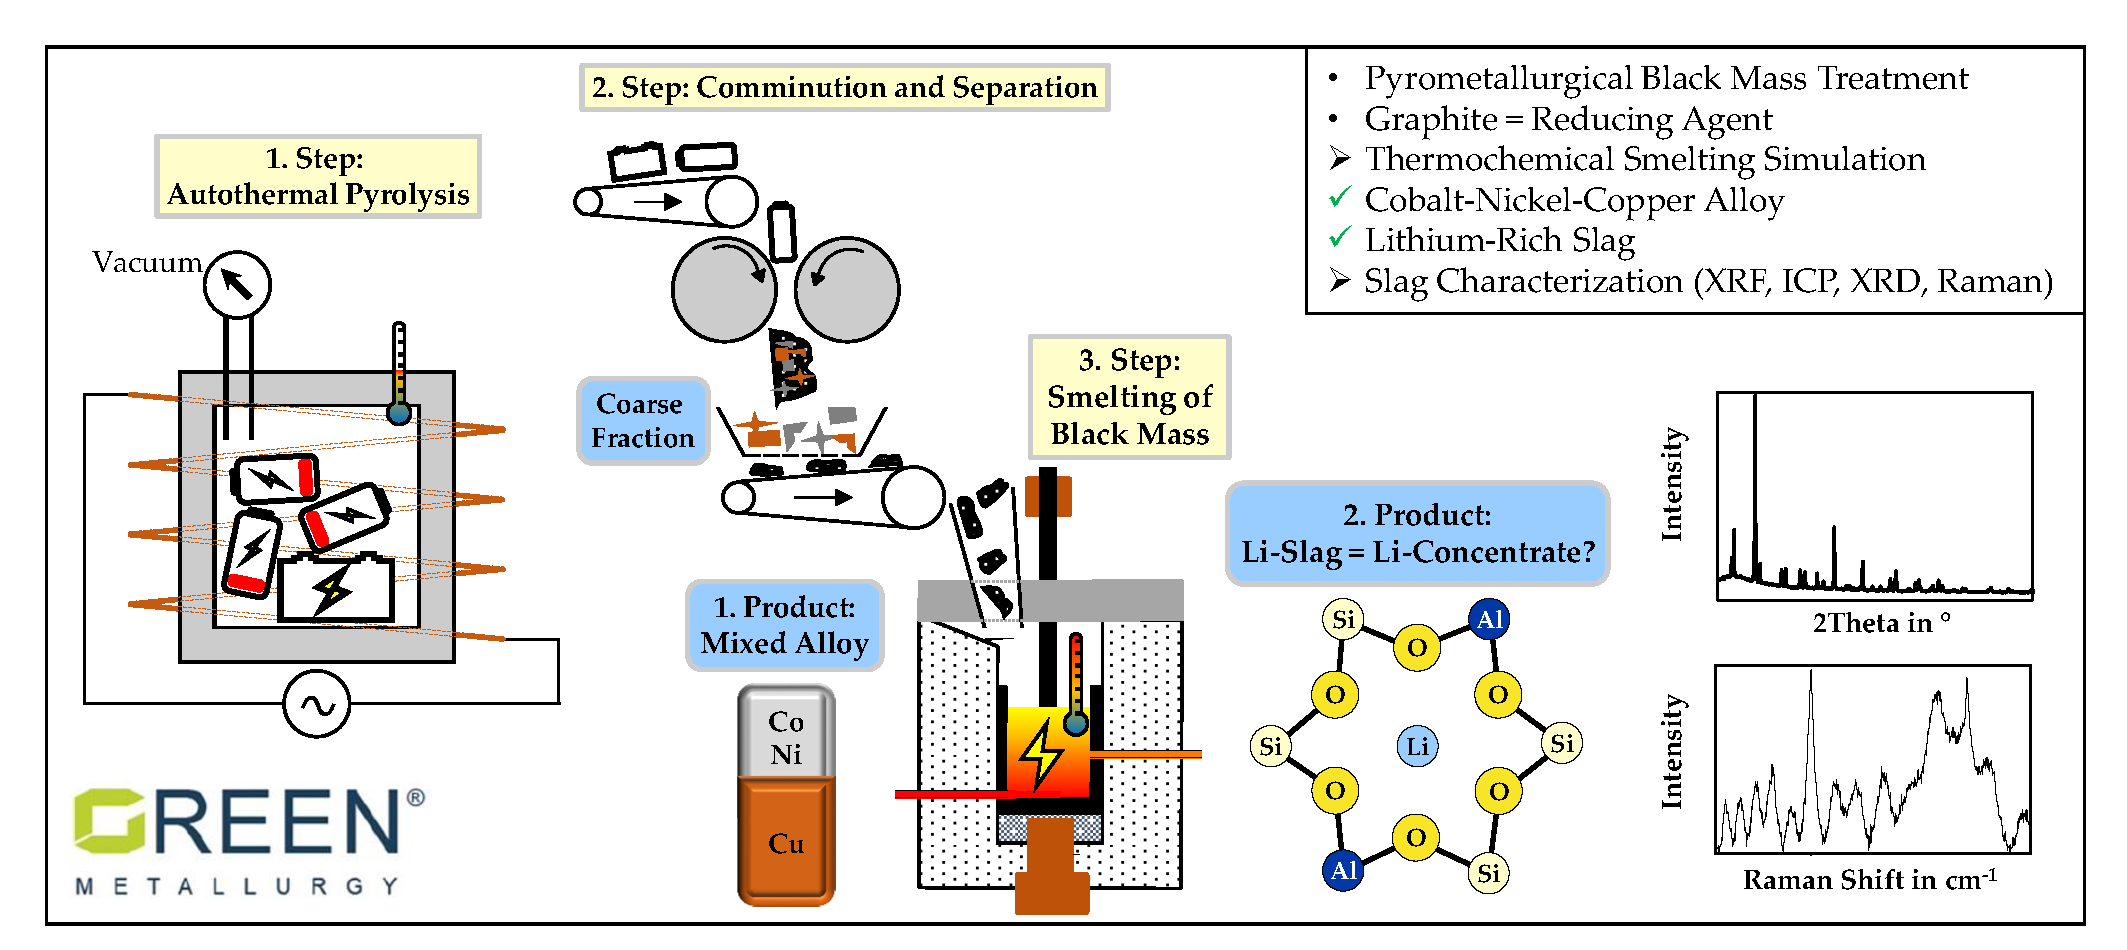
A Combined Pyro- and Hydrometallurgical Approach to Recycle Pyrolyzed Lithium-Ion Battery Black Mass Part 1: Production of Lithium Concentrates in an Electric Arc Furnace

1
IME Process Metallurgy and Metal Recycling, Institute of RWTH University; Intzestraße 3, 52056 Aachen, Germany
2
Institute of Recycling Technologies, Faculty of Materials, Metallurgy and Recycling, Technical University of Košice, Letna 9, 042 00 Košice, Slovakia
*
Author to whom correspondence should be addressed.
Metals 2020, 10(8), 1069; https://doi.org/10.3390/met10081069
Submission received: 15 July 2020 / Revised: 2 August 2020 / Accepted: 5 August 2020 / Published: 7 August 2020

Abstract

:
Due to the increasing demand for battery raw materials such as cobalt, nickel, manganese, and lithium, the extraction of these metals not only from primary, but also from secondary sources like spent lithium-ion batteries (LIBs) is becoming increasingly important. One possible approach for an optimized recovery of valuable metals from spent LIBs is a combined pyro- and hydrometallurgical process. According to the pyrometallurgical process route, in this paper, a suitable slag design for the generation of slag enriched by lithium and mixed cobalt, nickel, and copper alloy as intermediate products in a laboratory electric arc furnace was investigated. Smelting experiments were carried out using pyrolyzed pelletized black mass, copper(II) oxide, and different quartz additions as a flux to investigate the influence on lithium-slagging. With the proposed smelting operation, lithium could be enriched with a maximum yield of 82.4% in the slag, whereas the yield for cobalt, nickel, and copper in the metal alloy was 81.6%, 93.3%, and 90.7% respectively. The slag obtained from the melting process is investigated by chemical and mineralogical characterization techniques. Hydrometallurgical treatment to recover lithium is carried out with the slag and presented in part 2.

Graphical Abstract

1. Introduction

Lithium-ion batteries (LIBs) are currently considered as one of the most important energy storage systems, which is reflected in a wide range of applications, especially for portable devices [1,2,3,4,5,6,7]. Due to the extensive electrification expected in the field of electromobility, batteries will have another key role in the future, ensuring the transition towards a climate neutral economy [8]. In addition to the implementation of electromobility and their widespread use for portable applications, lithium-ion batteries are also indispensable as intermediate storage for the stabilization of decentralized power systems [2,3,4,5,9,10]. Compared to other battery types, LIBs have advantageous technical properties that substantiate their dominance as energy storage systems, including, e.g., high energy density and low self-discharge [10,11].
As a result of increasing applications of lithium-ion batteries, a significantly higher demand for batteries containing critical or strategic raw materials, such as cobalt, lithium, and nickel, is to be expected. Those crucial metals are only available in limited quantities and currently obtained mainly from primary sources [2]. Recycling is an essential aspect of closing the entire substance cycle of LIBs and securing the supply of raw materials for new battery production. To meet the increasing demand for strategic metals, the development of a raw-material recycling economy, in addition to the expansion of mining capacities, is therefore unavoidable [5].
In the European Union, Directive 2006/66/EC applies to the recycling of LIBs, which has been implemented into national law in Germany by the Battery Law (BattG). This directive requires the recycling of fifty percent of the average weight of used batteries, including spent LIBs [12]. The extensive recycling of battery components that exceed the recycling quota of fifty percent is of central importance to ensure the supply of materials for the new battery production and consequently the transition to a climate-neutral economy. This also requires a consideration of battery components such as lithium.
Although lithium does not represent a critical metal, its recovery, especially regarding future battery systems, where lithium will be manifested as an indispensable cathode component, becomes essential. In the field of battery recycling, research projects have been carried out for several years dealing with both single and combined mechanical, pyrometallurgical and hydrometallurgical processes as well as pyrolysis to recover battery components [5,10,11,13,14,15,16,17,18,19,20,21,22,23]. However, the focus is set mainly on critical and valuable metals, which is the reason why lithium as a component has not been sufficiently considered [24]. Overall, the recovery of lithium from active material has not been solved satisfactorily since the recovery is made more difficult by the ignoble character of the metal. Currently, only one percent of the total end-of-life lithium is recycled [25,26]. In pyrometallurgical processes, lithium is converted into slag, which is either used as a construction material, undergoes further hydrometallurgical treatment, or can be sold, e.g., for the cement industry [27]. Hydrometallurgical processes allow lithium to be recovered from black mass, for example as lithium carbonate [28].
Within the scope of this work, a combined pyro- and hydrometallurgical process was designed, which enables a complete recovery of the valuable metals present in the black mass of spent LIBs. In a first process step, the production of artificial lithium concentrates will enable the recovery of lithium, while more precious components, such as cobalt and nickel, can be recovered via the generated metal alloy.
To obtain a maximized lithium yield through a combined pyro- and hydrometallurgical process, in this study the preconditions of lithium-containing slag for the subsequent hydrometallurgical recovery are designed. This slag design aims to ensure a stable process in the presence of varying metal contents in the black mass resulting from fluctuating scrap input materials. A comparable approach was followed by Georgi-Maschler et al. [29], whereby the deviation in the present study is a slag design adapted to the subsequently performed hydrometallurgy. Additionally, a different slag system was used to generate a SiO2-Al2O3-Li2O slag. A delimitation is also given by the addition of copper oxide, which enables the use of excess graphite in the black mass as a reducing agent.

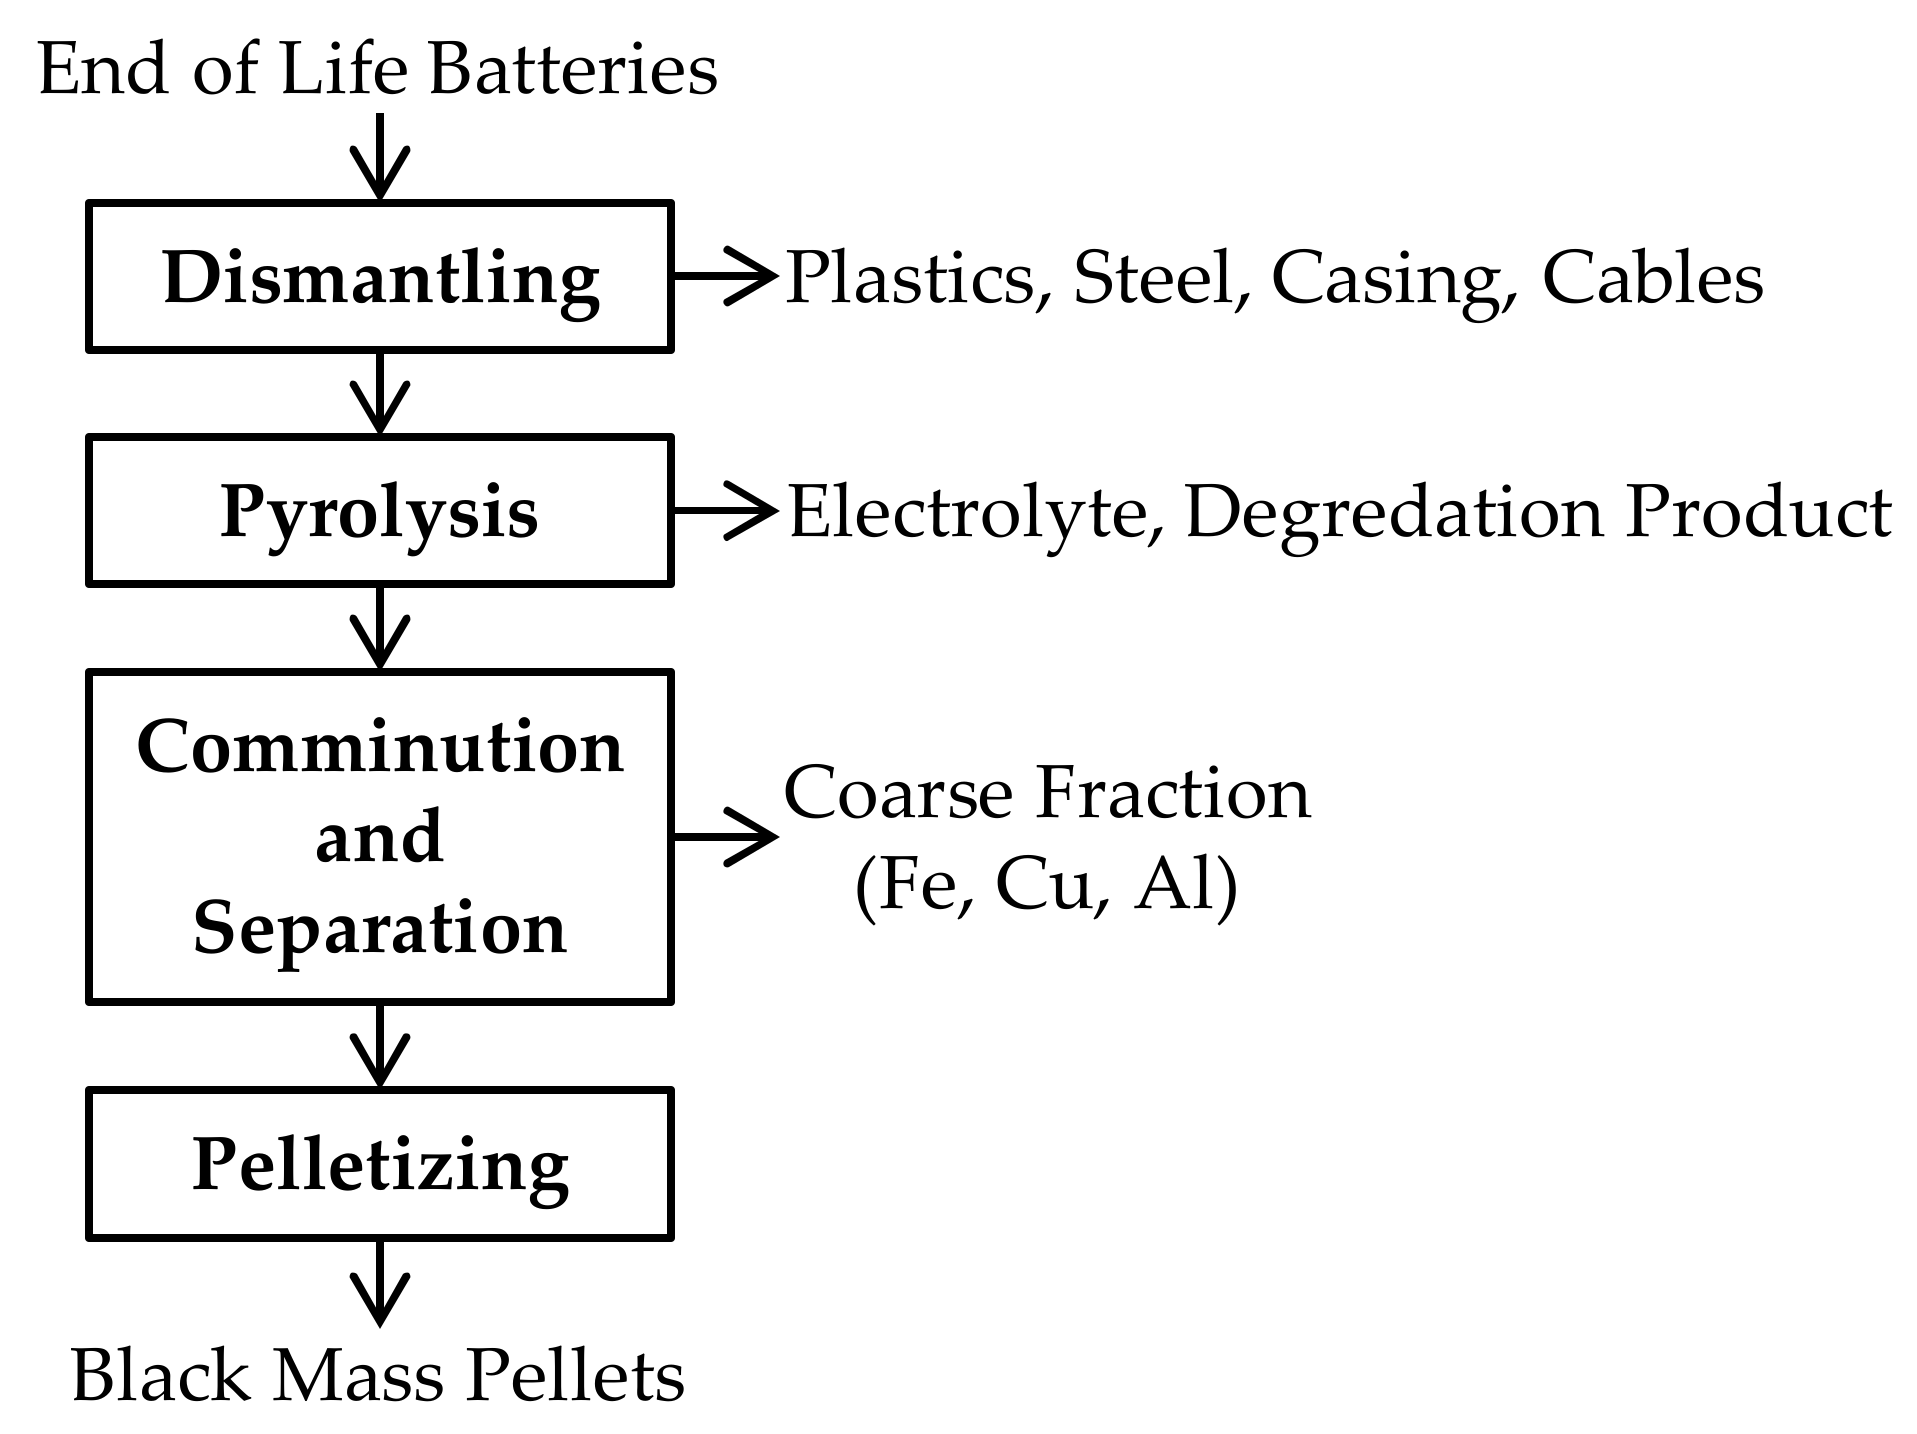
2. Materials and Methods

2.1. Used Materials

The black mass used as initial material for pyrometallurgical treatment was provided by Accurec Recycling GmbH (Germany). To obtain the pelletized black mass for subsequent pyrometallurgical treatment it has to pass several pretreatment process steps which are shown in Figure 1. In the dismantling step, a manual removal of Cu cables, the steel casing, plastics, and electrical components is implemented. The subsequent pyrolysis step enables a deactivation of batteries and vaporization of the electrolyte. At last, the pyrolyzed batteries pass further mechanical treatment steps, such as comminution and sieving to separate the coarse fraction from the black mass-containing fine fraction <100 µm, which is further pelletized and applied as raw material for the electric arc furnace (EAF) smelting process.
The pelletized black mass was analyzed with a “Spectro CIROS Vision” inductively coupled plasma-optical emission spectrometer (ICP-OES) made by “SPECTRO Analytical Instruments GmbH, Kleve, Germany”. All ICP-OES measurements were carried out twice. Carbon analysis was carried out with an “ELTRA CS 2000” system made by “ELTRA GmbH, Haan, Germany” based on a combustion method. Carbon measurements were carried out three times per sample. Table 1 shows mean value of the analysis of the received black mass and the standard deviation of the sample set (Std. Dev.). Regarding the composition of pelletized black mass, the high cobalt content compared to manganese and nickel content must be emphasized. Further elements like halogens or phosphorus in the initial resource were not analyzed.
Commercial grade quartz from “Quarzwerke GmbH, Frechen, Germany” was used as a flux in this research with a SiO2-content above 98 wt.%. Copper(II) oxide from “Lomberg GmbH, Oberhausen, Germany” was used with a CuO-content above 98.9 wt.%. For calculations and simulations, the SiO2 and CuO contents of those raw materials were assumed to be 100 wt.%.

2.2. Thermochemical Modeling

Thermochemical modeling was carried out using the “Equilib-module” of FactSageTM 7.3 [30] to simulate the smelting process step. The influence of fluxing the black mass with SiO2, Al2O3 and CaO and mixtures of those oxides on the lithium-slagging were investigated. Furthermore, the influence of the process temperature was studied. The distribution of lithium in the process was investigated in detail for varying amounts of SiO2-additions.
The databases FactPS, FToxid and SGTE 2014 were used [30]. The FToxid database was used for oxidic solid solutions, the FToxid-SLAGA phase and pure oxides, the FactPS database was used for pure substances, while duplicates already included in the FToxid phase were excluded from the FactPS database, the liquid alloy phase from the SGTE 2014 database was used. Due to the fact that the FToxid-SLAGA solution does not contain lithium components in the original model, liquid lithium oxide, silicates, aluminate, and carbonate were merged into the solution model and treated as an ideal solution, therefore the activity coefficient is assumed to be one, which is not realistic and is one of the limitations of this model. In the “compound species” selection, the “ideal” option was used for the gas phase. In all cases, the normal equilibrium was calculated, the pressure was set to be one atmosphere and the molar volume of solids and liquids was assumed to be zero.
To simulate the change in Gibbs energy for reactions of pure substances, the “Reaction-module” of FactSageTM 7.3 with the database FactPS was used [30]. As a step size, 10 K was used and involved in the reaction was always the most stable form of a compound at any given temperature.
A solidification simulation of the slag based on the analyzed composition of the slag was carried out using FactSageTM 7.3 [30]. As only the slag was of interest for this step, only the FactPS and FToxid database [30] were used, the other settings were the same compared to the smelting simulation. The Scheil-Gulliver cooling model was used, therefore, after each temperature step solidified species are excluded from the total mass balance and equilibrium. The starting temperature was set to be the temperature, where no solids were present and only the slag phase occurred, the cooling step rate was defined as five Kelvin in the program. Transition metal oxides and oxides of minor elements were neglected in the solidification simulation, and therefore only the following oxides were included in the simulation: Li2O, SiO2, Al2O3, MgO, CaO, and BaO.

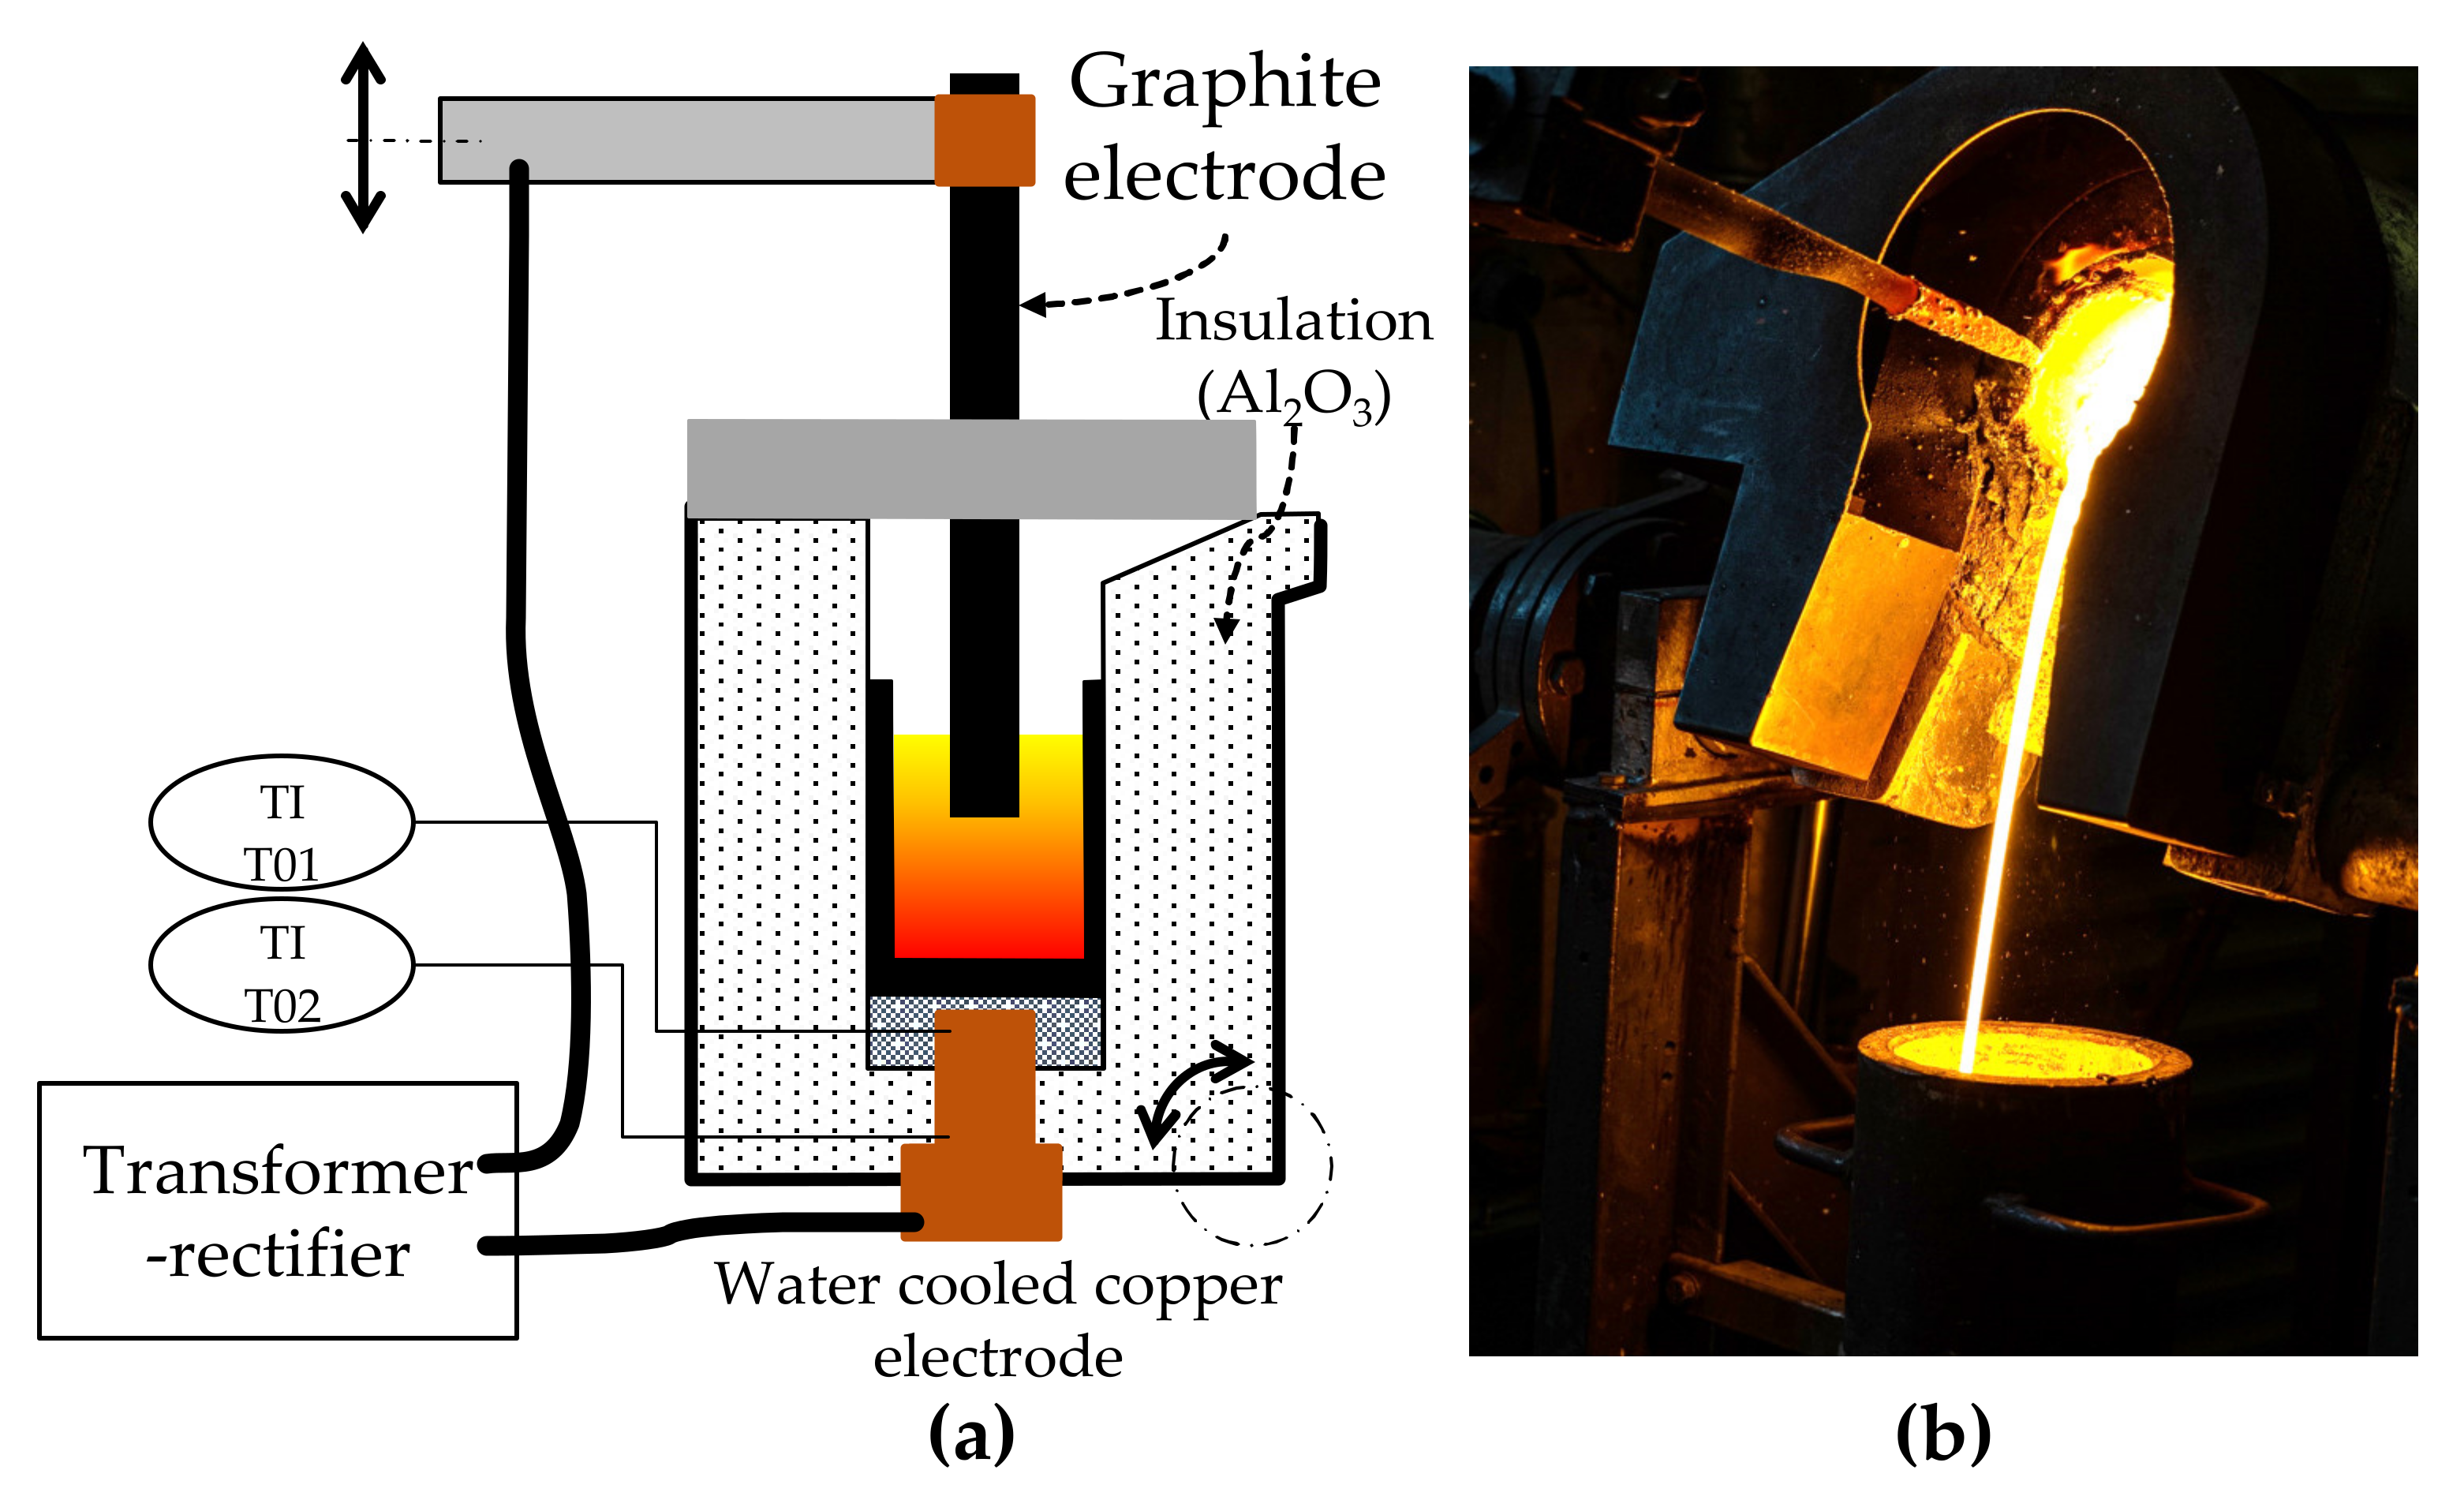
2.3. Smelting Trials in an Electric Arc Furnace

Smelting experiments were carried out in a direct-current (DC) electric arc furnace with a voltage between zero and eighty volt and a current between zero and thousand amperes. Therefore, the maximum power is eighty kilowatts. The power is infinitely variable, while the voltage is dependent on the electrical resistance of the charge and the furnace itself. The electrical current is therefore controlled by the operating system according to the set power. The position of the top electrode can be adjusted with a hydraulic system. A schematic sketch of the furnace and a picture of the furnace in operation is shown in Figure 2.
The smelting operation was carried out in a high-purity graphite crucible with an inner diameter of 120 mm. The volume of the crucible was 2 L. The graphite top electrode had a diameter of 50 mm and was immersed in the slag during smelting. Before the trial, the crucible was heated to roughly 1000 °C. Fluxes, copper(II) oxide and pelletized black mass were feed simultaneously by hand. Thereby, 3.5 kg of black mass was smelted per trial, whereas the flux-addition was varied. The copper(II) oxide addition was also varied within the trials, as the influence of the CuO-addition can vary from trial to trials. It was planned, that CuO reacts with excess carbon from the black mass, but as CuO can also react with carbon monoxide in ascending gases [31] as shown in Equations (1) and (2) or with graphite from the crucible or electrode, a controlled CuO-addition is difficult and therefore the CuO-addition was adjusted during the trial, based on the visual appearance of the slag. If excess graphite was floating on the slag, additional CuO was added.
CuO(s) + CO(g) ⇌ Cu2O(s) + CO2(g)
Cu2O(s) + CO(g) ⇌ 2Cu(s) + CO2(g)
The smelting temperature was 1600 °C in every trial with an estimated accuracy of ±25 °C. The temperature in the slag was measured discontinuously with type B thermocouple immersion probes made by “Heraeus Electro-Nite GmbH & Co. KG, Hagen, Germany”.
The feeding time was between 90 and 110 min. After the material was completely charged into the furnace, the melt was kept at a constant temperature for ten minutes to allow further reactions between the slag and metal. Slag samples were taken during the holding time with a cold cast-iron rod, the chemical composition of the solidified slag was then analyzed. Samples for mineralogical and chemical investigation were taken from the bulk slag phase after each trial. After the holding time, the melt was either poured into a cast-iron-mould, as can be seen in Figure 2, or the melt was kept in the crucible and furnace. This was done to investigate the effect of the cooling rate on the slag mineralogy. The cooling rate for tapped trials is significantly higher, compared to the trials which solidified in the furnace since the refractory material of the furnace is also heated up during the trial and is working as further heat insulation and heat storage. Metal alloys from two trials were analyzed after solidification and a remelting operation.

3. Results

Results obtained from the thermochemical simulation are described in this section and the results of the smelting trials, including chemical and mineralogical investigations of the obtained slag and an exemplary chemical analysis of the metal phases obtained from two trials. Off-gas and dust is not analyzed from the trials.

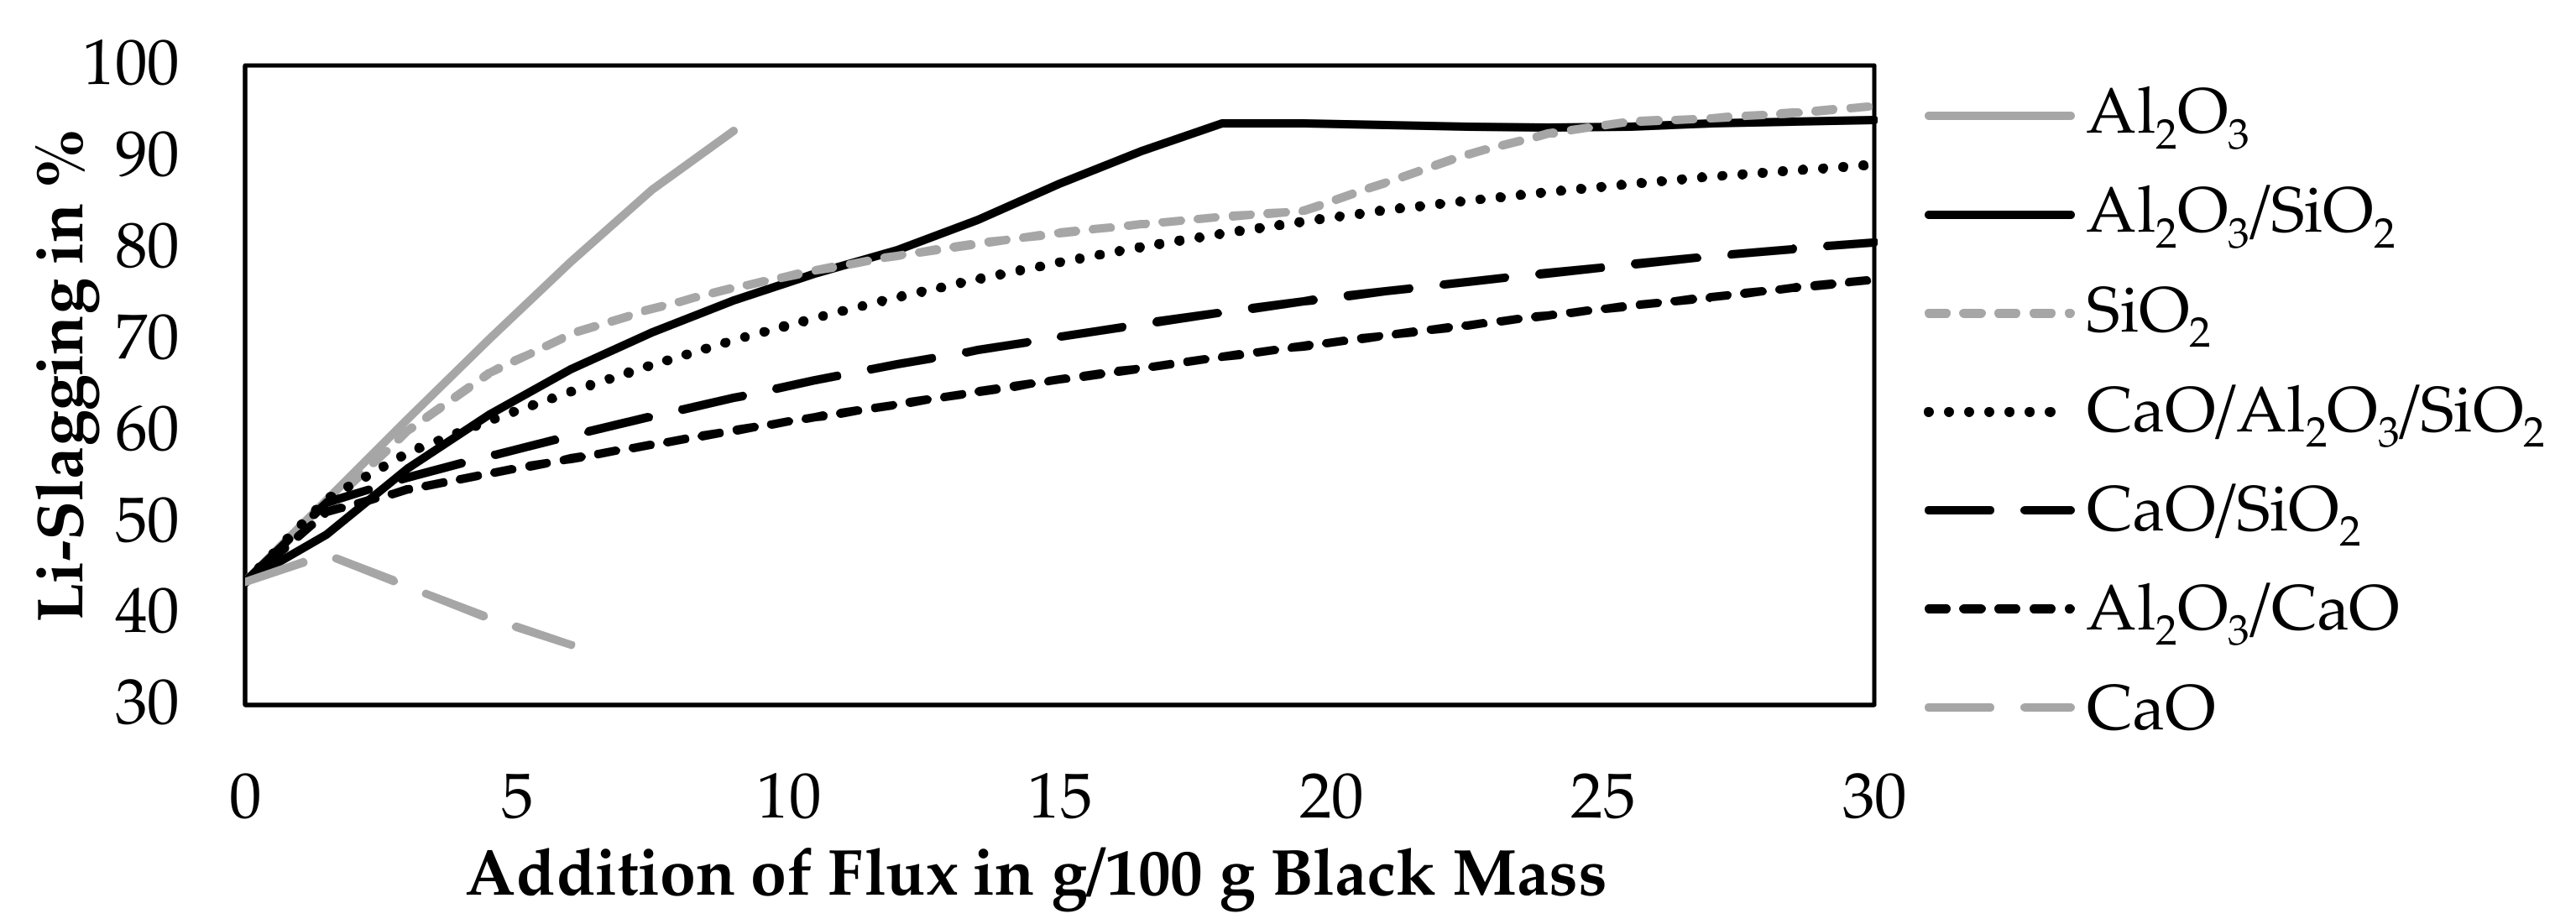
3.1. Results of Thermochemical Modeling

A thermochemical simulation is carried out with the program FactSageTM [30] to determine possible process conditions, which increase the amount of lithium being transferred into the slag. The influence of various oxide additions and the melt temperature are considered as the main variable parameters. Furthermore, the stability of lithium components is investigated and the distribution of lithium into different phases occurring in the process is shown in detail for one slag system.

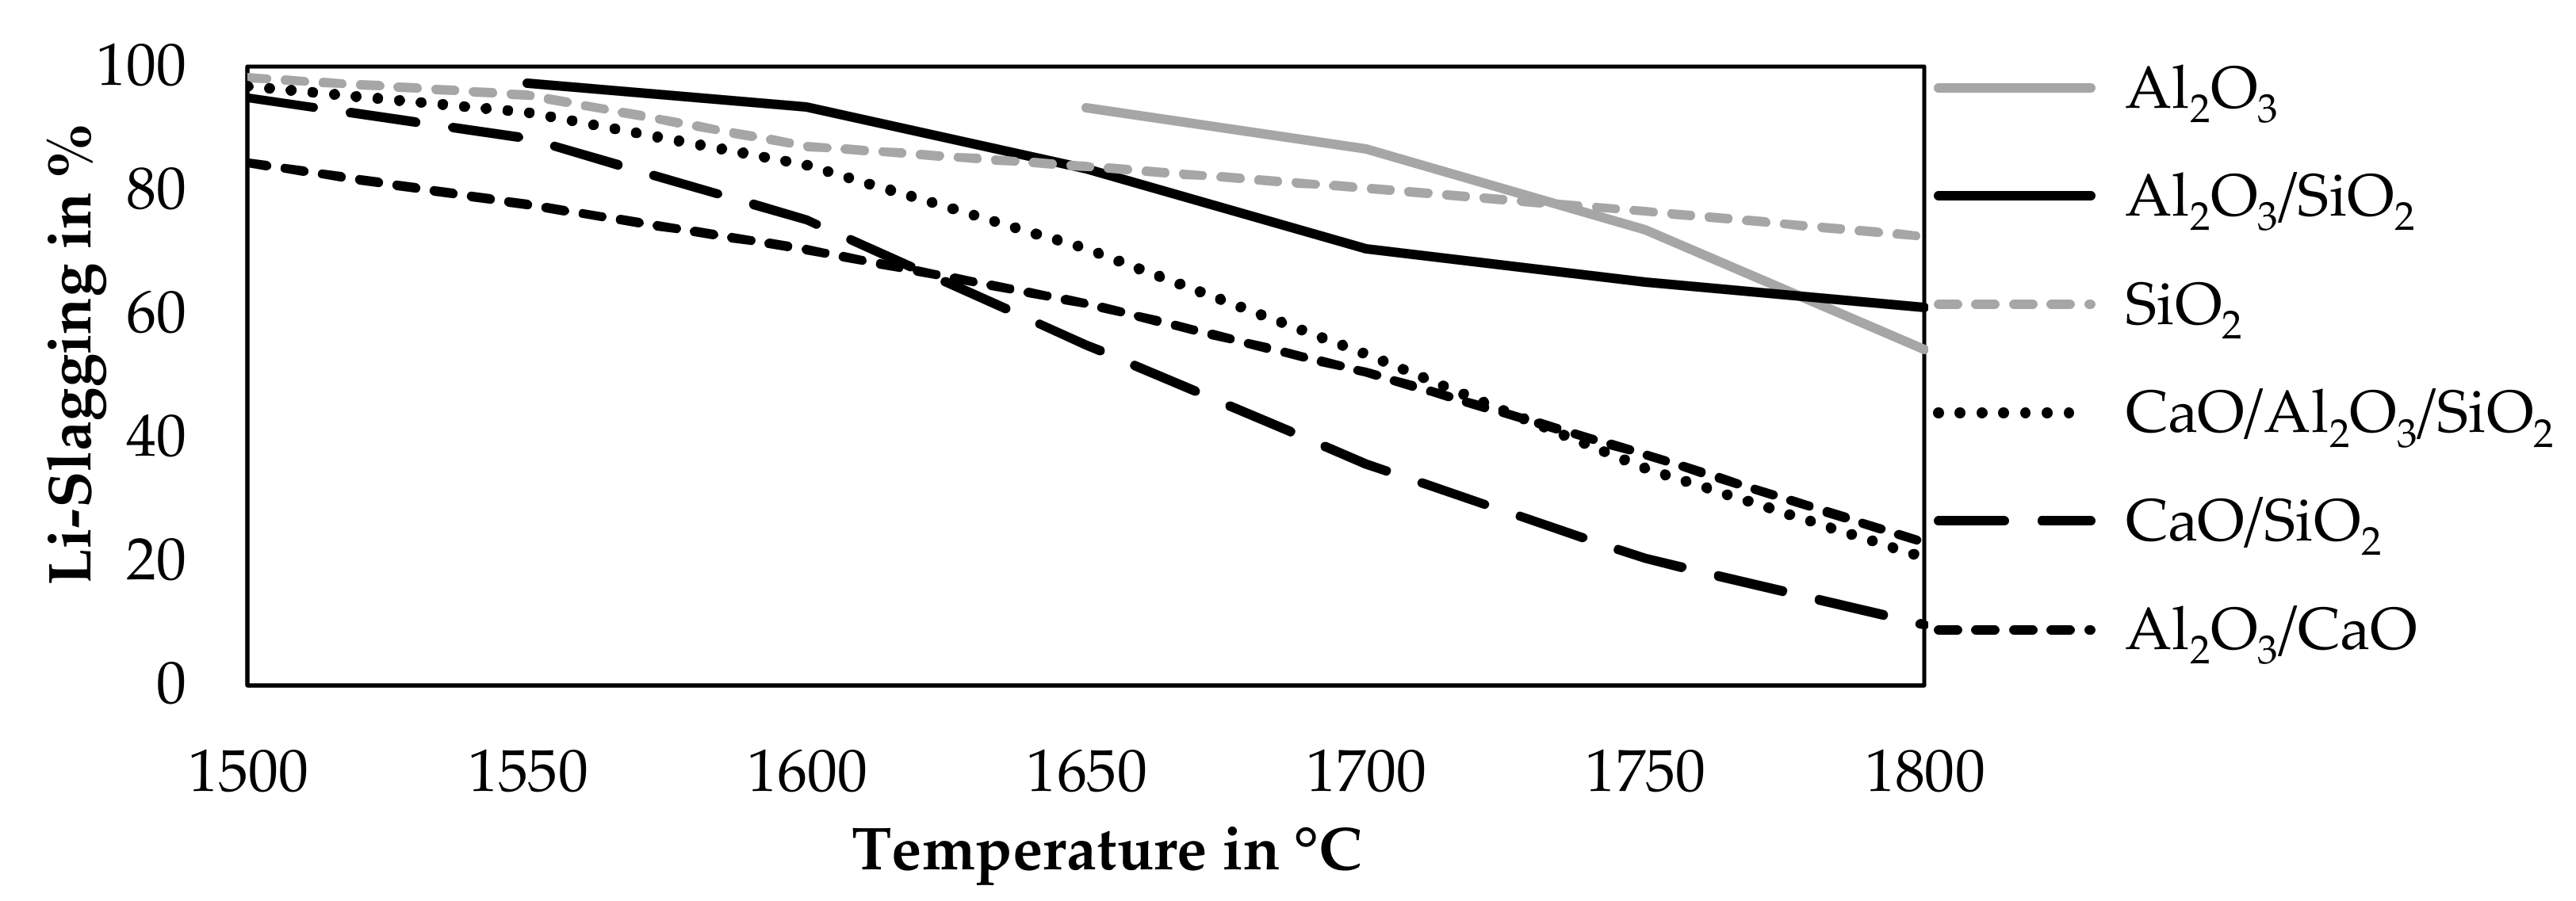
3.1.1. Influence of Different Oxidic Fluxes on the Lithium Slagging

To investigate the effect of different oxides on the lithium slagging, a thermochemical simulation was carried out at a constant temperature of 1600 °C and a constant addition of copper(II) oxide of 65 g per 100 g of black mass with the composition listed in Table 1. The CuO-addition was set to 65 g, because at 1600 °C, in the absence of fluxes, there was still solid carbon present in the system, which is always the case in the laboratory trials, due to the contact of the graphite crucible and the graphite electrode with the molten phases. An additional amount of 12.09 g of Oxygen per 100 g of black mass was added to the solution, based on the assumption that the lithium is present as LiCoO2 in the material and that leftover cobalt, nickel, and manganese are present as a divalent metal oxide.
The lithium slagging in this work is defined, as the amount of lithium present in the slag and any occurring solid lithium aluminate or aluminosilicate in relation to the lithium input. This assumption was made, as the regular slag solution model does not contain lithium compounds and therefore, the slag could be completely molten, even if solid lithium compounds occur according to the simulation. Equation (3) is used to calculate the slagging.
Li - slagging = 100 %   ·   m Li Slag + m Li Solids m Li Black   mass
Figure 3 shows the results of the simulation. Only Al2O3, CaO, SiO2 were investigated in this simulation and mixtures of those oxides. Binary mixtures contained 50 wt.% of each oxide and ternary mixtures contained 33.333 wt.% of each oxide. The step size of the flux addition was 1.5 g per 100 g black mass.
According to the simulation, a CaO-addition above 6 g will lead to a saturation of the slag and the presence of solid CaO. An Al2O3-addition above 9 g will also lead to a saturation of the slag and the presence of solid Al2O3. Therefore, the addition of those fluxes is not investigated further the point of saturation.
Al2O3 and SiO2 improve the lithium slagging in every investigated combination, while pure CaO is the only investigated flux, which decreases the lithium slagging. This could be explained by the lower lithium solubility in CaO-slag systems [32]. An addition of more fluxes is beneficial to achieve a higher slagging of lithium, except for lime, where the slagging increases after an addition of 1.5 g CaO and starts to decrease with higher additions again. More than 90% of slagging is obtained, if more than 22.5 g of SiO2, 9 g of Al2O3, or more than 16.5 g of an Al2O3-SiO2 mixture is added.

3.1.2. Influence of the Process Temperature on the Lithium Slagging

The previous investigated fluxes and mixtures were simulated at different temperatures to investigate the influence of the temperature on the lithium slagging. Pure CaO is already excluded as a possible flux, due to a decrease in lithium slagging accompanied by an addition of CaO according to Figure 3. A constant addition of 21 g fluxes per 100 g black mass was investigated while maintaining the other parameters constant compared to the previous simulation. The step size was 50 °C. Figure 4 shows the results of that simulation.
Two slag system showed solid species at lower temperatures in this simulation. An addition of Al2O3 leads to solid Al2O3 at temperatures below 1650 °C and the mixture of Al2O3-SiO2 leads to solid Al2O3 at temperatures below 1550 °C, therefore, those results are excluded. In all cases, a lower smelting temperature leads to lower lithium losses into the gas and metal. The highest lithium slagging is obtained by an addition of SiO2 at 1500 °C with a lithium slagging of 98.3%, followed by an addition of an Al2O3-SiO2 mixture at 1550 °C with a lithium slagging of 97.3%. The mixtures containing CaO are inferior compared to SiO2, Al2O3, and the mixture of those oxides, especially at higher temperatures, where the disadvantage of CaO becomes obvious.

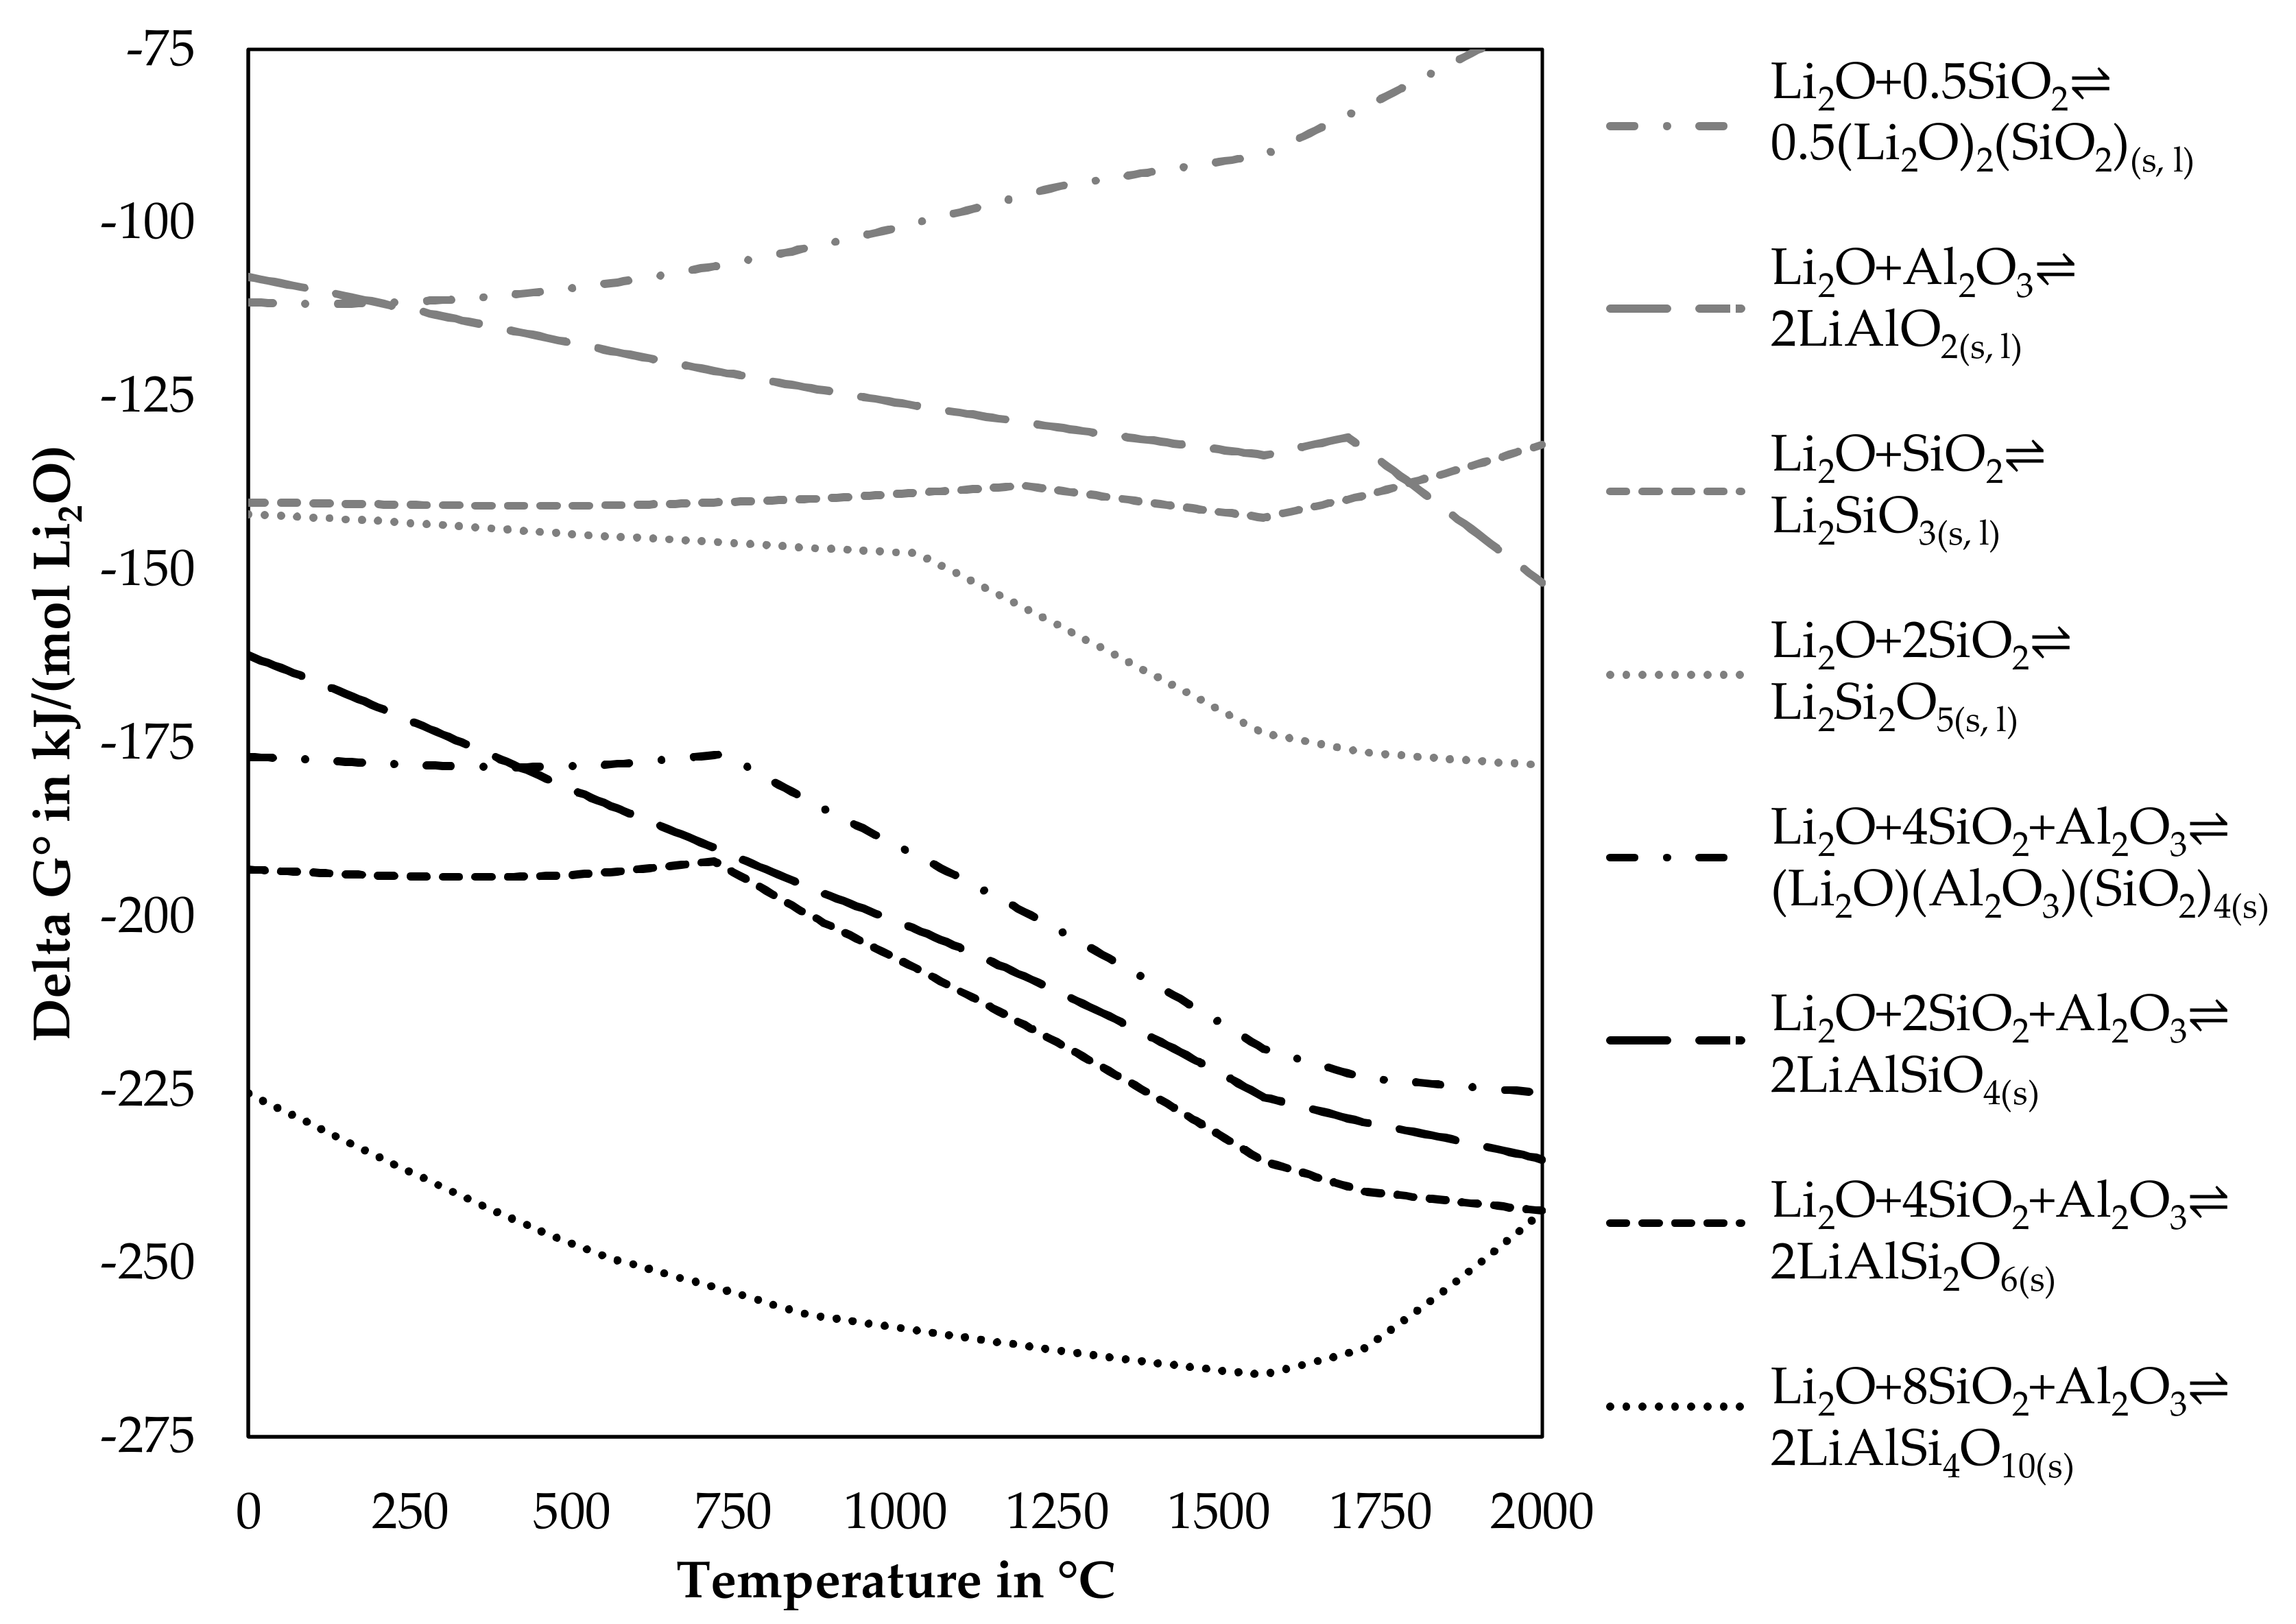
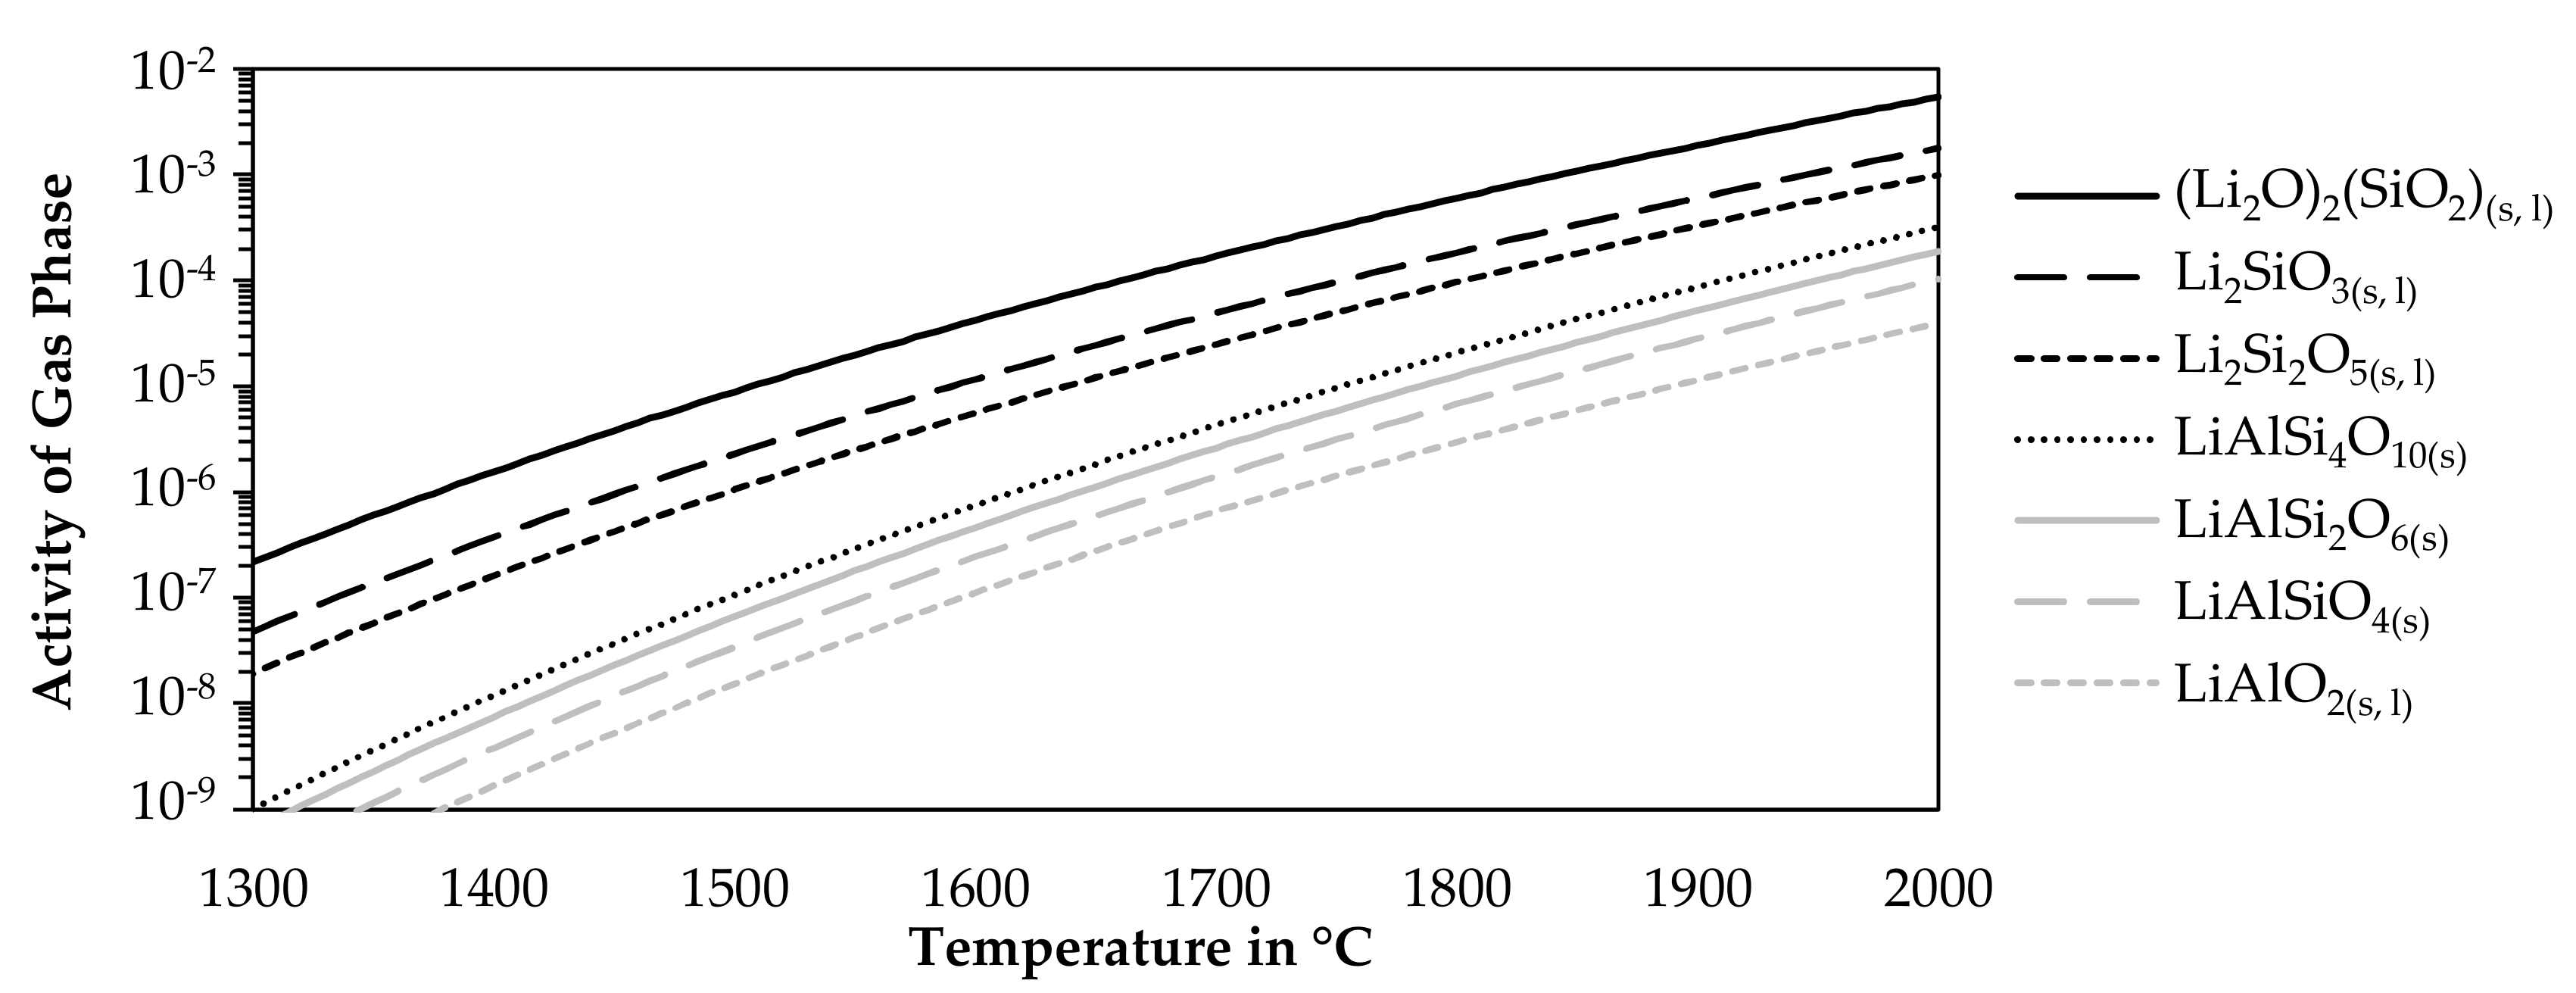
3.1.3. Theoretical Stability of Lithium Minerals

The positive influence of Al2O3 and SiO2 can be explained, by the change of Gibbs energy for reactions including one mole Li2O with SiO2, Al2O3 or both. Figure 5 shows the change of Gibbs energy of reactions for lithium minerals available in the FactSageTM databases [30] dependent on the temperature.
As Delta G° of the reactions presented in Figure 5 is always negative in the investigated temperature range, those reactions would occur spontaneously, if all reactants are available for reactions. The lithium aluminosilicates have lower Delta G° values compared to the silicates and the aluminate and should therefore be more dominant in the slag, however, this depends also on the composition of the slag and other elements, which could react with alumina or silica, as only the elements listed in each reaction are considered. Changes in the slope of a graph are normally accompanied by phase transition. However, the dataset for lithium aluminosilicates only contains those in the solid-state, whereas for silicates and aluminates also liquid phases are included in the database. Table 2 lists the investigated lithium-containing silicates, aluminates, and aluminosilicates from Figure 5. Included in the table is the transition temperature from the low-temperature modification to the high-temperature modification, if available and also the melting point, if available in the dataset. Furthermore, the lithium content for stoichiometric compounds is listed.
To avoid lithium losses due to fuming, the stability of pure lithium compounds was evaluated against volatilization. Therefore, the activity of the gas phase above pure lithium compounds listed in Table 2 was investigated for varying temperatures at a constant pressure of one atmosphere. The step size was 5 °C. For the simulation, only the listed lithium compound was allowed to form as condensed phases for each curve. There were no restrictions on the gaseous components which could form. Figure 6 shows the results of this model for seven lithium compounds.
The higher the activity, the more likely it is, that a component is volatilized. As the activity is always below one, no gas was formed in equilibrium in absence of other components, however, in an open smelting process, there will always be an atmosphere above the charge or the molten phases, which would allow the uptake of lithium from the slag or solid lithium components. The figure shows that the lithium silicates are more likely to be volatilized while increasing silicon contents in the silicates decrease the activity of the gas phase. The aluminosilicates are more stable. However, a lower silicon content is beneficial in this case. The most stable compound is lithium aluminate according to the simulation.

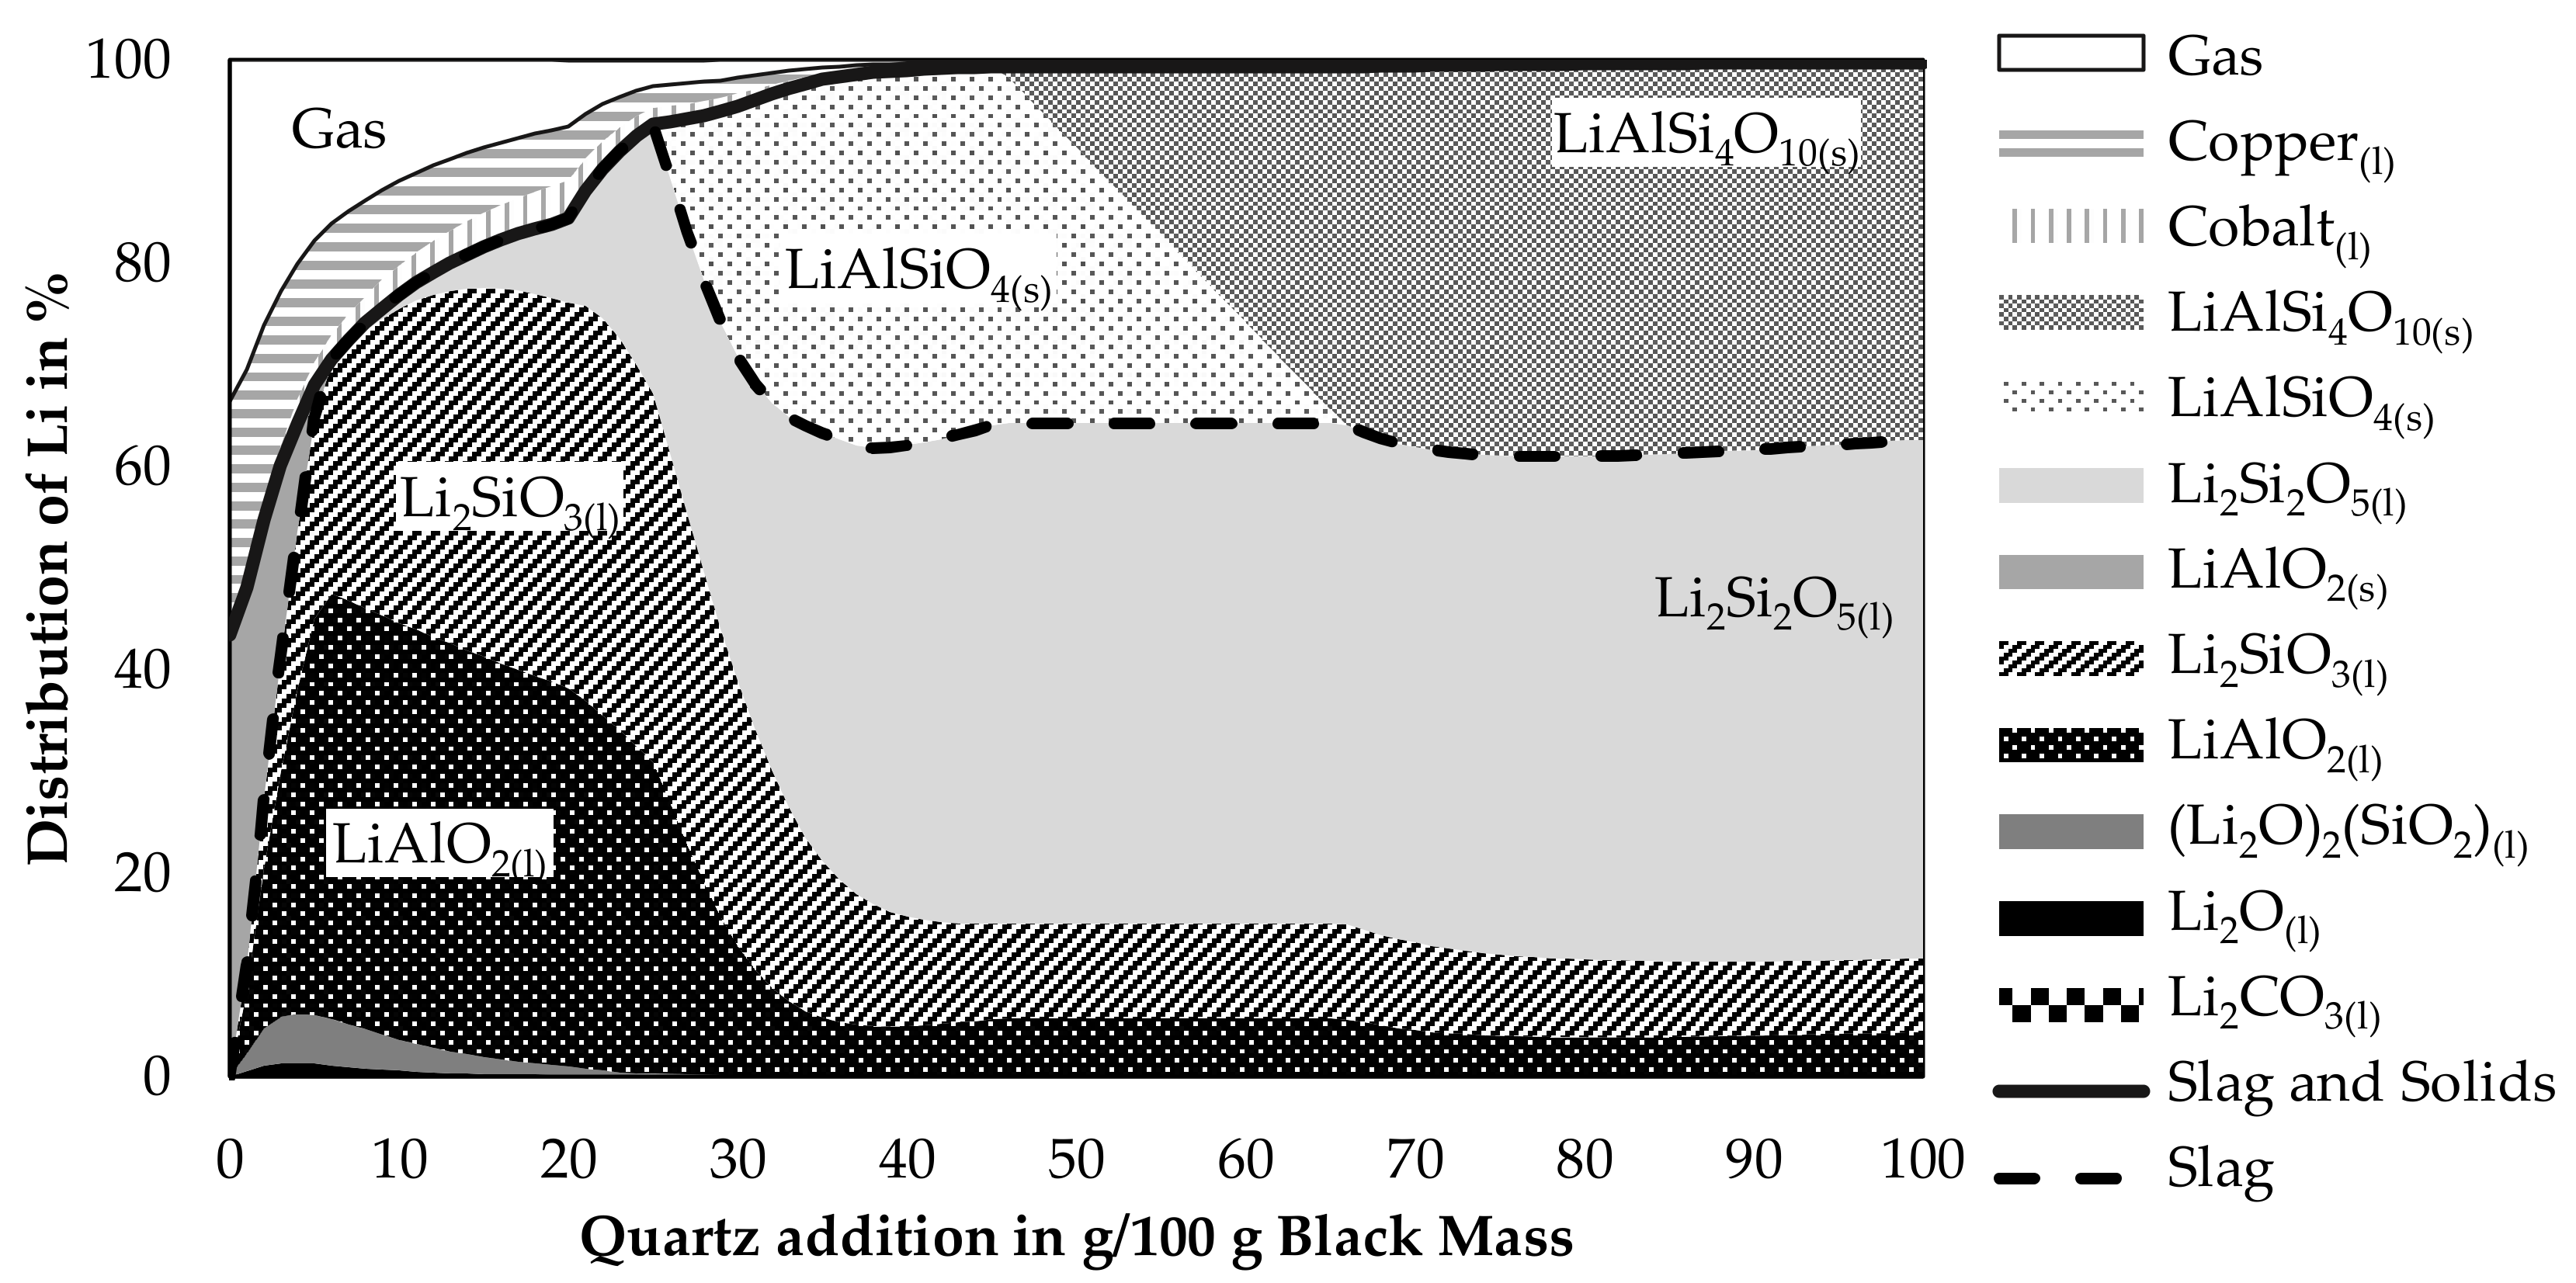
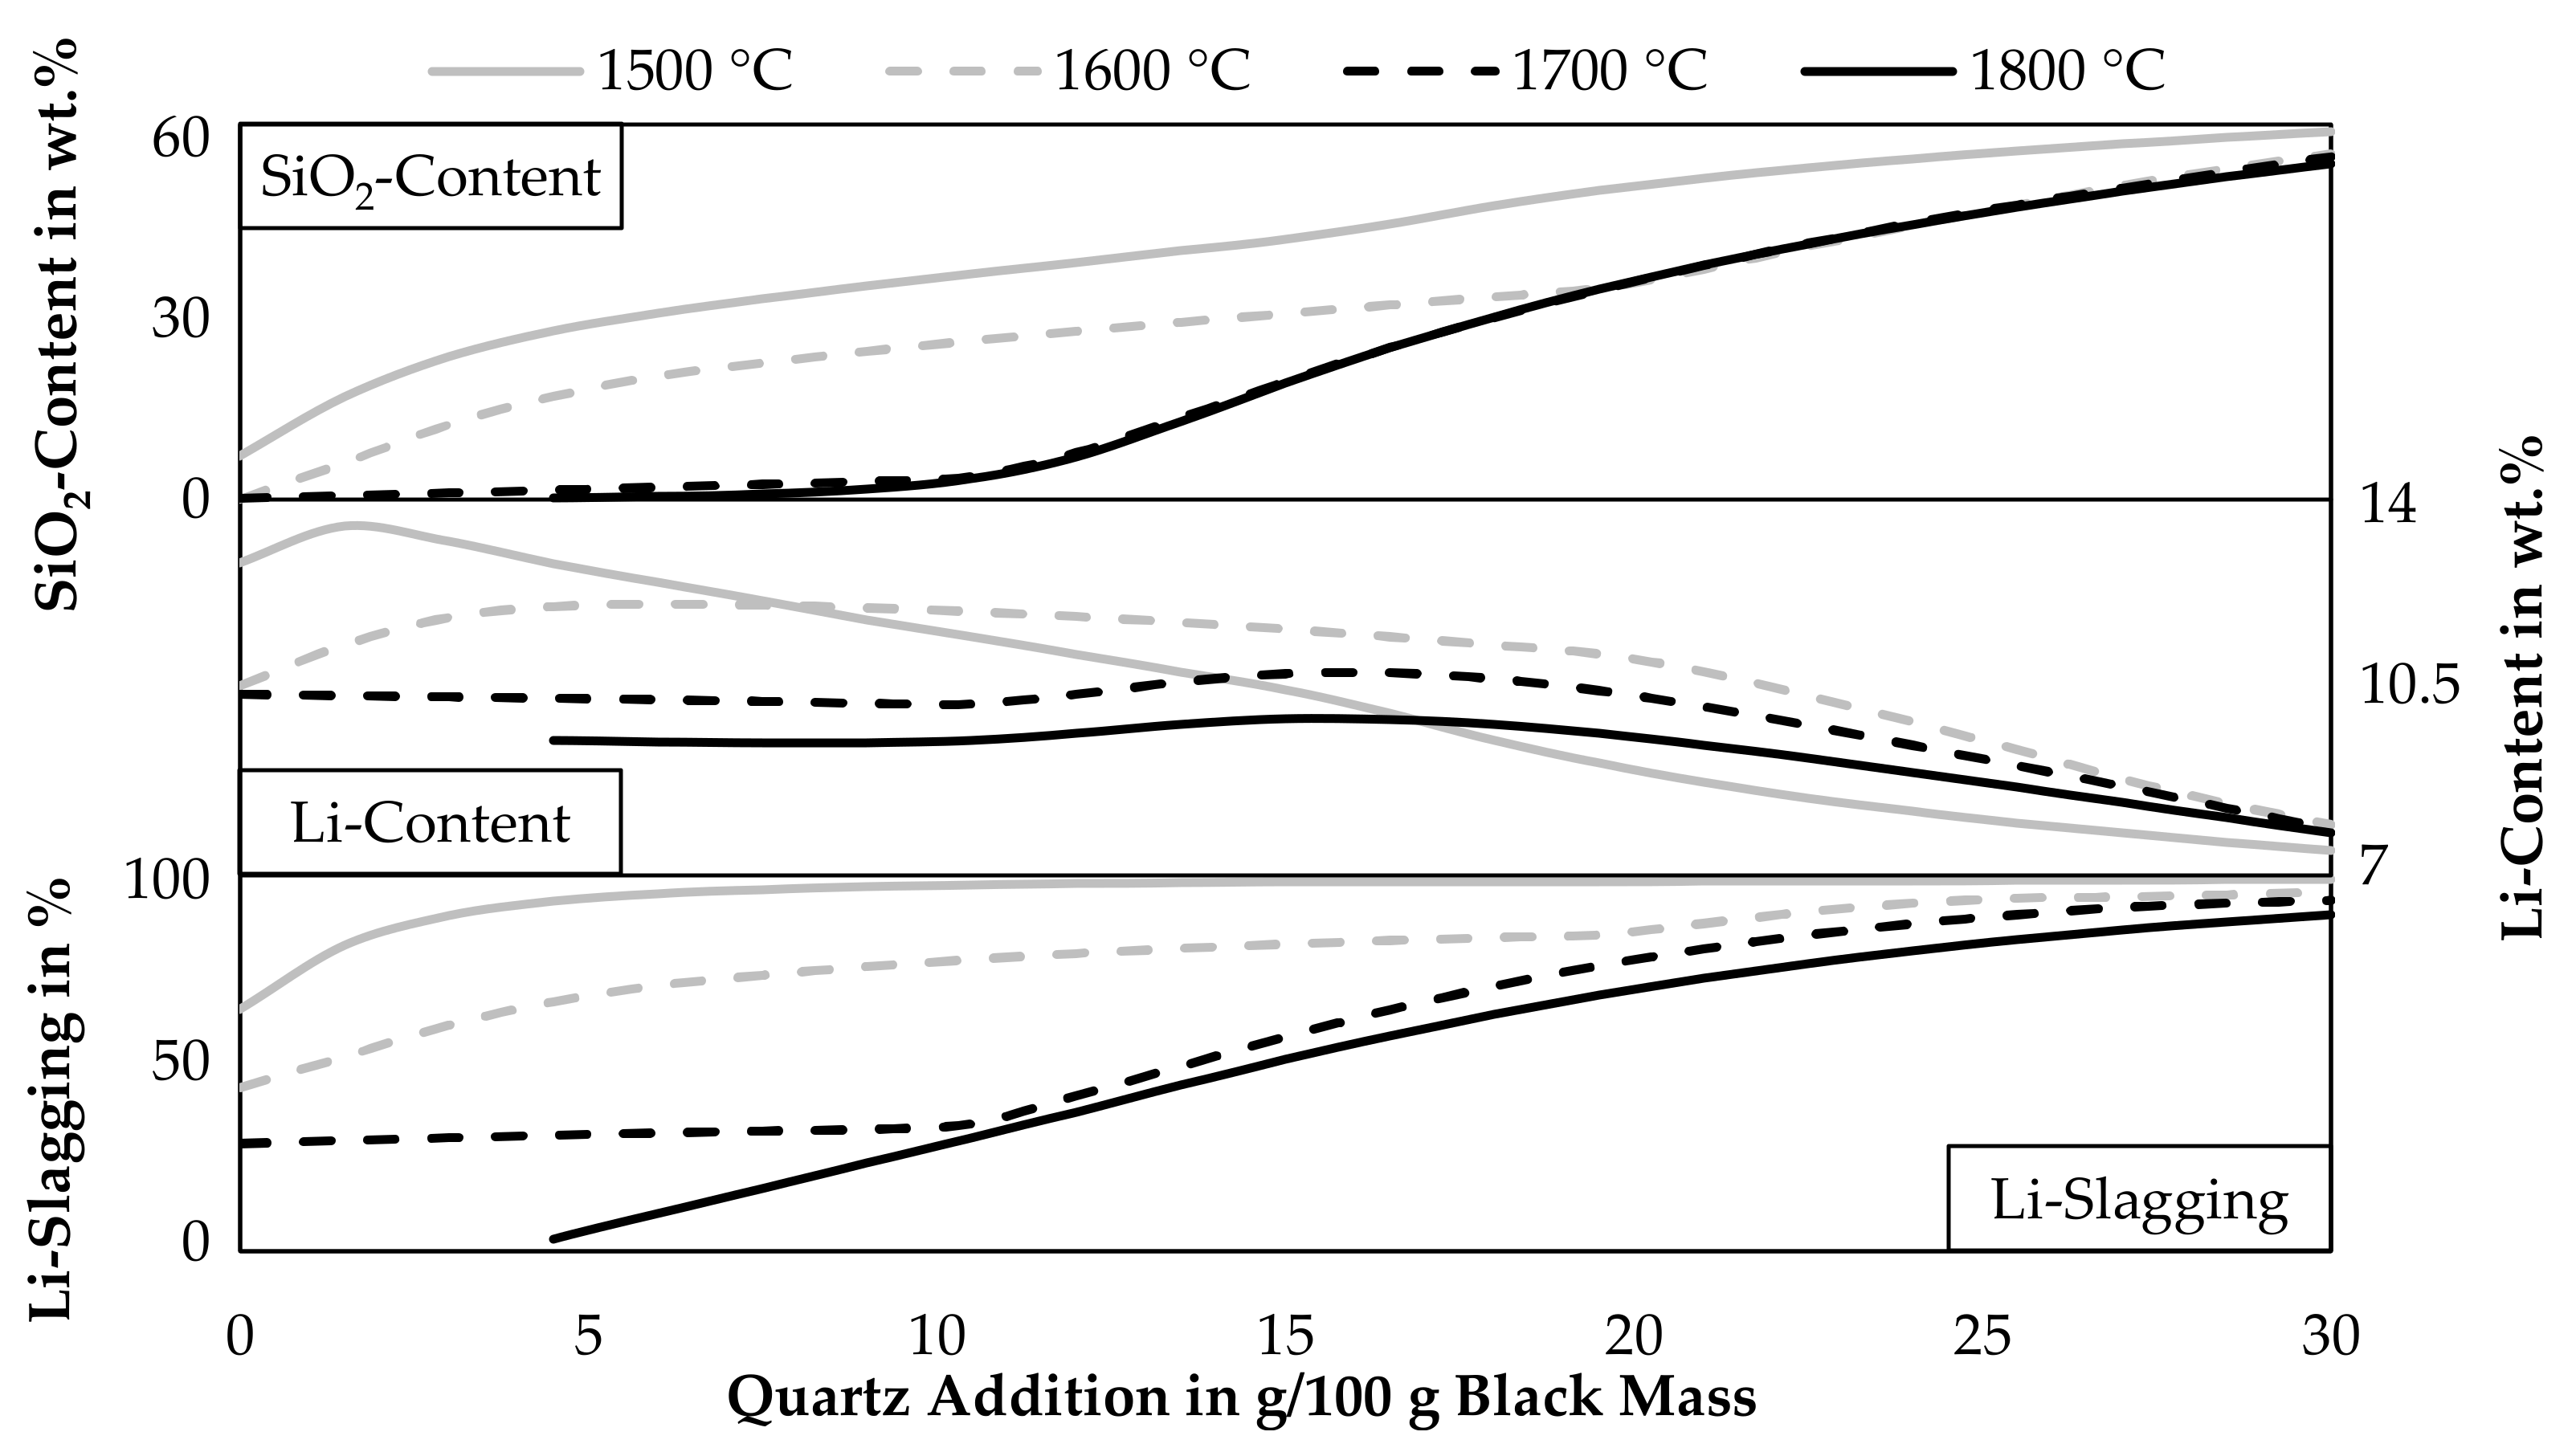
3.1.4. Detailed Investigation of the Addition of Quartz as a Flux

Due to the abilities of quartz to promote the slagging of lithium and the prospect of lower possible smelting temperatures according to the findings in Figure 3 and Figure 4, the behavior of lithium while varying the quartz addition was investigated further in a simulation presented in Figure 7. The CuO-addition was again fixed with 65 g per 100 g black mass. As a temperature, 1600 °C was chosen. The step-size was decreased to an addition of one gram of quartz per 100 g black mass. Even though a lower temperature should increase the slagging of lithium and should be possible according to the simulation shown in Figure 4, a higher temperature was chosen as slags show lower viscosities at higher temperatures and therefore valuable metal losses due to entrained metal droplets in the slag should be lower at higher temperatures. Liquid lithium components in the figure are all merged as ideal solutions into the slag model FactSageTM [30]. The combined amount of lithium in this idealized slag phase is expressed by the black dashed line. The solid black line is expressing the combined lithium slagging as calculated by Equation (3). Lithium contained in the gas phase is considered as a loss. Also, lithium contained in the two metal phases is considered as lost. According to the simulation, two immiscible metal phases are formed. Those are named “Copper”-phase and “Cobalt”-phase, which is in both cases the element with the highest concentration in the metal, accompanied by other mostly metallic elements as well.
Lithium losses decrease while adding more quartz as a flux. Most lithium is lost due to volatilization into the gas phase, also the copper phase contains significant amounts of lithium, while losses into the cobalt phase are less significant. This can be explained by the higher amount of copper produced in the process compared to cobalt. Even though the lithium content in the cobalt phase is higher than in the copper phase. For example, an addition of 20 g quartz leads to a lithium content of 0.24 wt.% in the cobalt phase and 0.19 wt.% in the copper phase. The simulation predicts a completely molten slag for additions between 6 g and 25 g. Additions below 6 g led to solid LiAlO2 and additions above 25 g led to solid lithium aluminosilicate. Most lithium in the slag is present as liquid lithium silicate or liquid lithium aluminate. The content of lithium oxide and carbonate is rather small and decreases with increasing quartz additions even further. Even though a dataset for solid LiAlSi2O6 is available in the database, it does not appear in the simulation as a stable phase, instead, an equilibrium involving LiAlSiO4 and LiAlSi4O10 can be observed for additions of 46 g up to 65 g of quartz.
As indicated by Figure 3, Figure 4 and Figure 7, slagging of lithium can be increased by adding quartz, however, the lithium content in the occurring lithium phases decreases with increasing quartz additions. To ease the lithium recovery from the slag, a high lithium content in the lithium minerals is beneficial. Figure 8 shows the lithium slagging calculated by Equation (3) and the lithium content in the slag for various temperatures and quartz additions. Furthermore, the SiO2-content in the slag is displayed. Solid lithium minerals are assumed to be part of the slag, they are therefore added to the amount of slag generated and also the lithium and silicon in solid lithium minerals are included in the calculation. The step size of the simulation is 1.5 g of quartz addition.
Especially at temperatures above 1700 °C, the SiO2-content only increases slowly while adding quartz. Due to the reductive conditions in the process, silicon is reduced into the metal phase and is not incorporated into the slag at higher temperatures until the leftover graphite is completely consumed. At 1800 °C quartz additions over 4.5 g are necessary to obtain a liquid slag, therefore, the data points below 4.5 g are excluded from the diagram. As already seen before, the lithium slagging is increased while adding quartz. The lithium content in the slag also starts to increase while adding quartz but decreases with further additions of quartz in every case. This dilution occurs already after additions of 3 g quartz at 1500 °C, higher temperatures shift the position of the highest lithium content in the slag to higher quartz additions. For a temperature of 1600 °C, which was already investigated in detail in Figure 7, a quartz addition of 10 g or more should be investigated further, as the lithium slagging is relatively high with 77%. The lithium content in the slag is 11.9 wt.% in this case. Further additions would still increase the lithium slagging but also decrease the lithium content. For example, an addition of 20 g quartz increases the lithium slagging to 84.5% while decreasing the lithium content slightly to 11.1 wt.%. Above an addition of 20 g, the lithium content decreases more rapidly. Also, it seems that the lowest shown temperature would lead to the lowest lithium content in the slag for quartz additions above 16.5 g, this can be explained by the already mentioned reduction of SiO2 at higher temperatures according to the simulation and therefore, the slag at 1500 °C would be more diluted by SiO2. If the SiO2-reduction is as strong as predicted by the model is uncertain, FactSageTM [30] calculates the equilibrium at a constant temperature for all phases, but in direct current electric arc furnaces, the slag temperature is higher than the metal temperature, due to the higher electrical resistance of the slag compared to the metal [33]. The result can be a significantly lower silicon content in the metal compared to the predicted model, which was already observed in previous trials carried out in the laboratory scale electric arc furnace used in this study [34].
Influences of the investigated parameters on the metal recovery were not shown here, as the yield for nickel, cobalt and copper are sufficient in every simulated parameter combination. The lowest yields for nickel, cobalt and copper are 99.95%, 99.91%, and 98.75% respectively. Whereas the mean value of the yields based on 1029 simulated parameter combinations is 99.99%, 99.96%, 99.60%.

3.2. Results of Smelting Trials in an Electric Arc Furnace

The analysis of the smelting trials includes a mass balance of the solid obtained products (metal and slag), the chemical analysis of both immiscible metal phases for one sample, the detailed chemical composition of all slag samples and a detailed mineralogical investigation of the slag, carried out by X-ray diffraction (XRD) and Raman analysis.

3.2.1. Mass Balance

Every trial was carried out with an input mass of 3500.0 g pelletized black mass pellets. The additions of quartz and CuO are presented in Table 3. Those components are the only additional inputs into the process. The weight of metal and slag after a manual separation is also listed in Table 3. It was not possible to obtain the mass of flue dust or gas during the trials. Instead, the total weight loss is included in the table and an adjusted weight loss, under the assumption, that oxygen bound to cobalt, copper and nickel and carbon from the black mass is subtracted from the weight loss, as those components leave the system as off-gas. Furthermore, the trial number is included in the table, which is consistently used in all tables and figures in this paper and the solidification method, as the melt is either poured into a cast iron mould or solidified in the graphite crucible after the trial.
Even the adjusted weight loss is considerably high, which could be due to losses of material as dust, volatilization of further components from the input materials or reduction of oxidic material in the charge not included in the corrected weight loss. Furthermore, slag samples taken during the holding time are not included in the mass balance and in the analysis of the trials. Two samples were taken per trial during the holding time with a mass of roughly 10 g per sample. This results in an error of the slag mass between 1.5% and 3.0%, the influence on the weight loss is considerably lower, compared to the total input mass between 6475 g and 7525 g. Besides the weight loss due to the slag samples, the higher share of the adjusted weight loss is due to dust consumed by the off-gas system, before the material could react with the molten metal or slag phase. Those losses are not quantifiable and cannot be avoided, because the furnace has to be used with off-gas suction at all times. Even in a technical-scale electric arc furnace, for a trial with 350 kg roasted black mass, it was not possible to obtain the whole flue dust, as part of the dust is always attached to off-gas pipes or gas cleaning equipment [29].

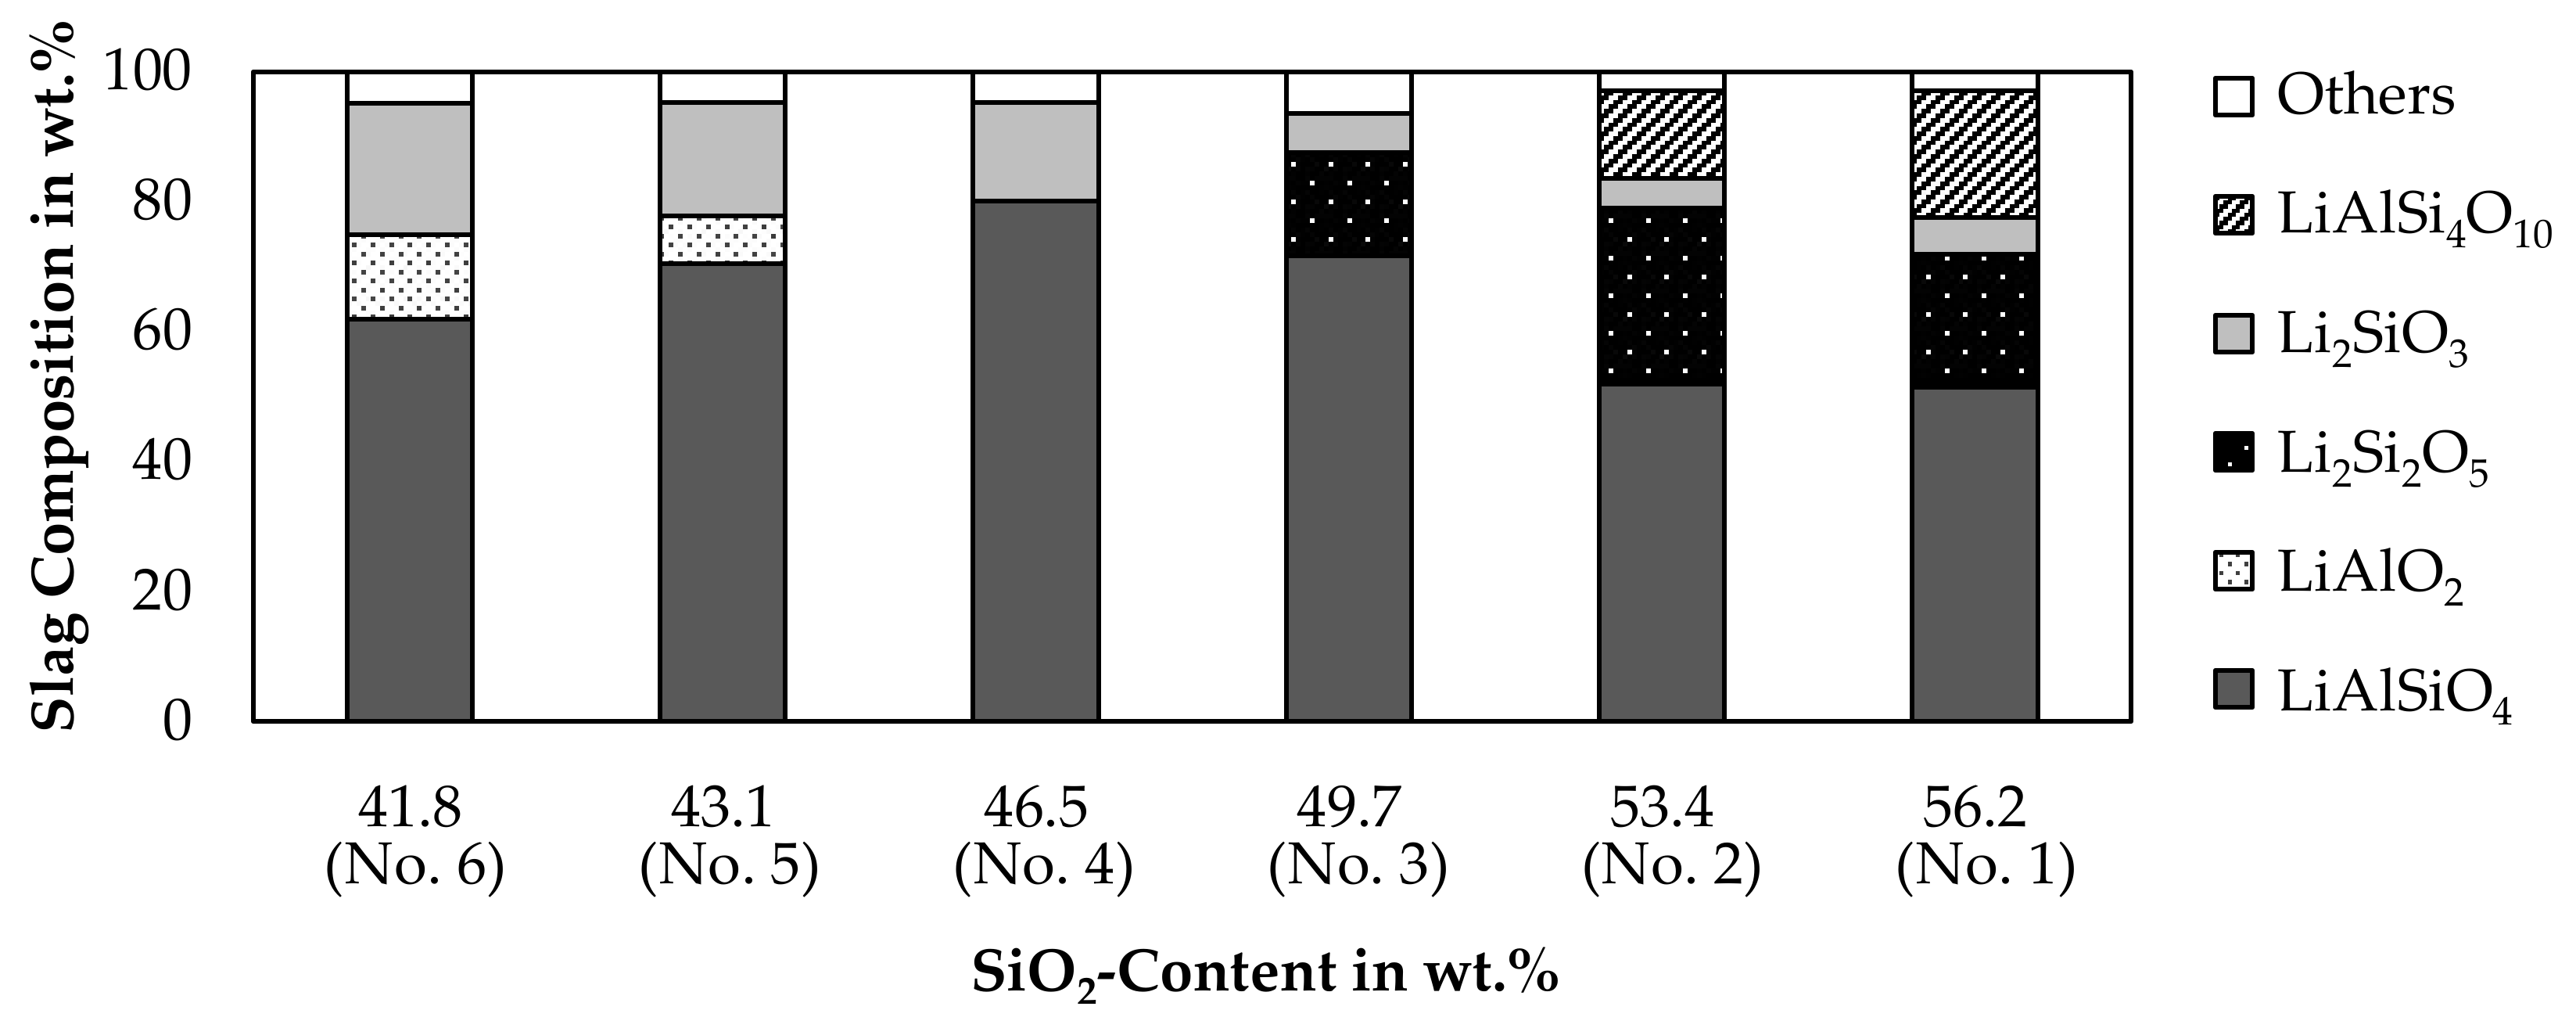
3.2.2. Slag Composition

The slag is the product of main interest in this investigation and was therefore investigated thoroughly. Table 4 lists the chemical composition of the bulk slag phase after the trials, samples taken during the holding time and minor elements analyzed in the bulk slag are only listed in the Supplementary Material. A “Spectro ARCOS” ICP-OES made by “SPECTRO Analytical Instruments GmbH, Kleve, Germany” was used to analyze the cobalt, nickel, lithium and copper content of slag samples. All ICP-OES measurements were carried out twice. The chemical composition of slag samples was analyzed using a wavelength dispersive X-ray fluorescence spectrometer (XRF) “AxiosmAX” made by “Malvern Panalytical B.V., Almelo, Netherlands”. The samples were ground, sieved to a grain size below 63 µm and analyzed as fused-cast beads with the wide range oxide (WROXI) calibration from “Malvern Panalytical”. The measured results were all in the calibrated composition area. All measurements were carried out twice. Carbon and sulfur analysis were carried out with an “ELTRA CS 2000” system made by “ELTRA GmbH, Haan, Germany” based on a combustion method. Carbon and sulfur measurements were carried out three times per sample.
The trial numbers are sorted, starting with the highest silicon content in the slag and decreasing in silicon content. Furthermore, the standard deviation of the sample set was determined and shown in Supplementary Table S3.
Obvious is the deviation in the copper- and cobalt content for the slag from trial number 2. The other samples show a significantly lower content of those metals. Probably, the CuO-addition was slightly too high in trial 2, even though the CuO-additions in other trials were higher, however, the effect of the CuO-addition can vary within trials, as described in the Materials and Methods. The copper, cobalt, nickel, iron, and manganese contents are not further discussed here, as they are discussed in detail later in this chapter. The lithium content in the slag is quite high with values over 5% and surpasses the lithium content of pure petalite, spodumene and in most cases also eucryptite. The lithium contents in selected minerals were already presented in Table 2. The low atomic mass of lithium makes it difficult to obtain minerals with a high content of lithium, as the lithium concentration is heavily diluted by other elements, which are heavier compared to lithium, like aluminum, oxygen and silicon, even in a stoichiometric mineral. The main component of the slag is in all cases SiO2, followed by Al2O3. Except for trial 2, a decreasing SiO2-content leads to an increased Al2O3-content in the slag. The aluminum-input comes from the black mass and is transferred into the slag. This can be considered to be a constant input, while the SiO2-addition was varied and the amount of silicon transferred into the slag is also influenced by the reductive conditions during the trials. A higher amount of silicon being transferred into the slag will, therefore, dilute the constant aluminum mass in the slag and explains the correlation between the SiO2- and Al2O3-content.
The lithium slagging was already simulated in detail and is evaluated based on experimental trials in Figure 9. Instead of presenting each trial individually, trials 1 and 2, 3 and 4, and 5 and 6 are combined. The quartz addition was the same for each pair of trials, even though the CuO-addition slightly varied for those trials. Therefore, the mean CuO-addition of two trials is listed in the figure and the CuO-addition per trial is presented in Table 3. Furthermore, the slagging of Mn, Fe, Co, Ni, and Cu are presented in the figure.
The bars in the figure represent the mean value of two trials and the error bars represent the slagging in the individual trials. The SiO2-content was the same for each pair of trials, whereas the mean value of CuO-addition is listed in Figure 9. The individual CuO-additions are listed in Table 3. High deviations are noticeable for the cobalt-, nickel-, and copper losses for trial 1&2 as already noticed in Table 4. The amount of cobalt, nickel and copper in the slag in relation to the input amount is 2.3%, 0.6%, and 0.7% for trial number 2. For the other trials, those values are below 0.5%, 0.5% and 0.2% for cobalt, nickel and copper respectively, while also values under 0.1% were possible. The amount of lithium transferred into the slag varied between 64.1% and 82.4% and is correlated with SiO2-content of the slag as higher SiO2-contents yielded a higher amount of lithium being transferred into the slag. The only other metal investigated, which was transferred into the slag with a considerable amount is manganese with 13–76%.
As the recovery of the cobalt, copper and nickel into the metal is the clear aim of pyrometallurgical processes, low contents of those metals in the slag are beneficial. For iron and manganese, the desired distribution depends on the further processing of the products. If iron and manganese are considered an impurity in the metal, high contents of those elements in the slag would be beneficial. If the slag is treated by hydrometallurgy, those elements could be also considered an impurity in the slag. Figure 10 shows, how selectively the valuable metals could be separated from iron and manganese by a smelting reduction process. For this evaluation, the contents of cobalt and nickel are related to the manganese- and iron content of the slag. The analysis of bulk slag samples presented in Table 4 are used in addition to slag samples taken during the holding time, which are only listed in the Supplementary Material.
Due to high deviations, the limited dataset consisting only of 17 samples and the varied SiO2-addition and CuO-addition, no interpolated graphs are presented here in the figures, linear equations and exponential equations are however listed in the Supplementary Material including the coefficient of determination, which is relatively low in all cases. Even if those simple models fail to describe the relation of valuable metals to iron or manganese, it is obvious, that the content of iron or manganese has to be considerably low to achieve high yields according to the general trend observable. The nickel content is the lowest of the metals investigated and is always under 0.2 wt.% and even significantly lower than 0.1 wt.% for samples with a low iron- and manganese content. The highest cobalt content observed is 1.8 wt.%, but with decreasing iron and manganese contents, the cobalt content decreases further and is even lower than 0.1 wt.% for samples with a low iron- and manganese content. Furthermore, also the iron- and manganese content are related. Already in this small investigated process area, a clear separation of the valuable metals nickel and cobalt from iron and manganese is difficult. If manganese and iron should not be reduced, considerably high losses of cobalt and nickel are expected. Instead, it seems plausible to reduce iron and manganese completely, to ensure high cobalt, copper and nickel yields and to generate a slag with fewer impurities, which have to be taken care of in a hydrometallurgical purification step.

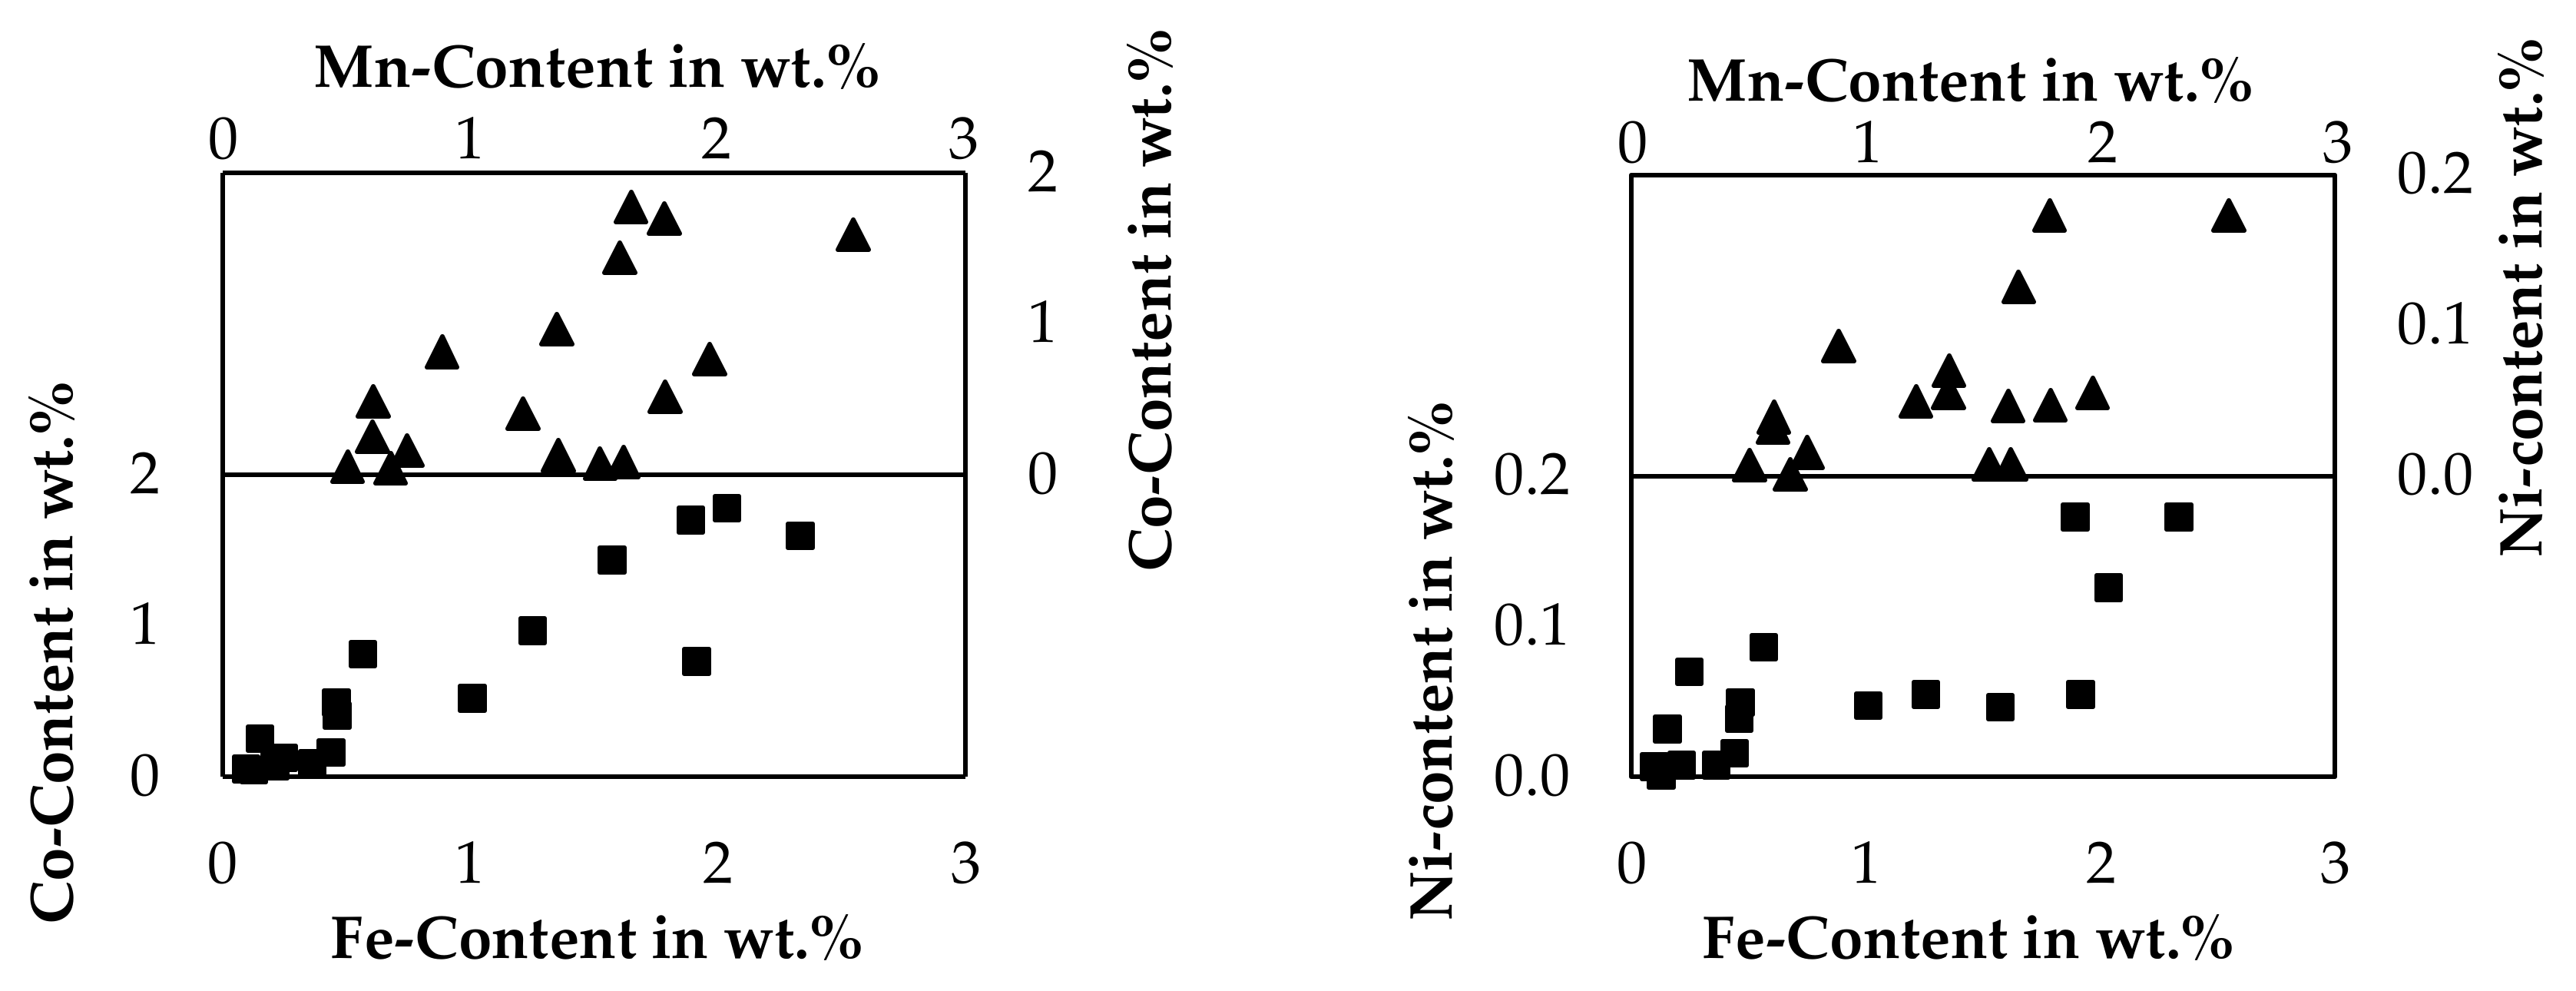
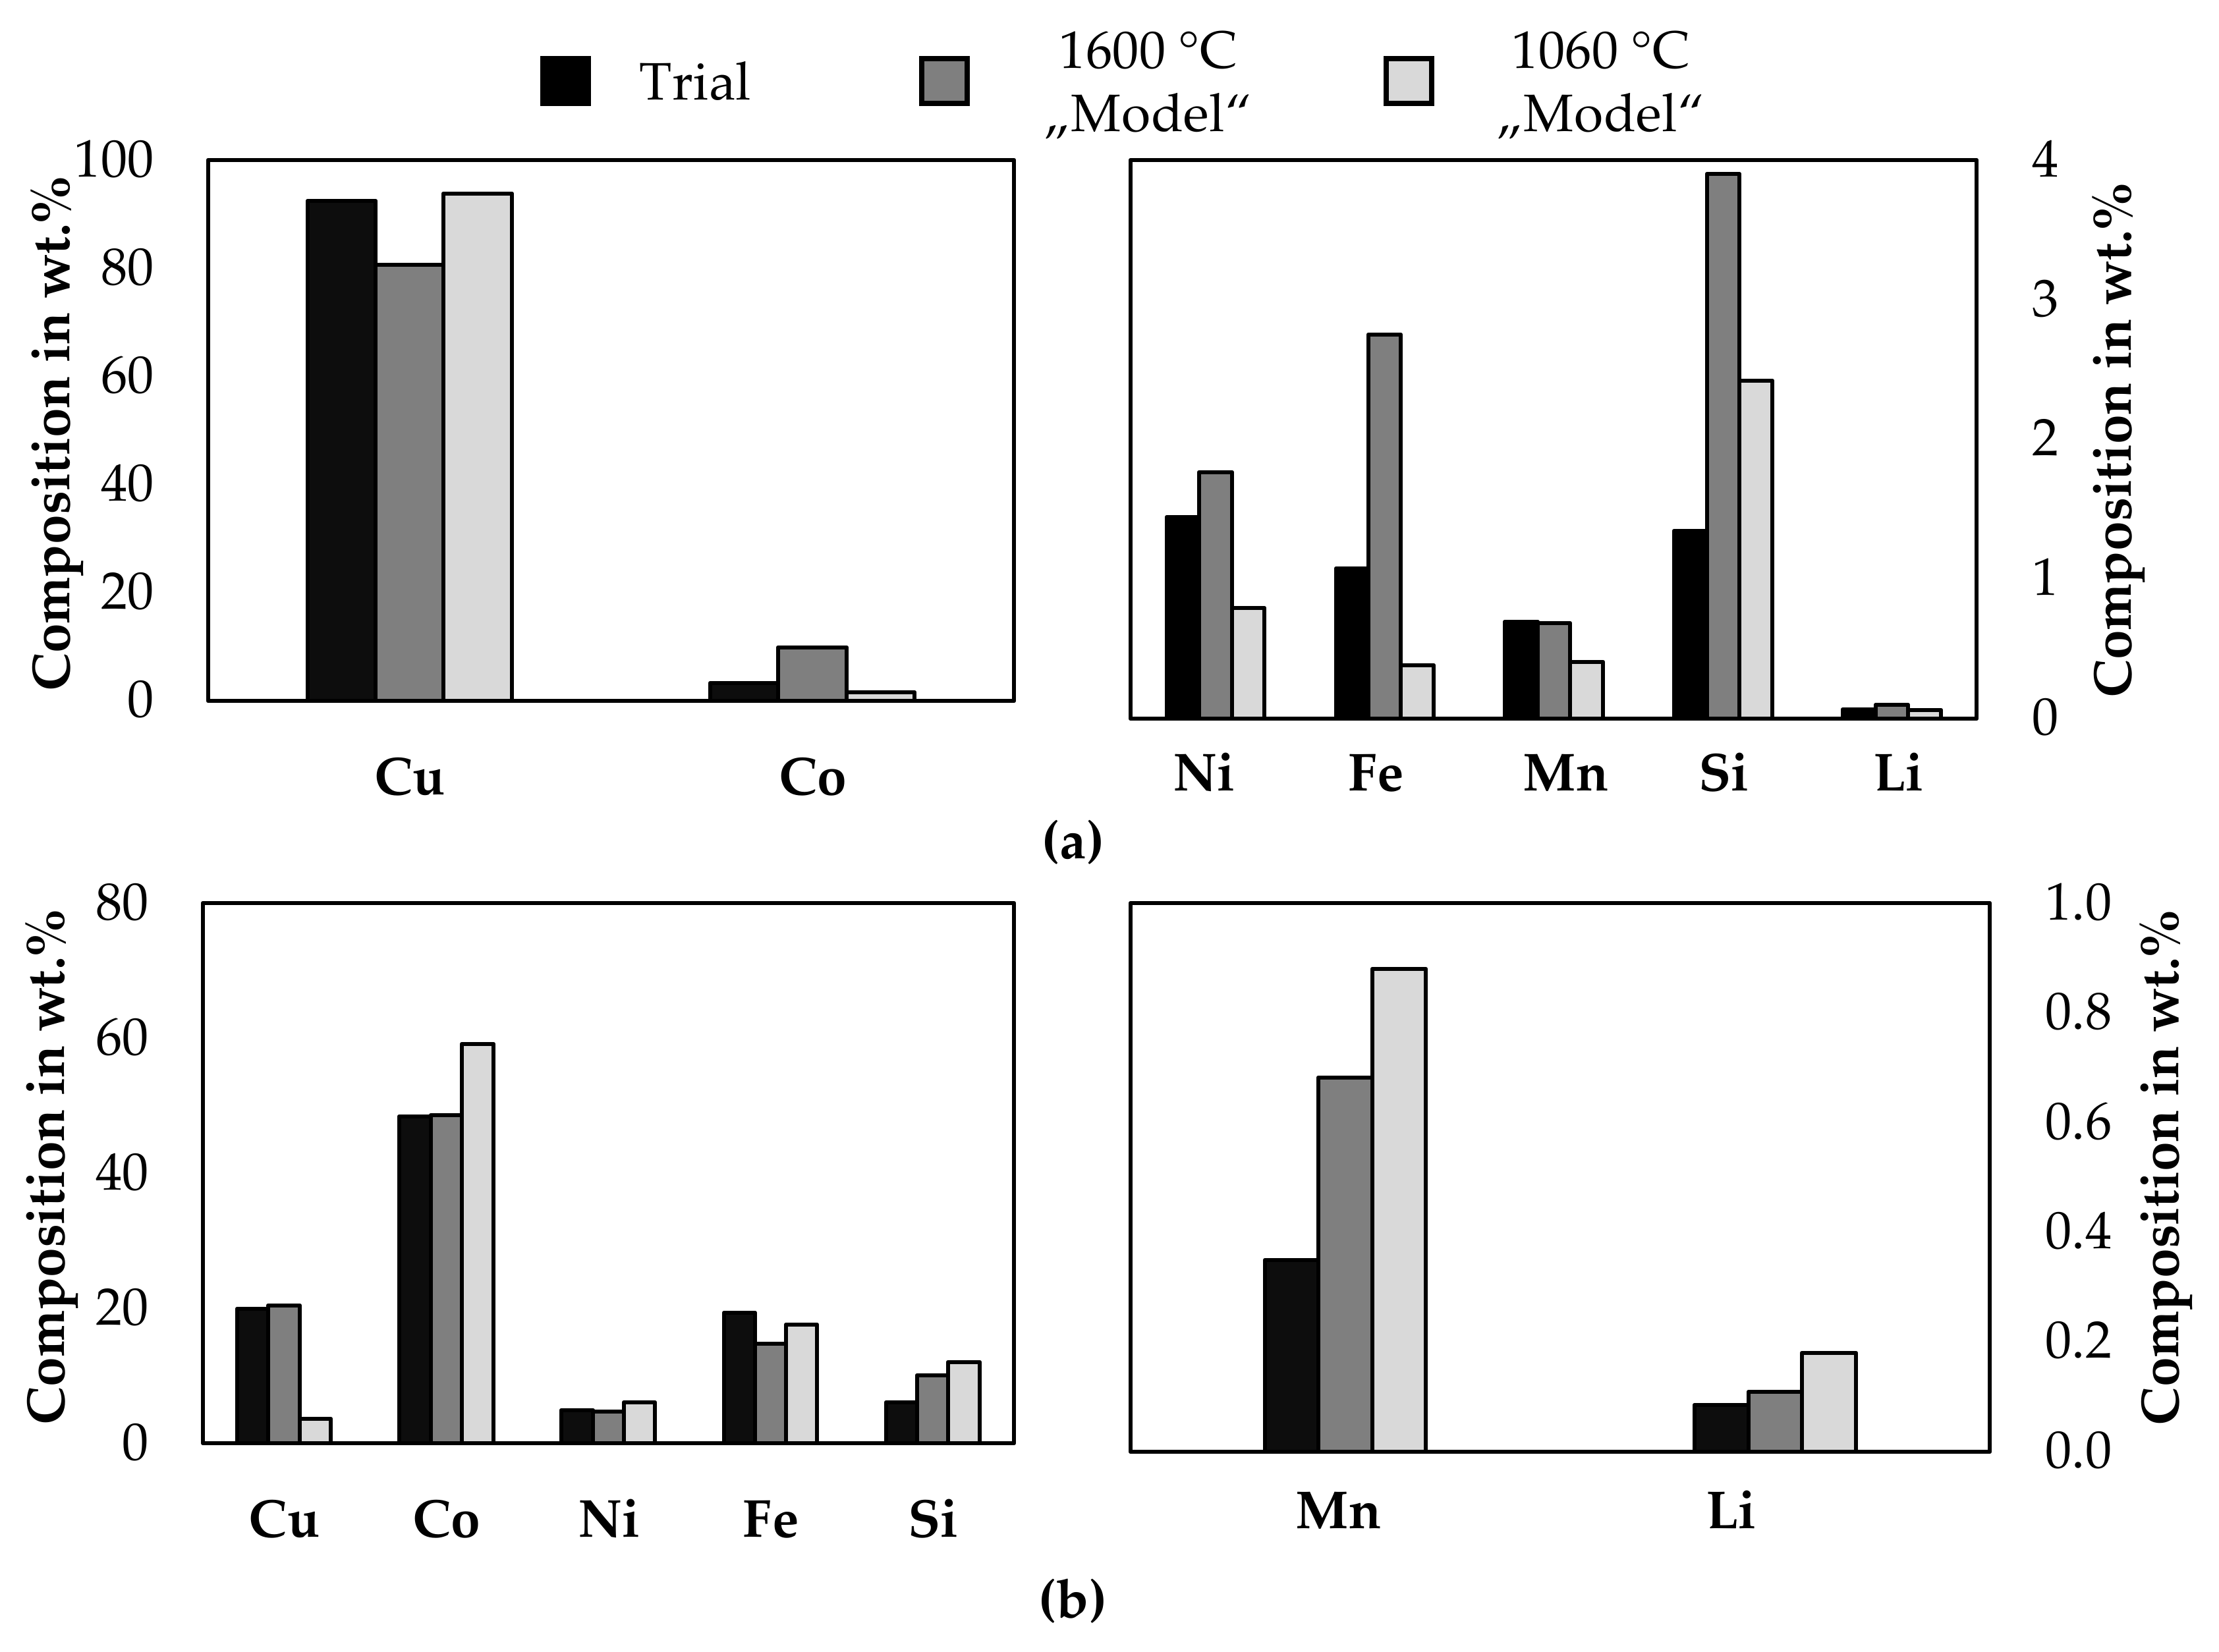
3.2.3. Metal Composition

The metal samples from trial 3 and trial 4 were melted in a resistance heated furnace, slowly solidified, and separated by sawing to obtain homogenous samples and the weight of the individual cobalt- and copper phase. This was necessary, because the crucible diameter in the electric arc furnace and in the cast-iron-mould were too high, to allow a clear phase separation. This was mainly done for analytical reasons. A detailed description of the second melting operation is supplied in the Supplementary Material, together with macrographs and micrographs of the metal samples. A “Spectro ARCOS” ICP-OES made by “SPECTRO Analytical Instruments GmbH, Kleve, Germany” was used to analyze the metal samples. All ICP-OES measurements were carried out twice. Additional analytical results by arc spark optical emission spectrometry and XRF are also supplied in the Supplementary Material. After the second melting step, 62.9 wt.% of the metal can be described as a copper-rich phase and 37.1 wt.% a cobalt-rich metal phase. Figure 11 shows the chemical composition of both metal phases from the combined melting of the samples from trial number 3 and 4. As a comparison, the results from smelting the input mass of both trials according to Table 3 at 1600 °C is modeled with FactSageTM [30] and the chemical composition of both immiscible liquid phases is presented. A second model is derived by excluding the slag and gas phases from the previous model and cooling the liquid metal to 1060 °C, which is the temperature at which both metal immiscible metal phases are still liquid according to FactSageTM [30].
The results from the trials do not show a general alignment with the simulation, which makes a prediction solely based on a simulation difficult to evaluate the metal quality and underlines the necessity of experimental trials. Some elements differ significantly from both models, some elements show better alignment with the model at 1600 °C and for others, the model 1060 °C shows better results. In all cases, the silicon-, and lithium content is higher according to the model. The copper- and cobalt content in the copper phase is better described by the model at 1060 °C, whereas the manganese- and nickel content is better described by the model at 1600 °C, iron is significantly differing from both models. The copper-, cobalt- and nickel content in the cobalt-rich alloy is better described by the model at 1600 °C, whereas the iron content is better described with the model at 1060 °C. The measured manganese content is significantly lower compared to both models.
The separation step was mostly carried out for analytical reasons. It could also be used as a preconcentration step. In an industrial scale, metal and slag could be tapped separately and if the metal is solidified slowly enough in an iron mould, separate metal phases could be obtained. However, it is also feasible to treat water-granulated alloys containing cobalt, copper, nickel, iron and manganese [35,36]. Therefore, directly granulating the alloy obtained from a furnace could be an option as well. Based on the analysis presented in Figure 11 and the weighed amount of each metal phase. A theoretical composition of water granulated metal can be calculated. Table 5 shows the calculated composition of a single-phase metal based on the analyzed metal phases, based on the individual analysis of the samples, the calculated maximum and minimum content is listed in the table.

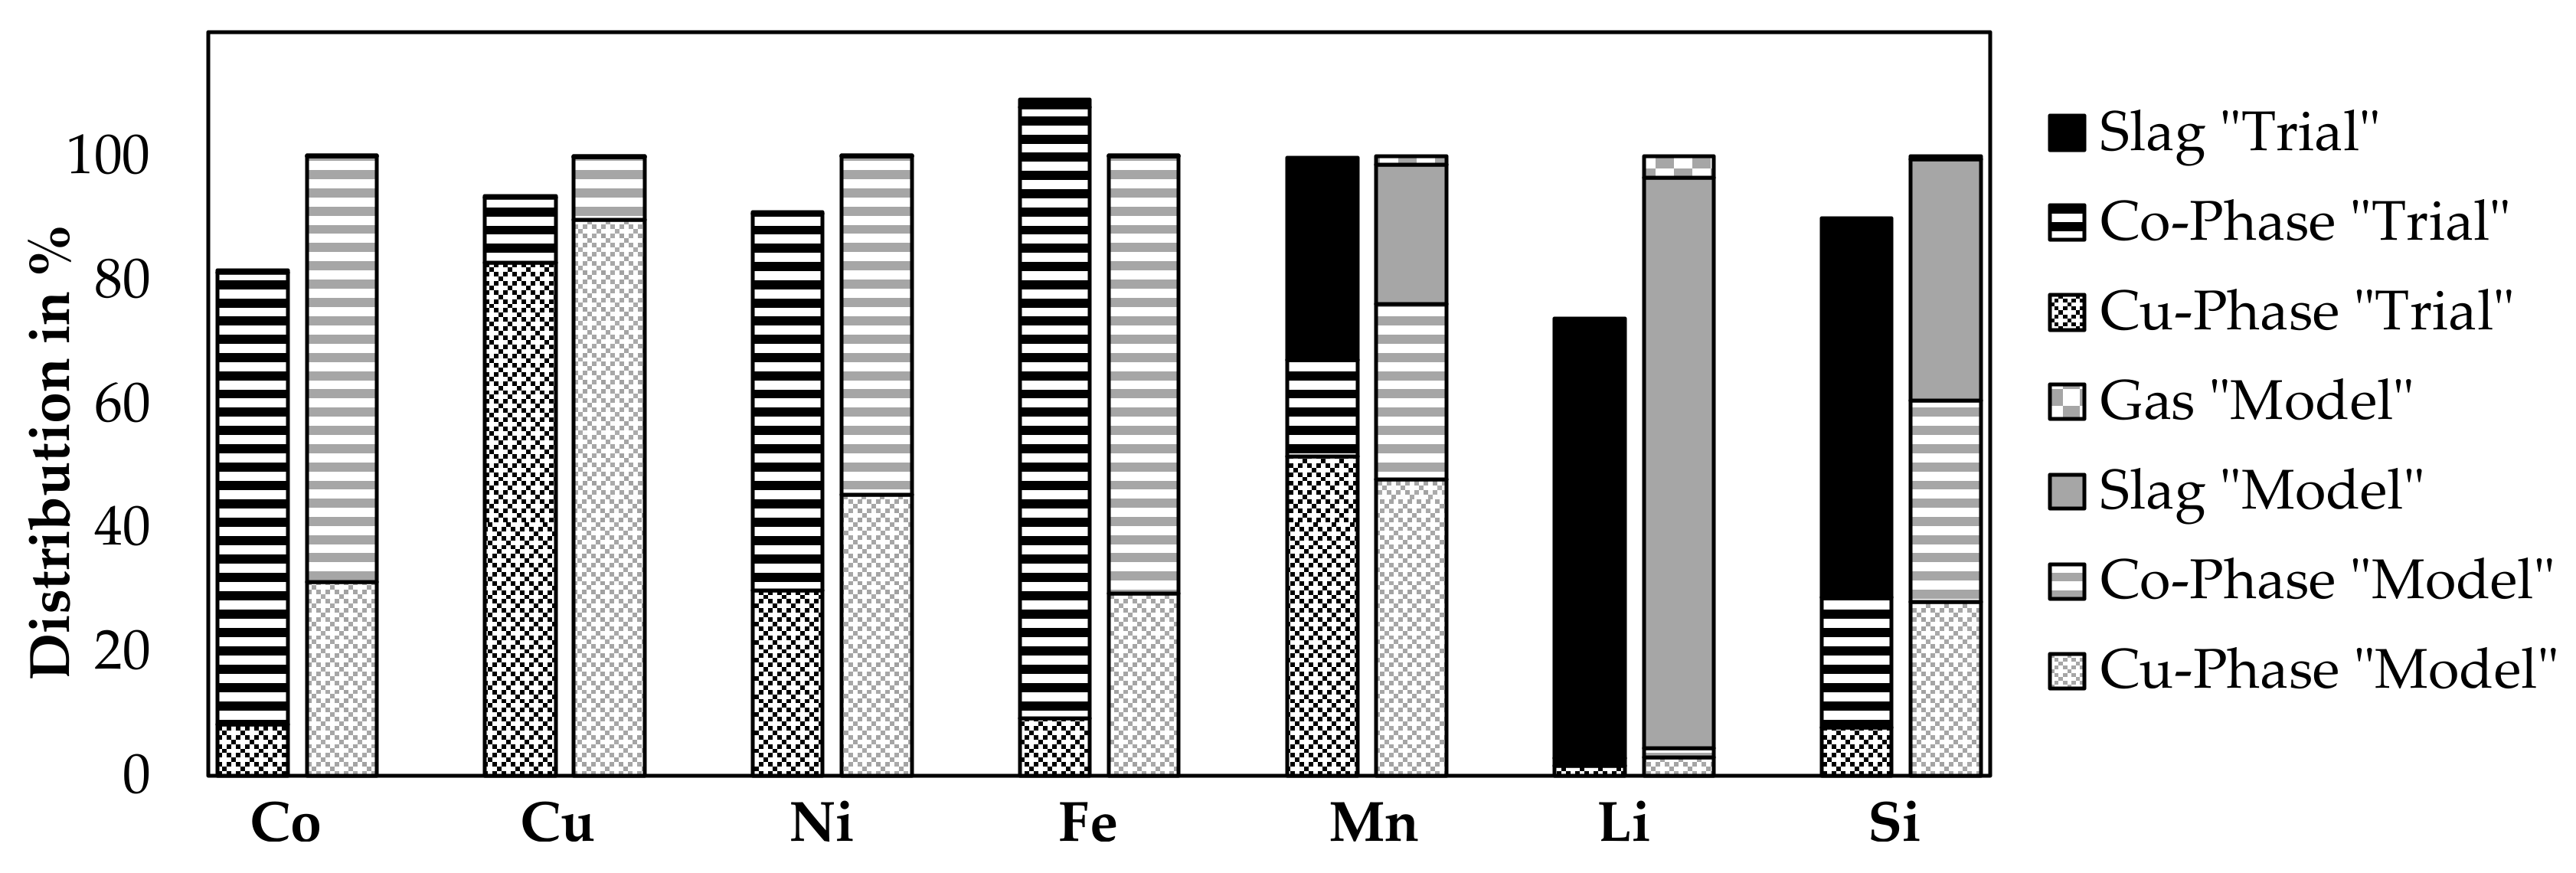
3.2.4. Distribution of Relevant Elements in the Process

Based on the results from the previous subchapters, a comparison of the distribution of elements to each phase with the FactSageTM [30] model at 1600 °C presented already in Figure 11 is shown in Figure 12. It was not possible to obtain the flue dust in the trials. Therefore, the results from the trial do not show the fraction going to the gas phase, theoretically, this should be the balance to 100% compared to the amount analyzed in the slag, copper, and cobalt phase.
As the simulated metal composition for both metal phases differs from experimental trials as shown by Figure 11 and was already discusses, it is not further discussed here, instead, the slag phase is considered in detail.
The results for cobalt, copper, nickel, and iron are similar, as losses to the slag phase are not observed from the experiments and neither predicted by the model. Further, 81.6% of cobalt could be identified in the products, as 73.0% is present in the cobalt-rich phase and 8.2% in the copper-phase, while the remaining amount of cobalt in the slag is considerably low with 0.4%. The model predicts that cobalt is only distributed between the metal phases and no losses occur to the gas- or slag phase. 82.8% of the copper is present in the copper phase and 10.5% in the cobalt phase, while the loss in the slag is 0.2%. In total, 93.5% of copper is in solid products. The model does not show any copper losses to the slag and 0.2% of copper losses into the gas phase. 91.1% of nickel is present in the solid products, whereas 29.9% of Nickel is in the copper phase, 60.8% is in the cobalt phase and 0.4% in the slag. The model shows no nickel losses. The iron analysis shows an unphysical result with 109.2% of iron in the solid products this could be due to inhomogeneous analyzed samples or inaccuracies with the input analyses. 9.3% of iron is present in the copper phase, 98.6% in the cobalt phase and 1.3% in the slag phase. According to the model, 0.04% is lost into the slag and 0.01% is lost into the gas phase. Manganese is the first element, with a significant distribution between all three molten phases, 99.8% of manganese is obtained in the solid samples, 51.5% in the copper phase, 15.5% in the cobalt phase and 32.8% in the slag. The model shows, that 28.3% of manganese is transferred to the slag and 1.32% to the gas phase. 73.7% of lithium is transferred to the solid products. Most of the lithium is transferred to the slag, 70.8% is enriched in that phase. 1.6% and 1.2% is present in the copper phase and cobalt phase, respectively. The model predicts 2.96% of the lithium in the copper phase, 1.52% in the cobalt phase and 92.01% in the slag phase, while the rest is lost to the gas. 89.9% of silicon could be identified in the products. 61.1% is in the slag phase, 7.8% in the copper phase and 21.0% in the cobalt phase. This differs significantly from the model, which predicts only 38.97% of the silicon in the slag phase, 27.98% in the copper phase, 32.46% in the cobalt phase and 0.58% in the gas. This proves the previous assumption, that the model predicts a higher degree of silicon reduction for DC electric arc furnace processes.
Except for iron and manganese, a considerable amount of the other elements is lost in the trials and cannot be identified in the solid products. Volatilization of cobalt, nickel and copper seems to be rather unlikely, to explain those losses. An explanation for this could be that, during charging of the material, fine material was directly taken by the off-gas suction of the furnace without reacting. Either by charging the material more carefully, which is not possible in the laboratory scale as material falls directly into the turbulent zone of the furnace or by recirculating flue dust, higher yields for valuable metals, and higher lithium slagging could be possible at a larger scale.

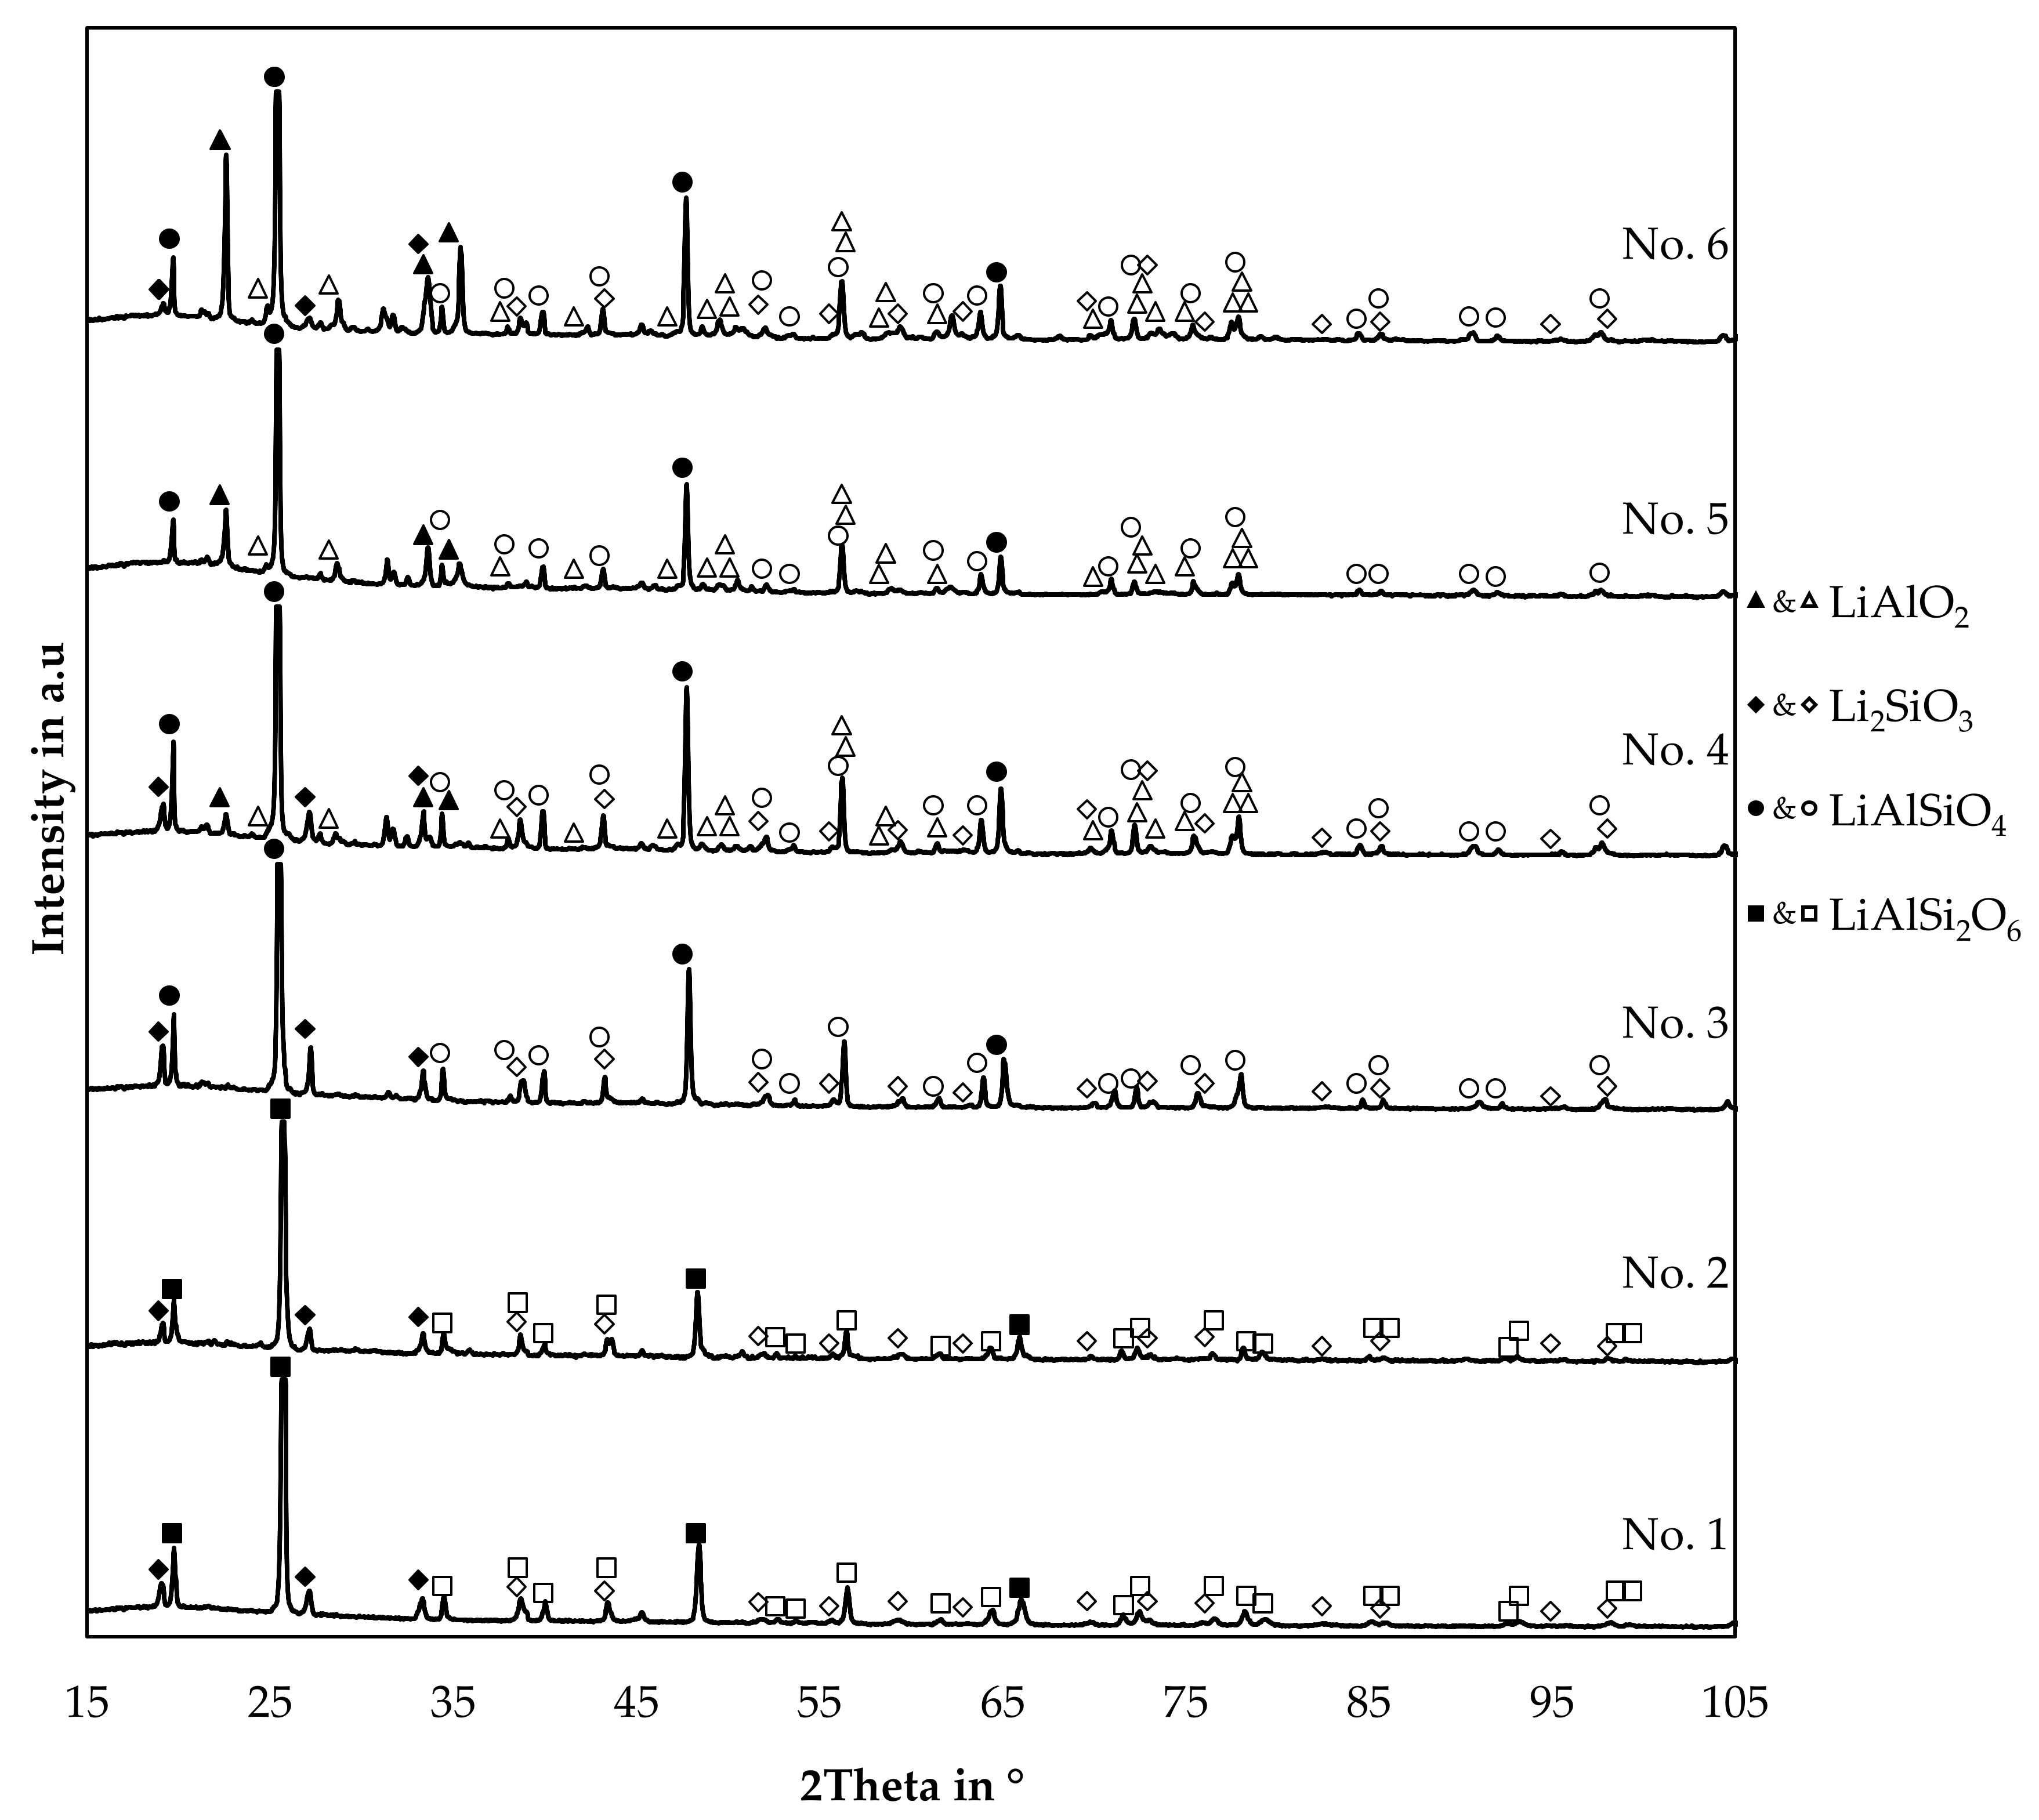
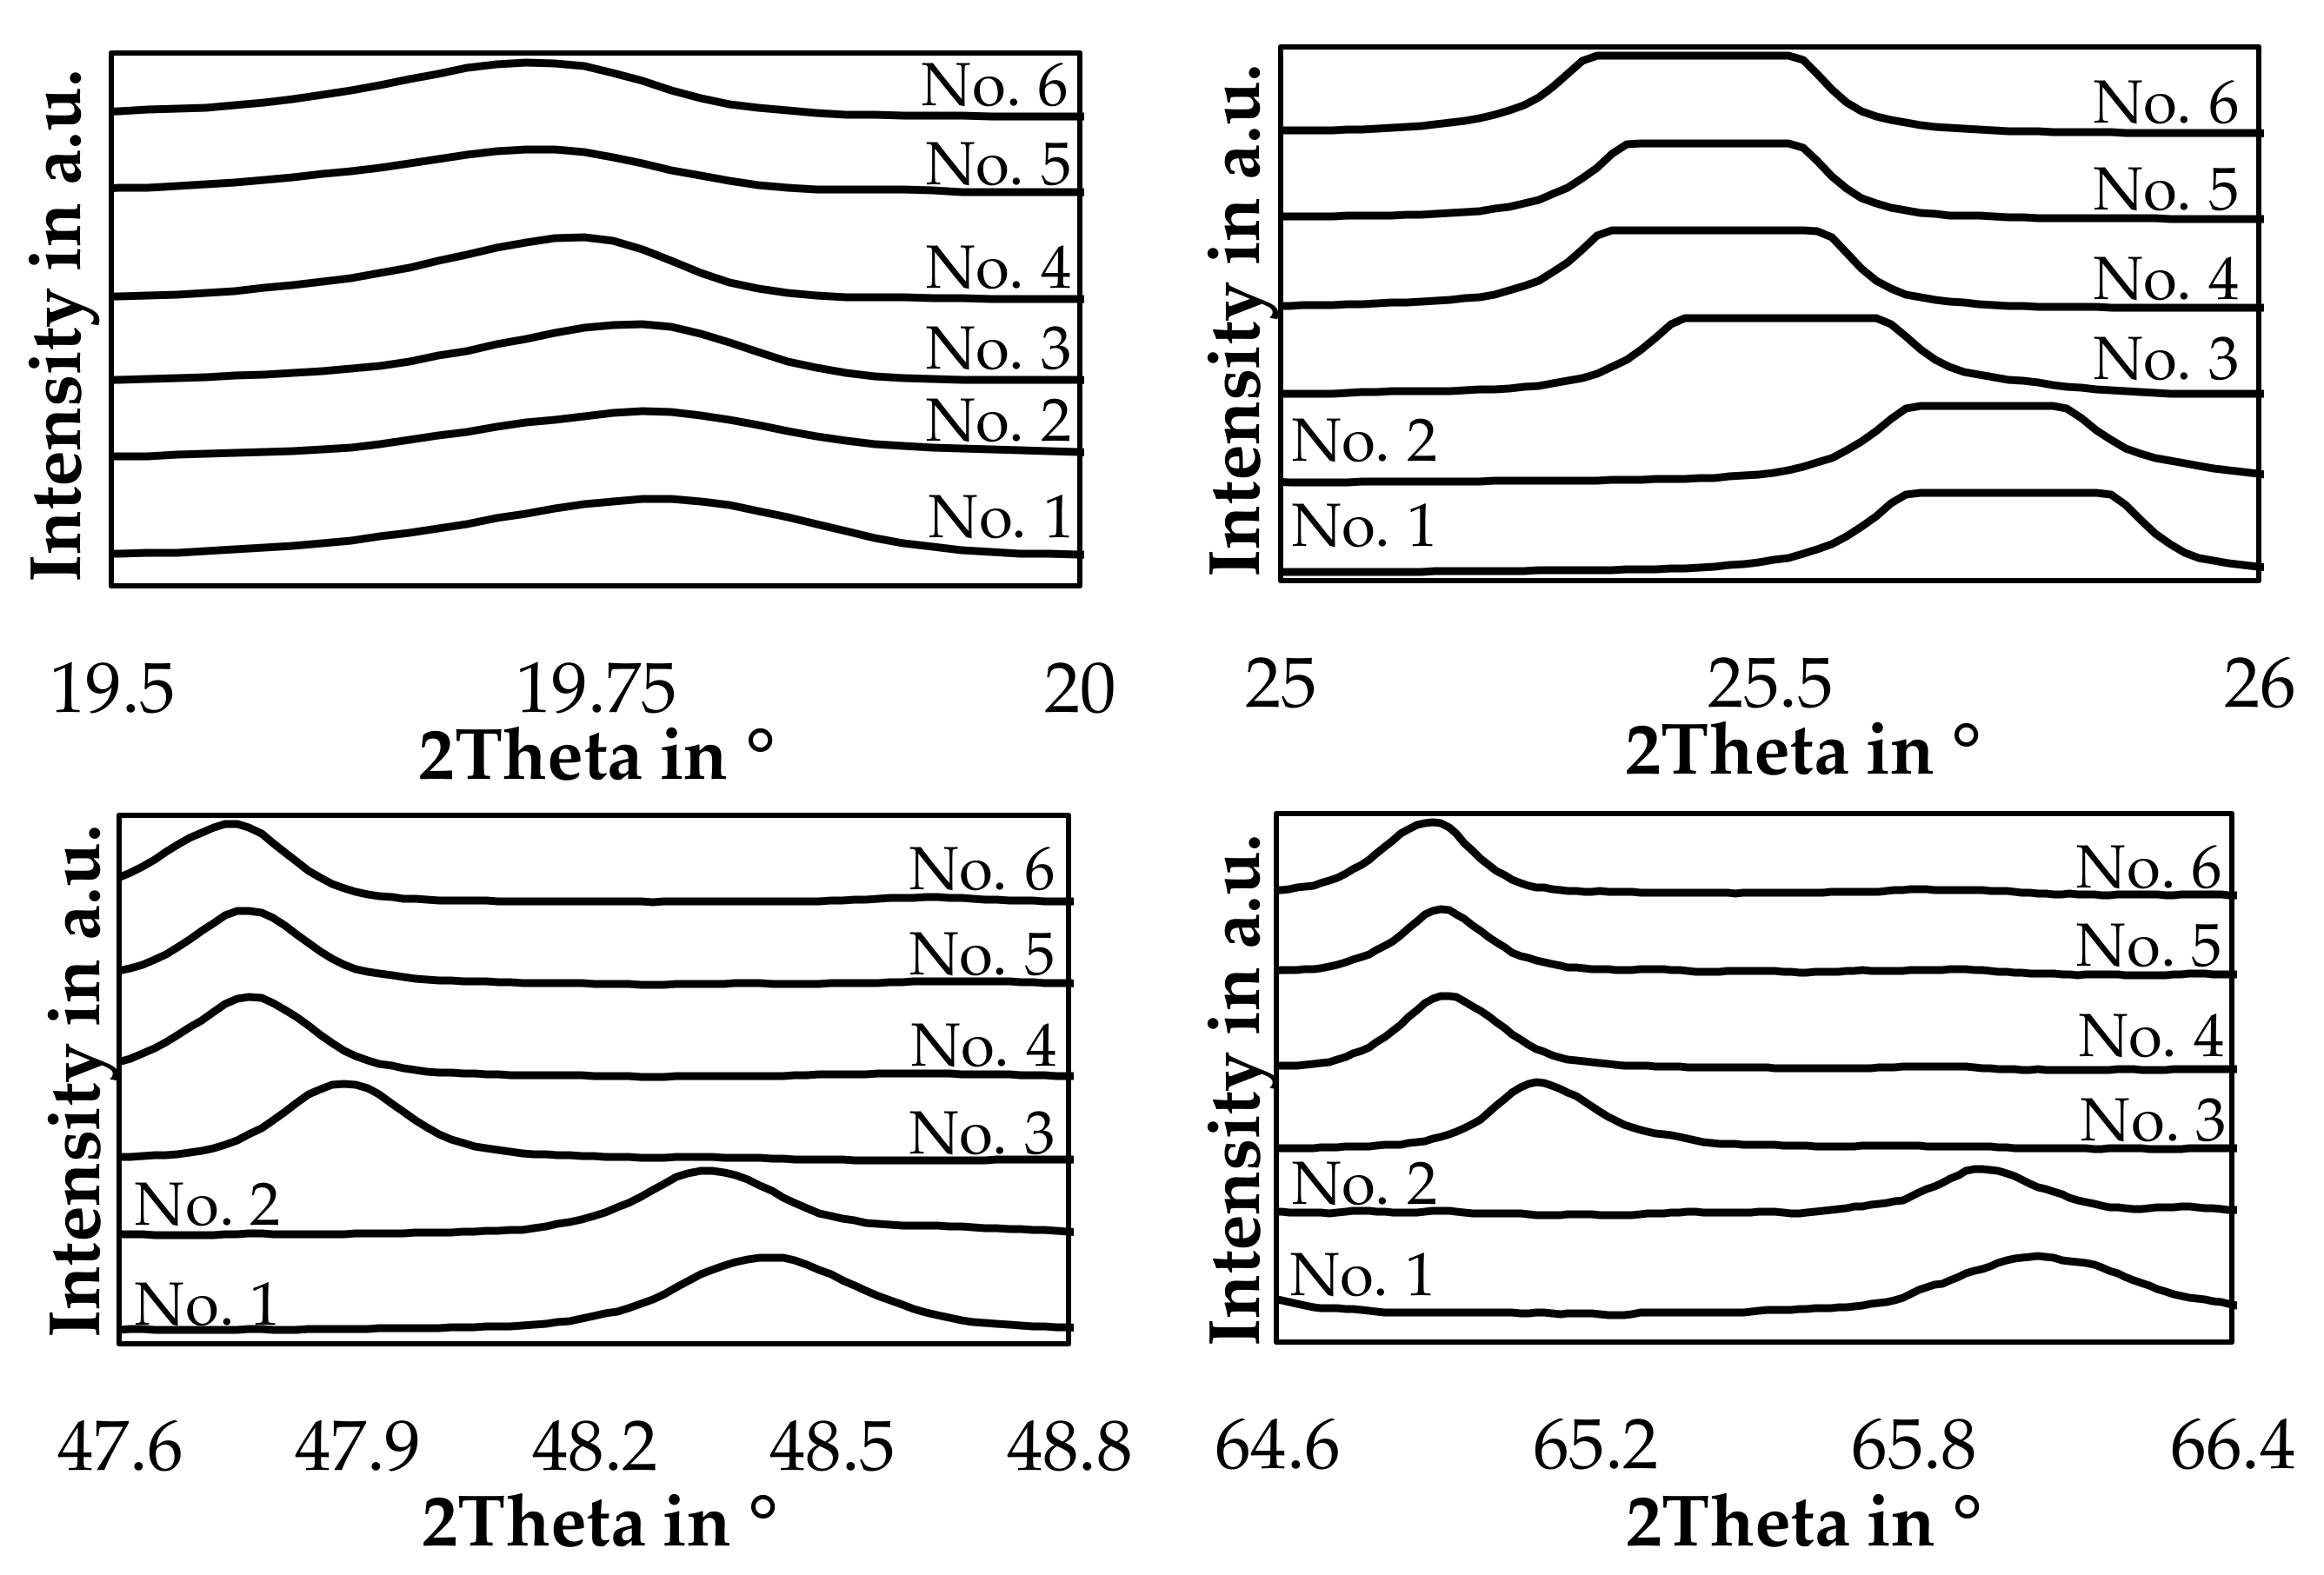
3.2.5. Qualitative X-ray Diffraction Phase Analysis of Slag

Qualitative X-ray diffraction (XRD) analysis was carried out and is presented in Figure 13. X-ray diffraction (XRD) of slag samples was carried out using a powder diffractometer “STADI P” made by “Stoe&Cie GmbH, Darmstadt, Germany”, equipped with a copper anode (40 kV, 30 mA). A Germanium monochromator was applied to use the Kα1-radiation (wavelength: 1.540598 Å) for analysis. The scan range per sample was from 1.324° to 116.089° and the measuring time was two hours. “Match! 3.9.0.158” was used for evaluation of the pattern. Reference patterns were obtained from the “Crystallography Open Database”. The version “COD-Inorg REV218120 2019.09.10” was used [37,38,39,40,41,42].
No background subtraction or smoothing of raw data was applied. For visual reasons, minor peaks of the identified minerals were indexed with vacant symbols, while the indices of the strongest peaks of each mineral are filled with color. The reference card information is supplied in the Supplementary Material. The trial numbers are the same used already in Table 3. Therefore, starting with the highest silicon content in the slag for trial 1 and decreasing in silicon content. Trial numbers 1, 4, and 5 are poured into a cast iron mould after the trial and trials 2, 3, and 6 are solidified in the crucible after the trial with a significantly lower cooling rate.
Even though the cooling condition was varied, no significant influence on the pattern is visible by comparing the trials 1 and 2, 3 and 4, and 5 and 6, which have a similar composition and variable cooling conditions.
Four minerals were identified in the samples, γ-lithium aluminate, lithium metasilicate and two lithium aluminum silicates. Furthermore, at least one mineral is present in the slags 4, 5 and 6, which could not be identified, since peaks at for example 21.4°, 31.2°, 31.7°, 45.3°, and 45.9° are not described by the previous minerals.
Lithium metasilicate is present in all samples, except for trial 5. Trial 6 contains even less silicon, but lithium metasilicate is present in that sample, even though the peak intensity is quite low compared to the slag 1, 2, 3, and 4.
γ-LiAlO2 is present in sample 4, 5, and 6. A trend can be observed, as the peak intensity of γ-LiAlO2 decreases with increasing content of silicon in the slag until it is not present in the slags 1, 2, and 3.
In all cases, the most intense peak belongs to the phases indexed as LiAlSiO4 or LiAlSi2O6. Three possible candidates were examined, beta-spodumene with a tetragonal crystal system and a P43212 space group with a simplified formula of LiAlSi2O6 [43]. Moreover, two different stoichiometries from the LiAlSiO4-SiO2 join, both with a hexagonal crystal system and a P6222 space group [44]. Distinguishing between the two hexagonal and the tetragonal mineral is difficult since all three minerals show the strongest peak slightly above 25°. In this case, the hexagonal minerals were selected as the matching phases, since the second strongest β-spodumene peak slightly above 22.5° is only observed in slag number 4, 5 and 6 and is already explained by the presence of γ-LiAlO2. Also, several minor peaks better fit the hexagonal LiAlSiO4-SiO2 system as well.
The hexagonal LiAlSiO4 mineral is called β-eucryptite and is a stuffed derivate of quartz and forms a solid-solution with SiO2 [44]. For trials 3, 4, 5, and 6 a reference card with the chemical formula LiAlSiO4 was used, and for trial numbers 1 and 2, a reference card with the chemical formula LiAlSi2O6 with the same space group was used. This was done because the lithium aluminum silicate peaks are slightly shifted to higher angles if the silicon content is increased in the slag samples. The same observation was already made by Xu et al. and Nakagawa et al. with synthetic samples in the LiAlSiO4-SiO2 solid solution system [44,45]. To examine this further, Figure 14 shows the position of the four strongest lithium aluminum silicate peaks in the slag samples.
The slags show a clear trend, that an increased SiO2-content in the bulk slag, shifts the investigated peaks continuously to higher angles, especially for trial 1 and 2 a significant shift can be observed.
Based on the chemical composition of the slag samples shown in Table 4, a solidification simulation of the slag was carried out with FactSageTM [30]. Figure 15 shows the amount of lithium containing minerals present in the slag after solidification. Minerals not containing lithium are expressed as “others”, as those are only a minor portion of the slag.
According to the simulation, the major mineral in the slag is LiAlSiO4, which is also observed in the XRD-pattern. Li2SiO3 is predicted for every sample and in addition, Li2Si2O5 is present for slag 1, 2 and 3. The presence of Li2Si2O5 could not be confirmed by the XRD-results, whereas Li2SiO3 is present in all analyzed slag samples, except for slag number 5. The simulation proposes, that LiAlO2 is formed in slag 5 and 6, which have the highest aluminum content. The presence of LiAlO2 is confirmed by XRD for those two samples, but it is also confirmed by XRD for slag 4. The XRD-results do not show LiAlSi4O10 in any sample, even though the simulation predicts the presence of LiAlSi4O10 for slag number 1 and 2. As already predicted by the simulation of the smelting process shown in Figure 7, no LiAlSi2O6 is formed and instead, an equilibrium between LiAlSiO4 and LiAlSi4O10 is predicted.
The disadvantage of the simulation is, that lithium minerals are all assumed as stoichiometric phases and no solid solutions are available in the databases, even though the LiAlSiO4-SiO2 solid solution [44] is relevant for this simulation. The absence of this solid solution could be an explanation for the predicted occurrence of Li2Si2O5 and LiAlSi4O10. Instead of those minerals with a higher silicon content compared to LiAlSiO4, a β-eucryptite phase with a higher silicon content than the stoichiometric LiAlSiO4 included in the model probably has formed as indicated by Figure 14. Since the model has to consider the leftover silicon somehow, it predicts the formation of the non-observable Li2Si2O5 and LiAlSi4O10.

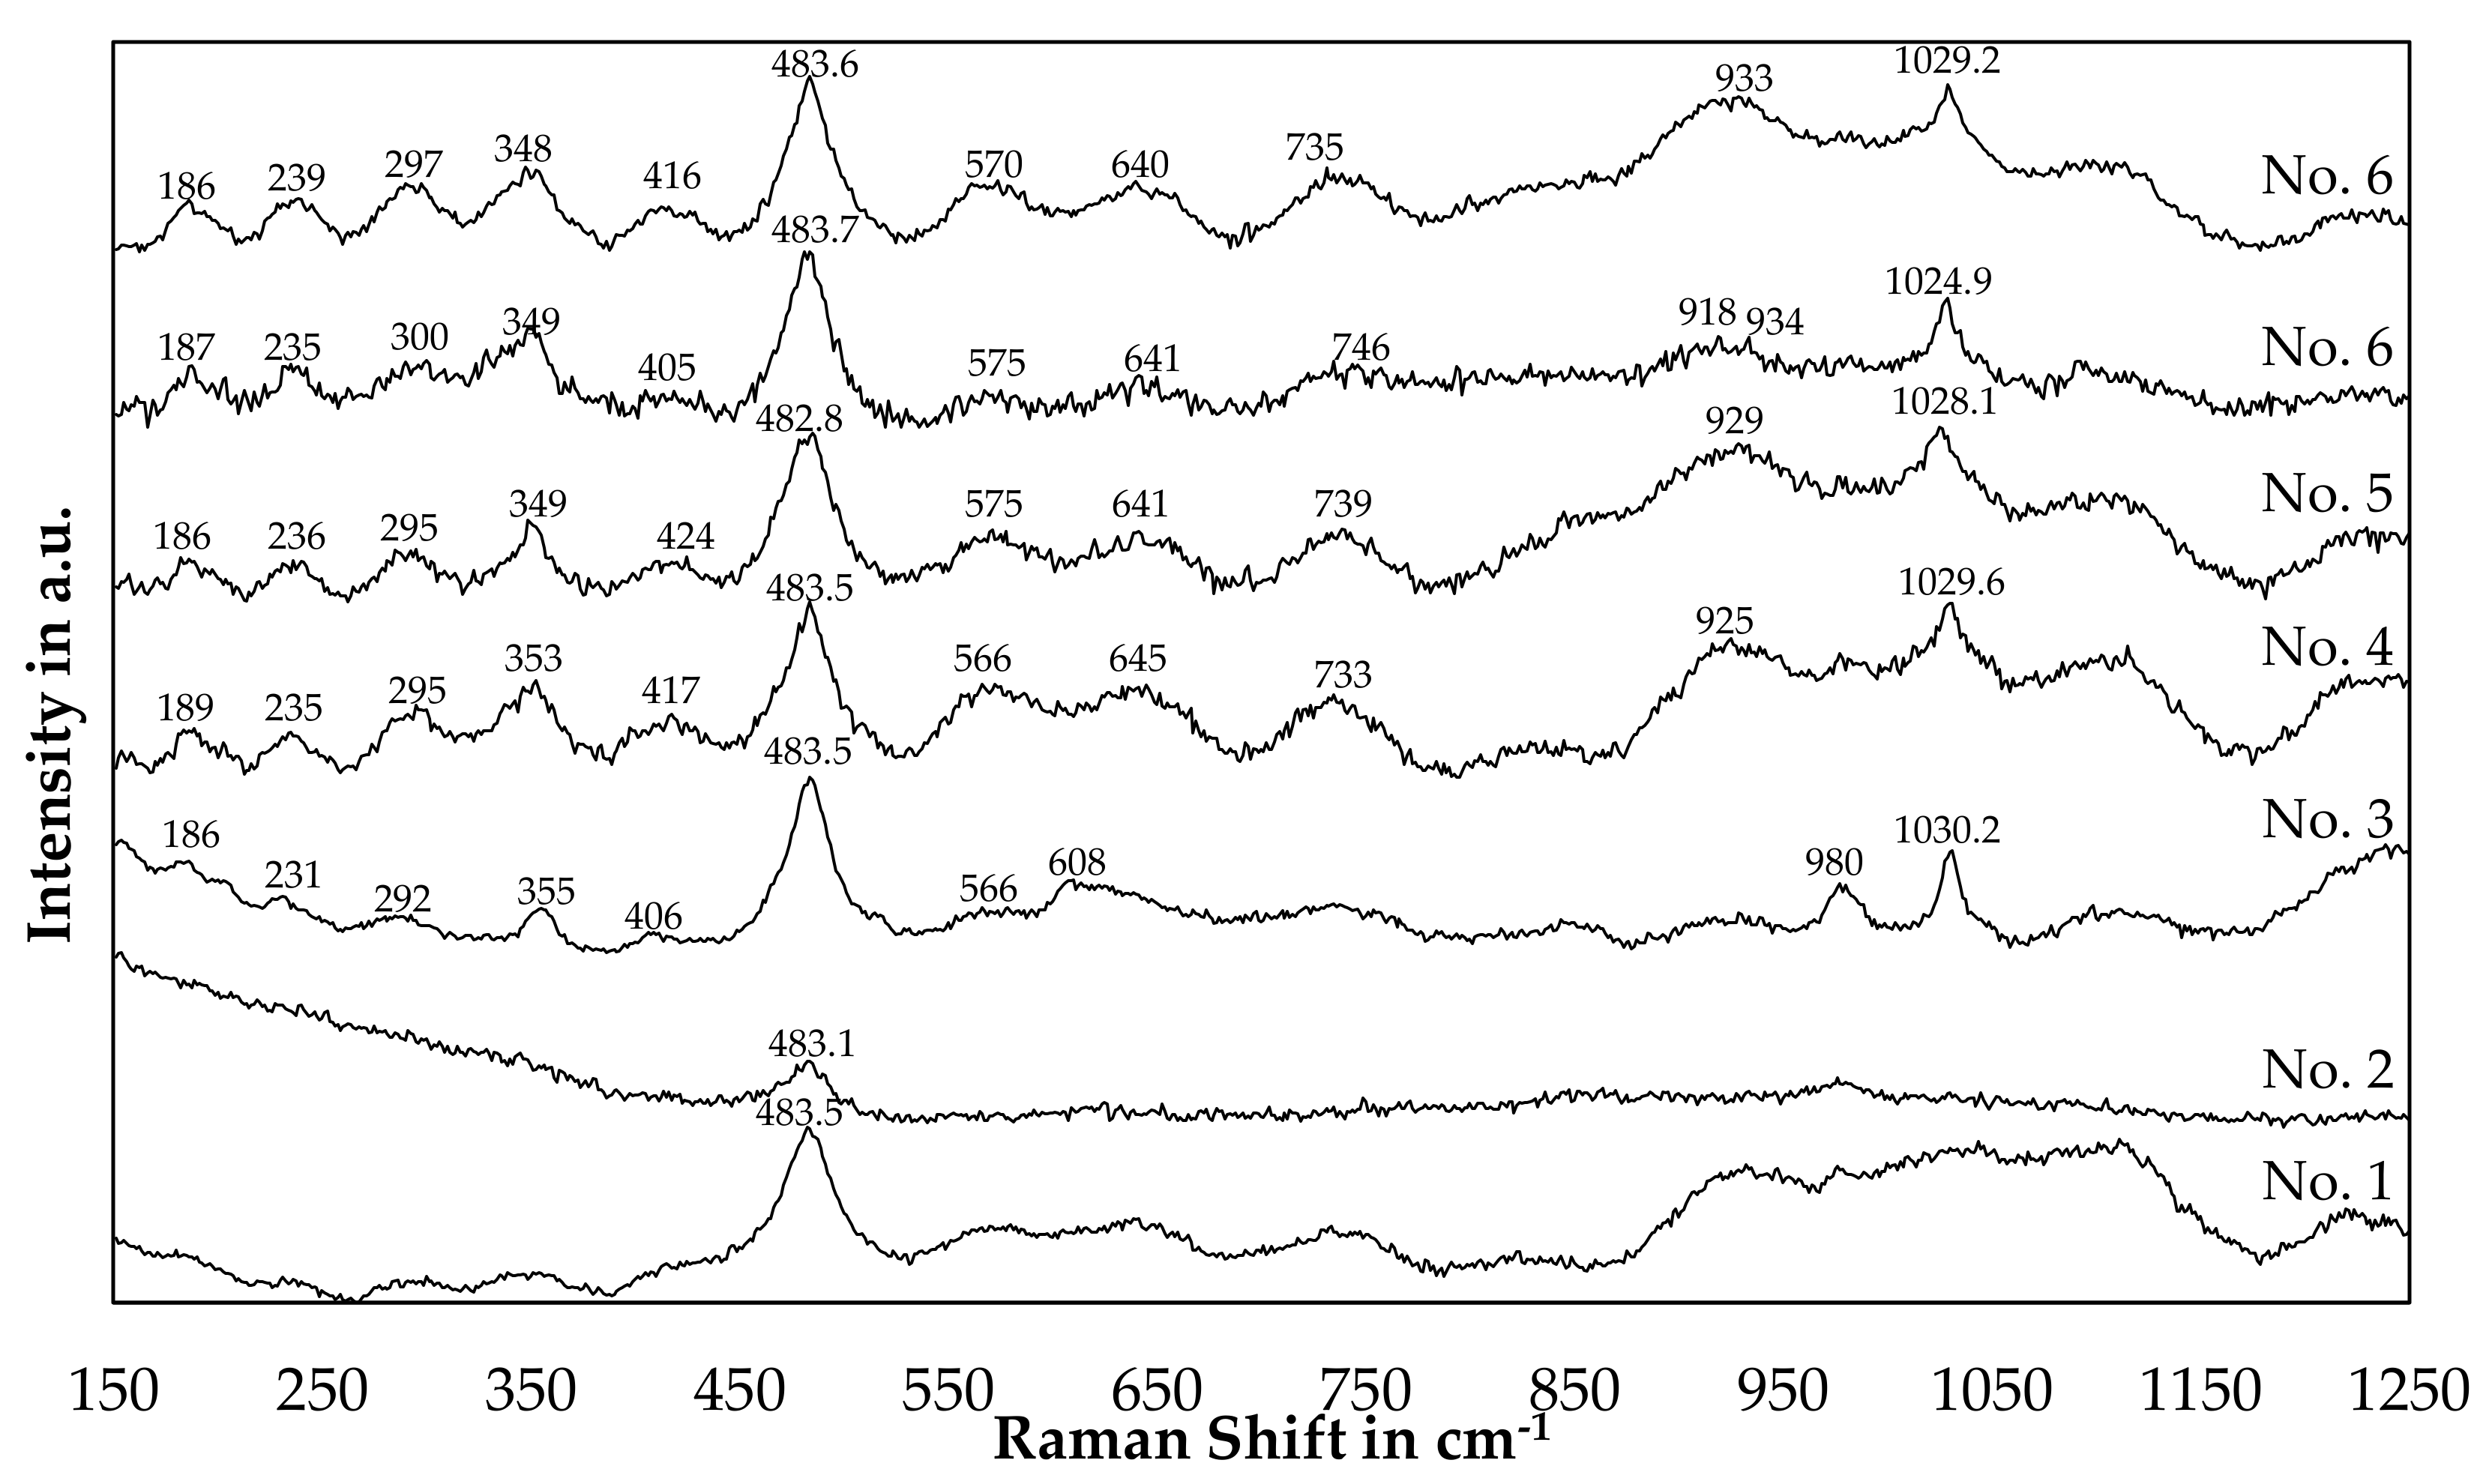
3.2.6. Raman-Analysis of Slag

To verify the presence of β-eucryptite, Raman analysis was carried out using a “MA-RBE-V02” Raman microscope with a magnification of 50 made by “Stonemaster UG, Linkenheim-Hochstetten, Germany” equipped with an Nd-YAG laser. The used wavelength was 532 nm. The numerical aperture was 0.55. The accuracy of the spectral data is ±2 cm−1.
The lithium aluminosilicate system is already well studied by Raman spectroscopy due to the importance in glass-ceramics. Raman spectroscopy can be used to distinguish the minerals in the Li2O-Al2O3-SiO2 ternary system and to measure indirectly the SiO2-content in β-eucryptite [46,47,48,49,50,51]. A discussion about which rotational or vibrational state is responsible for a frequency band is omitted in this research, as it is already discussed in the literature [46,47,48,49,50,51].
To distinguish the minerals β-eucryptite, β-spodumene and γ-spodumene, literature data for peak positions and spectral characteristics are compiled in Table 6 [49,51]. Peaks below a Raman shift of 160 cm−1 are neglected in the table.
The strongest peaks were reported for Raman shifts between 480 cm−1 and 492 cm−1 for all three minerals presented in Table 6. Deviations useful to distinguish those minerals can be the peak at 187 cm−1 and 184 cm−1 reported for β-eucryptite and β-spodumene, respectively, and the peak at 352 cm−1 reported for β-eucryptite.
Figure 16 shows Raman spectra of slag samples originating from the bulk slag phase after a trial. The trial numbers used for labeling are the same used in Table 3 and Figure 13. Thereby, starting with the highest silicon content in the slag for trial 1 and decreasing in silicon content.
By comparison of Figure 16 with Table 6, a strong similarity of peak positions for sample 3 to 6 with the referenced β-eucryptite can be found. Especially the strong peaks at 482–483 cm−1 and 1024–1030 cm−1 are reported in the reference as well, however the reference peak at 1032 cm−1 deviated a little bit from the measured results. Furthermore, the medium-strong peaks at 187 cm−1 and 352 cm−1 can be found with small deviations in the patterns of those trials. More difficult is the evaluation of the patterns of trial 1 and 2. The peak at 483 cm−1 is also observed, however the other peaks are either not detectable or only weak. Furthermore, background noises below 400 cm−1 for slag number 2 and between 925 cm−1 and 1075 cm−1 for slag number 1 are present in the samples.
One explanation for the disappearance of peaks could be, that with an increasing silicon-content in the slag, β-eucryptite (LiAlSiO4) is either replaced or partially replaced by β-spodumene (LiAlSi2O6) or γ-spodumene (LiAlSi2O6), where less peaks were observed in the references. As the main peak for β-spodumene is observed at 492 cm−1 and the XRD indicates, that β-spodumene is not present in sample 1 and 2, the presence of γ-spodumene or β-eucryptite seems more likely. However, a definite assignment of the spectra of samples 1 and 2 is not possible, whereas the assumption of the presence of β-eucryptite is confirmed by XRD and Raman for sample 3, 4, 5 and 6.
Similar to the peak displacement due to variations in the silicon-content already observed for lithium aluminosilicates in the XRD-analysis, Alekseeva et al. [46] proposed a linear relationship for the position of the Raman bands as a function of the silicon content. Those bands are the peaks observed at roughly 483 cm−1 and between 1025 cm−1 and 1030 cm−1 in our study. In our case, the peak at 483 cm−1 is observed at the same position for every sample besides a small deviation, which is smaller than the accuracy of the measurement device. A SiO2-content of 59 (±3–4) mol.% would results in a Raman band at this position according to the linear approximation by Alekseeva et al. [46]. Since both bands have to change simultaneously and only the second band at higher Raman shifts deviates, no definite conclusion about the silicon-content in the minerals investigated can be presented in this paper.

4. Discussion

In the discussion, the results are compared with similar published investigations.
One chapter is dedicated to limitations of the research carried out in this paper and future research directions, which could be investigated even further.

4.1. Discussion of the Obtained Results with Previous Work

The comparison of previous work with the research presented in this paper is carried with a focus on the distribution of valuable metals in the process and the mineralogical investigation of the slag.

4.1.1. Comparison of Valuable Metal Distribution during Smelting

Georgi-Maschler et al. [29] carried out smelting trials in an electric arc furnace with pyrolyzed black mass as well, even though there are a few deviations. They used a considerably higher melting temperature between 1700 °C and 1750 °C and a CaO-SiO2 slag as a flux. Also, the graphite content of the black mass was reduced by prior thermal treatment and not utilized as a reducing agent for another resource, as it has been done in this investigation. A cobalt yield between 60% and 100% was found in laboratory trials and a cobalt yield of 88% in a technical-scale electric arc furnace is reported. The cobalt yield was similar compared to the yield of 80% presented in this paper, even though Georgi-Maschler et al. [29] reported cobalt losses of 3.1% into the slag, whereas in our findings cobalt losses into the slag were below 0.5% except for one trial. Besides higher melting temperatures and a different slag system, the higher amount of fluxes used by Georgi-Maschler et al. [29] could be an explanation for the higher amount of cobalt being lost into the slag phase. The higher amount of fluxes also resulted in a relatively low lithium content of 1.4 wt.%. in the slag phase, which is equal to 31% of the total input lithium mass. A higher distribution of lithium into the flue dust was determined, which could be due to the fluxing by CaO or the higher melting temperature. Both parameters decrease the amount of lithium transferred into the slag, according to the simulation presented in chapter 3.1. Compared to the work from Georgi-Maschler et al. [29], a higher amount of lithium transferred into the slag and a higher lithium content in the slag could be achieved in this paper by adding quartz as the only flux. However, in our work, it was aimed to transfer lithium into the slag, whereas Georgi-Maschler et al. [29] aimed to enrich lithium in the flue dust. In both cases, it was not possible to only enrich lithium in either the slag or dust and losses occurred. Therefore, either treating the dust and slag to recover lithium is necessary or one of both by-products needs to be recirculated into the process to minimize the losses.
A more recent study by Ruismäki et al. [52] investigated an approach similar to ours to use graphite from spent batteries as a reducing agent. They smelted a concentrate generated by froth flotation of industrially pre-processed lithium-ion battery waste with nickel slag to reduce oxides in the nickel slag. A cobalt yield about 93% was reported, based on the analyzed slag. This surpasses the yield presented in this paper but can be explained by the less turbulent conditions in the laboratory tube furnace used by Ruismäki et al. [52] compared to the electric arc furnace used in this study. Furthermore, two different methods to calculate yields were used, which leads to different results. The calculated yield in this paper based on the metal output can be seen as a pessimistic baseline scenario. Yields calculated based on the losses in the slag would have been higher in this study as well than the reported values as well. A comparison of the lithium content in the slag with the paper of Ruismäki et al. [52] cannot be carried out, as only the lithium content in the starting mixture with 0.88 wt.% is reported and after reducing valuable metals, higher lithium contents in their slag seem probable.

4.1.2. Comparison of Lithium Minerals Present in Slags

Elwert et al. [53] investigated three lithium slags that originated from Umicore facilities with a high lithium content by XRD and electron probe microanalysis (EPMA). The main components of the slag were Al2O3, CaO, Li2O and SiO2 in variable amounts. Table 7 shows the chemical composition of the slags investigated by Elwert et al. [53].
The major difference is, that the slags in our investigation contain higher amounts of SiO2 compared to Al2O3 and the slags from the reference have higher Al2O3-contents compared to the SiO2-content. Slags from the reference also contain calcium, which is only a minor element in our study.
All three slag systems have in common, that LiAlO2 is present and that lithium aluminosilicates could not be observed [53]. In our case, lithium aluminosilicates were present in all slags, whereas lithium aluminates were only present in three slags with an aluminum content above 30 wt.%. Lithium silicate with a general formula of Li2MeSiO4 was found in the low aluminum slag [53]. In our case, Li2SiO3 was identified with XRD for five slag samples. Further components observed by the reference but not identified with XRD in our investigation were:
  • Gehlenite (Ca2Al(AlSi)O7 which was identified in all slags
  • Merwinite (Ca3Mg(SiO4)2), which was present in the low aluminum slag and high aluminum slag
  • Cr-Spinel, which was present in the low aluminum and high aluminum slag
  • Spinels, which were present in the high manganese slag
  • Silico-phosphates with a high REE content, which was present in the high manganese slag
Li et al. investigated a synthetic slag with a composition of 50 wt.% SiO2, 35 wt.% CaO, 12 wt.% Al2O3 and 3 wt.% Li2O with XRD. They identified only three phases, β-spodumene, CaSiO3 and CaO [54]. Other phases were not identified, even though a considerable amount of peaks were not indexed. Even though the presence of β-spodumene for slags from this investigation seems rather unlikely, the lower amount of lithium in the slag produced by Li et al. [54] could be an explanation for the occurrence of β-spodumene in their synthetic slag.
The deviations in determined slag phases in the literature and even in this study show, how the mineralogy of the slag can be easily changed by different chemical compositions. This can have a major influence on the leaching process, as not all lithium minerals are easily leachable. α-spodumene for example is difficult to leach and is converted into β-spodumene prior to leaching [55,56,57,58,59].

4.2. Limitations of This Investigation and Future Research Directions

A limitation of the current work is the use of pure copper(II) oxide as a synthetic raw material. This is not feasible for an industrial process and should be replaced by an oxidic raw material like ore or oxidic industrial residues. Preferably, such a raw material contains cobalt, nickel or copper, as those elements have to be recovered from the metal alloy anyway. Further restraints are the accompanying elements of possible raw materials. Ideally, the raw material contains SiO2, as the positive effect on the lithium slagging was proven in this work or Al2O3 since the simulation indicates a positive effect on the lithium slagging as well. Problems could arise if lime is included in the raw material, as the simulation shows increased lithium losses into the gas phase for lime addition.
As more than one lithium-containing mineral is present in the slag according to the XRD-analysis and the thermochemical simulation, the leachability of the slag has to be carefully investigated. If one of those minerals is not leachable, future slag design can not only focus on lithium slagging and the lithium content of the slag, as has been done in this study, it also has to focus on the formation of leachable lithium minerals. Also, the leaching behavior of impurities needs further investigation.
Since no detailed focus was put on the metal phase in this work, future work has to consider the recovery of metals from the produced metal alloy, either in the form of refined metal or pure chemicals.
It is expected that the slag and the metal are both treated by hydrometallurgical methods and the pyrometallurgical operation is used as a pre-concentration unit. Since manganese and iron could be considered an impurity in the hydrometallurgical treatment of the slag and the metal, an evaluation should determine, if those elements are easier to separate in the alloy processing or in the slag processing. Ideally, manganese and iron should be recovered as well from the intermediate products. Based on the preferred distribution of those elements for downstream processing, improvements in the pyrometallurgical process can be investigated to enrich those elements either in the slag or in the alloy. Options could be the adjustment of fluxes or the oxygen potential. Even though Figure 10 suggests, that a complete recovery of cobalt and nickel, while maintaining iron and manganese in the slag is not possible, at least for the investigated slag system. A more detailed investigation of the behavior of manganese in the process will be especially more important for newer battery generations. The manganese and nickel content in the black mass is low compared to cobalt according to Table 1 and as nickel-cobalt-manganese oxide (NCM) cathodes take a dominant role in the battery industry nowadays [60], an increased nickel and manganese content in end of life black mass can be expected in the near future.
In this project, it was only possible to analyze the metal and slag, while the flue dust could not be collected. As considerable weight losses were observed in the process and a considerable amount of lithium could not be identified in the obtained products, a flue dust analysis would enhance the accuracy of the mass balance of the process. Furthermore, an analysis of the flue dust would be necessary to evaluate whether the flue dust can be recirculated back to the electric arc furnace, or if recirculating would lead to an enrichment of volatile elements in the process. To avoid the enrichment and circulation of volatile elements, an additional treatment process of flue dust could be necessary.
Also not investigated was the influence and distribution of minor elements like phosphorous, sulfur and halogens. Halogens could be of special interest as they are commonly enriched in the flue dust in smelting processes [61,62] and halogens should not be circulated back to the smelter [63,64].

5. Conclusions

A pyrometallurgical approach was investigated to separate critical elements from pyrolyzed lithium-ion battery black mass into intermediate products by smelting in an electric arc furnace.
A thermochemical simulation was carried out to determine a fluxing strategy. Quartz was chosen as a flux and two different quartz additions were tested in six trials. To utilize excess graphite in the feed material, copper(II) oxide was fed into the furnace. The graphite was therefore used as a reducing agent in the process. Due to the experimentally proven reduction of added copper(II) oxide, carbon from black mass was utilized as a reducing agent and could therefore be included in a recycling efficiency calculation.
Cobalt, nickel, and copper were enriched in a mixed alloy, while lithium was concentrated in the slag. The yield of cobalt, nickel and copper was 81.6%, 93.3%, and 90.7% respectively for the thoroughly investigated trial with a quartz-addition of 20 g per 100 g black mass at 1600 °C based on the metal output. The reported losses for those metals into the slag were small with 0.4%, 0.2% and 0.4% respectively. Similar findings were reported by other researchers [29,52]. Besides one trial, the losses of those valuable metals in the slag were below 1% for every trial.
An enrichment of lithium into the slag was achieved in all trials with a yield between 64.1% and 82.4%. Lithium contents between 5.18% and 7.40% in the slag were achieved. Higher quartz additions increased the lithium yield, but lead to a decreased lithium content in the slag. The amount of lithium transferred into the metal alloy was below 3% compared to the lithium input.
A considerable amount of lithium, cobalt, nickel and copper from the input feed were not found in the slag or metal after the trials. Therefore, the assumption is made that they were lost as flue dust. A recirculation of flue dust into the furnace could, therefore, increase the yields significantly, as the reported losses into the slag or metal phase are considerably low. Furthermore, as the material could only be charged in the turbulent zone of the laboratory electric arc furnace, losses due to dusting of the input material could be mitigated at an industrial scale and increase the overall yield.
The slag was characterized by Raman and X-ray diffraction. Every investigated slag contains lithium aluminosilicates. Lithium aluminate and lithium metasilicate are present in three respectively five slags out of six slags in total depending on the chemical composition of the slag.

Supplementary Materials

The following are available online at https://www.mdpi.com/2075-4701/10/8/1069/s1, Figure S1: Macrographs of slag: (a) generated in trial number 5, (b) generated in trial number 6, Table S1: Chemical Formula, mineral name and information card number, Table S2: Chemical composition of slag samples taken during the holding time and after solidification, Table S3: Standard deviation of the chemical analyses presented in Table 4 in the main paper in wt.%. Table S4: Linear Equations of Metal Relations in Slag Samples and Coefficient of Determination, Table S5: Exponential Equations of Metal Relations in Slag Samples and Coefficient of Determination, Figure S2: Macrograph of metal obtained from trial number 3, Figure S3: Macrograph of metal obtained from trial number 4, Figure S4: Micrograph of the interface between the cobalt and copper phase of trial number 3, Figure S5: Micrograph of the cobalt matrix including copper inclusions of trial number 4, Figure S6: Micrograph of the copper matrix including cobalt inclusion of trial number 4, Figure S7: Micrograph of the bottom of the solidified ingot form trial number 3, Figure S8: Macrograph of slowly solidified metal from trial 3 and 4, Table S6: Comparison of selected elements in metal samples analyzed by different methods.

Author Contributions

Conceptualization, M.S., C.V., and. B.F.; methodology, M.S. and C.V.; software, M.S.; validation, M.S., C.V., C.D., J.K., D.O., B.F., T.H., and A.M.; formal analysis, M.S.; investigation, M.S. and C.V.; resources M.S. and C.V.; data curation, M.S. and C.V.; writing—original draft preparation, M.S. and C.V.; writing—review and editing M.S., C.V., C.D., J.K., D.O., B.F., T.H., and A.M.; visualization, M.S.; supervision, B.F.; project administration, C.V. and J.K.; funding acquisition, B.F., A.M., T.H., J.K., and C.V. All authors have read and agreed to the published version of the manuscript.

Funding

This research was funded by Deutscher Akademischer Austauschdienst (DAAD), grant number 57453240.

Acknowledgments

The authors are grateful to Accurec Recycling GmbH (Germany) for providing pelletized black mass. The authors would also like to express their gratitude to the DAAD for enabling the joint research in battery recycling.

Conflicts of Interest

The authors declare no conflict of interest. The funders had no role in the design of the study; in the collection, analyses, or interpretation of data; in the writing of the manuscript, or in the decision to publish the results.

References

  1. Dańczak, A.; Klemettinen, L.; Kurhila, M.; Taskinen, P.; Lindberg, D.; Jokilaakso, A. Behavior of Battery Metals Lithium, Cobalt, Manganese and Lanthanum in Black Copper Smelting. Batteries 2020, 6, 16. [Google Scholar] [CrossRef] [Green Version]
  2. Helbig, C.; Bradshaw, A.M.; Wietschel, L.; Thorenz, A.; Tuma, A. Supply Risks Associated with Lithium-Ion Battery Materials. J. Clean. Prod. 2018, 172, 274–286. [Google Scholar] [CrossRef]
  3. Nitta, N.; Wu, F.; Lee, J.T.; Yushin, G. Li-Ion Battery Materials: Present and Future. Mater. Today 2015, 18, 252–264. [Google Scholar] [CrossRef]
  4. Gu, F.; Guo, J.; Yao, X.; Summers, P.A.; Widijatmoko, S.D.; Hall, P. An Investigation of the Current Status of Recycling Spent Lithium-Ion Batteries from Consumer Electronics in China. J. Clean. Prod. 2017, 161, 765–780. [Google Scholar] [CrossRef]
  5. Contestabile, M.; Panero, S.; Scrosati, B. A Laboratory-Scale Lithium-Ion Battery Recycling Process. J. Power Sources 2001, 92, 65–69. [Google Scholar] [CrossRef]
  6. Pinegar, H.; Smith, Y.R. Recycling of End-of-Life Lithium-Ion Batteries, Part II: Laboratory-Scale Research Developments in Mechanical, Thermal, and Leaching Treatments. J. Sustain. Metall. 2020, 6, 142–160. [Google Scholar] [CrossRef]
  7. Porvali, A.; Aaltonen, M.; Ojanen, S.; Velazquez-Martinez, O.; Eronen, E.; Liu, F.; Wilson, B.P.; Serna-Guerrero, R.; Lundström, M. Mechanical and Hydrometallurgical Processes in HCl Media for the Recycling of Valuable Metals from Li-Ion Battery Waste. Resour. Conserv. Recycl. 2019, 142, 257–266. [Google Scholar] [CrossRef]
  8. European Commission. Report from the Commission to the European Parliament, the Council, the European Economic and Social Committee, the Committee of the Regions and the European Investment Bank: On the Implementation of the Strategic Action Plan on Batteries: Building a Strategic Battery Value Chain in Europe. Available online: https://eur-lex.europa.eu/legal-content/EN/TXT/HTML/?uri=CELEX:52019DC0176&from=EN (accessed on 16 June 2020).
  9. Pinegar, H.; Smith, Y.R. Recycling of End-of-Life Lithium Ion Batteries, Part I: Commercial Processes. J. Sustain. Metall. 2019, 5, 402–416. [Google Scholar] [CrossRef]
  10. Tarascon, J.; Armand, M. Issues and Challenges Facing Rechargeable Lithium Batteries. Nature 2001, 414, 359–367. [Google Scholar] [CrossRef]
  11. Huang, B.; Pan, Z.; Su, X.; An, L. Recycling of Lithium-Ion Batteries: Recent Advances and Perspectives. J. Power Sources 2018, 399, 274–286. [Google Scholar] [CrossRef]
  12. The European Parliament and the Council of the European Union. Directive 2006/66/EC of the European Parliament and of the Council on Batteries and Accumulators and Waste Batteries and Accumulators and Repealing Directive 91/157/EEC. Available online: https://eur-lex.europa.eu/legal-content/EN/TXT/PDF/?uri=CELEX:02006L0066-20131230&rid=1 (accessed on 6 May 2020).
  13. Werner, D.; Peuker, U.A.; Mütze, T. Recycling Chain for Spent Lithium-Ion Batteries. Metals 2020, 10, 316. [Google Scholar] [CrossRef] [Green Version]
  14. Zhong, X.; Liu, W.; Han, J.; Jiao, F.; Qin, W.; Liu, T. Pretreatment for the Recovery of Spent Lithium Ion Batteries: Theoretical and Practical Aspects. J. Clean. Prod. 2020, 263, 121439. [Google Scholar] [CrossRef]
  15. Liu, J.; Wang, H.; Hu, T.; Bai, X.; Wang, S.; Xie, W.; Hao, J.; He, Y. Recovery of LiCoO2 and Graphite from Spent Lithium-Ion Batteries by Cryogenic Grinding and Froth Flotation. Miner. Eng. 2020, 148, 106223. [Google Scholar] [CrossRef]
  16. Zhang, G.; Du, Z.; He, Y.; Wang, H.; Xie, W.; Zhang, T. A Sustainable Process for the Recovery of Anode and Cathode Materials Derived from Spent Lithium-Ion Batteries. Sustainability 2019, 11, 2363. [Google Scholar] [CrossRef] [Green Version]
  17. Zhang, G.; He, Y.; Feng, Y.; Wang, H.; Zhang, T.; Xie, W.; Zhu, X. Enhancement in Liberation of Electrode Materials Derived from Spent Lithium-Ion Battery by Pyrolysis. J. Clean. Prod. 2018, 199, 62–68. [Google Scholar] [CrossRef]
  18. Li, J.; Lai, Y.; Zhu, X.; Liao, Q.; Xia, A.; Huang, Y.; Zhu, X. Pyrolysis Kinetics and Reaction Mechanism of the Electrode Materials During the Spent LiCoO2 Batteries Recovery Process. J. Hazard. Mater. 2020, 398, 122955. [Google Scholar] [CrossRef]
  19. Zhong, X.; Liu, W.; Han, J.; Jiao, F.; Qin, W.; Liu, T.; Zhao, C. Pyrolysis and Physical Separation for the Recovery of Spent LiFePO4 Batteries. Waste Manag. 2019, 89, 83–93. [Google Scholar] [CrossRef]
  20. Ruismäki, R.; Dańczak, A.; Klemettinen, L.; Taskinen, P.; Lindberg, D.; Jokilaakso, A. Integrated Battery Scrap Recycling and Nickel Slag Cleaning with Methane Reduction. Minerals 2020, 10, 435. [Google Scholar] [CrossRef]
  21. Shi, J.; Peng, C.; Chen, M.; Li, Y.; Eric, H.; Klemettinen, L.; Lundström, M.; Taskinen, P.; Jokilaakso, A. Sulfation Roasting Mechanism for Spent Lithium-Ion Battery Metal Oxides Under SO2-O2-Ar Atmosphere. JOM 2019, 71, 4473–4482. [Google Scholar] [CrossRef] [Green Version]
  22. Peng, C.; Hamuyuni, J.; Wilson, B.P.; Lundström, M. Selective Reductive Leaching of Cobalt and Lithium from Industrially Crushed Waste Li-Ion Batteries in Sulfuric Acid System. Waste Manag. 2018, 76, 582–590. [Google Scholar] [CrossRef]
  23. Porvali, A.; Chernyaev, A.; Shukla, S.; Lundström, M. Lithium Ion Battery Active Material Dissolution Kinetics in Fe (II)/Fe (III) Catalyzed Cu-H2SO4 Leaching System. Sep. Purif. Technol. 2020, 236, 116305. [Google Scholar] [CrossRef]
  24. Dewulf, J.; van der Vorst, G.; Denturck, K.; van Langenhove, H.; Ghyoot, W.; Tytgat, J.; Vandeputte, K. Recycling Rechargeable Lithium Ion Batteries: Critical Analysis of Natural Resource Savings. Resour. Conserv. Recycl. 2010, 54, 229–234. [Google Scholar] [CrossRef]
  25. Reck, B.K.; Graedel, T.E. Challenges in Metal Recycling. Science 2012, 337, 690–695. [Google Scholar] [CrossRef] [PubMed]
  26. Graedel, T.E.; Allwood, J.; Birat, J.-P.; Buchert, M.; Hagelüken, C.; Reck, B.K.; Sibley, S.F.; Sonnemann, G. What Do We Know About Metal Recycling Rates? J. Ind. Ecol. 2011, 15, 355–366. [Google Scholar] [CrossRef]
  27. Harper, G.; Sommerville, R.; Kendrick, E.; Driscoll, L.; Slater, P.; Stolkin, R.; Walton, A.; Christensen, P.; Heidrich, O.; Lambert, S.; et al. Recycling Lithium-Ion Batteries from Electric Vehicles. Nature 2019, 575, 75–86. [Google Scholar] [CrossRef] [PubMed] [Green Version]
  28. Wang, H.; Friedrich, B. Development of a Highly Efficient Hydrometallurgical Recycling Process for Automotive Li–Ion Batteries. J. Sustain. Metall. 2015, 1, 168–178. [Google Scholar] [CrossRef] [Green Version]
  29. Georgi-Maschler, T.; Friedrich, B.; Weyhe, R.; Heegn, H.; Rutz, M. Development of a Recycling Process for Li-Ion Batteries. J. Power Sources 2012, 207, 173–182. [Google Scholar] [CrossRef]
  30. Bale, C.W.; Bélisle, E.; Chartrand, P.; Decterov, S.A.; Eriksson, G.; Gheribi, A.E.; Hack, K.; Jung, I.-H.; Kang, Y.-B.; Melançon, J.; et al. FactSage Thermochemical Software and Databases, 2010–2016. Calphad 2016, 54, 35–53. [Google Scholar] [CrossRef] [Green Version]
  31. Plewa, J.; Skrzypek, J. Kinetics of the Reduction of Copper Oxide with Carbon Monoxide. Chem. Eng. Sci. 1989, 44, 2817–2824. [Google Scholar] [CrossRef]
  32. Vest, M.; Georgi-Maschler, T.; Friedrich, B.; Weyhe, R. Rückgewinnung von Wertmetallen aus Batterieschrott. Chem. Ing. Tech. 2010, 82, 1985–1990. [Google Scholar] [CrossRef]
  33. Jones, R.T.; Erwee, M.W. Simulation of Ferro-Alloy Smelting in DC Arc Furnaces Using Pyrosim and FactSage. Calphad 2016, 55, 20–25. [Google Scholar] [CrossRef]
  34. Sommerfeld, M.; Friedmann, D.; Kuhn, T.; Friedrich, B. “Zero-Waste”: A Sustainable Approach on Pyrometallurgical Processing of Manganese Nodule Slags. Minerals 2018, 8, 544. [Google Scholar] [CrossRef] [Green Version]
  35. Keber, S.; Brückner, L.; Elwert, T.; Kuhn, T. Concept for a Hydrometallurgical Processing of a Copper-Cobalt-Nickel Alloy Made from Manganese Nodules. Chem. Ing. Tech. 2020, 92, 379–386. [Google Scholar] [CrossRef] [Green Version]
  36. Xiao, S.; Ren, G.; Xie, M.; Pan, B.; Fan, Y.; Wang, F.; Xia, X. Recovery of Valuable Metals from Spent Lithium-Ion Batteries by Smelting Reduction Process Based on MnO-SiO2-Al2O3 Slag System. J. Sustain. Metall. 2017, 3, 703–710. [Google Scholar] [CrossRef]
  37. Gražulis, S.; Chateigner, D.; Downs, R.T.; Yokochi, A.F.T.; Quirós, M.; Lutterotti, L.; Manakova, E.; Butkus, J.; Moeck, P.; Le Bail, A. Crystallography Open Database—An Open-Access Collection of Crystal Structures. J. Appl. Crystallogr. 2009, 42, 726–729. [Google Scholar] [CrossRef] [PubMed]
  38. Downs, R.T.; Hall-Walace, M. The American Mineralogist Crystal Structure Database. Am. Mineral. 2003, 88, 247–250. [Google Scholar]
  39. Gražulis, S.; Daškevič, A.; Merkys, A.; Chateigner, D.; Lutterotti, L.; Quirós, M.; Serebryanaya, N.R.; Moeck, P.; Downs, R.T.; Le Bail, A. Crystallography Open Database (COD): An Open-Access Collection of Crystal Structures and Platform for World-Wide Collaboration. Nucleic Acids Res. 2012, 40, D420–D427. [Google Scholar] [CrossRef]
  40. Gražulis, S.; Merkys, A.; Vaitkus, A.; Okulič-Kazarinas, M. Computing Stoichiometric Molecular Composition from Crystal Structures. J. Appl. Crystallogr. 2015, 48, 85–91. [Google Scholar] [CrossRef] [Green Version]
  41. Merkys, A.; Vaitkus, A.; Butkus, J.; Okulič-Kazarinas, M.; Kairys, V.; Gražulis, S. COD:CIF:Parser: An Error-Correcting CIF Parser for the Perl language. J. Appl. Crystallogr. 2016, 49, 292–301. [Google Scholar] [CrossRef] [Green Version]
  42. Quirós, M.; Gražulis, S.; Girdzijauskaitė, S.; Merkys, A.; Vaitkus, A. Using SMILES Strings for the Description of Chemical Connectivity in the Crystallography Open Database. J. Cheminf. 2018, 10, 23. [Google Scholar] [CrossRef]
  43. Li, C.-T.; Peacor, D.R. The Crystal Structure of LiAlSi2O6-II (“β Spodumene”). Z. Kristallogr. Cryst. Mater. 1968, 126, 46–65. [Google Scholar] [CrossRef]
  44. Xu, H.; Heaney, P.J.; Beall, G.H. Phase Transitions Induced by Solid Solution in Stuffed Derivatives of Quartz: A Powder Synchrotron XRD Study of the LiAlSiO4-SiO2 Join. Am. Mineral. 2000, 85, 971–979. [Google Scholar] [CrossRef]
  45. Nakagawa, K.; Izumitani, T. Metastable Phase Separation and Crystallization of Li2O-Al2O3-SiO2 Glasses: Determination of Miscibility Gap from the Lattice Parameters of Precipitated β-Quartz Solid Solution. J. Non Cryst. Solids 1972, 7, 168–180. [Google Scholar] [CrossRef]
  46. Alekseeva, I.; Dymshits, O.; Ermakov, V.; Zhilin, A.; Petrov, V.; Tsenter, M. Raman Spectroscopy Quantifying the Composition of Stuffed β-Quartz Derivative Phases in Lithium Aluminosilicate Glass-Ceramics. J. Non Cryst. Solids 2008, 354, 4932–4939. [Google Scholar] [CrossRef]
  47. Görlich, E.; Proniewicz, L.M. Laser Raman Spectroscopy Studies of Beta-Eucryptite Crystallization from Glass. J. Mol. Struct. 1982, 79, 247–250. [Google Scholar] [CrossRef]
  48. Jochum, T.; Reimanis, I.E.; Lance, M.J.; Fuller, E.R. In Situ Raman Indentation of β-Eucryptite: Characterization of the Pressure-Induced Phase Transformation. J. Am. Ceram. Soc. 2009, 92, 857–863. [Google Scholar] [CrossRef]
  49. Sharma, S.K.; Simons, B. Raman Study of Crystalline Polymorphs and Glasses of Spodumene Composition Quenched from Various Pressures. Am. Mineral. 1981, 66, 118–126. [Google Scholar]
  50. Sprengard, R.; Binder, K.; Brändle, M.; Fotheringham, U.; Sauer, J.; Pannhorst, W. On the Interpretation of the Experimental Raman Spectrum of β-Eucryptite LiAlSiO4 from Atomistic Computer Modeling. J. Non Cryst. Solids 2000, 274, 264–270. [Google Scholar] [CrossRef]
  51. Zhang, M.; Xu, H.; Salje, E.K.H.; Heaney, P.J. Vibrational Spectroscopy of Beta-Eucryptite (LiAlSiO4): Optical Phonons and Phase Transition(s). Phys. Chem. Miner. 2003, 30, 457–462. [Google Scholar] [CrossRef]
  52. Ruismäki, R.; Rinne, T.; Dańczak, A.; Taskinen, P.; Serna-Guerrero, R.; Jokilaakso, A. Integrating Flotation and Pyrometallurgy for Recovering Graphite and Valuable Metals from Battery Scrap. Metals 2020, 10, 680. [Google Scholar] [CrossRef]
  53. Elwert, T.; Goldmann, D.; Schirmer, T.; Strauß, K. Phase Composition of High Lithium Slags from the Recycling of Lithium Ion Batteries. World Metall. 2012, 65, 163–171. [Google Scholar]
  54. Li, N.; Guo, J.; Chang, Z.; Dang, H.; Zhao, X.; Ali, S.; Li, W.; Zhou, H.; Sun, C. Aqueous Leaching of Lithium from Simulated Pyrometallurgical Slag by Sodium Sulfate Roasting. RSC Adv. 2019, 9, 23908–23915. [Google Scholar] [CrossRef] [Green Version]
  55. Peltosaari, O.; Tanskanen, P.; Heikkinen, E.-P.; Fabritius, T. α→γ→β-Phase Transformation of Spodumene with Hybrid Microwave and Conventional Furnaces. Miner. Eng. 2015, 82, 54–60. [Google Scholar] [CrossRef]
  56. Salakjani, N.K.; Singh, P.; Nikoloski, A.N. Acid Roasting of Spodumene: Microwave vs. Conventional Heating. Miner. Eng. 2019, 138, 161–167. [Google Scholar] [CrossRef]
  57. Rosales, G.D.; Resentera, A.C.J.; Gonzalez, J.A.; Wuilloud, R.G.; Rodriguez, M.H. Efficient Extraction of Lithium from β-Spodumene by Direct Roasting with NaF and Leaching. Chem. Eng. Res. Des. 2019, 150, 320–326. [Google Scholar] [CrossRef]
  58. Setoudeh, N.; Nosrati, A.; Welham, N.J. Phase Changes in Mechanically Activated Cpodumene-Na2SO4 Mixtures after Isothermal Heating. Miner. Eng. 2020, 155, 106455. [Google Scholar] [CrossRef]
  59. Gasafi, E.; Pardemann, R. Processing of Spodumene Concentrates in Fluidized-Bed Systems. Miner. Eng. 2020, 148, 106205. [Google Scholar] [CrossRef]
  60. Kallitsis, E.; Korre, A.; Kelsall, G.; Kupfersberger, M.; Nie, Z. Environmental Life Cycle Assessment of the Production in China of Lithium-Ion Batteries with Nickel-Cobalt-Manganese Cathodes Utilising Novel Electrode Chemistries. J. Clean. Prod. 2020, 254, 120067. [Google Scholar] [CrossRef]
  61. Grudinsky, P.I.; Dyubanov, V.G.; Kozlov, P.A. Copper Smelter Dust Is a Promising Material for the Recovery of Nonferrous Metals by the Waelz Process. Inorg. Mater. Appl. Res. 2019, 10, 496–501. [Google Scholar] [CrossRef]
  62. Murakami, Y.; Matsuzaki, Y.; Murakami, K.; Hiratani, S.; Shibayama, A.; Inoue, R. Recovery Rates of Used Rechargeable Lithium-Ion Battery Constituent Elements in Heat Treatment. Metall. Mater. Trans. B 2020, 51, 1355–1362. [Google Scholar] [CrossRef]
  63. Halli, P.; Hamuyuni, J.; Revitzer, H.; Lundström, M. Selection of Leaching Media for Metal Dissolution from Electric Arc Furnace Dust. J. Clean. Prod. 2017, 164, 265–276. [Google Scholar] [CrossRef]
  64. Aromaa, J.; Kekki, A.; Stefanova, A.; Makkonen, H.; Forsén, O. New Hydrometallurgical Approaches for Stainless Steel Dust Treatment. Miner. Process. Extr. Metall. 2016, 125, 242–252. [Google Scholar] [CrossRef]
Figure 1. Schematic process flow sheet for black mass pellet generation.
Metals 10 01069 g001
Figure 2. Laboratory electric arc furnace: (a) Schematic concept of the furnace; (b) tapping of the furnace after an experiment.
Metals 10 01069 g002
Figure 3. Influence of fluxing on the Li-slagging at 1600 °C with an addition of 65 g CuO per 100 g black mass.
Metals 10 01069 g003
Figure 4. Influence of temperature on the Li-slagging using 21 g of fluxes and 65 g of CuO per 100 g black mass.
Metals 10 01069 g004
Figure 5. Simulated change of Gibbs energy for the reaction of lithium oxide with alumina, silica and alumina and silica.
Metals 10 01069 g005
Figure 6. Activity of the gas phase in equilibrium with pure lithium compounds.
Metals 10 01069 g006
Figure 7. Distribution of lithium into different phases occurring in the process at 1600 °C with a CuO-addition of 65 g per 100 g black mass.
Metals 10 01069 g007
Figure 8. Influence of temperature and quartz addition on the SiO2- and Li-content in slag and Li-slagging with a CuO-addition of 65 g per 100 g black mass.
Metals 10 01069 g008
Figure 9. Slagging of metals observed in the laboratory-scale trials. Oxide addition in g per 100 g black mass.
Metals 10 01069 g009
Figure 10. Relations of valuable metal content in slag samples compared to iron- and manganese content.
Metals 10 01069 g010
Figure 11. Comparison between analyzed metal composition and thermochemical model. (a): copper-rich phase; (b): cobalt-rich phase.
Metals 10 01069 g011
Figure 12. Distribution of elements in laboratory trials between, metal, slag and gas phase of Trial 3 and 4 (left bars) combined, compared with the thermochemical simulation (right bars).
Metals 10 01069 g012
Figure 13. XRD-patterns of slag samples originated from the trials.
Metals 10 01069 g013
Figure 14. Detailed XRD-pattern of the four strongest β-eucryptite peaks.
Metals 10 01069 g014
Figure 15. Simulated mineralogical composition of the slag in wt.%.
Metals 10 01069 g015
Figure 16. Raman Analysis of slag samples originated from the trials.
Metals 10 01069 g016
Table 1. Composition of the black mass in wt.% analyzed by ICP-OES and combustion.
CompoundCoFeMnAlCuSiZnNiAgLiC
Mean22.06.510.753.884.690.370.112.710.322.2420.5
Std. Dev.0.140.120.000.050.020.070.000.040.010.020.27
Table 2. Theoretical transition temperatures of selected lithium compound and lithium content according to FactSageTM [30].
Compound FormulaName According to DatabaseSolid TransitionMelting PointLi-Content in wt.%
(Li2O)2(SiO2)Lithium Orthosilicate-1254.85 °C23.17
LiAlO2Lithium Aluminium Oxide-1699.85 °C10.53
Li2SiO3Lithium Silicate-1200.85 °C15.43
Li2Si2O5Lithium Silicate935.85 °C1033.85 °C9.25
(Li2O)(Al2O3)(SiO2)4Spodumene736.46 °C-3.73
LiAlSiO4Eucryptite1026.85 °C-5.51
LiAlSi2O6Spodumene720.04 °C-3.73
LiAlSi4O10Petalite--2.27
Table 3. Input and output mass of the trials.
Trial No.Black Mass in gAddition in g Per 100 g Black MassSolidification ConditionMetal in gSlag
in g
Weight
Loss in %
Adjusted Weight Loss in %
SiO2CuO
13500.020.095.0Mould3462.61015.640.518.9
23500.020.090.0Crucible3511.91246.835.313.7
33500.020.080.0Crucible3080.0992.747.325.0
43500.020.065.0Mould2958.3851.141.219.4
53500.010.092.3Mould3393.8742.241.619.0
63500.010.096.3Crucible3401.4714.043.020.4
Table 4. Chemical analysis of bulk slag generated in the trials.
Trial No.Mass in gComposition in wt.%
LiCuCoNiCSiO2Al2O3Fe2O3Mn3O4BaO
MethodICP-OESCombustionXRF
11015.65.530.230.090.010.02956.222.00.522.250.57
21246.85.181.41.440.050.03553.420.22.252.230.50
3992.75.840.390.410.050.12049.727.10.671.690.69
4851.16.240.400.250.030.28546.530.20.220.840.76
5742.26.770.350.070.010.23843.132.20.312.120.87
6714.07.400.100.060.010.18441.833.40.140.700.83
Table 5. Composition of quenched metal in wt.%.
ElementCuCoNiFeMnSiLi
wt.%66.1–65.020.2–19.92.83–2.688.05–7.690.58–0.553.18–3.100.074–0.070
Table 6. Reported Raman shifts in cm−1 with an accuracy of 2 cm−1 and spectral characteristics of lithium aluminosilicates according to literature.
β-Eucryptite [51]β-Spodumene [49]γ-Spodumene [49]
Raman ShiftCharacteristicRaman ShiftCharacteristicRaman ShiftCharacteristic
187m 1,2184m 1
233vw
282w, bd288w
352m
412w
466(sh) 440(sh) 1
483s492s480s
636vw
711w~720vw, bd
762w770w, bd742vw, bd
864vw, bd
987w990(sh)
1032s
1049(sh) 1044(sh)
1067vw
1086m 1088w, bd
1099w1094w, bd
1 Abbreviations: v, very; w, weak; m, medium; s, strong; bd, broad; sh, shoulder; 2 Zhang et al. [51] did not list the characteristics, therefore they are derived from the published figure.
Table 7. Composition of lithium-containing slags from Umicore in wt.% [53].
Slag SystemLow Aluminium ContentHigh Manganese ContentHigh Aluminium Content
Al2O333.5744.5247.37
CaO23.4616.0823.42
Li2O11.048.298.96
MnO20.319.520.36
MgO5.111.442.65
SiO221.2517.5212.81

