Splashing Simulation of Liquid Steel Drops during the Ruhrstahl Heraeus Vacuum Process


1
State Key Laboratory of Advanced Metallurgy, University of Science and Technology Beijing, Beijing 100083, China
2
Railway Material Department, Zhejiang Metals and Materials CO., Hangzhou 310000, China
*
Author to whom correspondence should be addressed.
Metals 2020, 10(8), 1070; https://doi.org/10.3390/met10081070
Submission received: 19 June 2020
/
Revised: 4 August 2020
/
Accepted: 5 August 2020
/
Published: 7 August 2020
(This article belongs to the Special Issue Numerical Modelling in Steel Metallurgy)
Abstract
:In view of the serious splashing problem in the 120 ton Ruhrstahl Heraeus (RH) refining process of a special steel company, a coupling model of volume of fluid + discrete phase model was established to study the influence of the vacuum pressure drop mode on the RH vacuum splashing. Three different pressure drop modes were simulated, and the splash situation was described by the fluctuation of the liquid level and the velocity field in the vacuum chamber in this model. The model predicted that the most serious splashing situation of liquid drops would happen at the early stage of vacuum treatment, which was consistent with that found in industrial production. The liquid level in the vacuum chamber maintained a low fluctuation at the late stage of the RH vacuum process. The vacuum pressure drop mode was closely relevant with the splashing situation. The splashing of liquid steel can be effectively improved by controlling the vacuum pressure drop mode, and it can be used in the industrial production situation.
1. Introduction
As an important and advanced secondary refining equipment, the Ruhrstahl Heraeus (RH) possesses many key metallurgical functions such as decarburization, dehydrogenation, denitrification, deoxidation, and removal of non-metallic inclusions [1,2]. The RH refining process starts by lowering the vacuum chamber until the snorkels penetrate the molten slag and are immersed in the molten steel. Argon then enters the vacuum chamber through the nozzle in the up-snorkel. Due to the reduction of pressure, molten steel is injected through the up/down snorkel and then recycled between the vacuum chamber and the ladle [3]. However, a problem in the vacuum treatment of molten steel is that there is a serious phenomenon of splashing in the early stage of RH vacuuming, which causes clogs on the inner wall of the vacuum chamber and secondary oxidation of the subsequent molten steel. Some problems caused by splashing seriously restrict production, such as splashing slag steel sticking to the camera hole so that operators cannot see the metallurgical reaction in the vacuum tank; sticking slag steel to the top lance hole hinders the lifting and lowering of the top lance, which makes it difficult to carry out the oxygen blowing operation, and the accumulation of slag steel in the hot bend tube often affects the pumping function and decarburization effect, resulting in frequent replacement of the hot bend pipe [4].
Although a large number of studies on many aspects of RH have been done at home and abroad [5,6,7,8,9,10,11,12,13,14,15,16,17,18,19,20], such as Teruhisa et al. [6] on bubbles, and Chen et al. [10] on decarbonization, there are still few studies on RH splashing. Wu et al. [5] only analyzed the problem theoretically and proposed that changing the pre-pumping mode and controlling the reasonable lifting gas mode can effectively reduce the splashing. Chen et al. [20] established a three-dimensional model to simulate the fluid flow and carbon removal process in RH and determined the carbon removal amount in the process of vacuum pumping, but did not pay attention to the splashing phenomenon in the vacuum chamber. In this study, after clarifying the theoretical factors affecting the splashing, a large number of smoke and splashing were produced in the pre-vacuum process of a 120 ton RH of a special steel in China, which led to serious scaling and slagging in the vacuum chamber. Considering the difficulty of an RH physical experiment caused by the high temperature smelting environment, a three-dimensional mathematical model of the influence of vacuum pressure drop mode on RH vacuum splashing is established. On the basis of reducing the RH molten steel spatter and RH vacuum tank slagging optimization scheme, a new pressure drop model is proposed. This has important guiding significance for the smooth and efficient production of RH.
2. Experimental Procedures and Modeling
2.1. Experimental Procedures
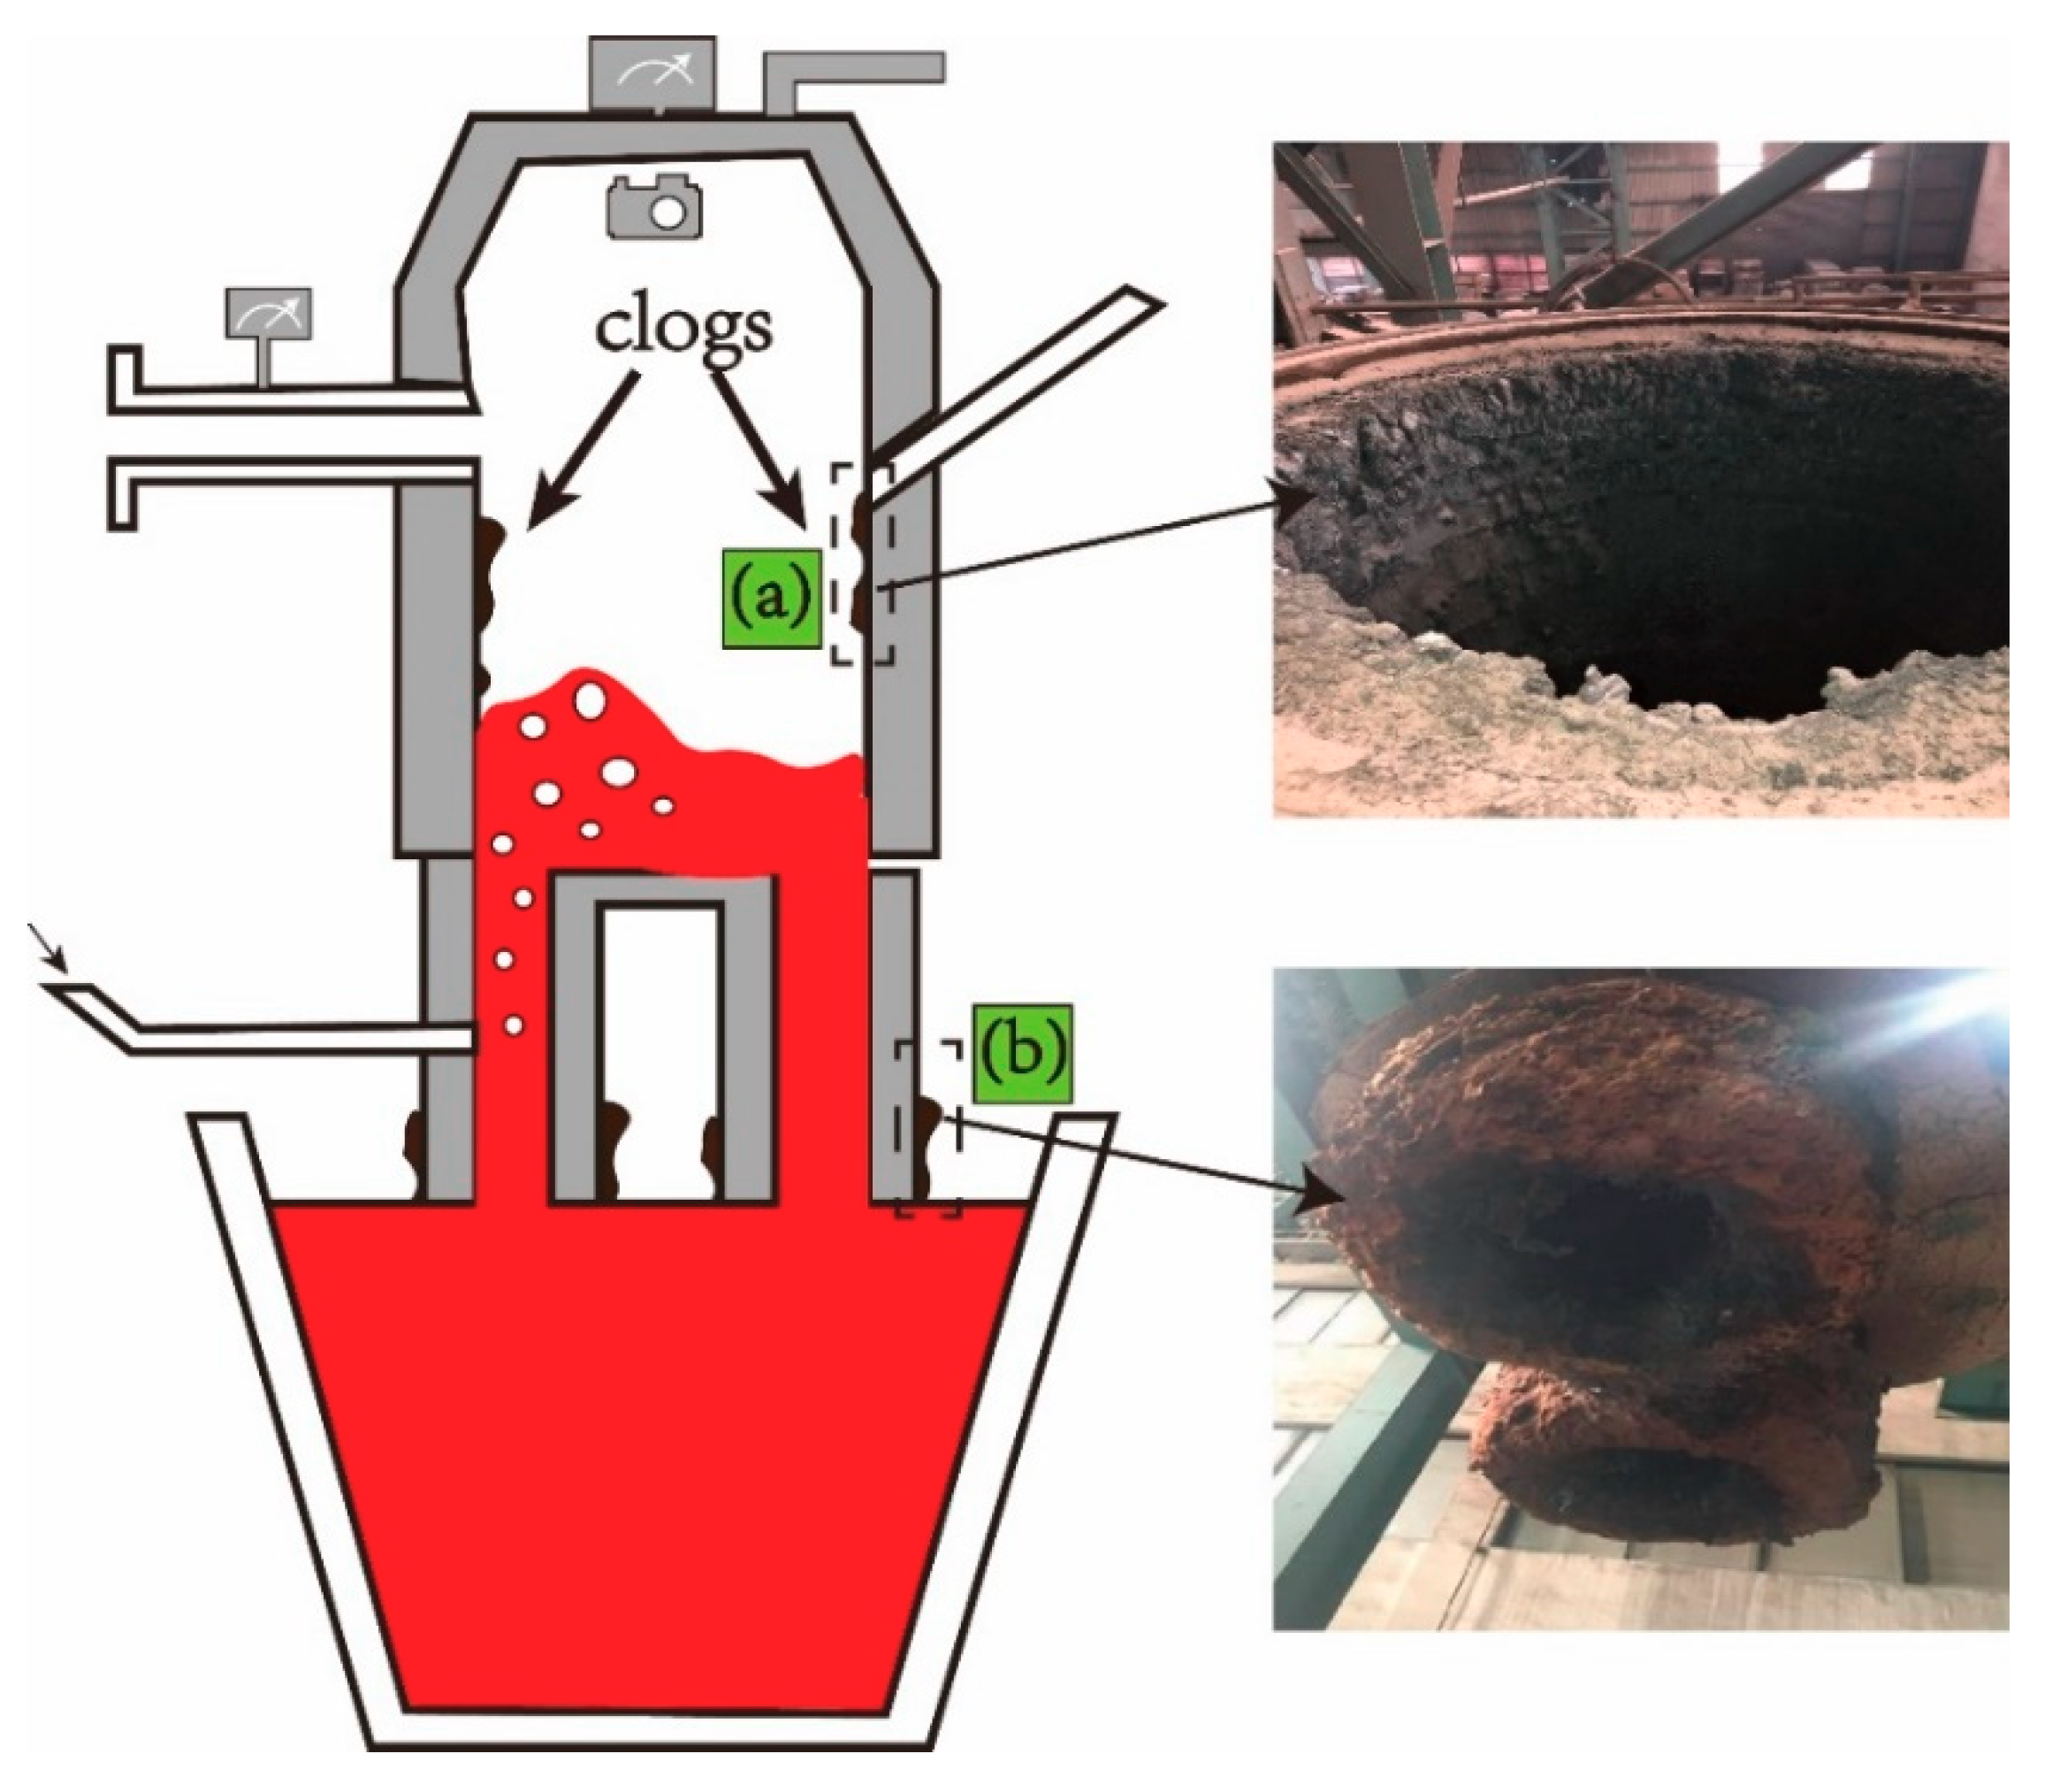
The technological process used in special steel production is EAF → LF → RH → CCM. The clogs and slagging problems in the RH vacuum treatment process have a great impact on the production schedule, as shown in Figure 1. Figure 1a shows that the steel slag clogs on the inner wall of the vacuum chamber caused by splashing during the refining process, and Figure 1b shows the clogs on the outside of the snorkels. For the Al-killed steel, the splashing and slagging during the vacuum process was closely relevant with the vacuum pressure modes and the compositions of the molten steel. The splashing and slagging seriously limited the smooth production of RH and affected the steel cleanness. Surveillance by the camera at the top of the vacuum chamber revealed a lot of smoke and splashing in the first five minutes of RH refining. Through the field test, it was found that adjusting the vacuum pressure drop mode and using different step vacuum modes could improve this phenomenon to different degrees. It can be inferred that since the free oxygen is killed before the RH treatment, the sputtering is mainly caused by the sharp fluctuation of the liquid level in the vacuum process rather than the gas reactive sputtering. In order to determine the specific influence of vacuum pressure drop mode on splashing, industrial experiments and numerical simulation were carried out. The splashing and clogging degrees of the RH vacuum chamber in the industrial scene are monitored by the camera at the top of the vacuum chamber. The simulation of the influence of different pressure drop modes on droplet splashing in the RH vacuum chamber is described in this paper. The composition of experimental steel is shown in Table 1, and the main technical parameters of the experimental furnace RH are shown in Table 2.
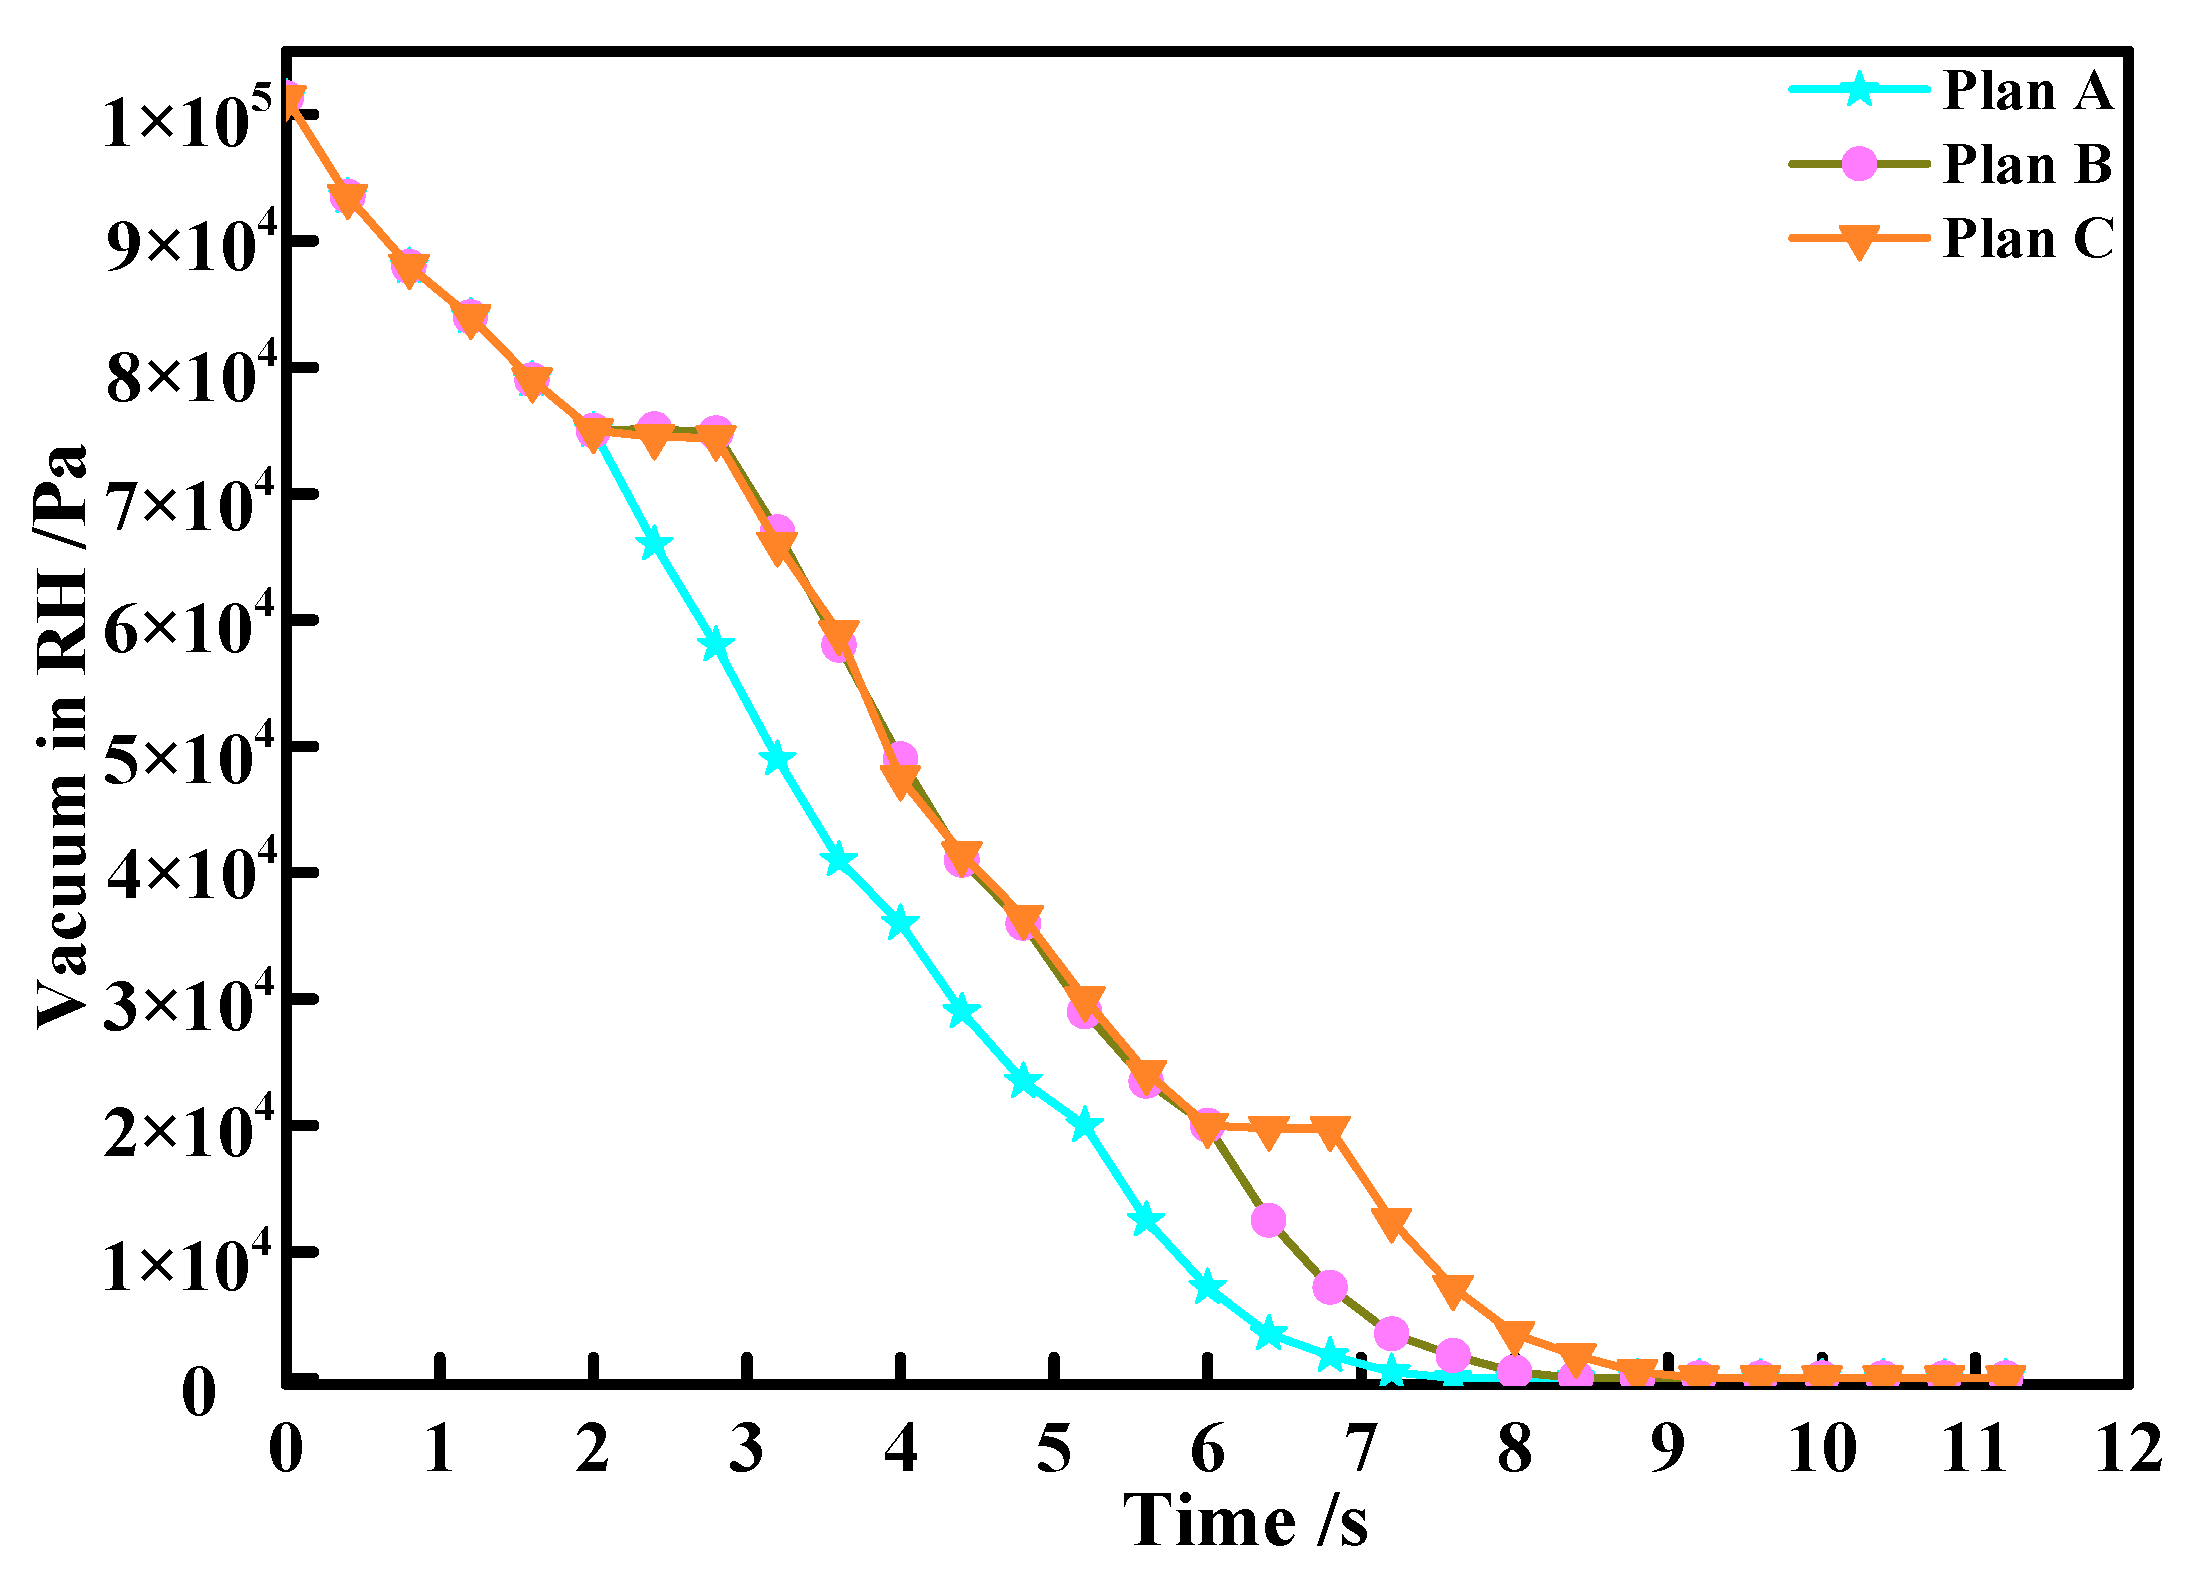
Wu et al. [21] reported that the liquid level fluctuated relatively violently in the early stage of lowering the vacuum chamber. When the liquid level in the vacuum chamber was low, a large number of bubbles quickly reached the surface, resulting in less liquid steel in the vacuum chamber rolling violently. Some bubbles were not discharged in time, and they entered the down-snorkel with the flow of steel, and a small amount of liquid steel was easily splashed. With the increase of the liquid steel in the vacuum chamber, the splashing phenomenon of molten steel was weakened because the floatation resistance of argon bubbles increased. Thus, it is very important to control the fluctuation of the liquid steel in the early stage. This paper studies the influence of different pressure reduction modes on the splashing by numerical simulation. Table 3 listed the different pressure drop modes at present cases. In the industrial field, the RH pressure drop is controlled by a four-stage pump. After each stage of the pump being turned on, the next stage of pump is turned on immediately after reaching the ultimate pressure of the pump. We controlled the vacuum pressure drop rate by adjusting the time interval between turning on the two pumps. Figure 2 describes the different pressure drop modes.
2.2. Mathematical Modeling
In this paper, the volume of fluid + discrete phase model coupling model was adopted for the simulation of the droplet splashing. The VOF model was used to describe the free surface fluctuation at the liquid steel interface, and argon was treated as the gas phase in the vacuum chamber and the DPM gas particle inflow at the air hole.
2.2.1. Geometric Dimension and Grid Division
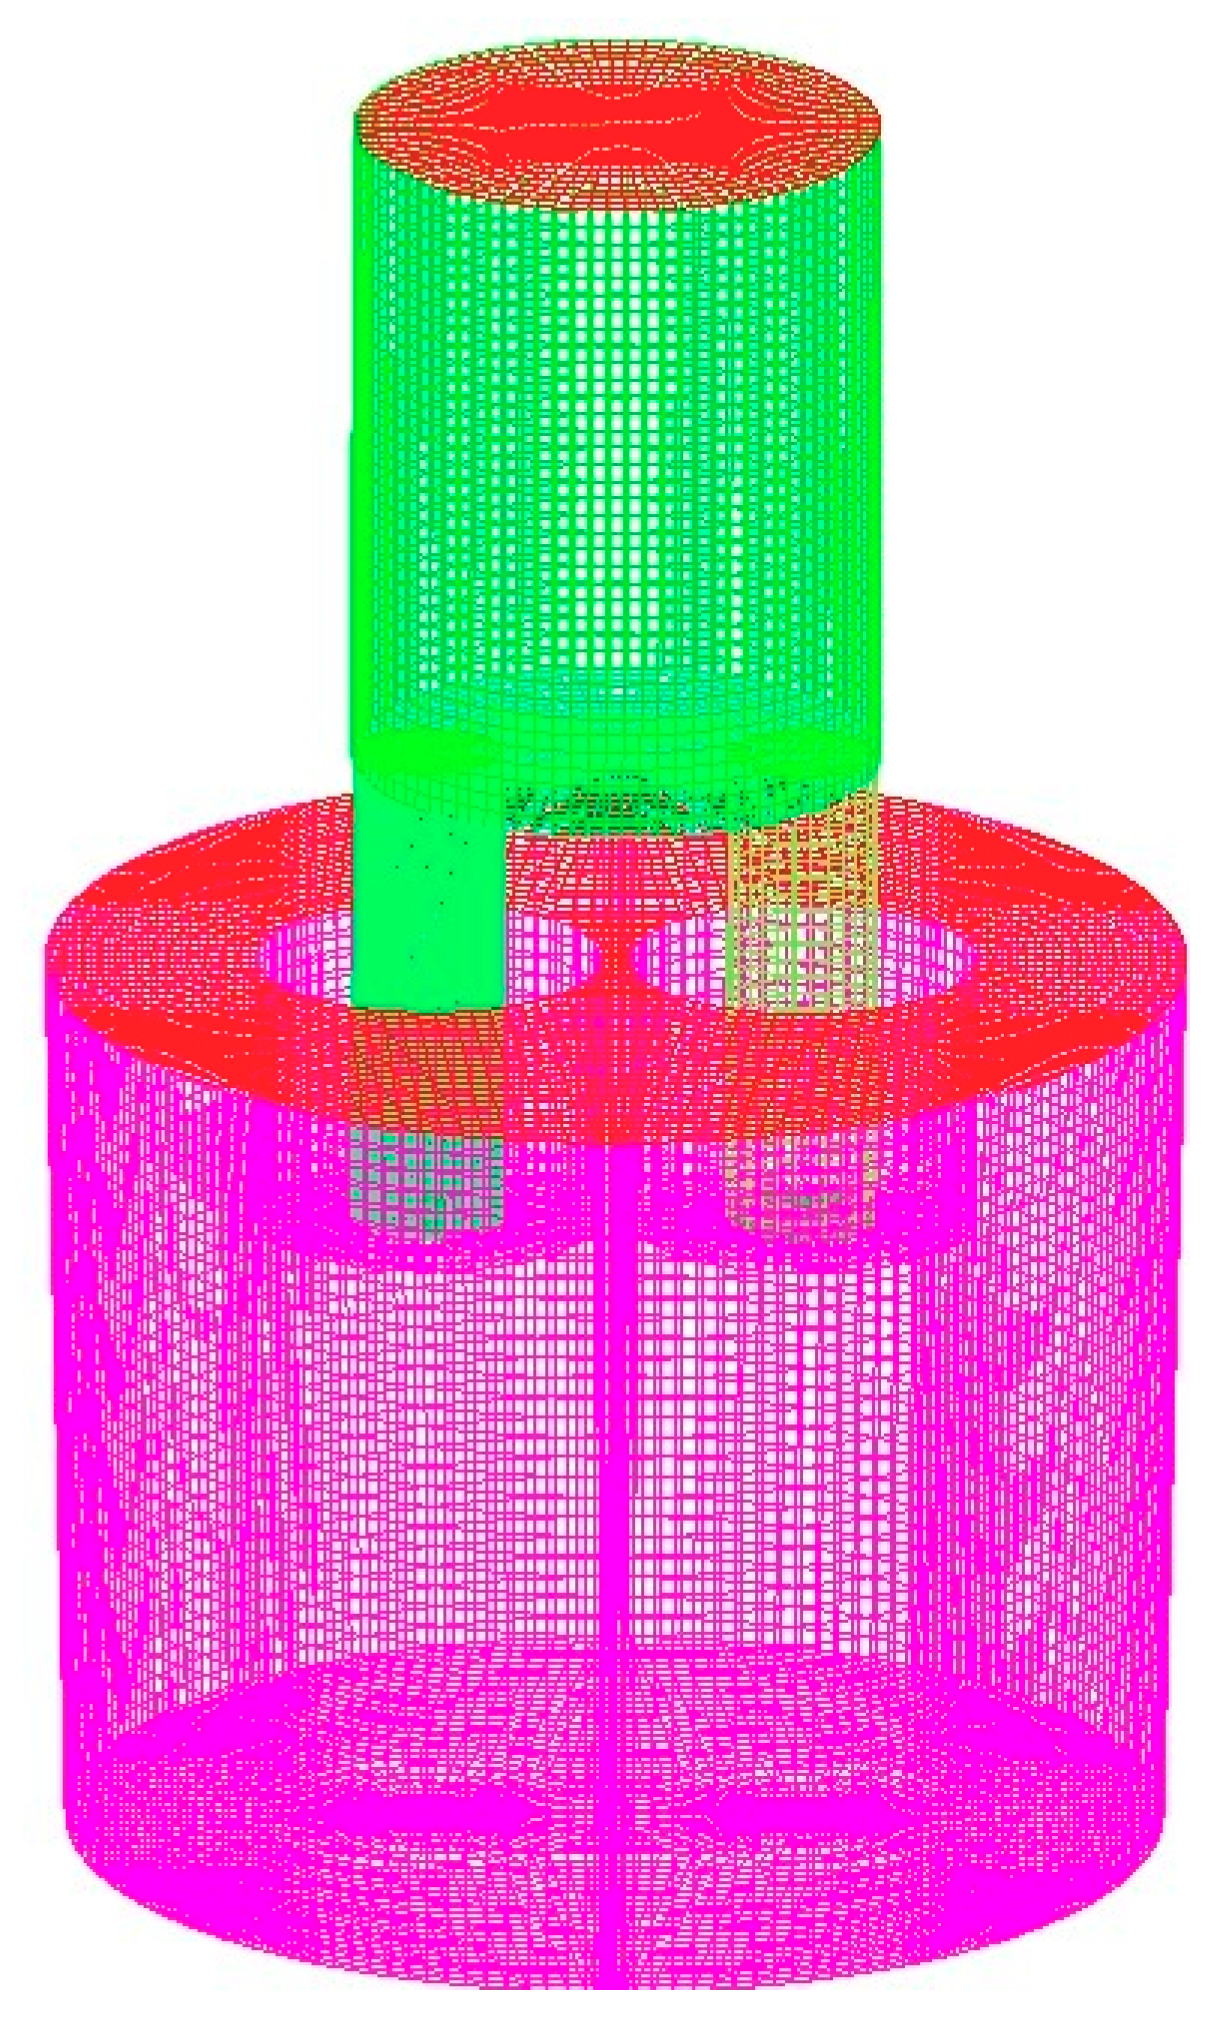
The Integrated Computer Engineering and Manufacturing (ICEM) software was utilized to build the three-dimension geometric model, and the hexahedral meshing of structuration was implemented in the whole computational domain, as shown in Figure 3. Through the inspection, the mesh was well shaped, and the number of meshes was 1,281,873. Based on the finite element volume method in ANSYS18.0 commercial software Fluent developed by ANSYS Company of USA, a coupling model considering multiphase flow and discrete phase was established. The simulation calculation parameters and the thermal property parameters l of RH simulation are presented in Table 4.
2.2.2. Basic Assumptions
To simplify the model, some assumptions were made as follows:
(1) The liquid steel in the vacuum chamber is a free liquid surface, and there is no slippage on each wall;
(2) The density and viscosity of the continuous argon in the top of the vacuum chamber are treated as the same as that of the air in the top of the ladle, and both are called top gas;
(3) It is assumed that the surface of molten steel is a plane, and the influence of slag on the surface of molten steel is not considered;
(4) The surface of the liquid is smooth, and the bubble size is uniform;
(5) The molten steel and the top gas are incompressible Newtonian fluids;
(6) It is assumed that the argon bubbles are spherical, and the aggregation and fragmentation of bubbles and their interaction are ignored.
2.2.3. Governing Equations
The continuous phase (molten steel, slag, and top gas phase) were treated by the VOF model, and the discrete phase (argon phase) was treated by DPM.
(1) VOF model:
As an interface tracking technology, the VOF model can simulate two or more immiscible fluids [22,23] and track the interface by solving the volume fraction equation of continuous phase in the Euler framework as follows:
where αi is the volume fraction of the top gas phase (i = t, RH prototype and model both represent the top gas phase), liquid phase (i = l, RH prototype represents liquid steel, model represents water), and slag phase (i = s); ρi is phase density, kg/m3; is average velocity of mixed phase, m/s.
In the VOF model, three continuous phases share a velocity field. The volume fraction equation of the main phase (liquid steel phase) is not directly solved but is calculated by the following constraints: αt + αl + αs = 1.
In the VOF model, all continuous phases share a set of momentum conservation equations:
where is the volume average density of mixed phase with unit of kg/m3; μm is volume average dynamic viscosity of mixed phase; Fm is momentum exchange between discrete and continuous phases, N/m3; σ is interfacial tension term, N/m3.
The interface tension term is calculated by the continuous surface force (CSF) model proposed by Buckbill et al. [24].
where σij is the interfacial tension between two phases, N/m. The interface curvature ki is calculated by the following formula:
(2) DPM model
Argon bubbles in molten steel are treated as discrete phases by the DPM model. By integrating the forces on the bubbles in the Lagrangian framework, the trajectory of each bubble can be traced.
where is the velocity of a single argon bubble (m/s), is the drag force on a single bubble (m/s).
Drag force: In the DPM model, only the discrete phase in the main phase (liquid steel phase) is tracked, but not the discrete phase in other continuous phases (top gas phase and slag phase). Therefore, the drag force of each bubble in the molten steel is described as follows:
where dg is the diameter of the bubble (m); CD,lg are drag coefficients between gas and liquid. It can be calculated by Schiller and Naumann [25] as follows:
where is the bubble Reynolds number.
Momentum transfer:
where t is the time step used in the simulation (s), is the number of argon bubbles in each grid cell, and is the argon flow rate (m3/s).
(3) Turbulence model
Turbulent kinetic energy equation:
where is the turbulence constant; is as follows:
Turbulent kinetic energy dissipation equation:
The constant values in the above turbulence model are, respectively, , , , , .
2.2.4. Boundary Conditions
Pressure inlet: the boundary condition of pressure inlet is adopted for the liquid level of RH ladle, and the discrete phase gas can escape from the boundary condition. At the same time, the boundary condition allows for the free fluctuation and movement of the steel surface.
Wall: the inner wall of all refractory materials is set as the wall without sliding, and the three components of velocity on the wall are zero. At the same time, in view of the fact that the k-ε turbulence model cannot be applied to the low Reynolds number near the wall, the standard wall function is used to deal with the flow near the wall. On the wall, the discrete phase gas is set to reflect.
Pressure outlet: the pressure outlet boundary condition is adopted at the top of the vacuum chamber, which allows the free fluctuation and movement of the steel liquid surface, and the discrete phase gas can escape from the boundary condition.
Surface blowing: the boundary condition of surface blowing is adopted at the nozzle to guide the discrete phase bubbles into the molten steel.
3. Results and Discussion
3.1. Model Validation
In order to verify the accuracy of the model, based on the similarity principle, the flow state of water at 20 °C was used to simulate the flow state of molten steel in actual production. Because it is difficult to measure the local velocity of molten steel flow in RH in the actual production process, the accuracy of simulation is verified according to the measurement results of the water model from Ling et al. [26].
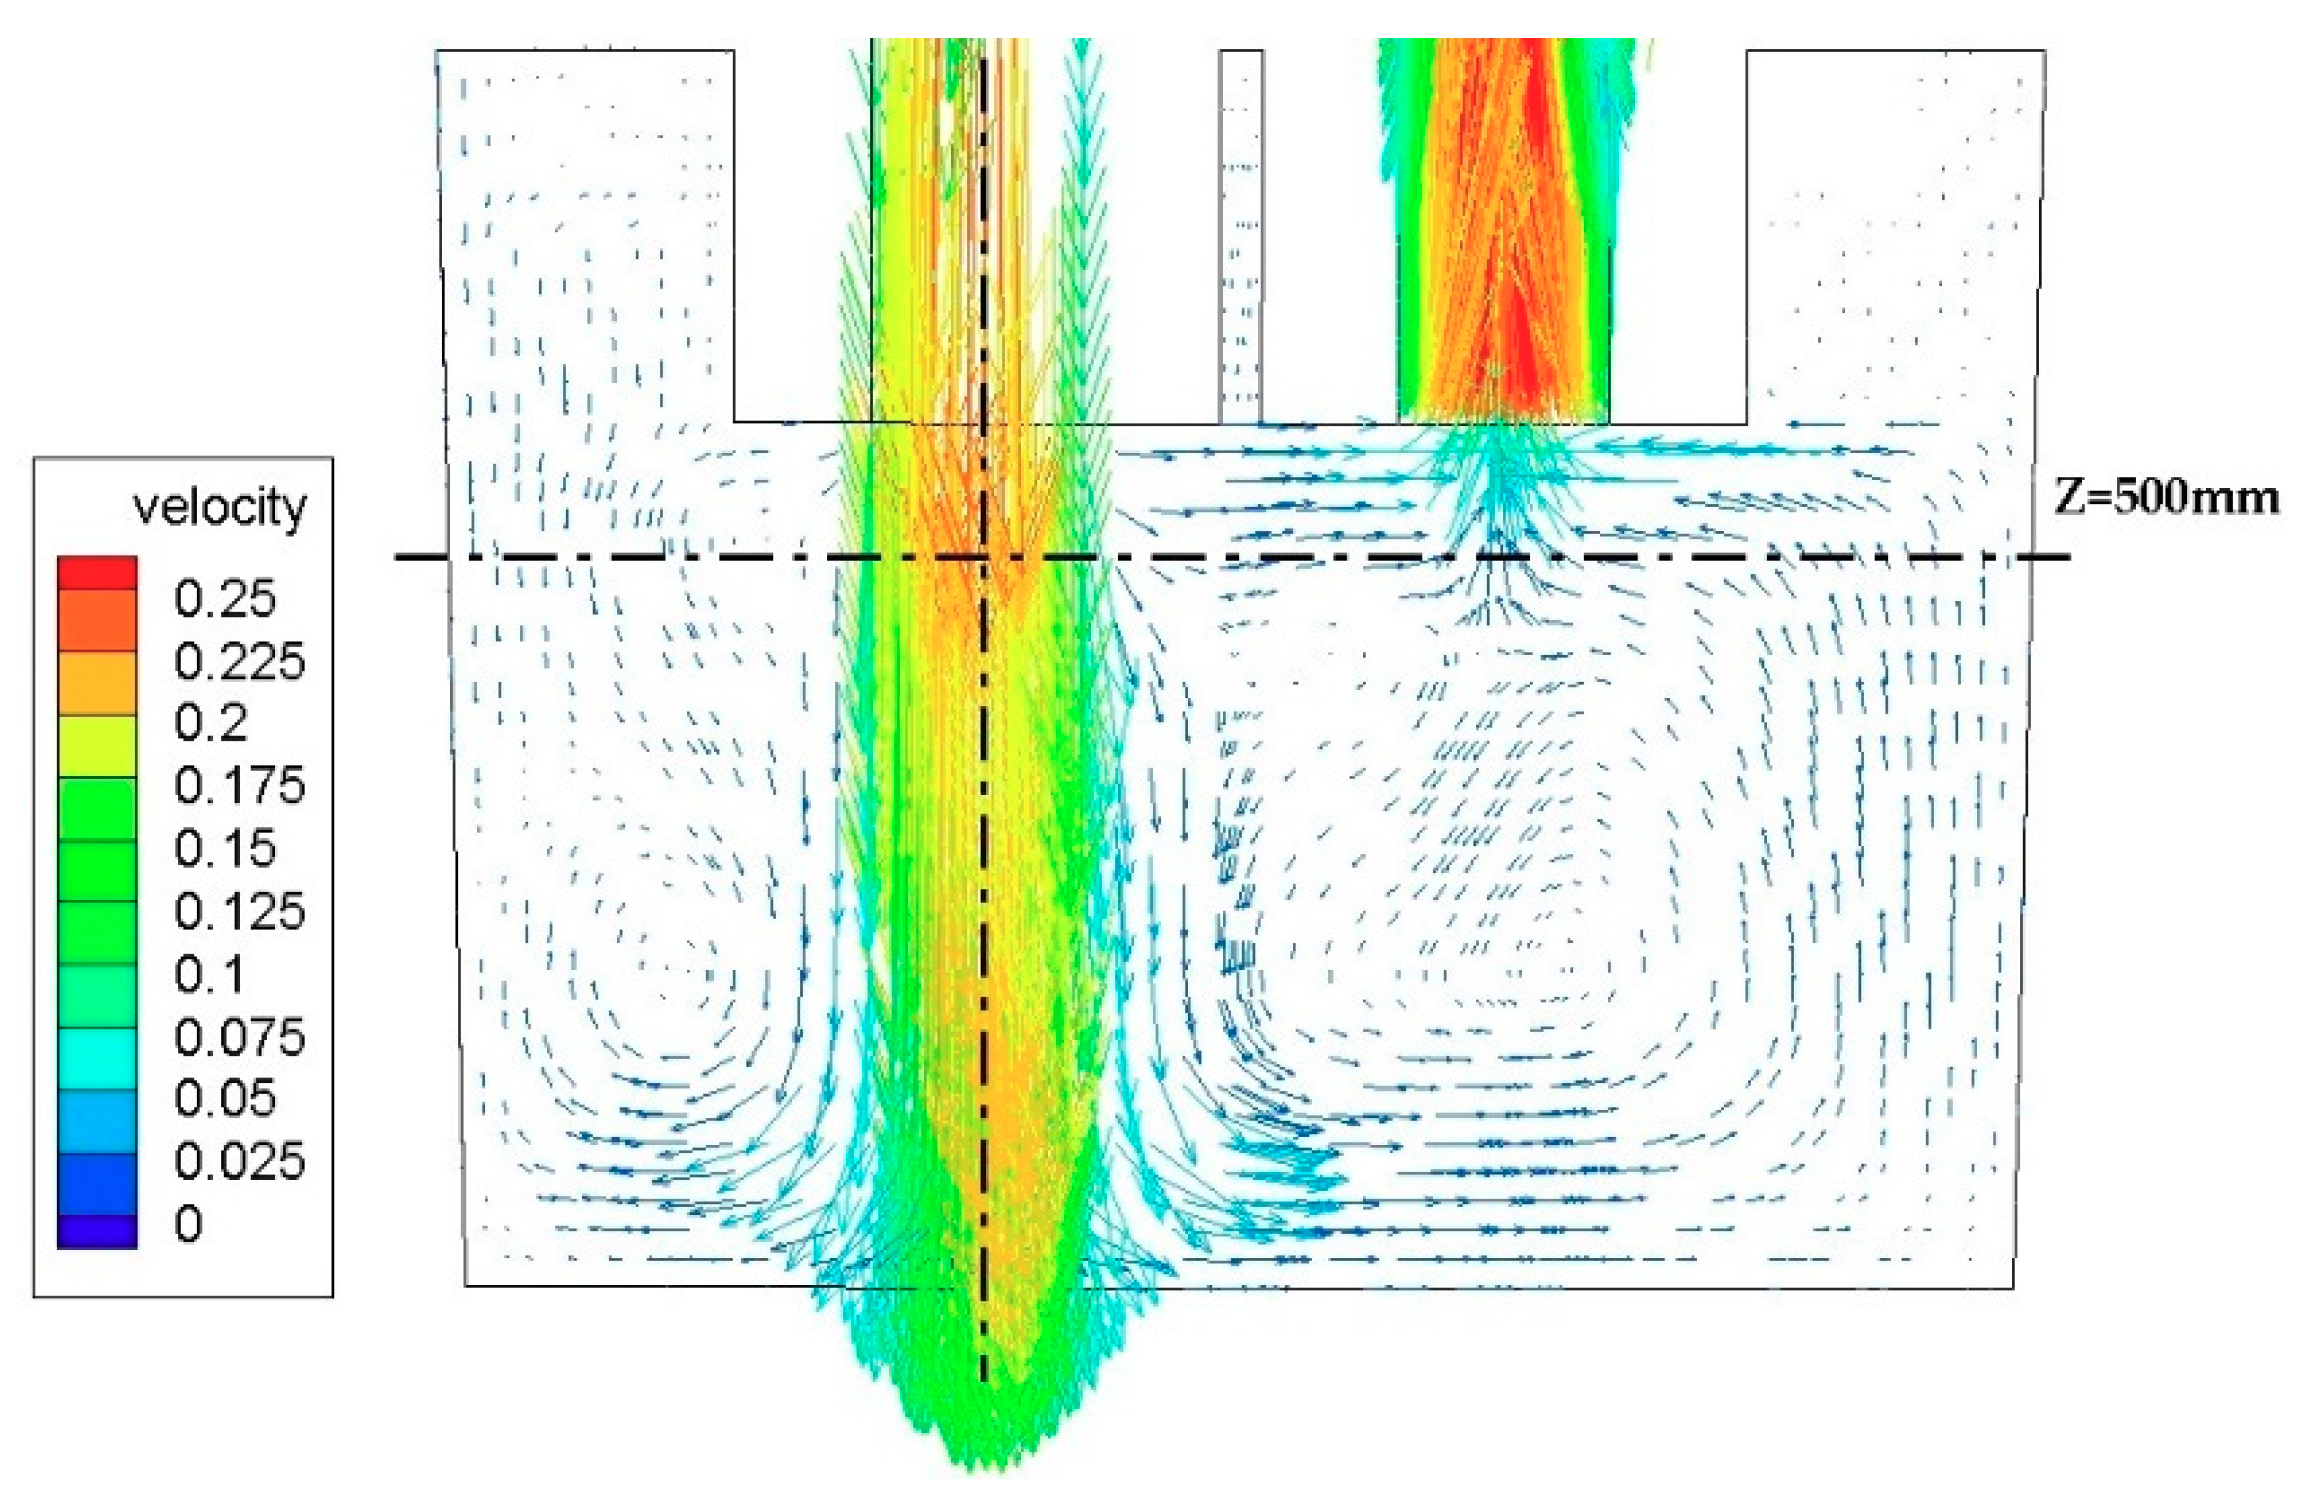
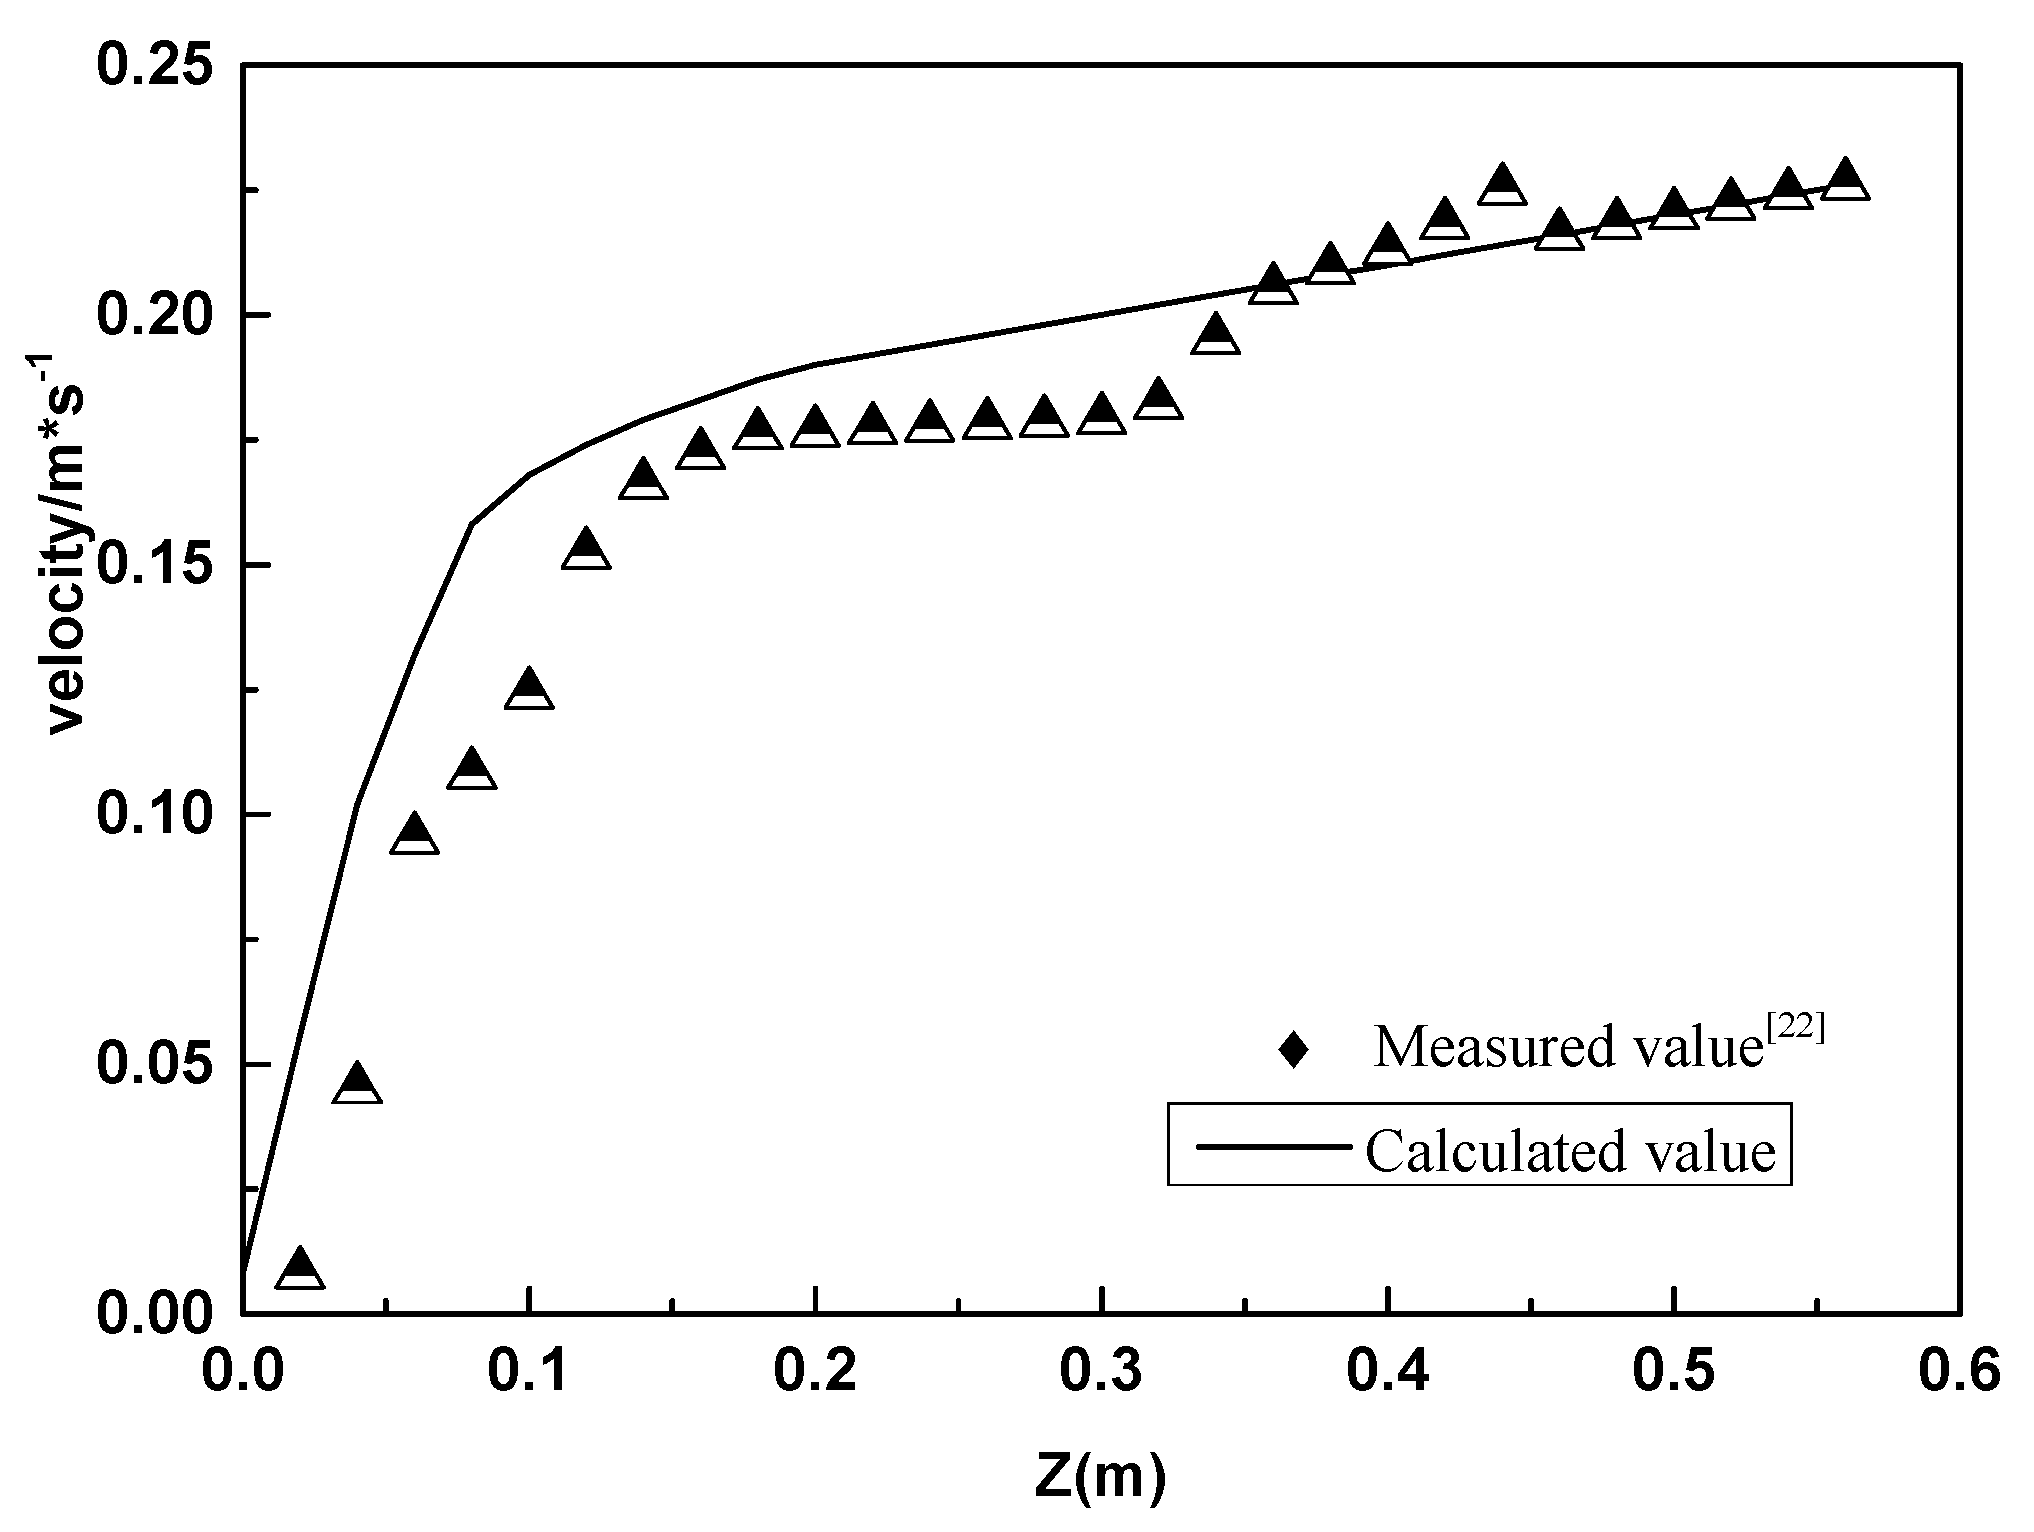
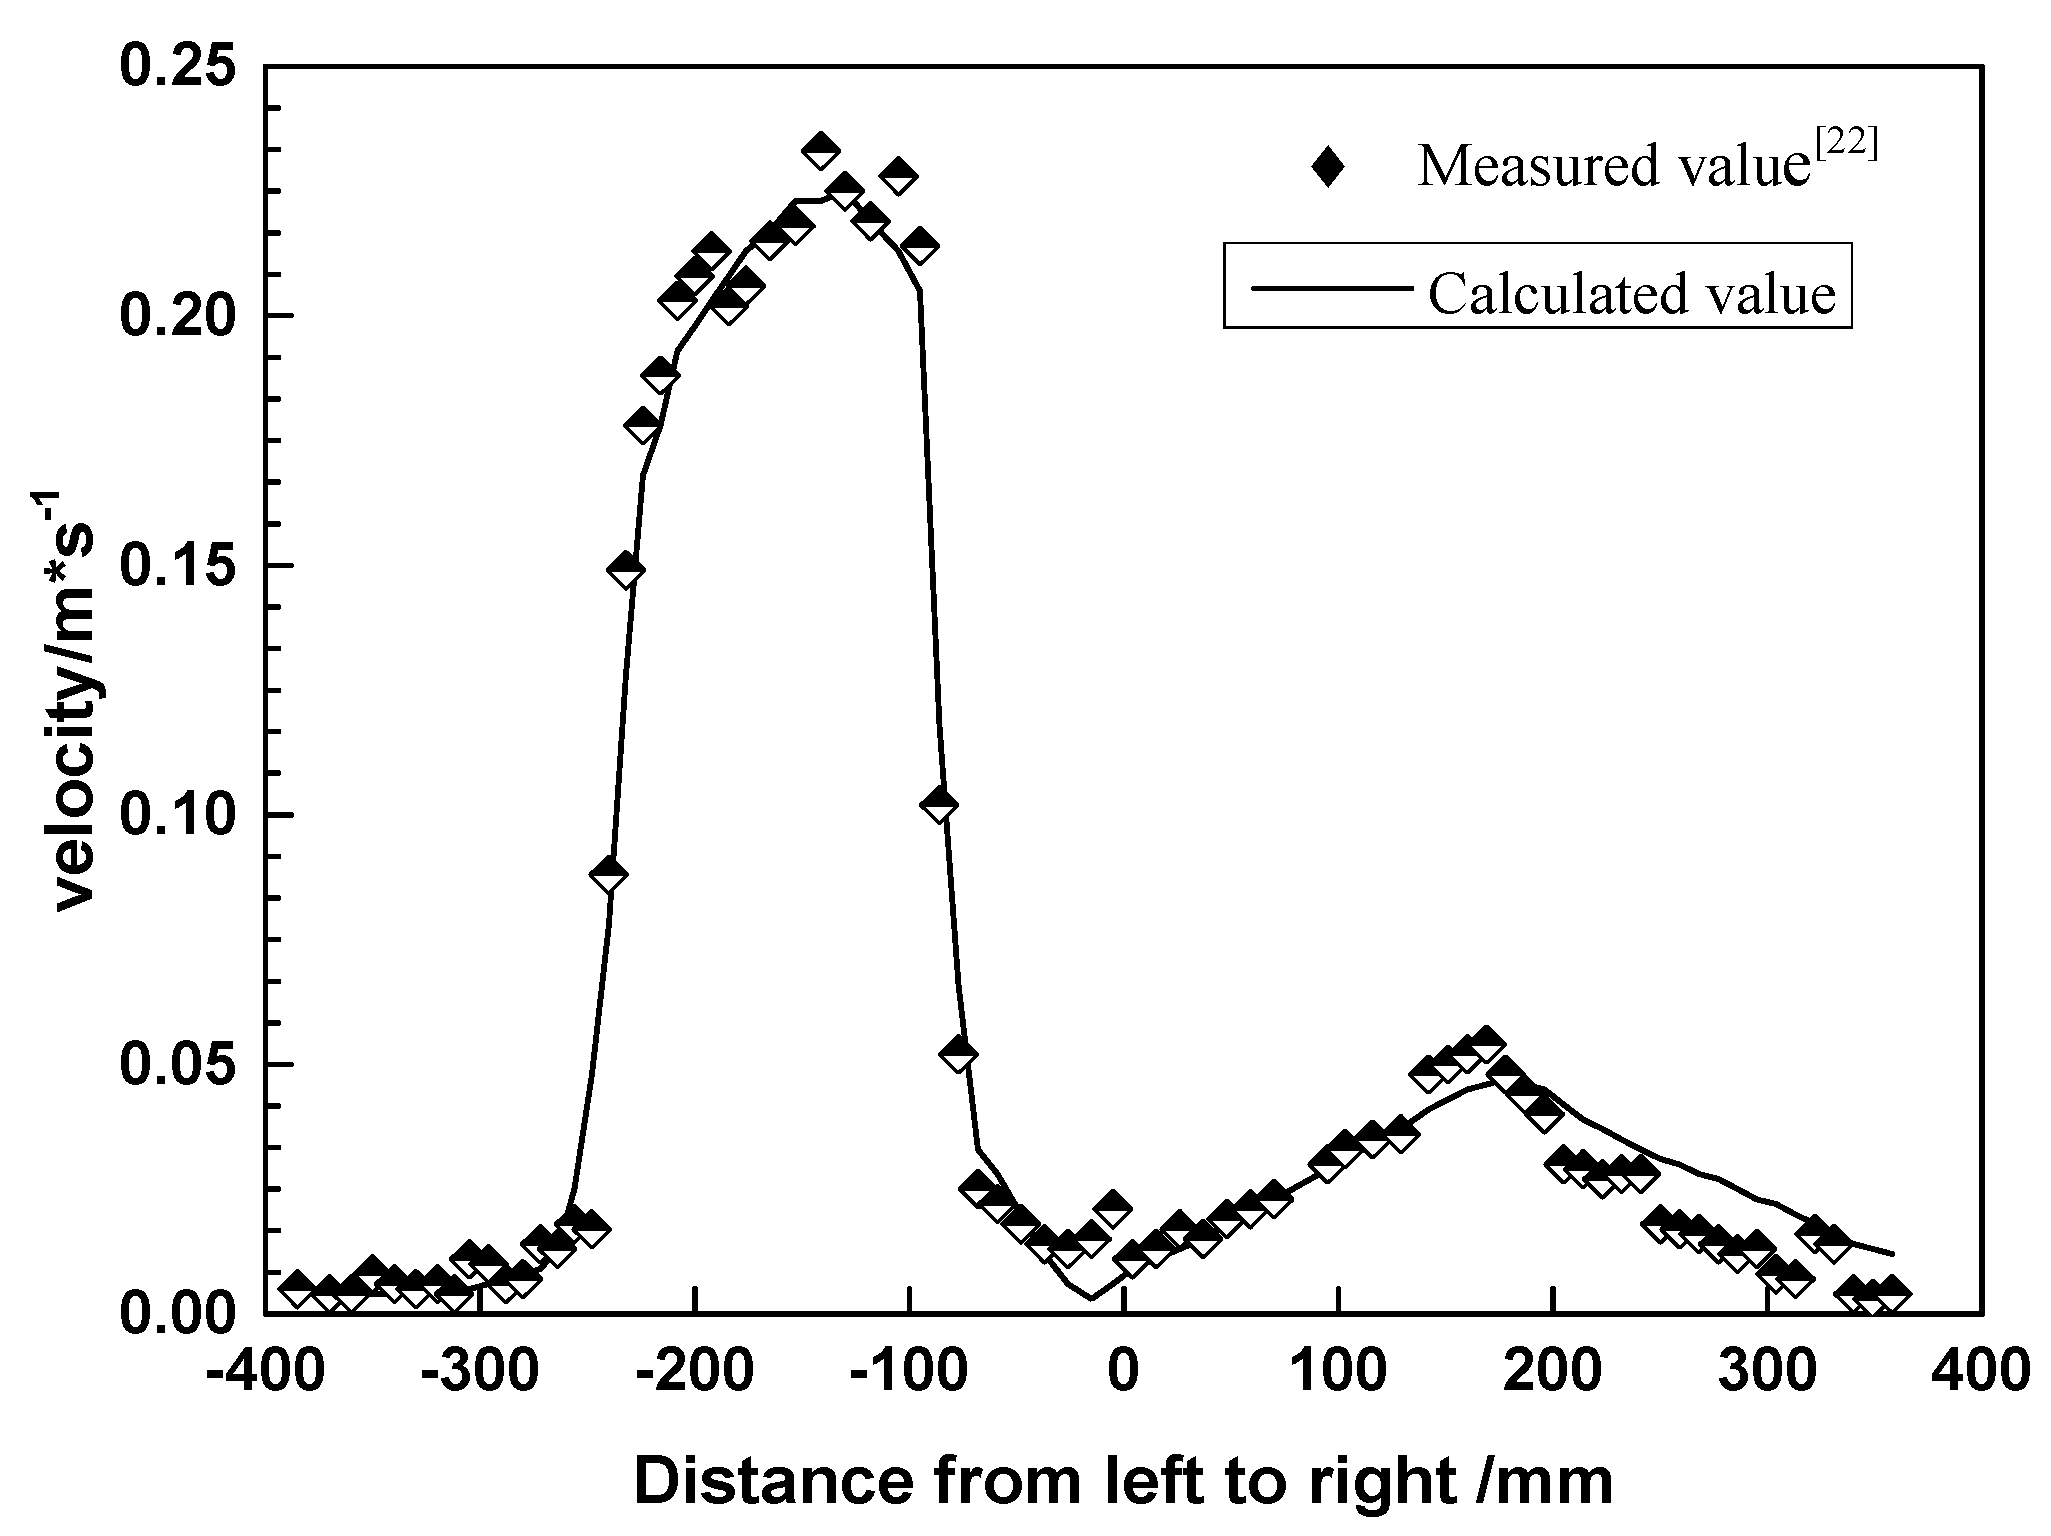
Ling et al. [26] established a physical model with a similarity ratio of 1:5 based on the 210 ton RH reactor and measured the flow field of water in the model with PIV (particle image velocimetry). Figure 4 shows the calculation results on the symmetrical plane. After the fluid flows out of the down-snorkel and hits the bottom of the ladle, it flows in all directions along the bottom of the ladle, and then up along the right ladle wall. Most of the fluid flows up into the up-snorkel, and some of the fluid deflects to the left. It can be seen from the figure that after the water flow entering into the ladle from the down-snorkel, it impacts the bottom of the ladle at a high velocity, and then a huge turning area around the down-snorkel in the ladle is formed, as referred to previously [27,28]. Figure 5 shows the velocity distribution on the center line of the down-snorkel. The initial velocity of the water flowing out of the down-snorkel is about 0.22 m/s, and then it gradually decreases, approaching 0 when it reaches the bottom of the ladle. Figure 6 shows the velocity distribution along the radial line at a height of 500 mm from the bottom of the ladle, and the two wave peaks show the high-speed flow inside the immersion tube. In general, the simulated flow pattern and local velocity agree well with the measurement of the water model.
3.2. Flow Characteristics of Molten Steel in RH Vacuum Reactor
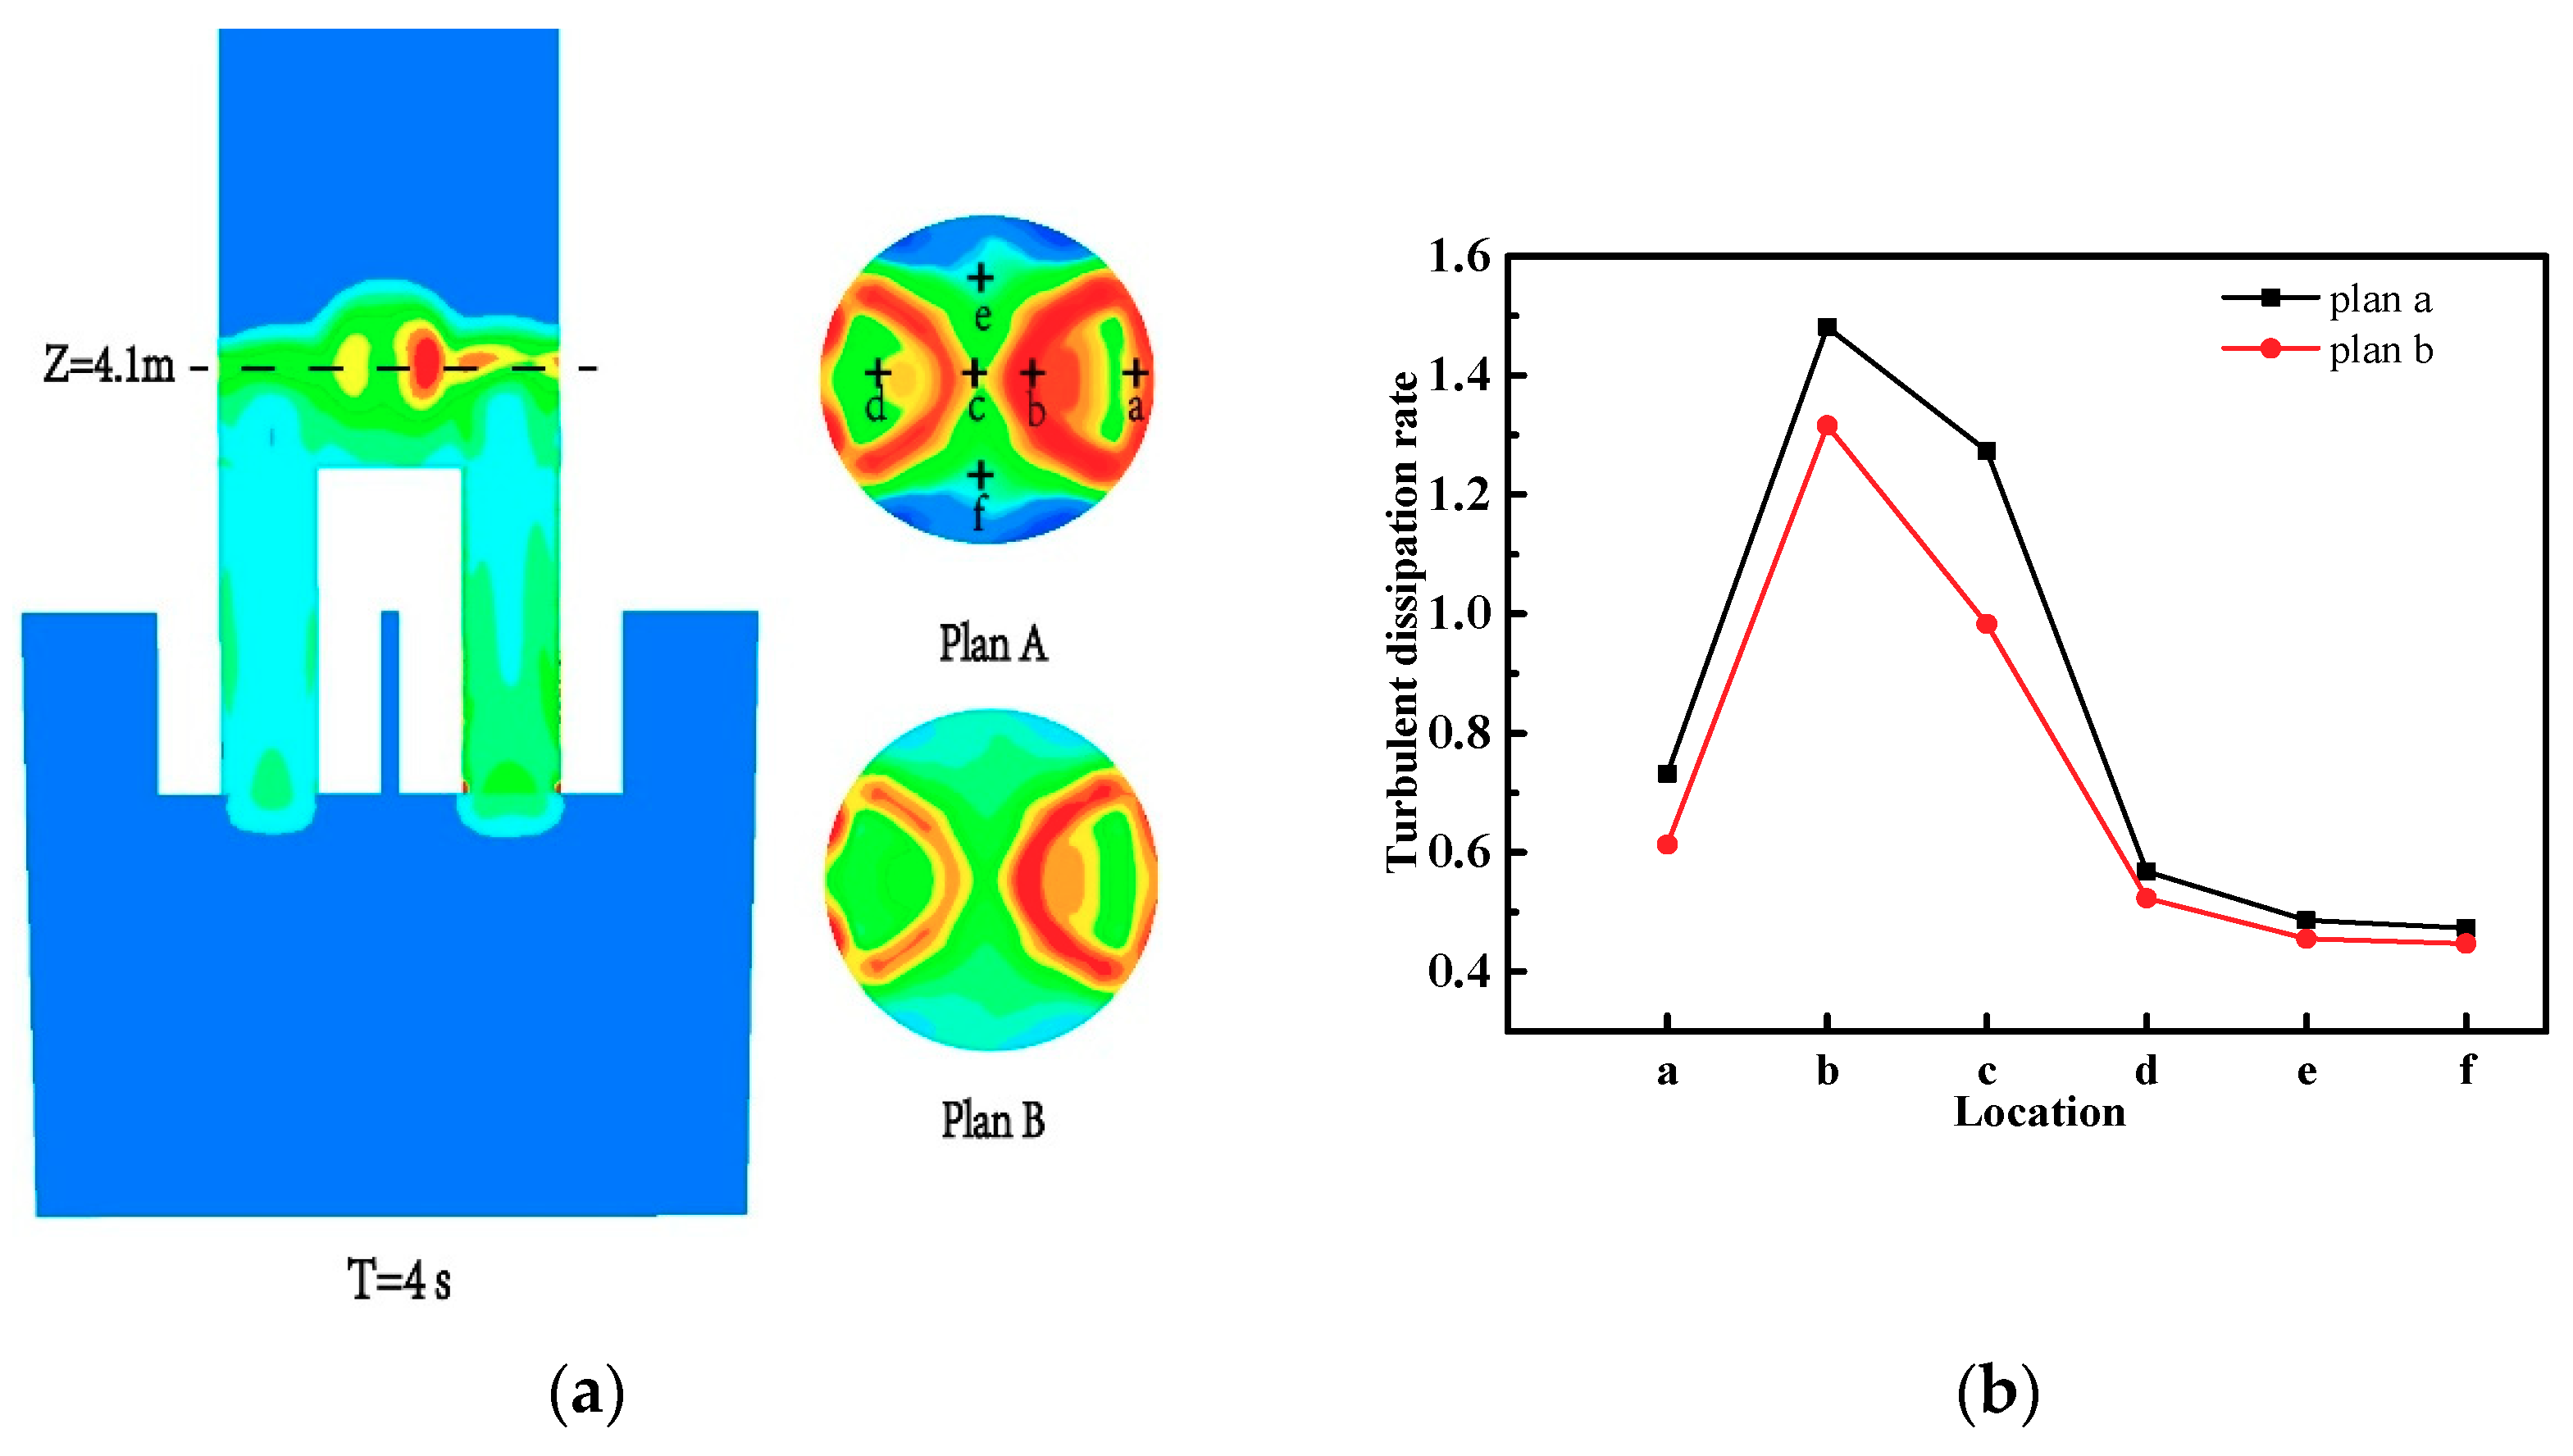
For the flow of fluid, the turbulent energy dissipation rate can be used to characterize the violent situation of fluid fluctuation. The turbulent energy dissipation rate indicates the loss speed of turbulent flow capacity [29]. The larger its value is, the greater the loss velocity of fluid is, and the greater the fluctuation degree of the liquid level is. On the cross section of the free liquid level z = 4.1 m of the vacuum chamber, six points were selected at different positions at a certain time for statistics, and the schematic diagram is shown in Figure 7a. It shows that the areas with high turbulent energy dissipation rate were mainly concentrated in the vacuum chamber, and the situations at different positions in the vacuum chamber were also different. The statistics of different positions under different working conditions are shown in Figure 7b. It is concluded that the turbulent energy dissipation rate can be reduced by adjusting the pressure drop mode, which presents a certain impact on the liquid level fluctuation.
3.3. Splashing under Different Pressure Modes
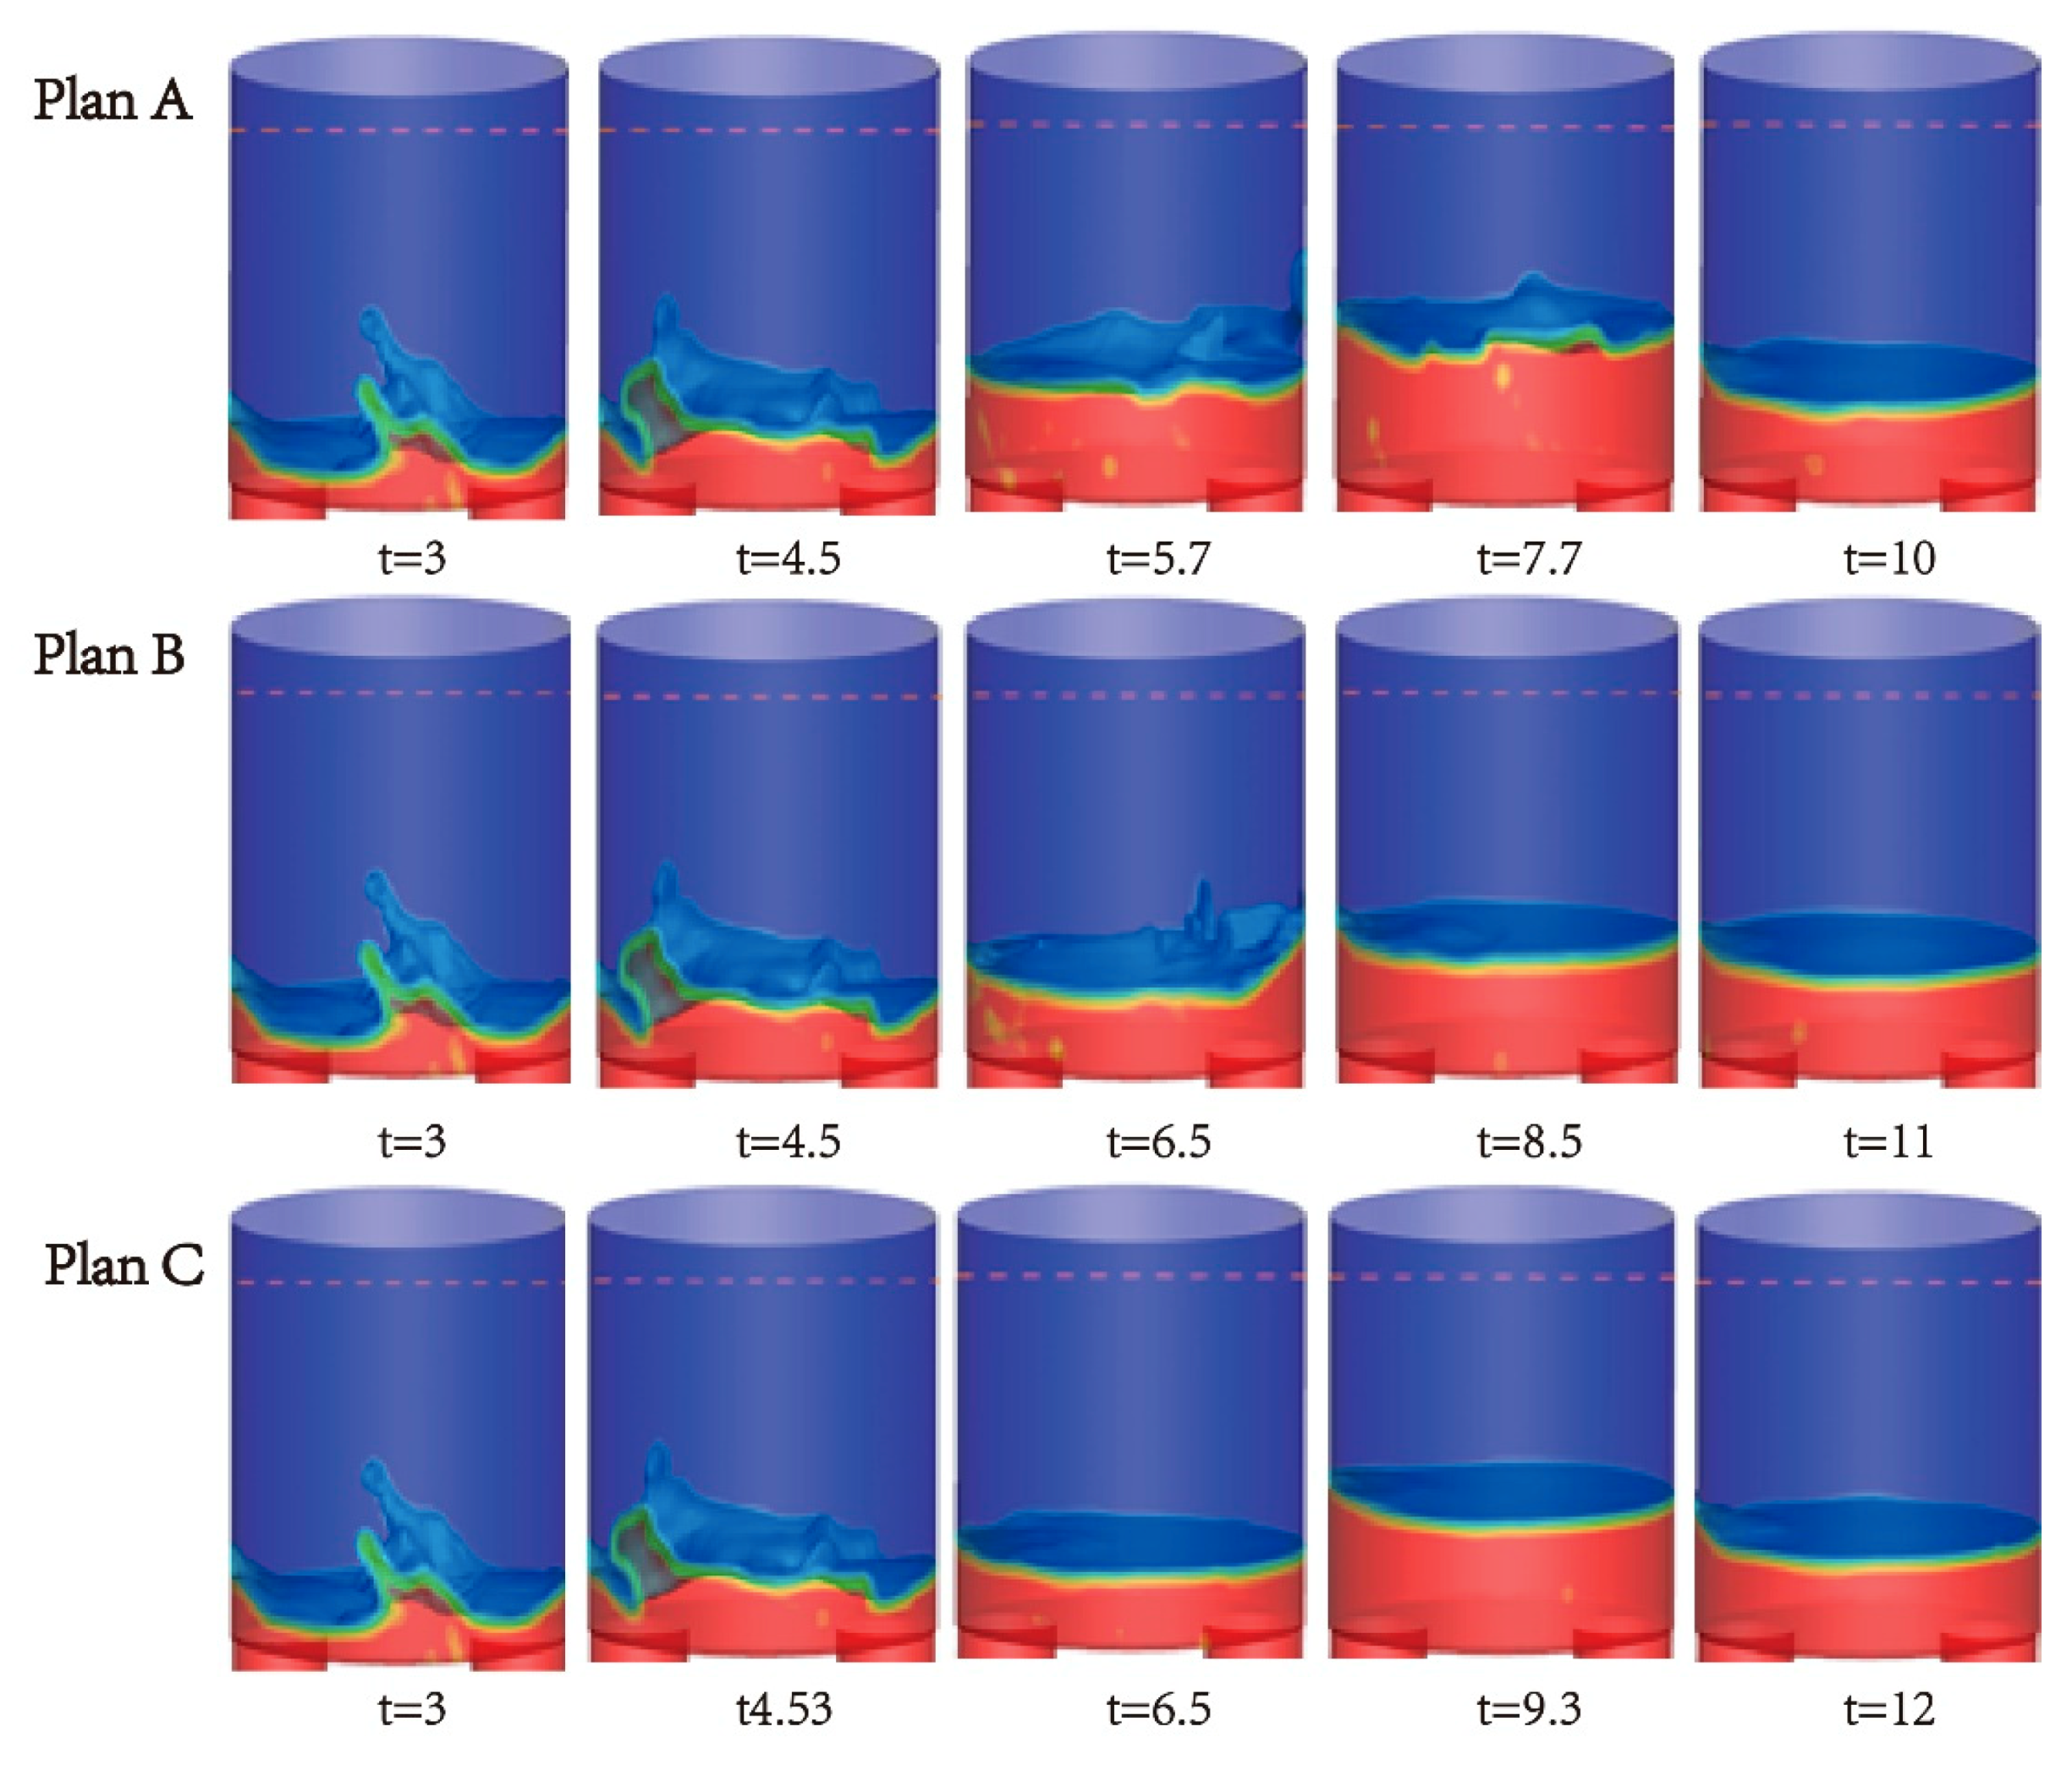
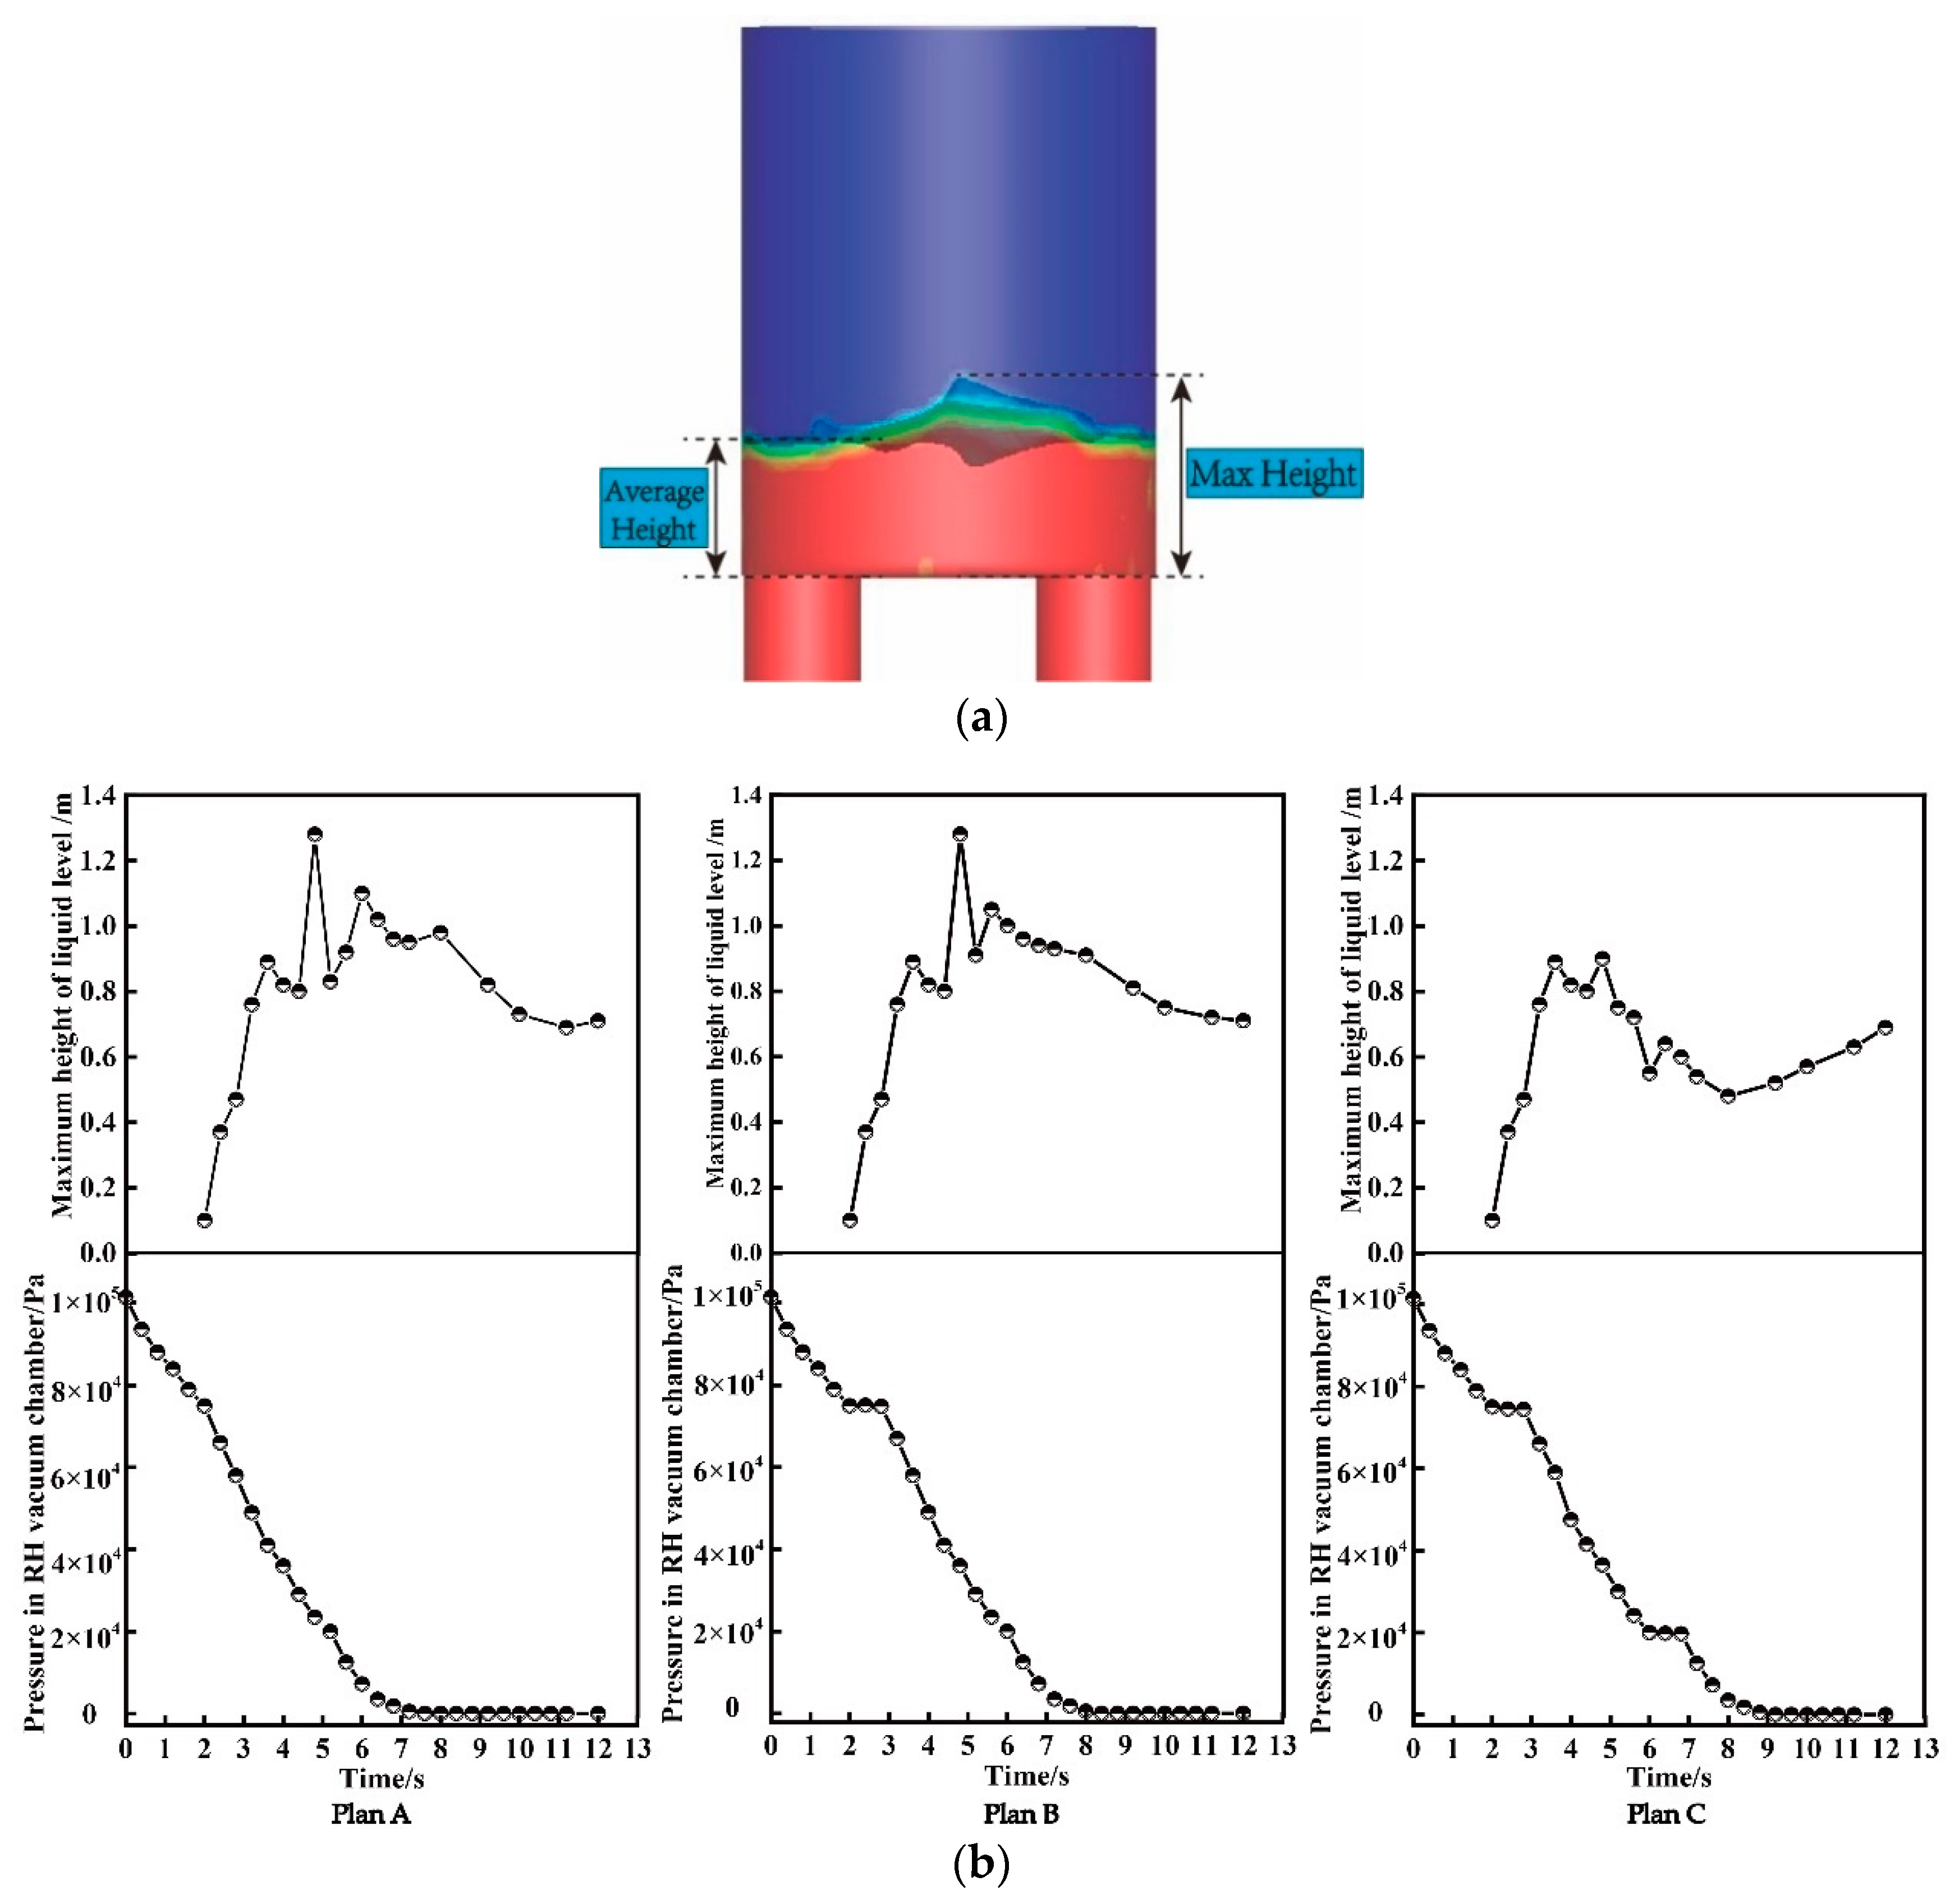
The whole process of liquid steel flow was monitored during the calculation process. According to the buoyancy formula P = ρ·g·H, the height of liquid steel in the vacuum chamber under different vacuum degrees was calculated, so as to judge the pressure in the vacuum chamber at different times and determine the opening time of different stages of the vacuum pump. The splashes in the vacuum chamber of 0.5 s after each opening of different stages of vacuum pump were counted, and the splashing situation under different pressure drop modes is shown in Figure 8. At the same time, the height of the highest point of liquid steel splashing in the vacuum chamber was measured, and the height of the highest point is shown in Figure 9a. The fluctuation of liquid level is shown in Figure 9b.
It can be seen from Figure 8 that the liquid level fluctuated the most during a period of time after the liquid phase of the up-snorkel and the down-snorkel entered the vacuum chamber in the early stage of vacuuming, but the fluctuations of the liquid level were different for different pressure drop modes. Compared with the Plan A, the time to reach the ultimate vacuum was relatively longer in Plan B and Plan C, but the fluctuation of the liquid level was more stable, so adjusting the pressure after the liquid level is stable will help reduce the occurrence of splashing.
It can be seen from Figure 9 that the one-step vacuuming mode (Plan A) took the shortest time to reach the final stable state of the liquid level, but the liquid level fluctuations in the early stage were also the most severe; the liquid level fluctuations in Plan C were relatively stable, but the final stable liquid level was obtained It took longer. In general, regardless of the length of time, the step-by-step vacuuming mode is more conducive to stable liquid level fluctuations and can reduce the occurrence of splashing.
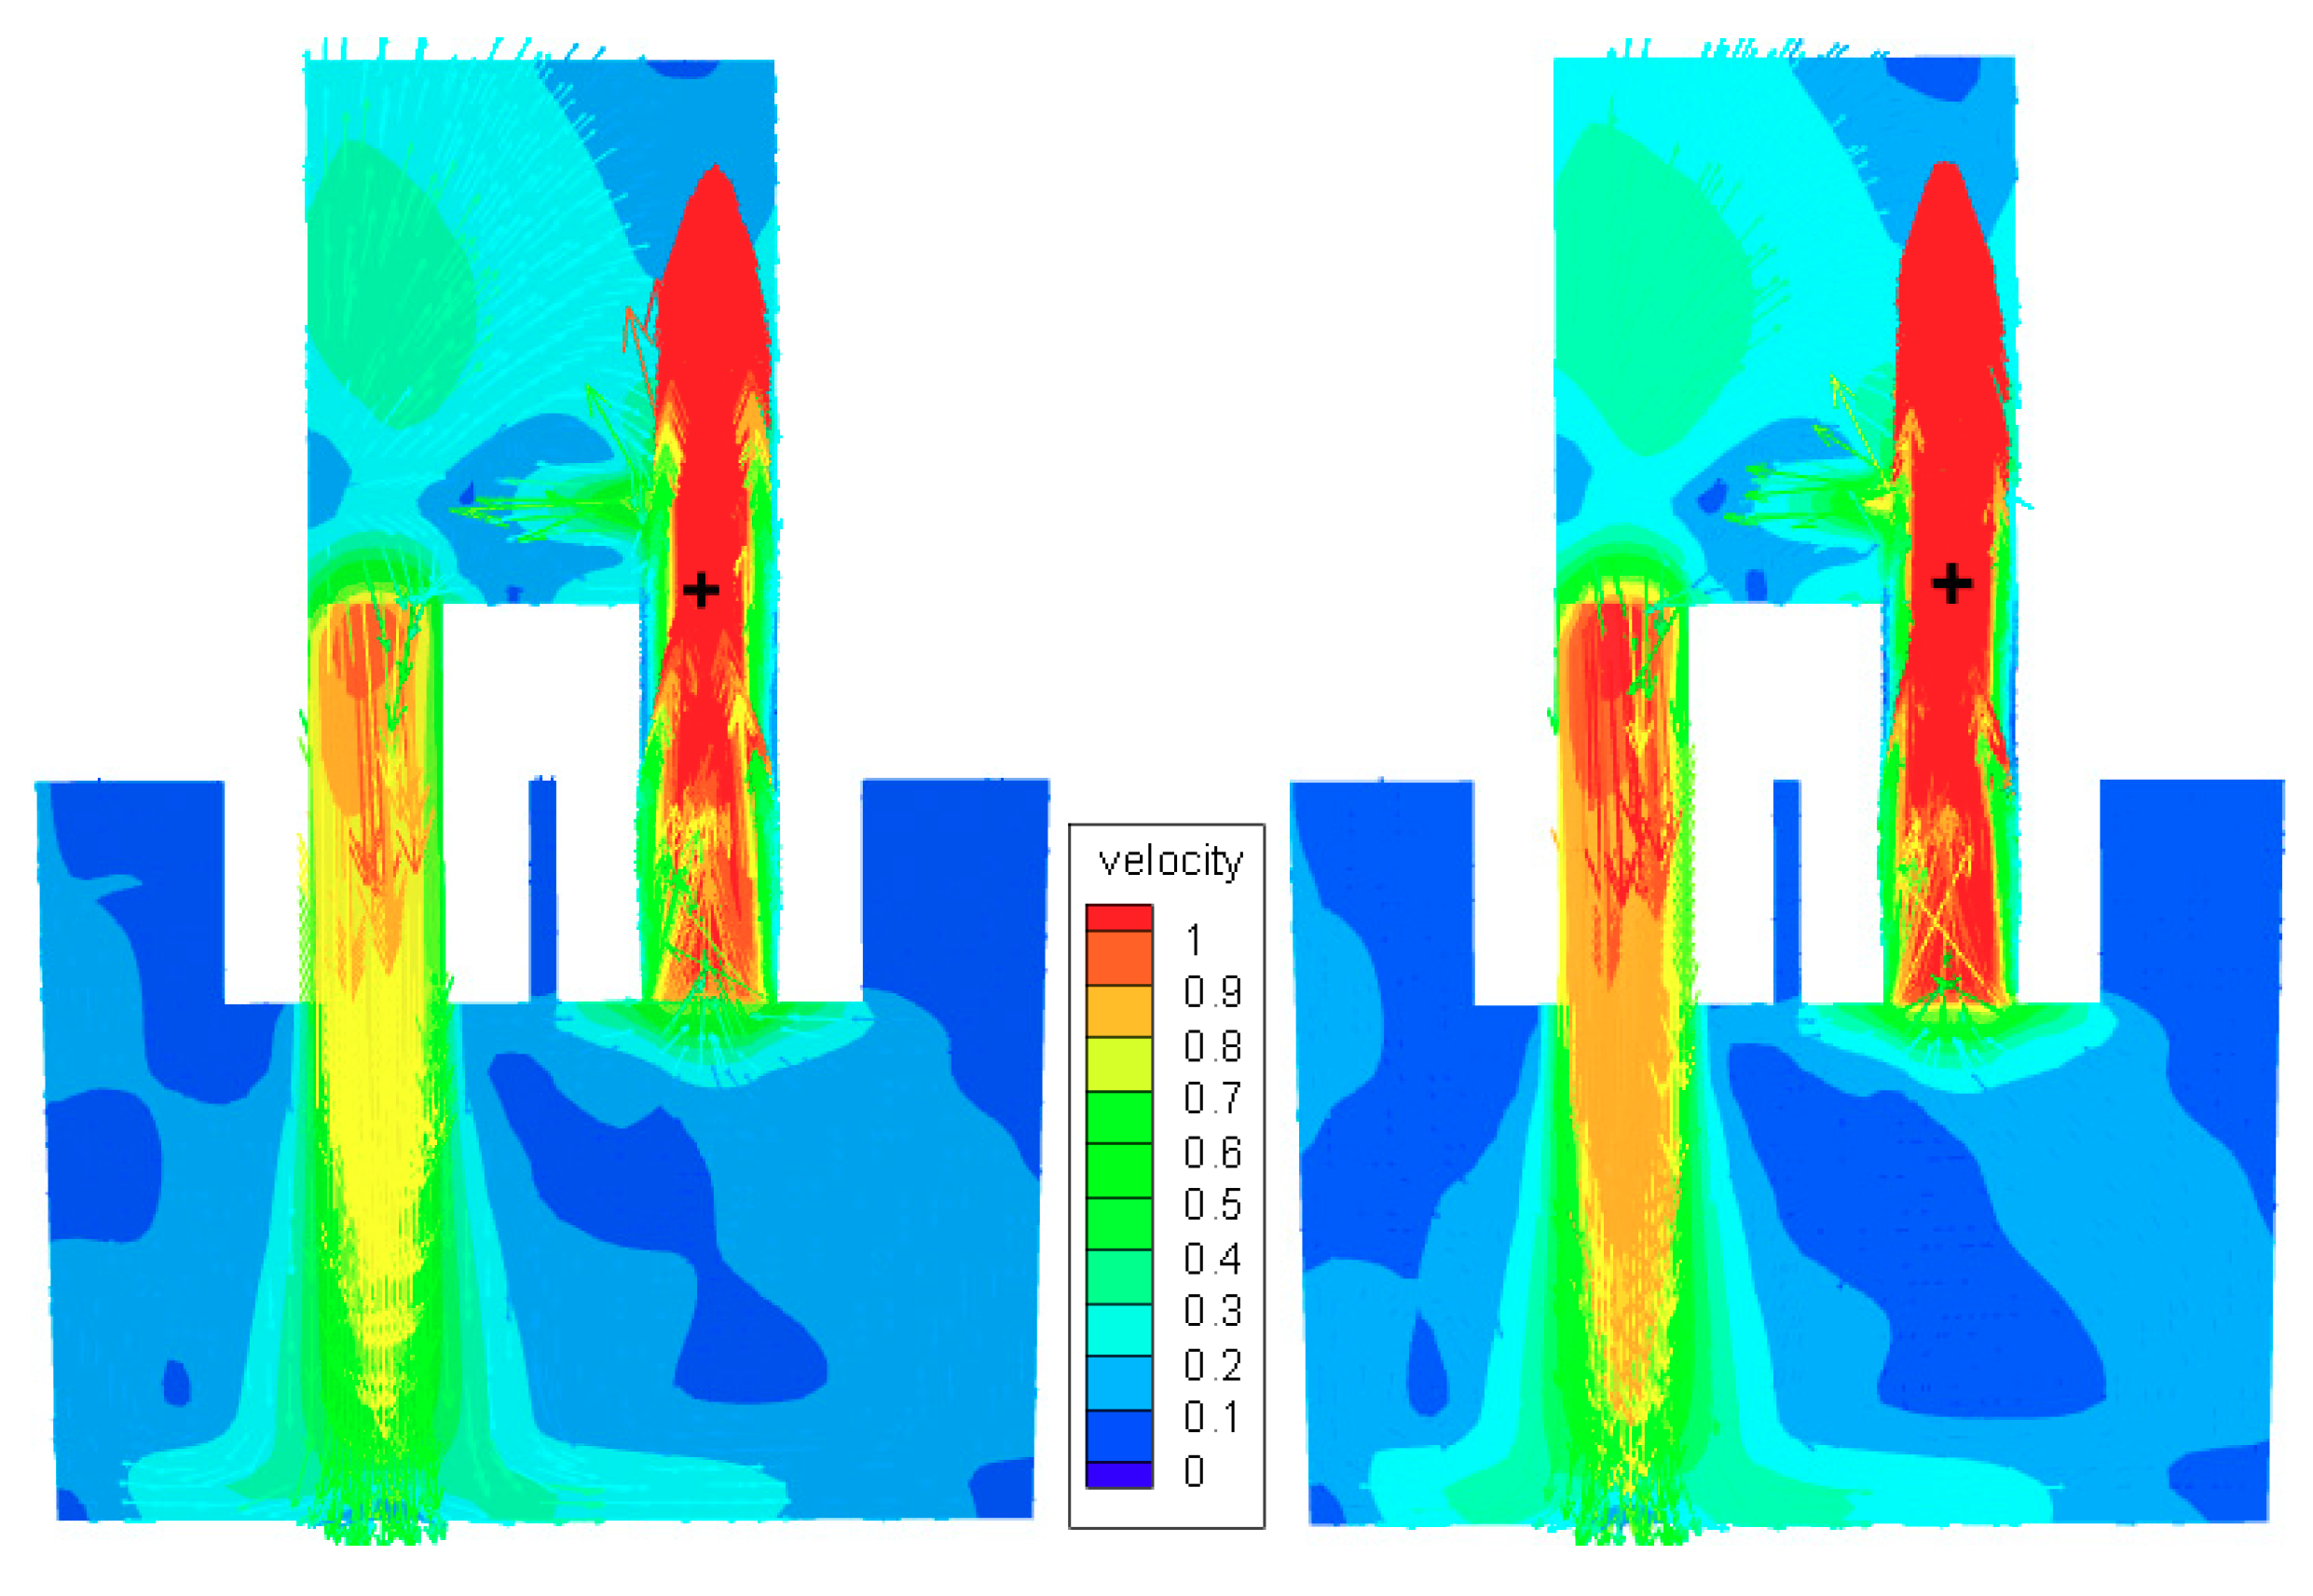
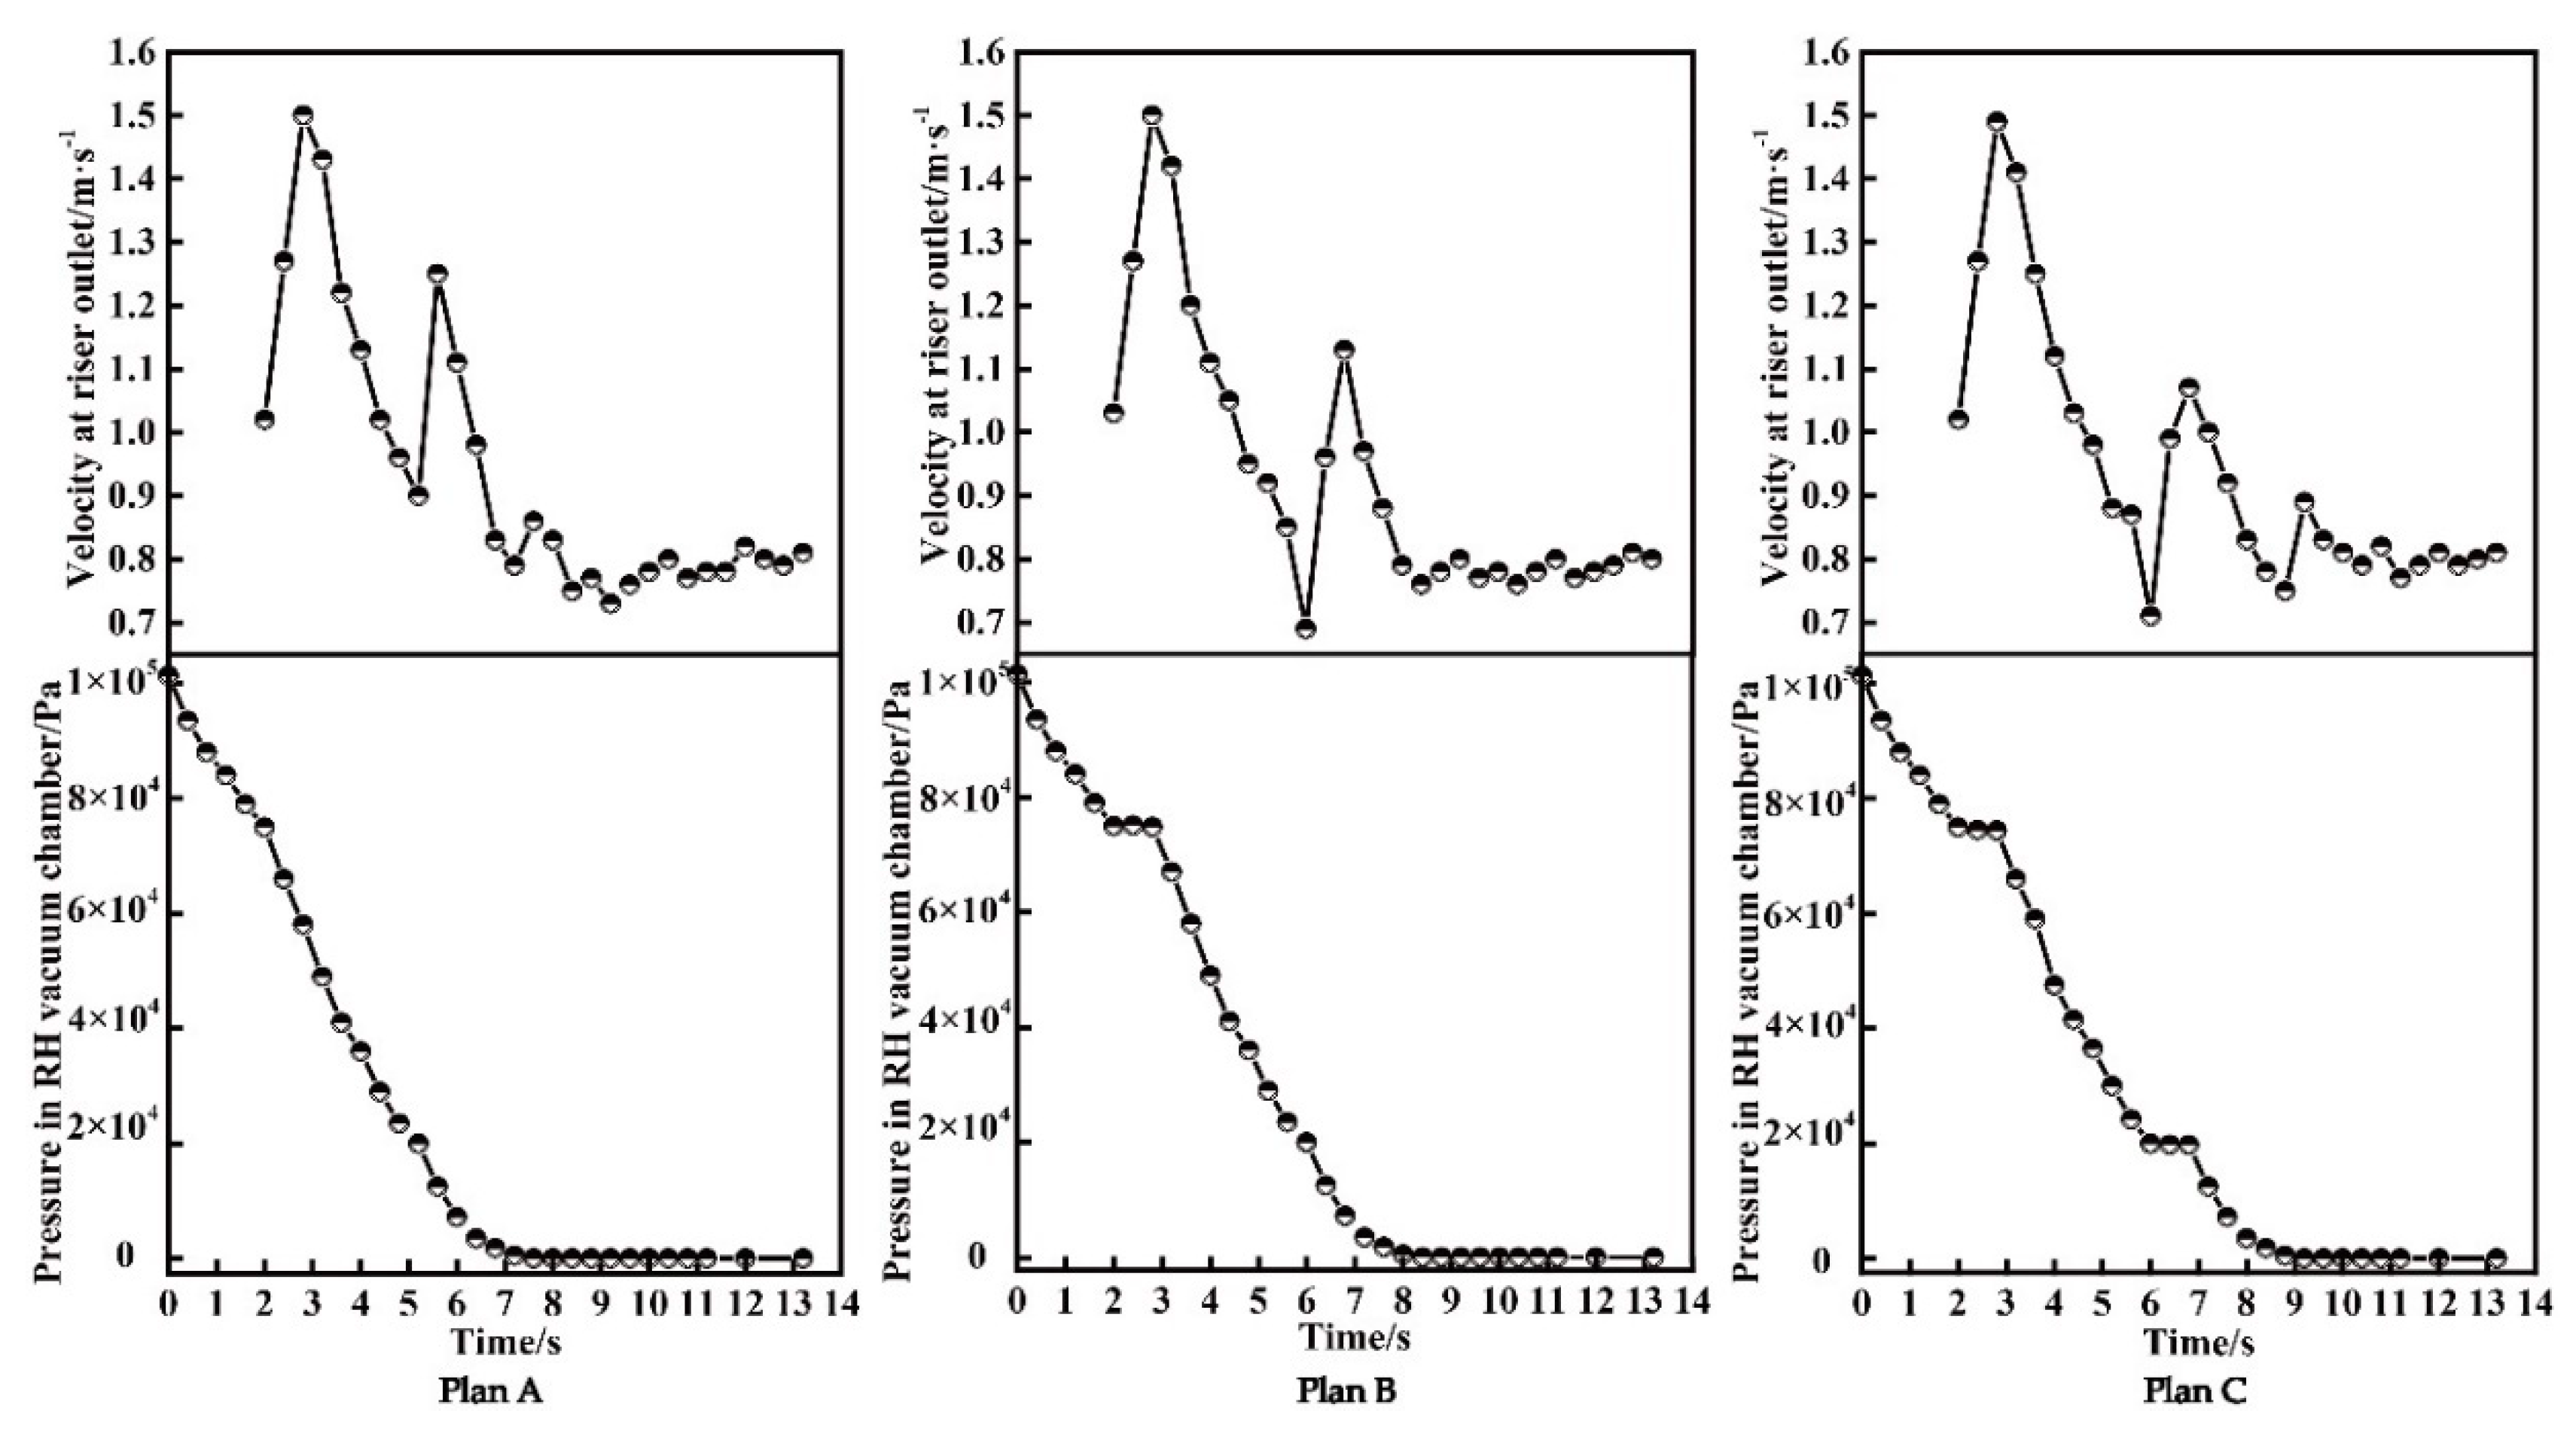
Figure 10 shows the velocity vector cloud chart of the molten steel in the RH refining unit under different pressure drop modes, and the upper center of the up-snorkel entering the vacuum chamber outlet is the measuring point. The velocity of the pressure drop modes of different schemes at this position was measured, and the results are shown in Figure 11. By using step vacuum pumping and slowing down the pressure drop rate, the molten steel entering the vacuum chamber has less kinetic energy, which can effectively reduce the fluctuation of molten steel and the probability of splashing.
3.4. Analysis of RH Vacuum Splashing Mechanism
The prerequisite for the formation of metal droplet splashing is the formation of surface waves on the steel surface and the movement of its impact surface [30]. The movement of these waves make the interface of argon and liquid steel unstable, which leads to the formation of droplet splashing. Previous studies have shown that when the velocity of liquid impinging on the wall exceeds a certain value, splashing will occur. Therefore, the more violent the fluctuation of the liquid surface is, the greater the kinetic energy carried by the liquid mass is, and the greater the possibility of the liquid droplet separating from the whole liquid after colliding with the wall of the vacuum chamber is [31].
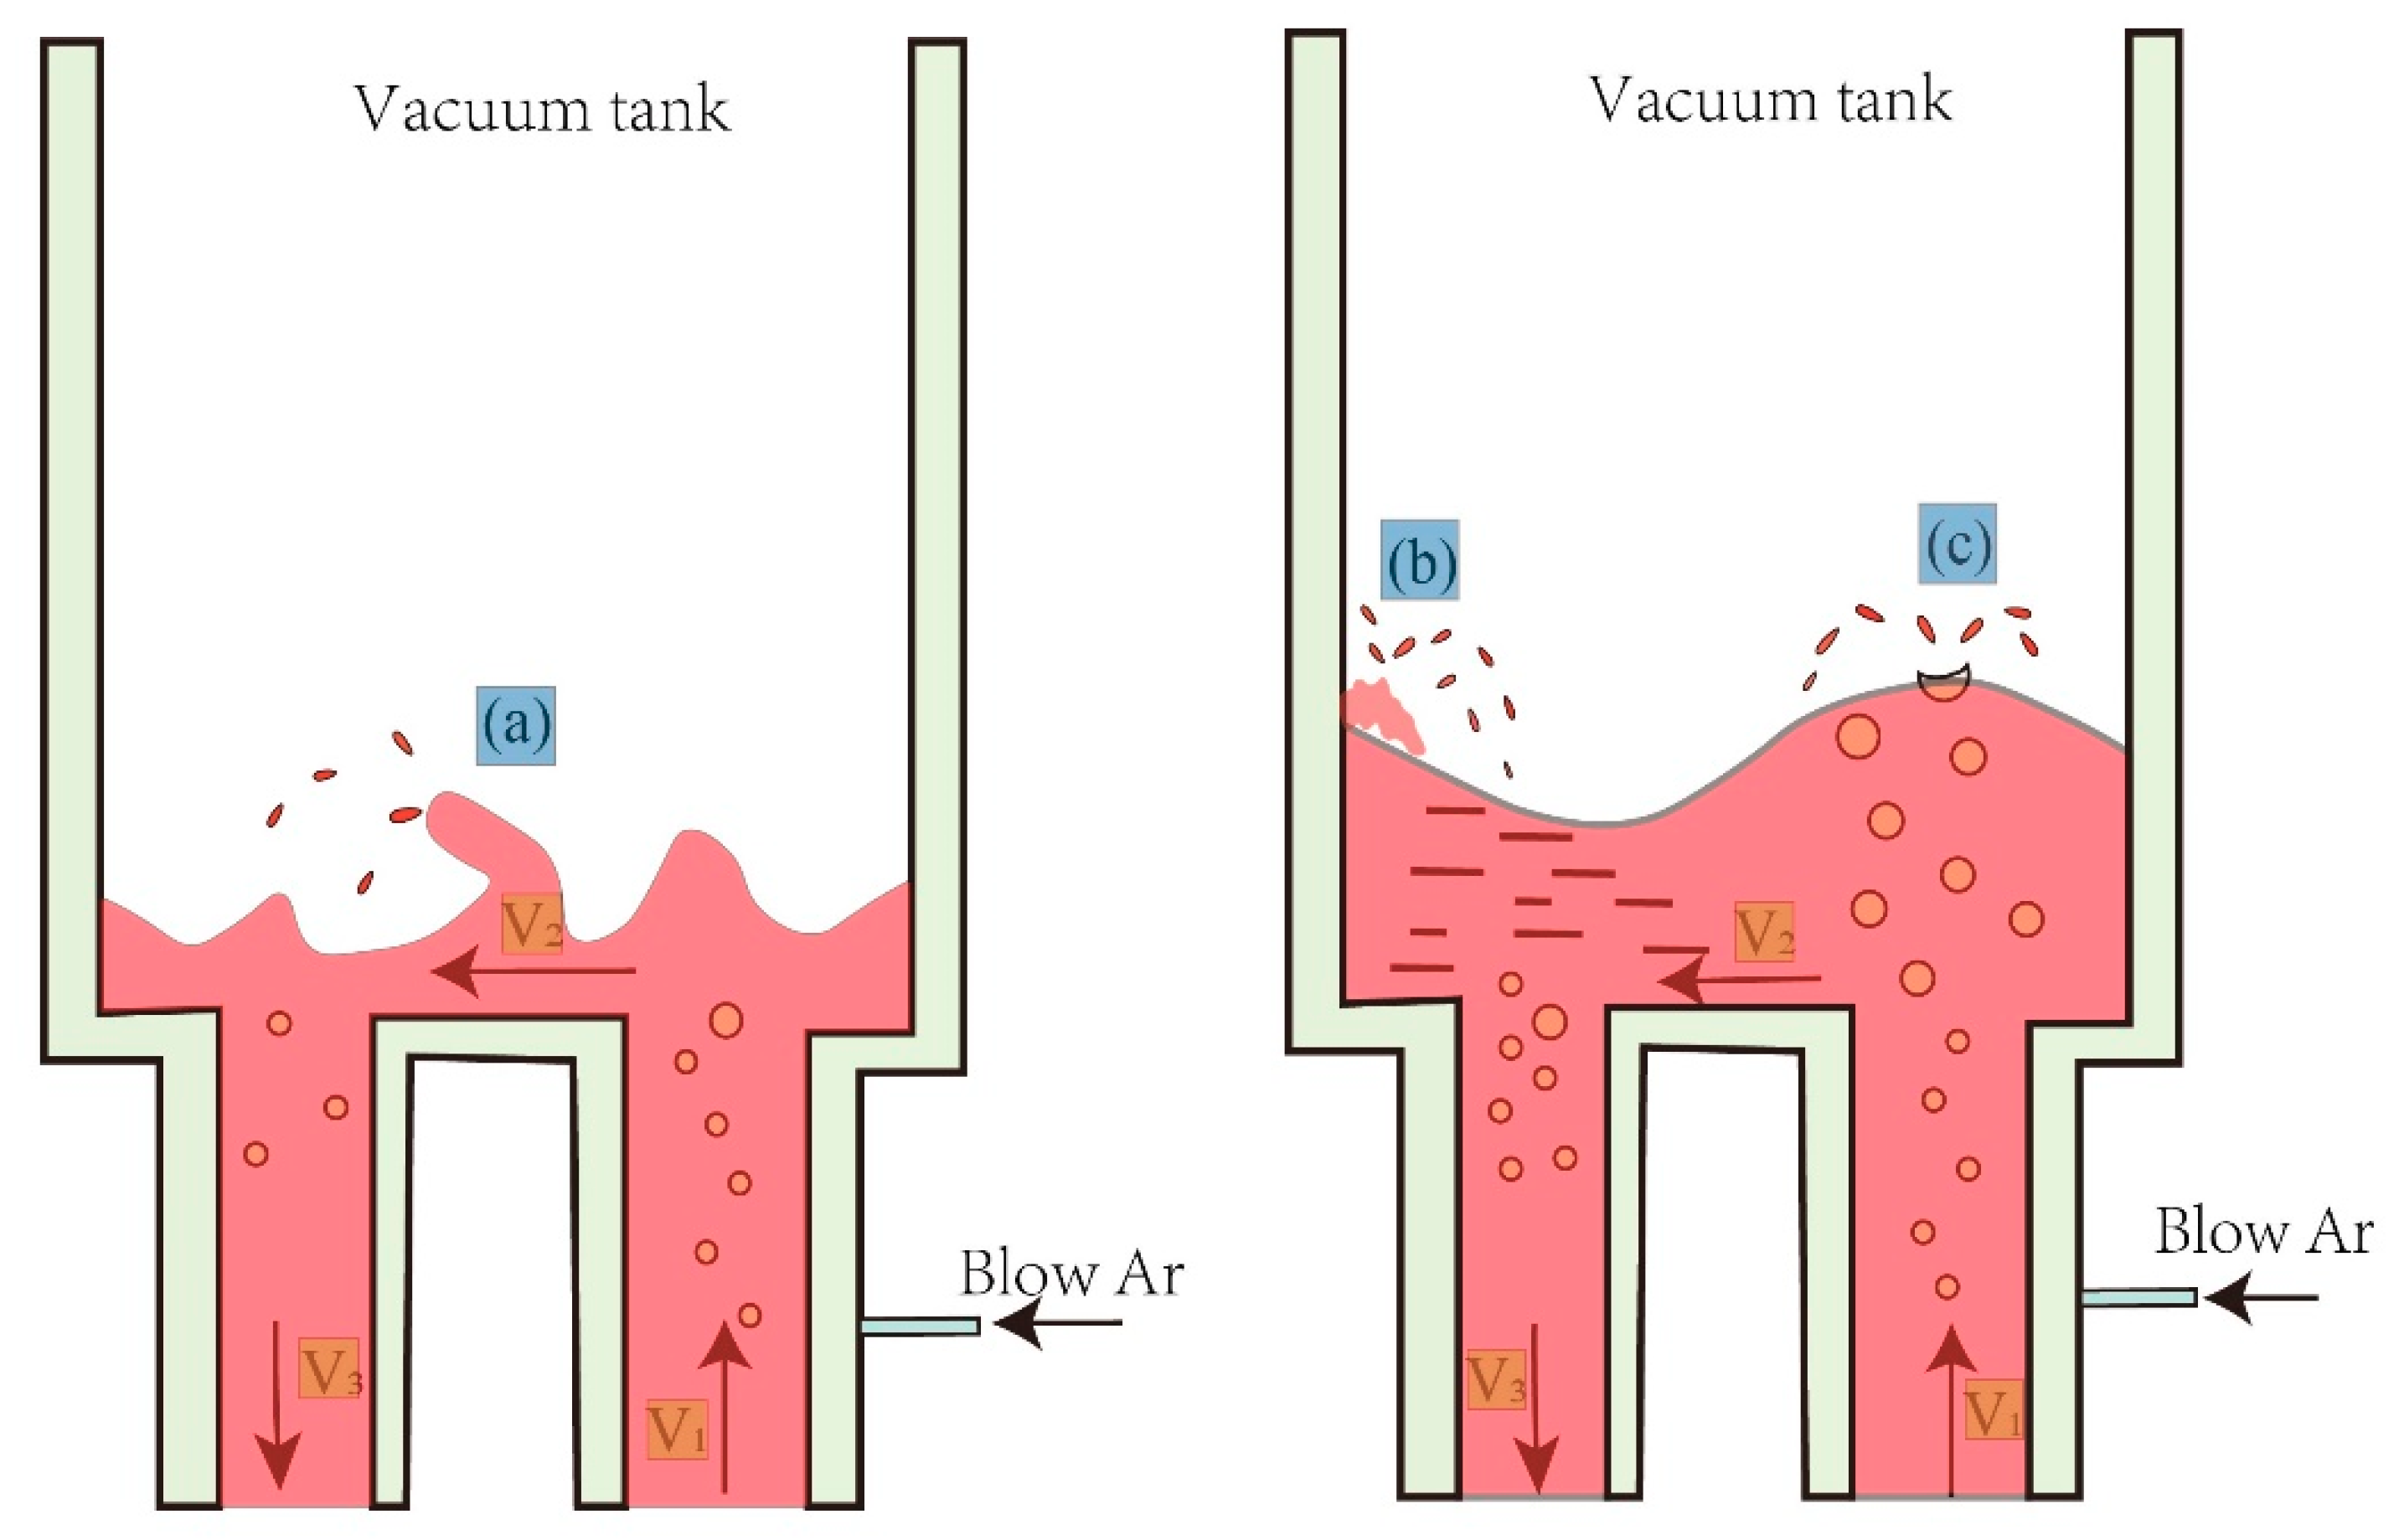
There are two main ways to form splashed droplets:
(1) Splashing caused by collision: One is that in the early stage of lowering the vacuum chamber, the liquid steel in the up-snorkel and the down-snorkel meet after entering the vacuum chamber, and the splashing caused by the collision and separation of two streams of liquid steel with high kinetic energy, as shown in the location (a) in Figure 12. Another situation is that the molten steel rushes into the vacuum chamber at a certain speed under the action of lifting gas and pressure difference. At this time, the molten steel fluctuates violently and impacts on the wall of the vacuum chamber to form a large metal liquid block. The large metal block is then broken and torn into splashes of different sizes, as shown in the location (b) in Figure 12.
(2) During the RH refining process, the lifting gas is constantly blown into the molten steel. As the pressure of the bubble in the process of floating up is constantly decreasing, the bubble in the molten steel is growing up, and some metal droplets will adhere to the bubble surface and float up with the bubble. When the bubble reaches the molten steel surface and leaves the molten steel, the droplet splashes are caused by the fracture, as shown in the location (c) in Figure 12.
4. Conclusions
Based on the VOF + DPM coupling model, this paper simulates the RH vacuum splashing under different pressure drop modes, and the related results can be summed up as follows:
(1) In this paper, the VOF + DPM model is used to simulate the flow pattern of the RH water model, which is in good agreement with the measured values reported in the literature. In general, the model can simulate the liquid steel flow and droplet splashing in the RH vacuum chamber.
(2) In the early stage of vacuum treatment, the splashing is more serious, which is caused by the sharp fluctuation of liquid steel after entering the vacuum chamber. In the later stage of RH treatment, the fluctuation of the liquid level in vacuum chamber is small, and the probability of splashing is low.
(3) By using the step vacuum pressure drop mode, the time is delayed to increase the vacuum degree and continue to increase the vacuum degree after the liquid steel is stable, which has a certain effect on slowing down the fluctuation of the liquid steel in the vacuum chamber and reducing the occurrence of splashing. The experimental results show that the longer the delay time is, the smaller the fluctuation of molten steel is, and the better the effect of reducing splashing is.
(4) Based on the simulation results, it can be proposed that without affecting the production of the steel plant, the use of step-by-step vacuum pumping, that is, adjusting the vacuum pump and intermittent function for an appropriate time after reaching the limit vacuum degree of the pump, is helpful to reduce the occurrence of splashing.
Author Contributions
Data curation, Z.-j.Z. and L.S.; writing—original draft preparation, Z.-j.Z. and M.W.; writing—review and editing, M.W., Z.-j.Z. and Y.-p.B.; supervision, Y.-p.B. All authors have read and agreed to the published version of the manuscript.
Funding
This research was funded by Fundamental Research Funds for the Central Universities (Grant No. FRF-BD-19-022A) and Open Project of State Key Laboratory of Advanced Special Steel (SKLASS 2020-03).
Acknowledgments
The authors wish to express their gratitude to the foundation for providing financial support.
Conflicts of Interest
The authors declare no conflict of interest.
Abbreviations
| Acronyms | |
| RH | Ruhrstahl Heraeus |
| VOF | Volume of Fluid |
| DPM | Discrete Phase Model |
| EAF | Electric Arc Furnace |
| LF | Ladle Furnace |
| CCM | Continuous Casting Machine |
| Nomenclature | |
| αl, g, s | volume fraction of molten steel, top gas, and slag |
| ρm, ρi | density of the mixture and phase i, kg/m3 |
| σij | interfacial tension between two phases, N/m |
| μm | volume average dynamic viscosity of mixed phase, Pa·S; |
| Greek Letters | |
| CD | drag coefficients |
| dg | diameter of the bubble, m |
| Fm | the momentum exchange between discrete and continuous phases, N/m3 |
| drag force on a single bubble, (m/s) | |
| acceleration vector of gravity, m/s2 | |
References
- Huang, X. Principles of Iron and Steel Metallurgy; Metallurgical Industry Press: Beijing, China, 1986; pp. 122–256. [Google Scholar]
- Guo, J.; Bao, Y. RH rapid decarbonization process based on data statistics and exhaust gas analysis. J. Eng. Sci. 2018, 40, 138–146. [Google Scholar]
- Geng, D.; Lei, H.; He, J. Numerical simulation of the multiphase flow in the Rheinsahl–Heraeus (RH) system. Metall. Mater. Trans. B 2010, 41, 234–247. [Google Scholar] [CrossRef]
- Ling, H.; Zhang, L. Numerical Simulation of Gas and Liquid Two-Phase Flow in the RH Process; Springer: New York, NY, USA, 2019; Volume 50. [Google Scholar]
- Wu, Q. Control of splashing in decarbonization process of RH vacuum furnace. Vacuum 2012, 49, 21–24. [Google Scholar]
- Nakamura, O.; Numata, M.; Takatani, K. Numerical simulation of gas-liquid circulation flow of RH. Tetsu-To-Hagane 2015, 101, 123–128. [Google Scholar] [CrossRef] [Green Version]
- Han, J.; Wang, X.; Ba, D. Coordinated analysis of multiple factors of argon blowing parameters on the effect of circulation flow rate in RH vacuum refining process. Vacuum 2014, 109, 68–73. [Google Scholar] [CrossRef]
- Jie, Z.; Yang, H.; Liu, J.; Yan, B. The effects of Soluble Gas Floatation Technology on the flow field of ladle and inclusion removal in RH refine process. Vacuum 2019, 168, 1562417. [Google Scholar]
- Chen, S.; Hong, L.; Meng, W.; Zhao, D. Two-way coupling calculation for multiphase flow and decarburization during RH refining. Vacuum 2019, 167, 1–590. [Google Scholar] [CrossRef]
- Yamoah, S.; Martínez-Cuenca, R.; Monrós, G.; Chiva, S.; Macián-Juan, R. Numerical investigation of models for drag, lift, wall lubrication and turbulent dispersion forces for the simulation of gas-liquid two-phase flow. Chem. Eng. Res. Des. 2015, 98, 17–35. [Google Scholar] [CrossRef]
- Ling, H.; Zhang, L.A. Mathematical model for prediction of carbon concentration during RH refining process. Metall. Mater. Trans. 2018, 26, 997. [Google Scholar] [CrossRef]
- Zhang, J.; Liang, L.; Zhao, X.; Lei, S.; Dong, Q. Mathematical model for decarburization process in RH refining process. ISIJ Int. 2014, 54, 2709–2721. [Google Scholar] [CrossRef] [Green Version]
- Zhao, L.; Guo, J.; Xu, J.; Zhang, C. Research on bubble behavior in RH vacuum chamber. J. Eng. Sci. 2018, 40, 453–460. [Google Scholar]
- Tatsuoka, T.; Kamata, C.; Ito, K. Expansion of injected gas bubble and its effects on bath mixing under reduced pressure. ISIJ Int. 1997, 37, 557–561. [Google Scholar] [CrossRef]
- Yoshitomi, K.; Nagase, M.; Uddin, M.A.; Kato, Y. Fluid mixing in ladle of RH degasser induced by down flow. ISIJ Int. 2016, 56, 1119–1123. [Google Scholar] [CrossRef] [Green Version]
- Van Ende, M.A.; Kim, Y.O.; Cho, M.; Choi, J.; Jung, I. A kinetic model for the Ruhrstahl Heraeus (RH) degassing process. Metall. Mater. Trans. B 2011, 42, 477–489. [Google Scholar] [CrossRef]
- Dou, W.; Lei, H.; Zhu, M. Numerical simulation of 70 t single tube RH metallurgical transport behavior. J. Cent. South Univ. 2019, 3, 9. [Google Scholar]
- Zhu, B.; Kinnor, C.; Hu, X.; Zhang, B.; Liu, Q.; Chen, Z. Optimization of sampling location in the ladle during RH vacuum refining process. Vacuum 2018, 152, 48–55. [Google Scholar] [CrossRef]
- Feng, K.; Liu, A.; Dai, K.; Feng, S.; Ma, J.; Xie, J.; Wang, B.; Yu, Y.; Zhang, J. Effect of gas rate and position of powder injection on RH refining process using numerical simulation. Powder Technol. 2017, 314, 649–659. [Google Scholar] [CrossRef]
- Chen, G.; He, S. Modeling fluid flow and carbon removal in the ruhrstahl–heraeus reactor: Considering the pumping process. Ind. Eng. Chem. Res. 2019, 58, 18855–18865. [Google Scholar] [CrossRef]
- Wu, J.; Ren, T. The technique of circumfluence control for molten steel in RH. Heavy Mach. 2005, 4, 1903266. [Google Scholar]
- Singh, U.; Anapagaddi, R.; Mangal, S.; Padmanabhan, K.A.; Singh, A.K. Multiphase modeling of bottom-stirred ladle for prediction of slag–steel interface and estimation of desulfurization behavior. Metall. Mater. Trans. B 2016, 47, 1804–1816. [Google Scholar] [CrossRef]
- Calderon-Ramos, I.; Morales, R.D. Influence of turbulent flows in the nozzle on melt flow within a slab mold and stability of the metal–flux interface. Metall. Mater. Trans. B 2016, 47, 1866–1881. [Google Scholar] [CrossRef]
- Brackbill, J.U.; Kothe, D.B.; Zemach, C.A. Continuum Method for Modeling Surface Tension. J. Comput. Phys. 1992, 100, 335–354. [Google Scholar] [CrossRef]
- Schiller, L.; Naumann, Z.A. Drag coefficient correlation. Z. Ver. Dtsch. Ing. 1935, 77, 318–320. [Google Scholar]
- Ling, H.; Zhang, L. Investigation on the effect of nozzle number on the recirculation rate and mixing time in the RH process using VOF + DPM model. Metall. Mater. Trans. B 2016, 47, 1950–1961. [Google Scholar] [CrossRef]
- Chen, G. Numerical Simulation of Fluid Flow and Inclusion Behavior in RH Vacuum Refining Process. Ph.D. Thesis, Chongqing University, Chongqing, China, 2017. [Google Scholar]
- Li, F. Study on Fluid Flow and Inclusion Behavior in RH Refining Process. Ph.D. Thesis, Beijing University of Science and Technology, Beijing, China, 2016. [Google Scholar]
- Zhang, L.; Sun, Y.; Zhu, J. Numerical simulation and application of molten steel flow in RH refining process. J. Beijing Univ. Sci. Technol. 2009, 31, 821–825. [Google Scholar]
- Deng, L.; Li, M.; Li, Q.; Zou, Z. Numerical simulation of splashing behavior in converter. J. Mater. Metall. 2016, 15, 25. [Google Scholar]
- Song, Y.; Ning, Z.; Sun, C.; Yan, K.; Fu, J. The movement pattern and splashing mechanism of droplets impinging on wet wall. J. Mech. 2013, 45, 833–842. [Google Scholar]
Figure 1.
Description of clog locations in Ruhrstahl Heraeus (RH) vacuum device: (a) clogs on the inner wall of the vacuum chamber; (b) clogs on the outside of the impregnation tube.
Figure 1.
Description of clog locations in Ruhrstahl Heraeus (RH) vacuum device: (a) clogs on the inner wall of the vacuum chamber; (b) clogs on the outside of the impregnation tube.

Figure 2.
Different vacuum pressure drop modes.

Figure 3.
Geometric model and grid of the whole RH plant.

Figure 4.
Velocity vector on symmetrical plane of RH model ladle.

Figure 5.
Velocity distribution along the center of the down-snorkel in the ladle.

Figure 6.
Velocity distribution at a height of 500 mm from the bottom of the ladle.

Figure 7.
(a) Turbulent kinetic energy dissipation rate of vacuum chamber z = 4.1 m cloud; (b) turbulent energy dissipation rate distribution at different positions.
Figure 7.
(a) Turbulent kinetic energy dissipation rate of vacuum chamber z = 4.1 m cloud; (b) turbulent energy dissipation rate distribution at different positions.

Figure 8.
Fluctuation of liquid steel in vacuum chamber under different pressure drop modes.

Figure 9.
(a) Schematic diagram of the highest point of liquid drop (b) fluctuation of liquid level in vacuum chamber.
Figure 9.
(a) Schematic diagram of the highest point of liquid drop (b) fluctuation of liquid level in vacuum chamber.

Figure 10.
Velocity vector cloud chart of molten steel in RH vacuum reactor.

Figure 11.
The speed of up-snorkel outlet monitored under different schemes.

Figure 12.
Mechanism of RH droplet splashing under different conditions.


Table 1.
Chemical compositions of the target steel grades A%.
| C | Si | Mn | P | S | Als |
|---|---|---|---|---|---|
| 0.48–0.51 | 0.26–0.30 | 0.60–0.90 | <0.020 | <0.015 | 0.020–0.030 |
Table 2.
Main technical parameters of 120 ton RH in the experimental steel plant.
| Parameter | Value | Parameter | Value |
|---|---|---|---|
| Internal height of vacuum chamber/mm | 9910 | Immersion tube length/mm | 975 |
| Vacuum chamber diameter/mm | 1744 | Lift gas flow/NL·min−1 | Max.120 |
| Inner diameter of immersion tube/mm | 500 | Center line distance of impregnated pipe/mm | 1244 |
| Number of argon supply nozzles | 10 | Ultimate vacuum/Pa | ≤28 |
| Pumping capacity of vacuum pump/kgh−1 | 500–2800 | / | |
Table 3.
Different pressure drop modes.
| Control Pump | Level 4 Pump Opening Time/s | Level 3 Pump Opening Time/s | Interval/s | Level 2 Pump Opening Time/s | Interval/s | Level 1 Pump Opening Time/s | Time to Reach the Limit Vacuum/s | |
|---|---|---|---|---|---|---|---|---|
| Scheme | ||||||||
| Plan A | 0 | 2 | 0 | 5.2 | 0 | 7.2 | 7.6 | |
| Plan B | 0 | 2 | 0.8 | 6 | 0 | 8 | 8.4 | |
| Plan C | 0 | 2 | 0.8 | 6 | 0.8 | 8.8 | 9.2 | |
Table 4.
Physical parameters for RH simulation.
| Parameter | Value | Parameter | Value |
|---|---|---|---|
| Ladle bottom diameter/mm | 3650 | Liquid density/kg·m−3 | 7020 |
| Ladle top diameter/mm | 3790 | Viscosity/Pa·s | 0.006 |
| Ladle depth/mm | 3250 | Gas density/kg·m−3 | 1.623 |
| Inner diameter of immersion tube/mm | 500 | Liquid surface tension/N·m−1 | 1.823 |
| Immersion tube length/mm | 975 | Liquid temperature/K | 1873 |
| Blow hole diameter/mm | 6 | Blow hole number | 10 |
© 2020 by the authors. Licensee MDPI, Basel, Switzerland. This article is an open access article distributed under the terms and conditions of the Creative Commons Attribution (CC BY) license (http://creativecommons.org/licenses/by/4.0/).
Share and Cite
MDPI and ACS Style
Zhao, Z.-j.; Wang, M.; Song, L.; Bao, Y.-p. Splashing Simulation of Liquid Steel Drops during the Ruhrstahl Heraeus Vacuum Process. Metals 2020, 10, 1070. https://doi.org/10.3390/met10081070
AMA Style
Zhao Z-j, Wang M, Song L, Bao Y-p. Splashing Simulation of Liquid Steel Drops during the Ruhrstahl Heraeus Vacuum Process. Metals. 2020; 10(8):1070. https://doi.org/10.3390/met10081070
Chicago/Turabian StyleZhao, Zhi-jian, Min Wang, Lei Song, and Yan-ping Bao. 2020. "Splashing Simulation of Liquid Steel Drops during the Ruhrstahl Heraeus Vacuum Process" Metals 10, no. 8: 1070. https://doi.org/10.3390/met10081070
Note that from the first issue of 2016, this journal uses article numbers instead of page numbers. See further details here.