1. Introduction
Palpation is a physical examination technique that determines the size, shape, and location of an anatomical structure by touching a body part with fingers. The accuracy of palpation is highly dependent on the skill of the clinician and requires advanced training. In particular, during open surgery, surgeons rely heavily on palpation using a tactile sensation to check the patient’s condition or the anatomy of the patient’s muscles, bones, and blood vessels [
1,
2]. Haptic sensation plays an important role in allowing most surgeons to avoid damage to healthy tissue and unintentional perforation/rupture of blood vessels. For this reason, palpation is an important procedure done before an open surgical process for locating hidden blood vessels beneath tissue by detecting pulses and distinguishing arteries from veins [
3]. This procedure requires advanced training experience either on a number of human bodies or using the haptic palpation simulator, which is more cost-effective as long as it gives accurate pulse signatures matched to the human bodies. To date, most haptic palpation simulators have focused on developing portable simulators that deliver artificially created haptic feelings in conjunction with virtual reality, rather than developing devices that reflect human physiology for technical difficulties and costs [
4,
5,
6]. Reproduction of the blood pressure waveform is important for palpation training. To be used in medical practice or diagnosis, it is necessary to reproduce the blood pressure waveforms of femoral, radial, and abdominal arteries [
7,
8]. For palpation training, a study was performed to implement a blood pressure waveform according to the patient’s age through a cam profile and delivering it to a hand phantom with a pneumatic actuator [
9]. However, a method transmitting an artificially generated haptic sense based on electric actuators or motor-based multi-degree-of-freedom force feedback devices is limited in training a real feeling to the clinician. In addition, these methods have limitations that cannot provide in-depth training associated with the blood pressure waveforms based on the physiological characteristics of the human body.
To overcome these limitations, this study proposes a mock circulatory platform simulating cardiovascular physiology of the human body for advanced haptic palpation training of arteries. This mock circulatory simulator aims not only to reproduce blood pressure waveforms in blood vessels identically, but also to realize the physiology of blood circulation in the human body for further in-depth studies on the cardiovascular physiology. Previous studies on cardiovascular simulators have been intended mainly for endurance testing of an artificial heart, artificial valve, or stent [
10,
11]. Moreover, even though they were designed to reproduce pulsations and anatomical structures, they cannot reproduce blood pressure waveforms in a controllable manner. To improve this, cardiovascular simulators of some previous studies reproduce the blood pressure waveform by regulating the input waveform of the ventricular pump and the resistance valve of the vein [
12,
13,
14,
15,
16]. Among these, it tried to reproduce the change in stiffness of the vascular wall by pressing the fluid with an air spring to control compliance, but did not actually change the compliance of the vascular wall [
16]. However, there is no detailed study on adjusting the compliance of the blood vascular wall.
Having considered the previous works, this study aims to develop a mock circulatory platform for reproducing blood pressure waveforms in a controllable manner by adjusting the structural parameters of key components. The contribution of this work is to design, develop and evaluate a simulator that mimics the following human physiological behavior: firstly, the blood pressure waveforms in the left ventricle and the ascending aorta are the same as those of the human body; secondly, it mimics the physiological characteristics of the pressure waveform that changes with peripheral resistance and compliance of ascending aorta. Hence, the mock circulatory platform is able to reproduce various blood pressure waveforms according to different conditions (e.g., gender, age, and BMI) by adjusting resistance and compliance. Through this simulator, the correlation between the pressure waveform and the change of each parameter is evaluated and verified to see whether a realistic physiology is reproduced in the proposed approach.
This paper is organized as follows.
Section 2 describes the human blood pressure waveforms and the windkessel model, which is one of the simplest mathematical models of the cardiovascular system.
Section 3 is about the design and simulation of the mock circulatory platform. Each component of the platform is designed to reproduce the physiological behavior of the human body and the designed platform is validated through the lumped model simulation.
Section 4 describes the results of experimental validation and parametric study on the developed platform.
Section 5 concludes with a discussion and suggestions for future works.
2. Modeling of Cardiovascular System
The blood pressure waveform represents the current condition of the cardiovascular system and its components. This depends on physiological parameters including the diameter, length, stiffness, and vascular wall thickness of components such as the heart and aorta. Therefore, it is possible to model the physiological behavior of the cardiovascular system by analyzing the blood pressure waveform. The cardiovascular system consists of the left ventricle, atrium, valves and blood vessels. Blood vessels can be classified into ascending aorta, descending aorta, abdominal aorta, renal artery, femoral artery, etc. The ventricle acts as a pulsating pump, and each of the other components has different viscoelastic properties. Thus, the blood pressure waveform has a complex shape, and the Wiggers diagram shows its standard [
17].
2.1. Wiggers Diagram: A Standard Human Blood Pressure Waveform
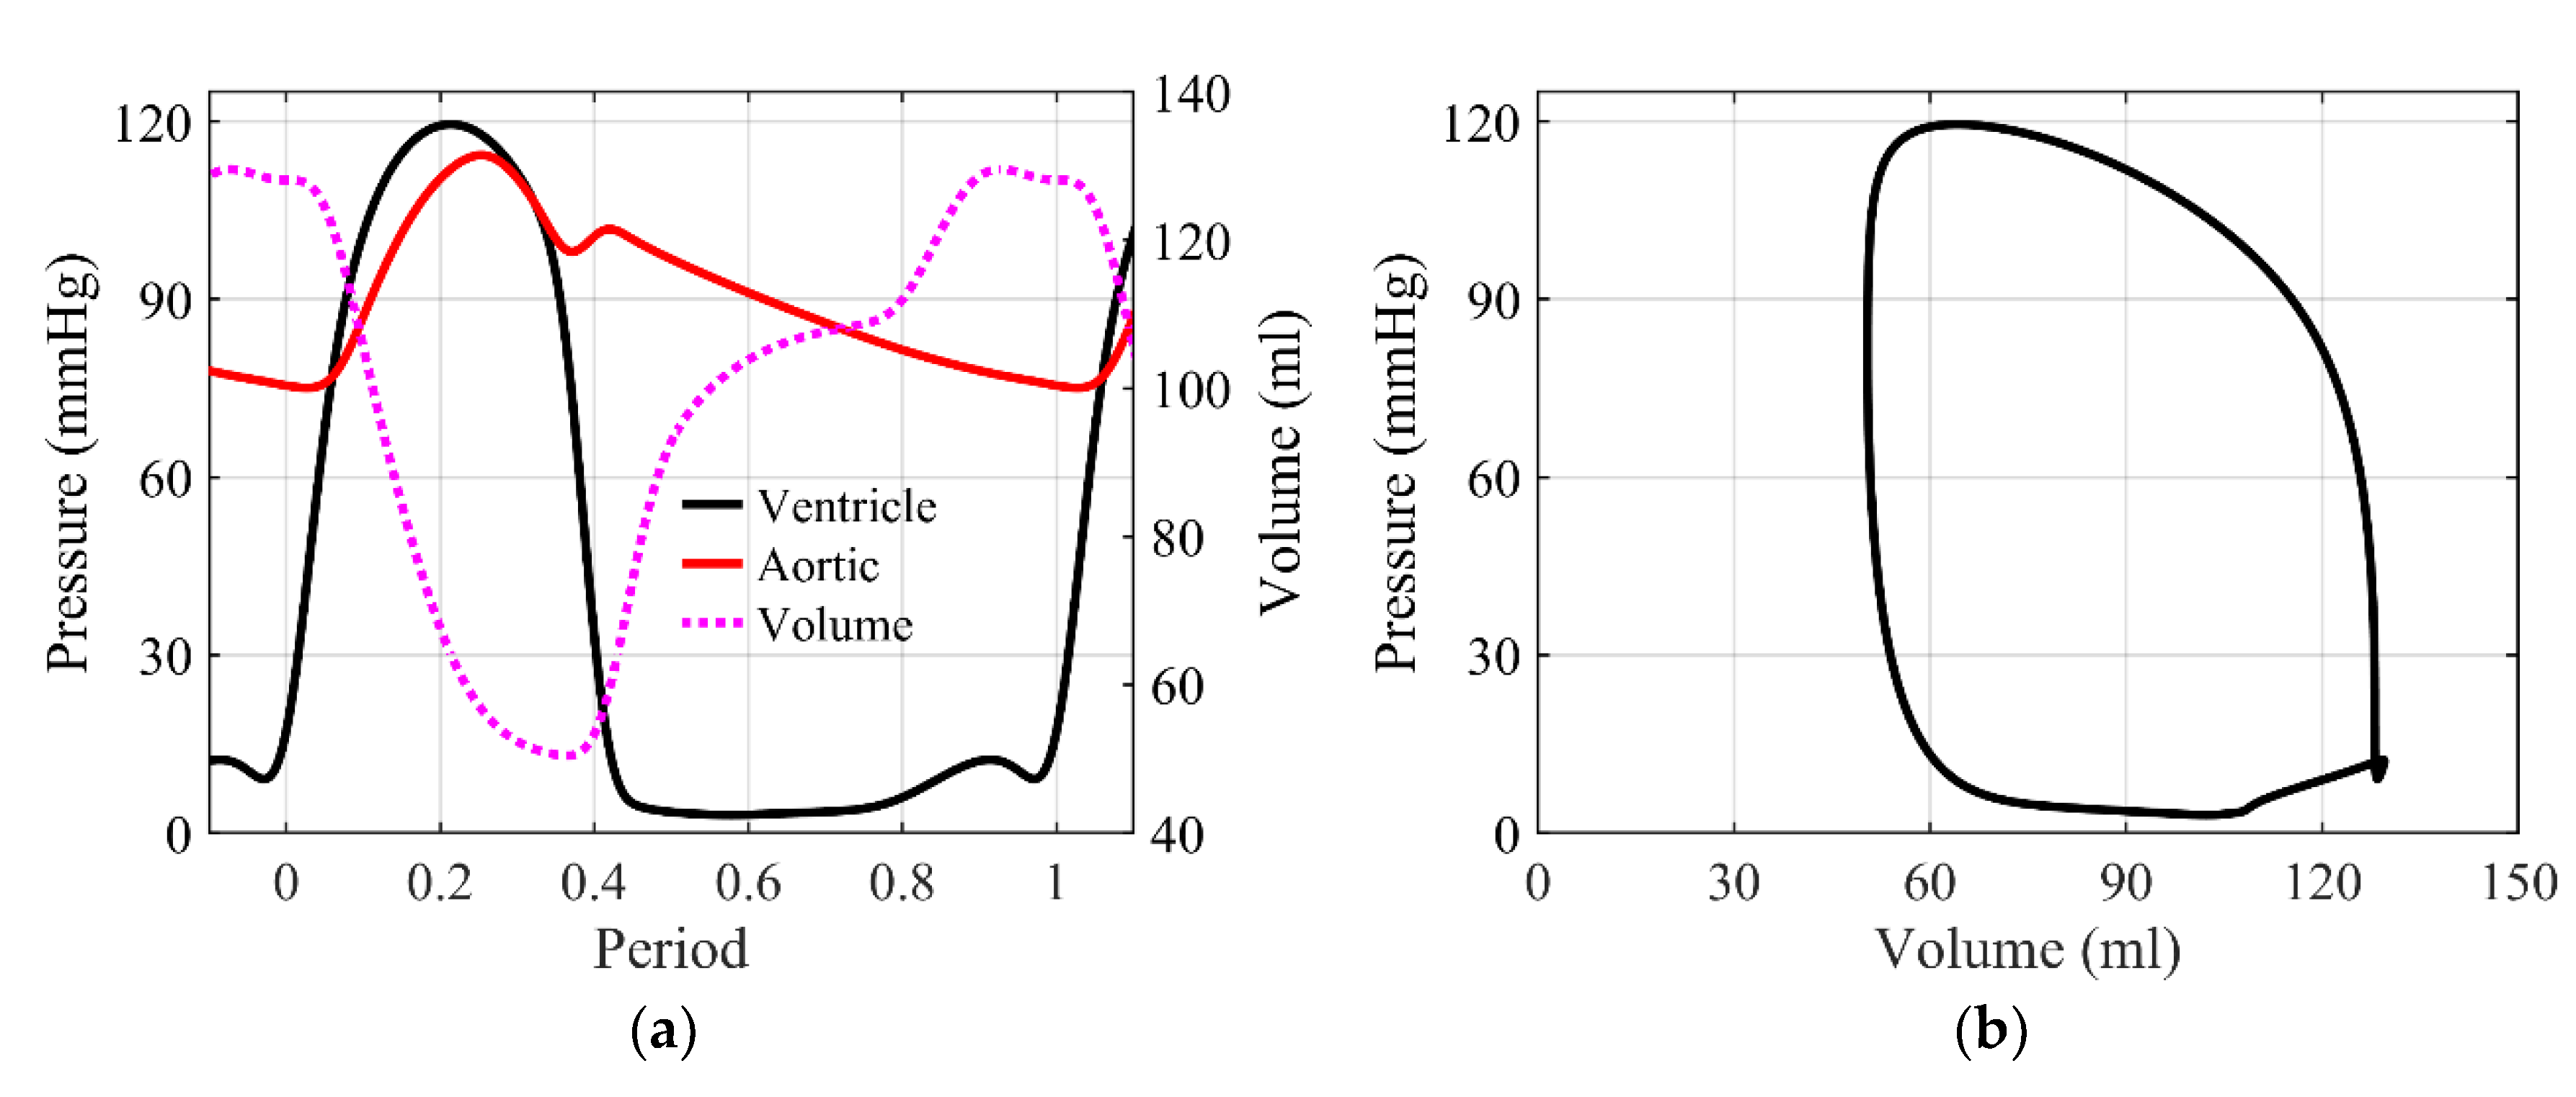
The Wiggers diagram, which is a standard for human cardiovascular signals, is shown in
Figure 1a. The blood pressure of the left ventricle and aorta, and the volume of the left ventricle, are shown. Left ventricular blood pressure ranges up to 120 mmHg, with a systolic period of about one-third of one cycle. Aortic blood pressure ranges from 70 to 120 mmHg, records the highest blood pressure in the systolic phase, and decreases to the lowest blood pressure after drawing the dicrotic notch, which is the transient increase in blood pressure caused by the closing of aortic valve, in the diastolic phase.
Figure 1b shows the blood pressure–volume curve of the left ventricle, which depicts a similar shape in most mammals. The goal of this paper is to reproduce these pressure waveforms, with an emphasis on the aortic waveform. However, the cardiovascular system is very complex. To describe the physiological behavior of the blood pressure wave, a proper but simpler model is required. For this, the windkessel model allows lumped modeling of these complex cardiovascular components into simple fluid dynamic elements and its electric analogy [
18].
2.2. Windkessel Model
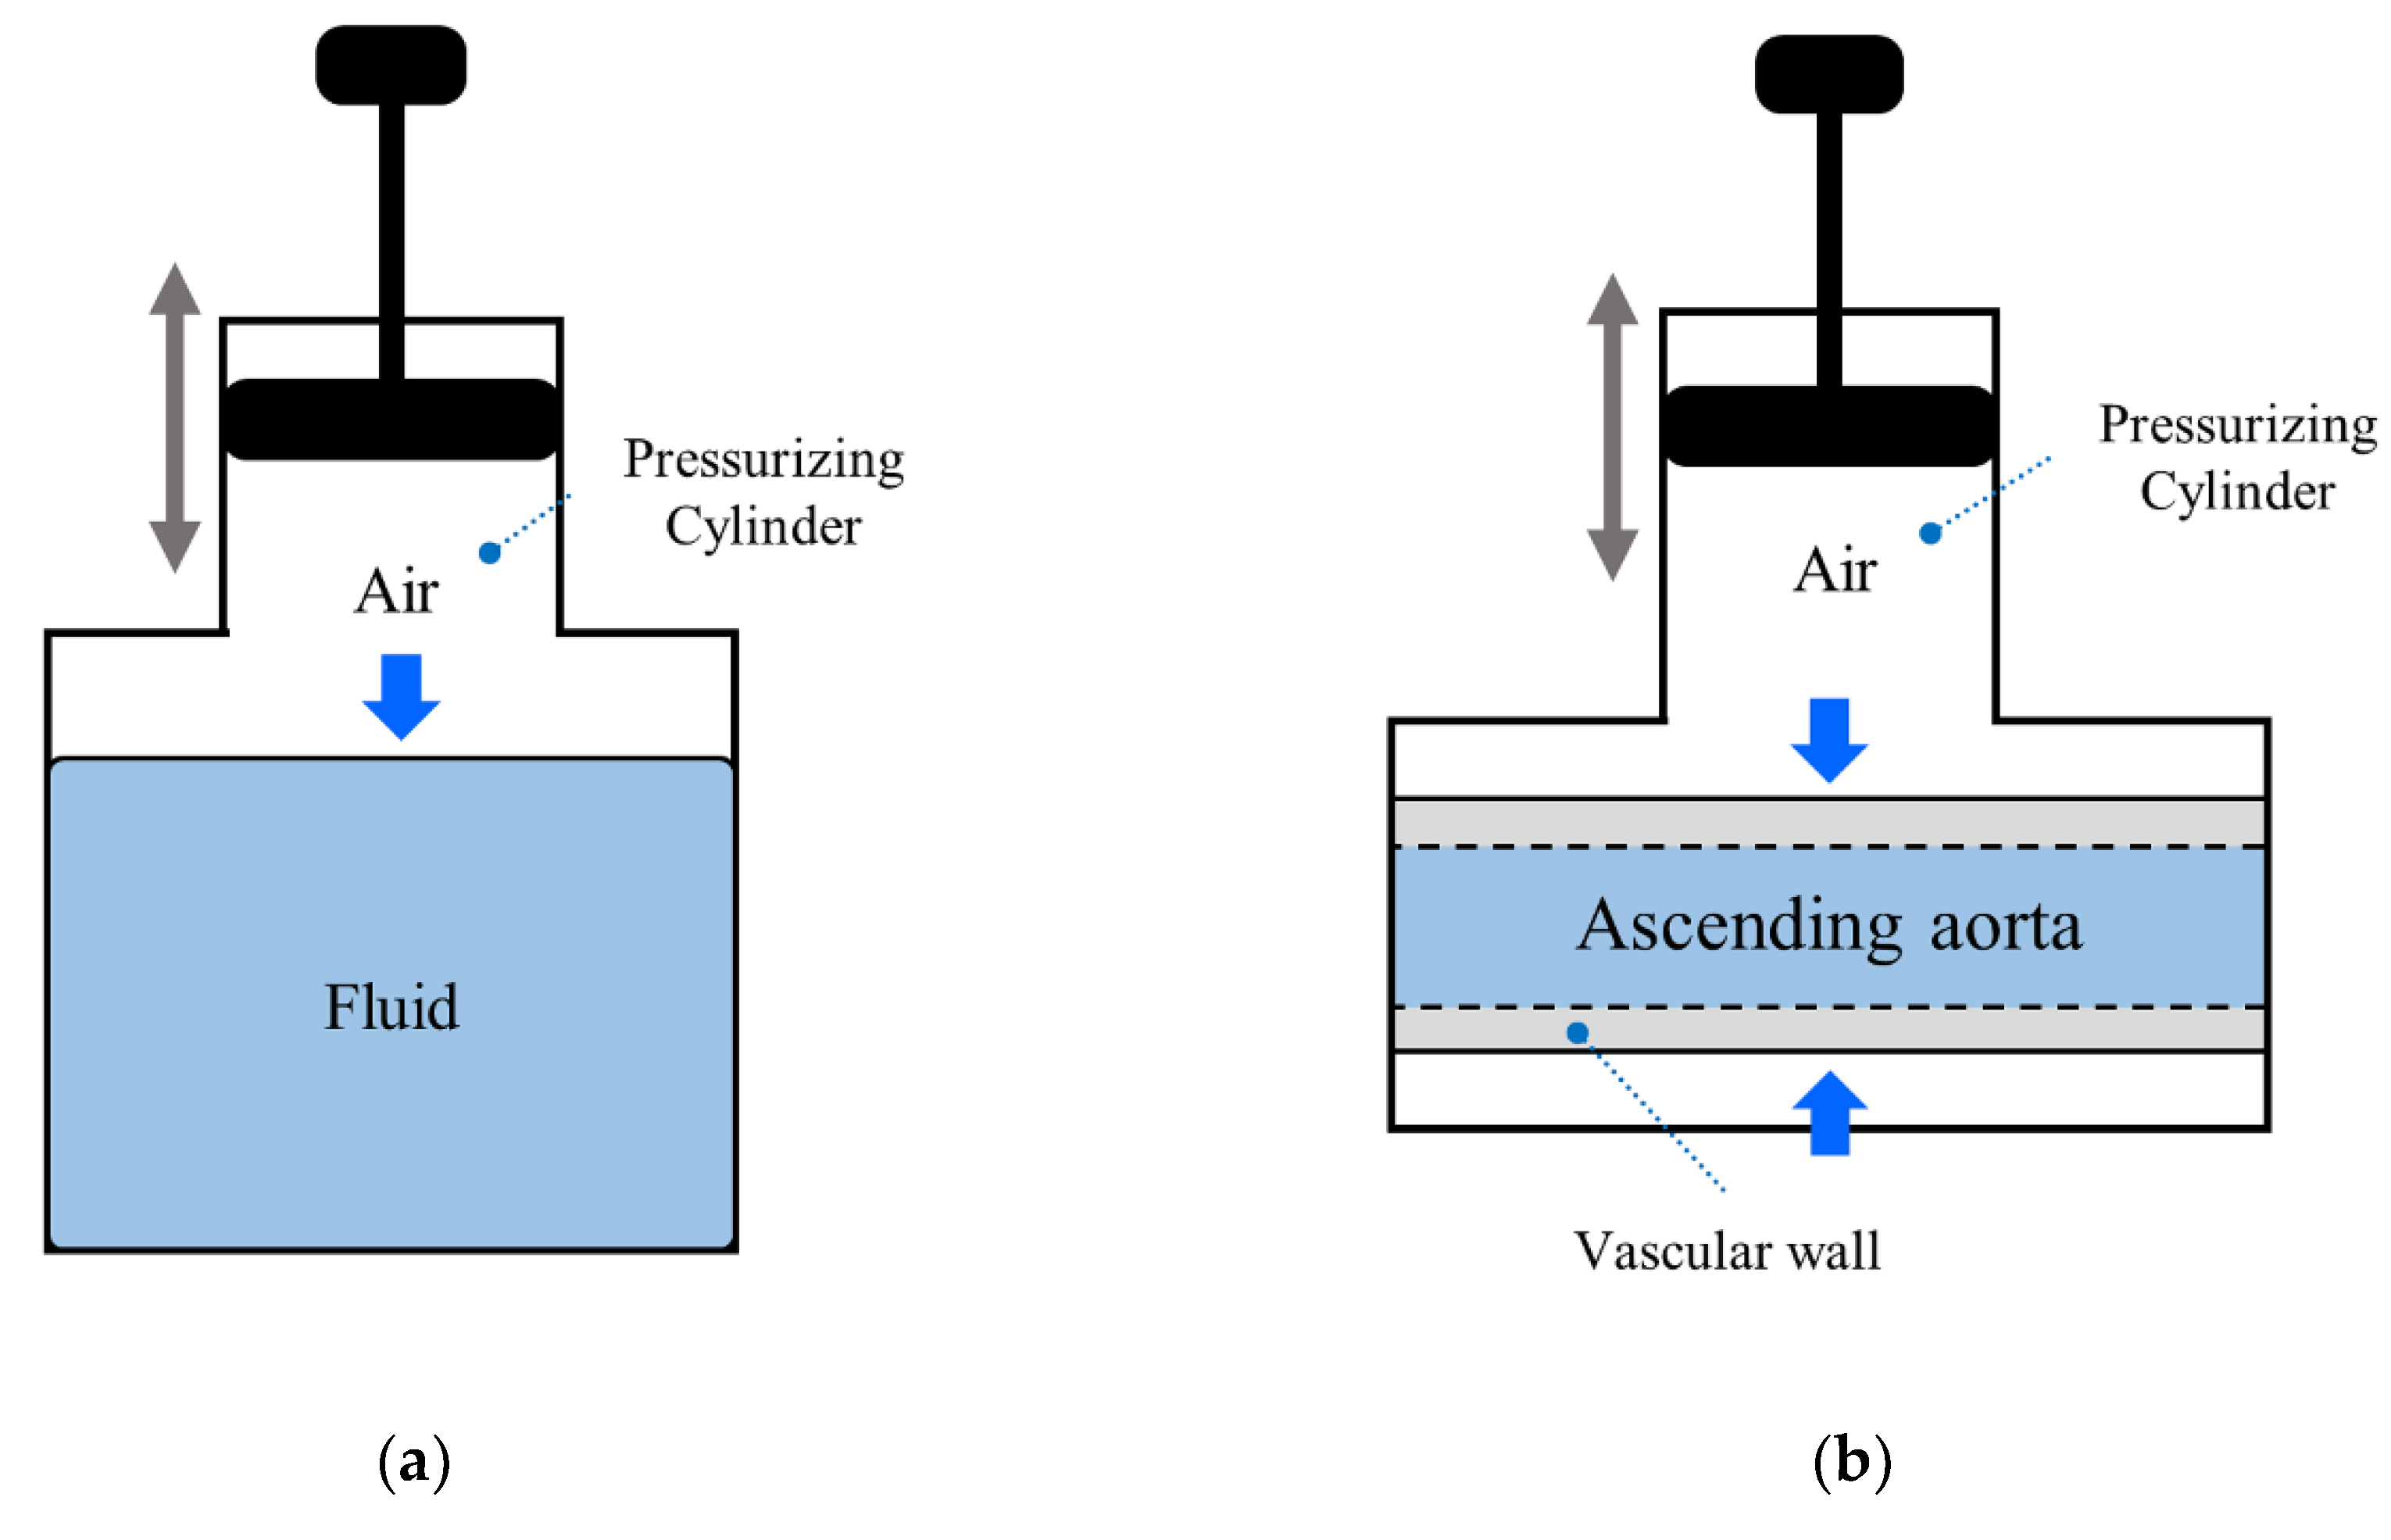
The concept of the windkessel effect is shown in
Figure 2a. The windkessel means air chamber in German, and is an air-spring type capacity mounted in the middle of the pipe to control the flow rate. The combination of air-spring effect and peripheral resistance in the windkessel can reproduce the properties of the elastic artery wall. The fluid dynamics model of the cardiovascular system lumped with the windkessel effect is called the windkessel model, which can be converted into an equivalent electrical circuit through fluid–electric analogy [
19]. The windkessel model is classified according to the types of components, the 2-element model considering only resistance (
) and capacitance (
), the 3-element model considering up to characteristic resistance of the vessel (
), and the 4-element model considering up to inertance of blood flowing through the vessel (
). The 4-element windkessel model shown in
Figure 2b is known to be an effective simplified model to describe the characteristics of the cardiovascular system [
18]. In this model, the inductor and characteristic resistance are connected in parallel; the capacitor and peripheral resistance are also connected in parallel, where the two groups are connected in series.
Fluid–electric analogy is summarized in
Table 1. Blood pressure is converted to voltage, fluid resistance to electrical resistance, blood inertia to inductance, and elastic artery wall compliance to capacitance. Each electrical element can be formulated by fluid-dynamic parameters as follows [
20].
Equations (1)–(4) show how to calculate electric parameters based on the fluid–electric analogy of the blood vessel to construct the windkessel model. Peripheral resistance is determined by the viscosity of blood and the diameter and length of the blood vessels. Inertance is determined by the diameter and length of the blood vessels and the density of blood . Compliance is determined by the diameter and length of the blood vessels and the thickness and stiffness of the vascular walls . Characteristic resistance is determined by inertance and compliance of the blood vessels. It can be calculated from the diameter and length of the blood vessels, the thickness and stiffness of the vascular walls, and density of blood.
3. Design and Simulation of Mock Circulatory Platform
The windkessel model can reproduce the blood pressure waveform, but does not reflect physiology such as the diameter change and reflected wave of the cardiovascular system. Hence, it does not reproduce the individual characteristics of the cardiovascular components. In this study, to overcome the limitations of the windkessel model, a mock circulatory platform that reproduces each component of the circulatory system was designed and fabricated.
3.1. 4-Element Windkessel Model
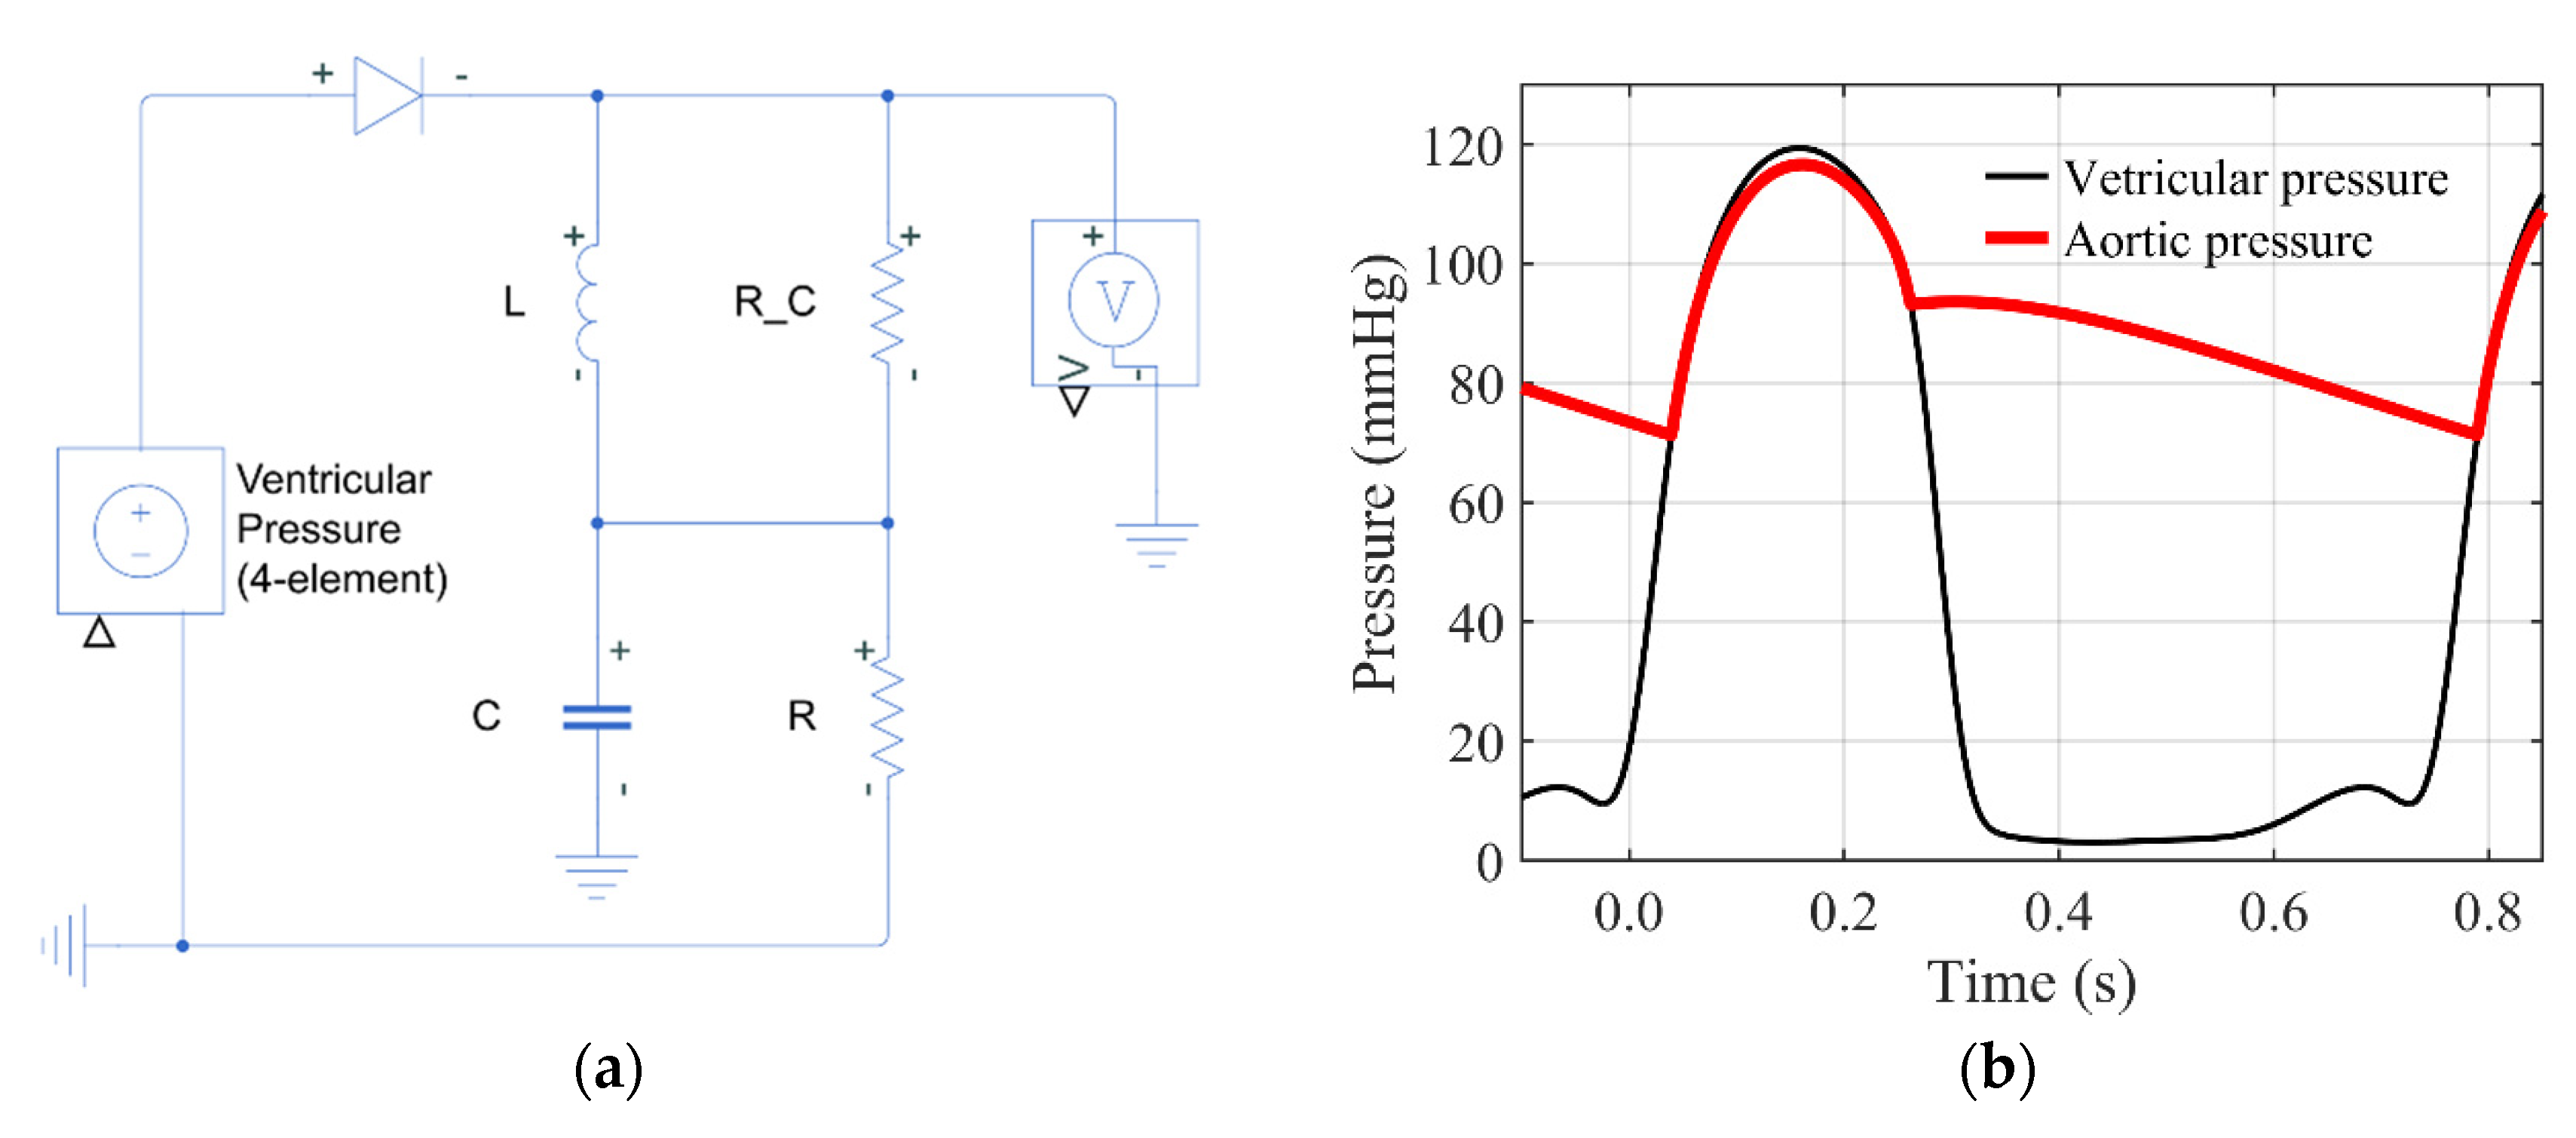
Figure 3a shows the electric circuit of the 4-element windkessel model for simulation. The windkessel model was simulated using Matlab
™ 2019a and Simulink
™ software from MathWorks (Natick, MA, USA). The input voltage is the ventricular pressure from the Wiggers diagram in
Figure 1a. In this paper, the parameters used in the simulation are as follows. The peripheral resistance
is 1.5 Ω including viscosity and peripheral resistance of vein and body, inertance
is 0.02 H, compliance
is 0.8 F, and characteristic resistance
is 0.13 Ω. These values approximate the entire body as a single blood vessel, and include the peripheral resistance of the vein and body.
Figure 3b shows the simulation result of the 4-element windkessel model. As in the Wiggers diagram, the aortic pressure in the systole increases with the ventricular pressure and then slowly decreases in the diastole. These blood pressure waveforms and parameter conditions are used as a control for parameter studies through simulations.
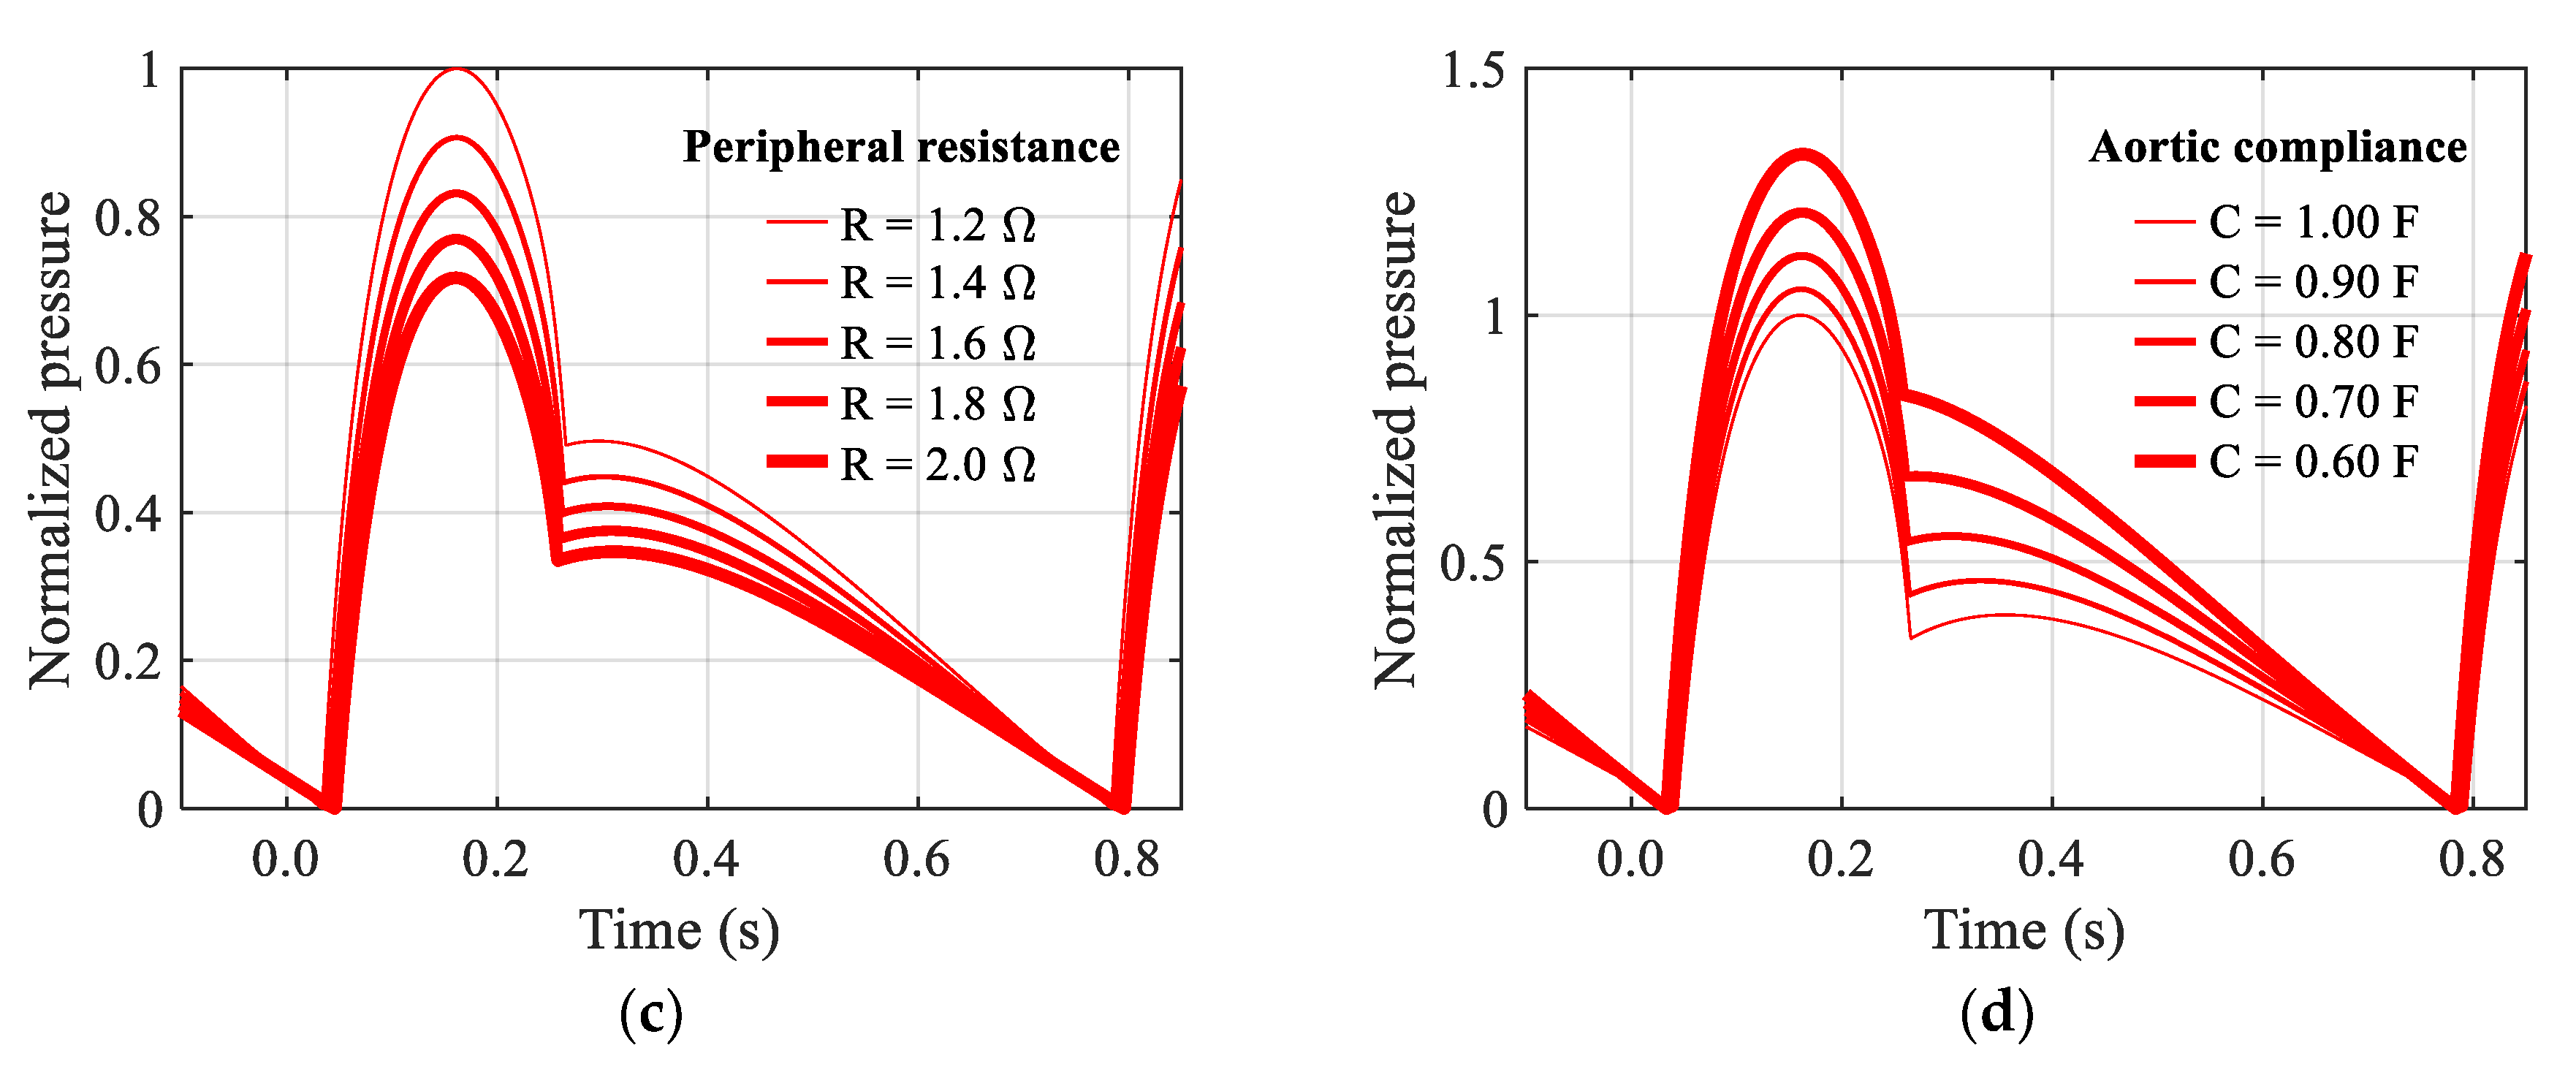
In this study, the change in pulse pressure, which is the difference between systolic and diastolic blood pressures, is examined at the aorta. For ease of comparison of pulse pressure, calculated aortic pressures were normalized to the aortic pressure in
Figure 3b, and shifted to have zero as the minimum pressure.
Figure 3c shows normalized aortic pressure according to peripheral resistance. As a result, as the peripheral resistance increases, the pulse pressure, which is the amplitude of the aortic pressure waveform, decreases.
Figure 3d shows normalized aortic pressure according to the change of aortic compliance. As a result, as the compliance of the vascular wall decreases, the pulse pressure, which is the amplitude of the aortic pressure waveform, increases.
However, since the windkessel model lumps the entire body, it is difficult to reflect the physiology of each component of the cardiovascular system. In the human body, the pressure wave is partially divided from the descending aorta into the kidney through the renal artery, passes through the abdominal artery, and branches into both legs through the femoral artery to form a reflected wave [
21]. This phenomenon is not considered in the windkessel models. Therefore, in order to reproduce the physiology of the cardiovascular system more accurately, it is necessary to design a simulator that implements each cardiovascular component simultaneously.
3.2. Design of Mock Circulatory Platform
The mock circulatory platform of this study mimics the cardiovascular components to simulate the physiology of the human cardiovascular system. The platform is designed as a one atrium and one ventricle structure, to study how each component of arteries contributes to pulse wave generation. In this study, the effects of respiration were not considered, so the right atrium and right ventricle were integrated into the reservoir. The right atrium and the right ventricle have a major role in supplying blood to the lungs for respiration, and changes in blood pressure due to breathing are as small as several mmHg and do not contribute to changes in the blood pressure waveform [
22]. It consists of components such as the ventricle, atrium, valves, arteries, and peripheral resistances. In terms of mechanical components, it consists of a pump that acts as a heart, tubes that simulate aorta and arteries, and a reservoir that acts as a vein and peripheral resistance.
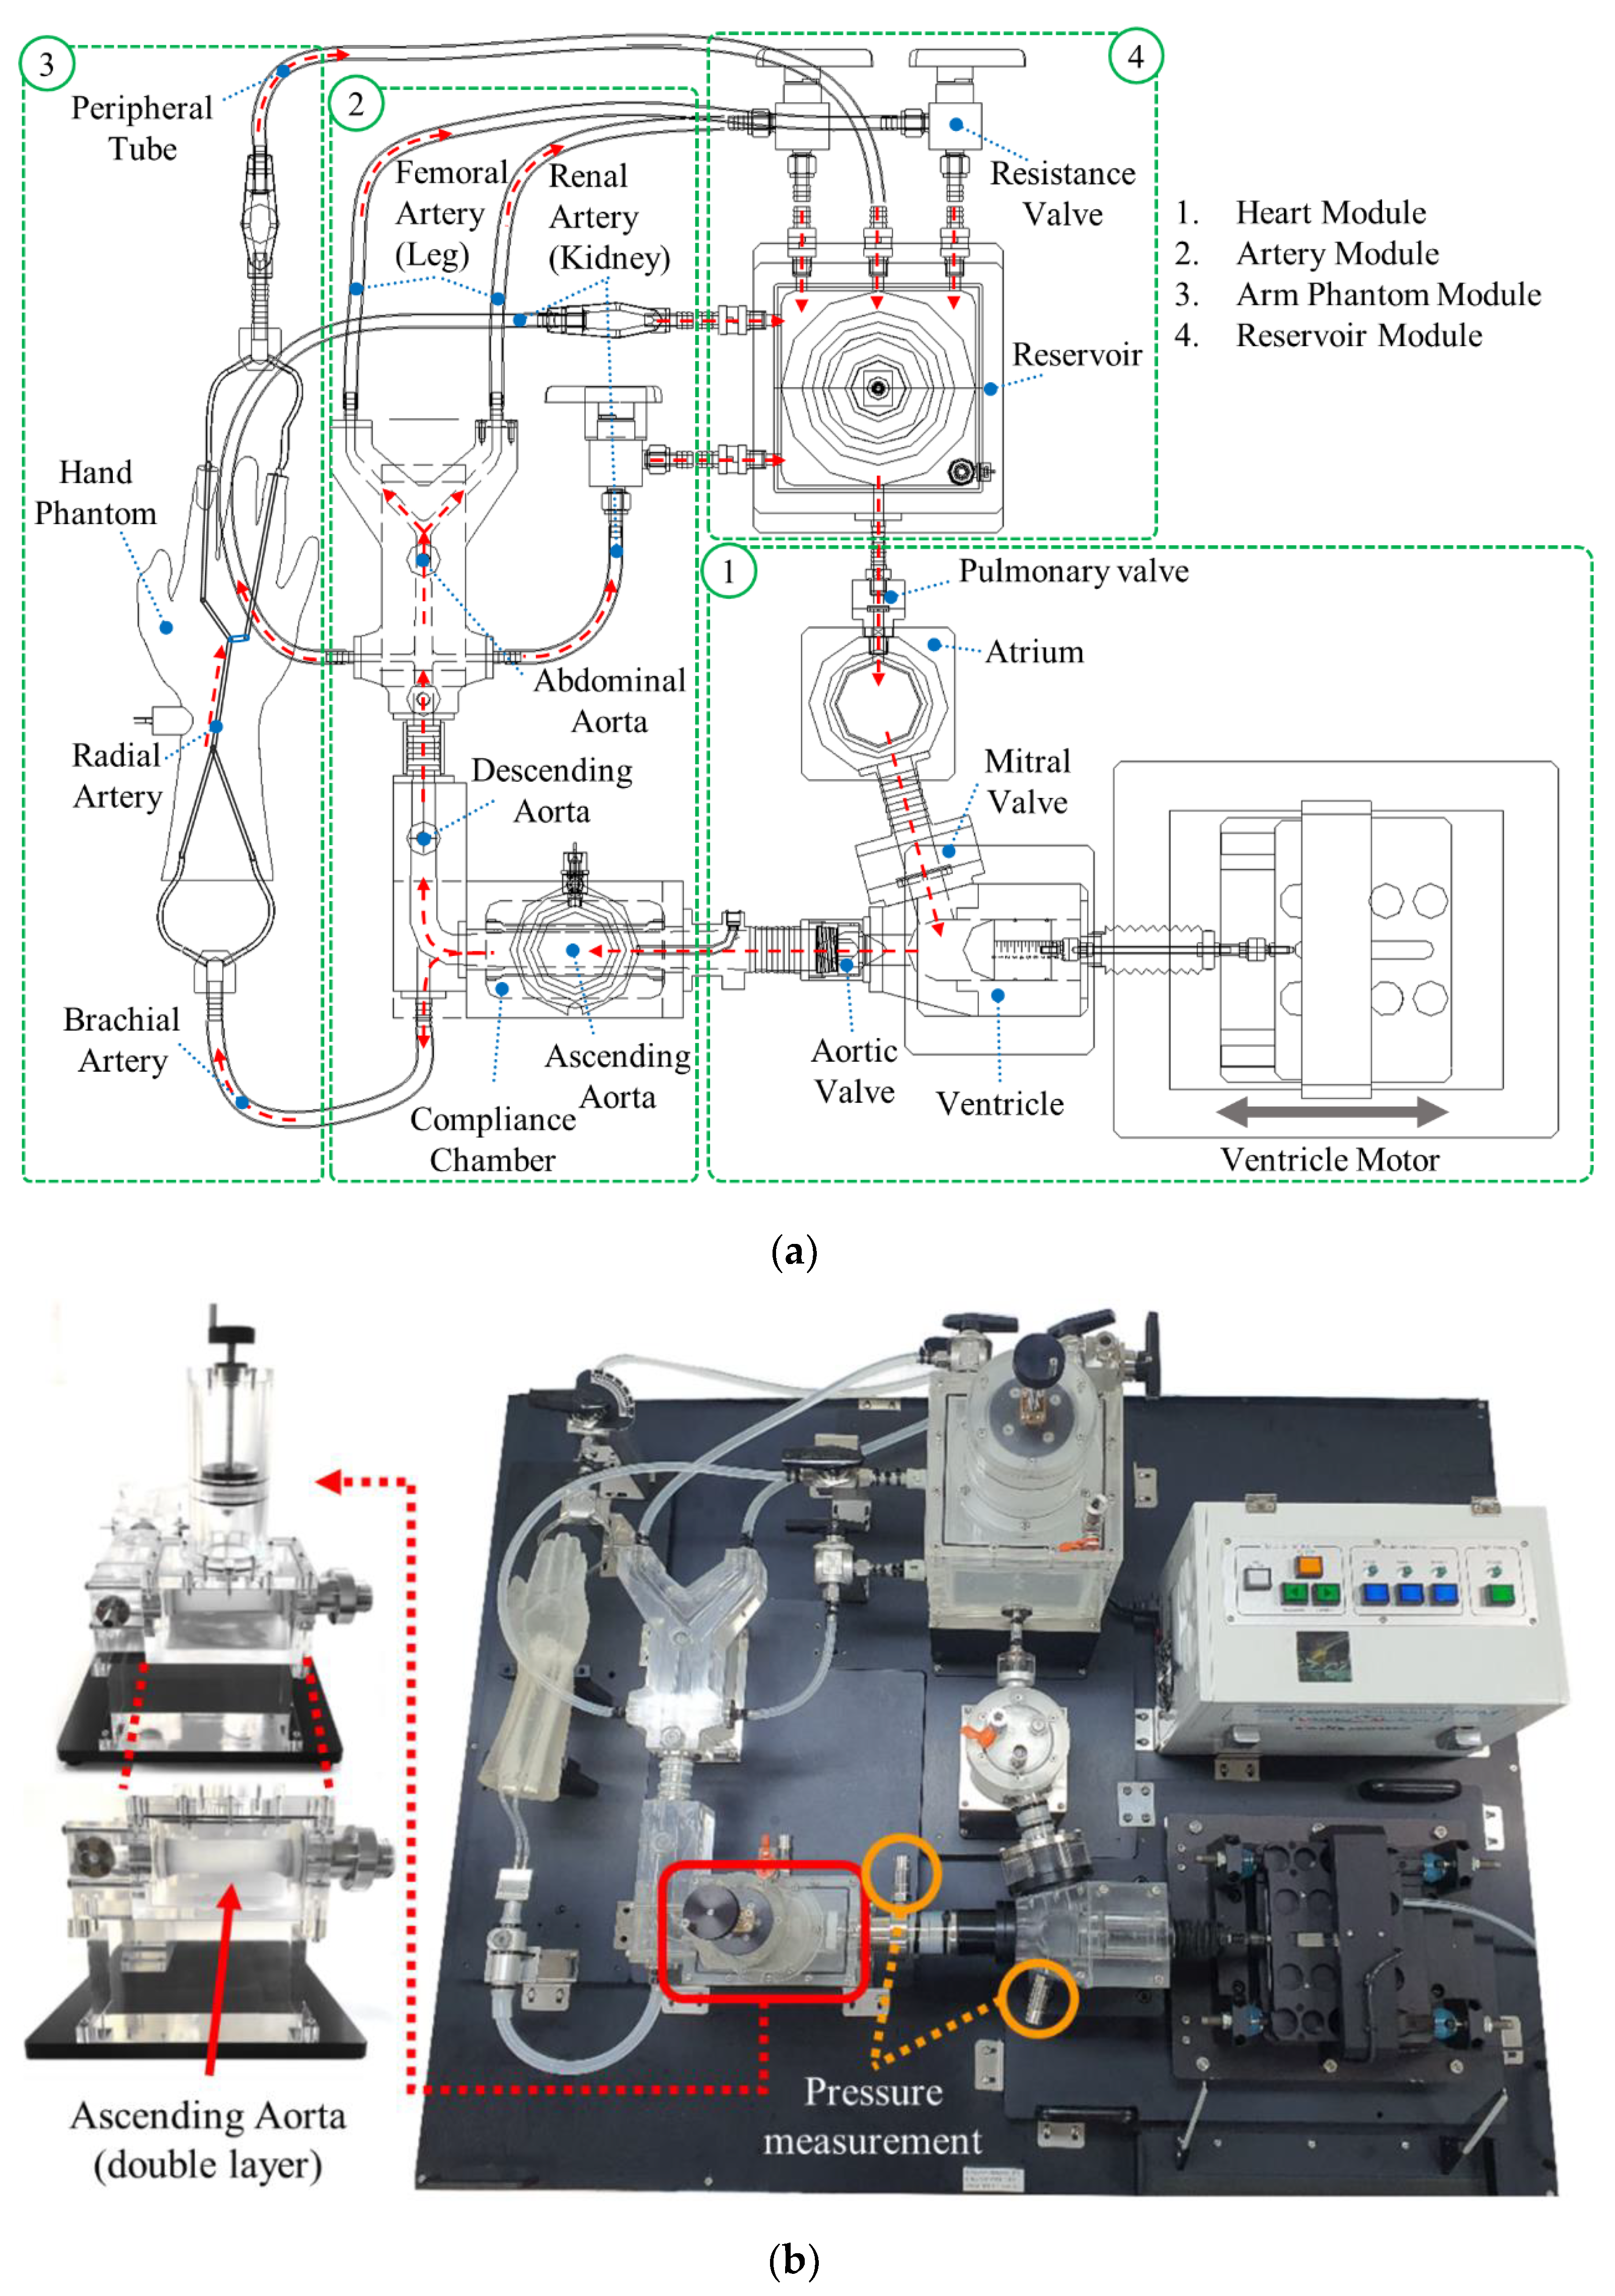
Figure 4a shows the layout of the mock circulatory platform, which consists of 4 modules. The heart module has a chamber acting as left atrium and a piston acting as left ventricle. There are valves between each component: a pulmonary valve between the reservoir and atrium, and a mitral valve between the atrium and ventricle. The fluid is pressurized in the ventricle and goes through the aortic valve to the aorta simulation module. The pulmonary valve and mitral valve are membrane valves, and the aortic valve is a check valve designed to streamline to suppress turbulence. The artery module consists of ascending, descending, and abdominal aorta, and implements a femoral artery that splits into two tubes at the branch. The reservoir module is intended to realize venous and peripheral resistance. It consists of a resistance valve mounted at the ends of tubes, including a femoral artery, and a reservoir that stores fluid. The arm phantom module and the renal artery branching to the kidney are also implemented for further detailed physiological studies.
Figure 4b shows the fabricated new mock circulatory platform. The aortic components, except the ascending aorta, are made of rigid acrylic to suppress compliance. This is to perform a more precise parametric study by allowing adjustment of compliance only in the ascending aorta to which the compliance chamber is applied.
Pressure measurements are made at two points: ventricle and ascending aorta. This is to measure the input pressure waveform to which the fluid is pressurized and the aortic pressure waveform transmitted through the aortic valve. Pressure waveforms at the ventricular pump and ascending aorta are measured with the PST164 pressure sensor from EFE (Ivry-la-Bataille, France) and sampled with 1 kHz sampling rate by the USB-6003 data acquisition device from NI (Austin, TX, USA). A linear motor was used as the ventricular pump, and it was controlled by the SPiiPlusCMnt motor controller from ACS motion control (Israel). The control cycle is 100 Hz, and acceleration up to 5 g is possible. Throughout this study, the fluid inside the system was assumed as pure water, with density and viscosity . A low-frequency filter was applied to the measured pressure waveform, since impulsive noise is generated when the aortic valve closes. However, the dicrotic notch was also suppressed along with valve closing noise.
3.3. Adjustable Components of Mock Circulatory Platform
The new mock circulatory platform of this study can change parameters for physiological study. As the blood pressure waveform is reproduced in the windkessel model, parameters such as stiffness and resistance of the components must be adjustable in order to control the waveform. The pressurizing cylinder applied to the reservoir adjusts the minimum pressure of the platform. The compliance of the platform is adjustable in ascending aorta. It is adjusted through a pressurizing cylinder in the compliance chamber applied to the ascending aorta.
Figure 5a shows the reservoir with a pressurizing cylinder and
Figure 5b shows the compliance chamber with a pressurizing cylinder at the ascending aorta, which are included in the new mock circulatory platform of this study. To change the compliance, the most effective way is to change the material of vascular wall with different compliances, but this is very inconvenient to be realized. Hence, as an alternative, the reservoir structure, as shown in
Figure 5a, has been used to realize the change of compliance in the existing cardiovascular simulators [
12,
13,
14,
15]. In the existing simulators, fluid in the reservoir is pressurized by the air spring on the top of it to try to change the compliance. However, the amount of compliance change was not enough to generate effective pulse pressure changes to be detected in the palpation training. Rather, it changes the minimum pressure of the entire system in a very sensitive way.
In this study, to magnify the pulse pressure, as shown in
Figure 5b, a vascular wall of ascending aorta made of flexible silicone is added, which is pressurized by the air spring surrounding it to try to change the compliance. Therefore, the compliance of the vascular wall in the platform is actually adjusted. Using this new compliance chamber, experimental parametric study on change of compliance of aorta was done in
Section 4. Besides the compliance of the vascular wall, the peripheral resistance of the platform is controlled by ball valves mounted on the vein, and inertance can be controlled by changing the fluid. Among all the adjustable components, the change of compliance of the vascular wall and the resistance are considered in this study.
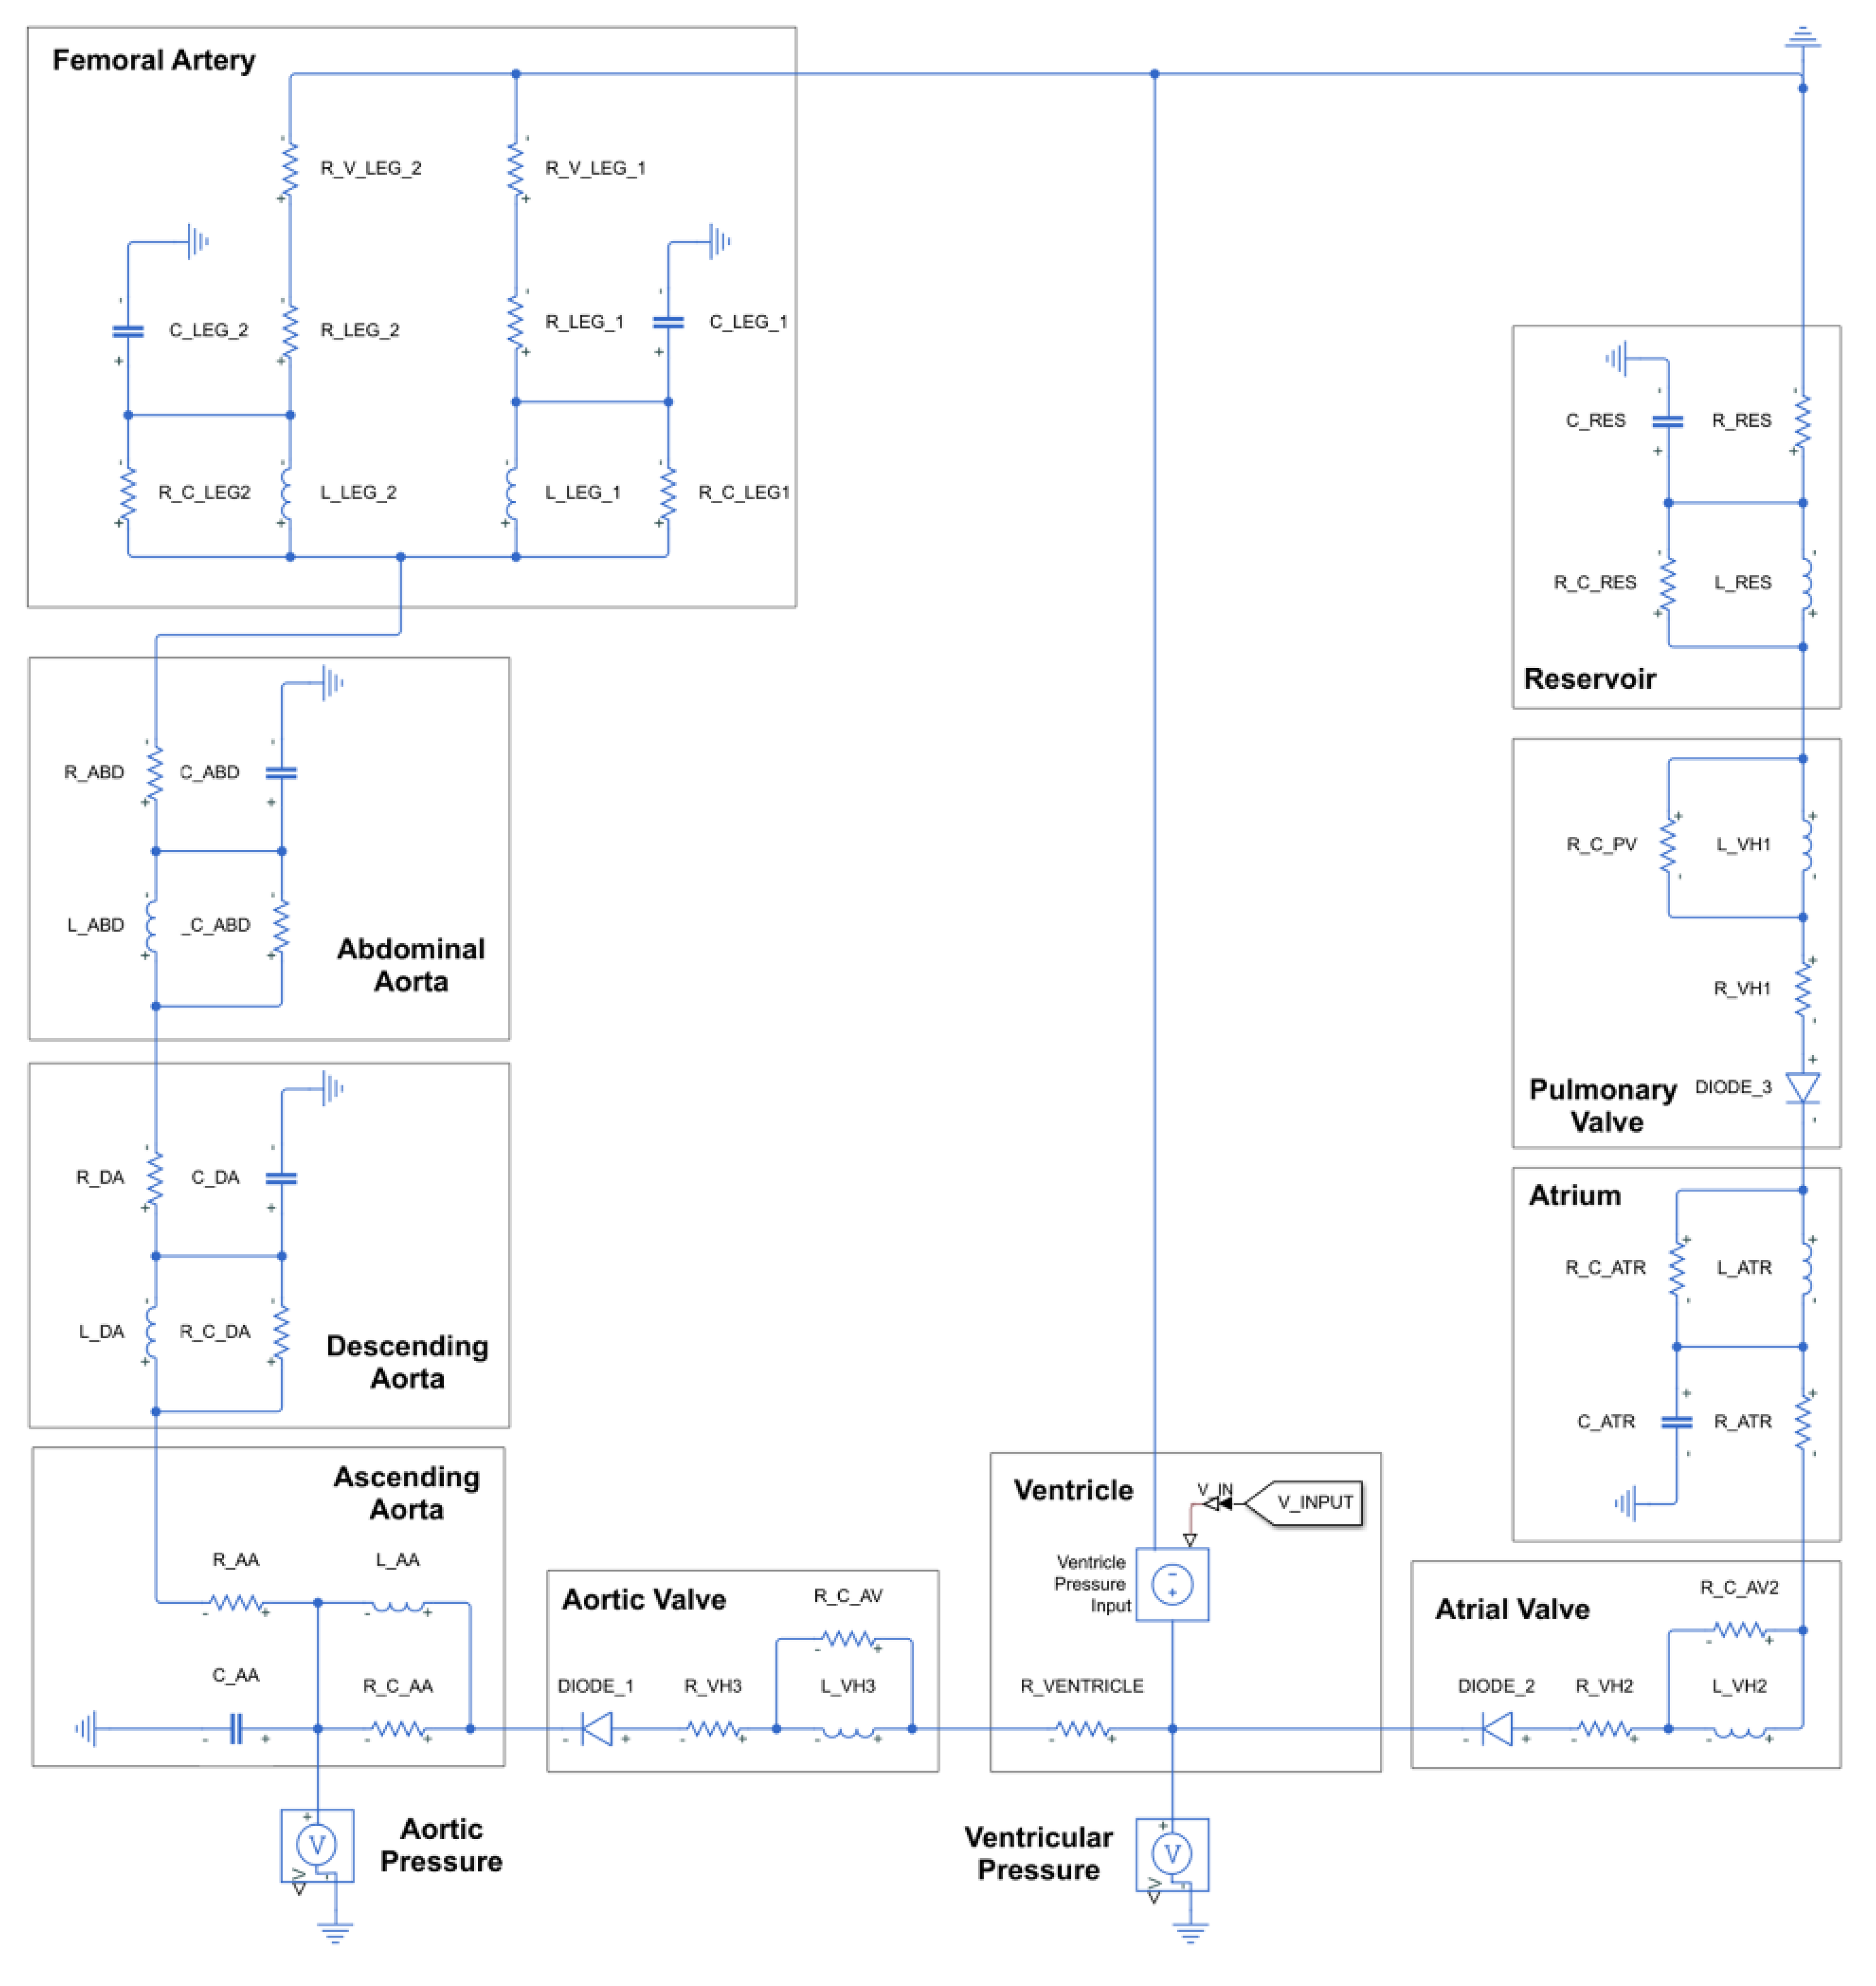
3.4. Simulation Model of Mock Circulatory Platform
Figure 6 shows the simulation model of the mock circulatory platform obtained from the same fluid–electric analogy applied to a simple model in
Figure 2 and
Figure 3, but the number of components are increased. In the modeling procedure, each component of the mock circulatory platform was lumped into a 4-element windkessel model [
23].
Table 2 lists the parameters of the components of the mock circulatory platform and corresponding electric parameters. These are data reflecting the physiology of actual human cardiovascular components. However, most of the aorta of the mock circulatory platform of this study are made of rigid acrylic, so the compliance is low compared to the human body.
Table 3 shows electrical parameters for some non-tubular components. There are non-tubular components of the mock circulatory platform, such as the reservoir, atrium, and ventricle. Electric parameter values of these components were tuned within the same order of magnitude as the vessel. Based on the above parameters, a parametric study was conducted on the simulation of the mock circulatory platform. The parametric study was performed by changing the values in 5 steps for peripheral resistance at the end of the femoral artery and compliance with ascending aorta.
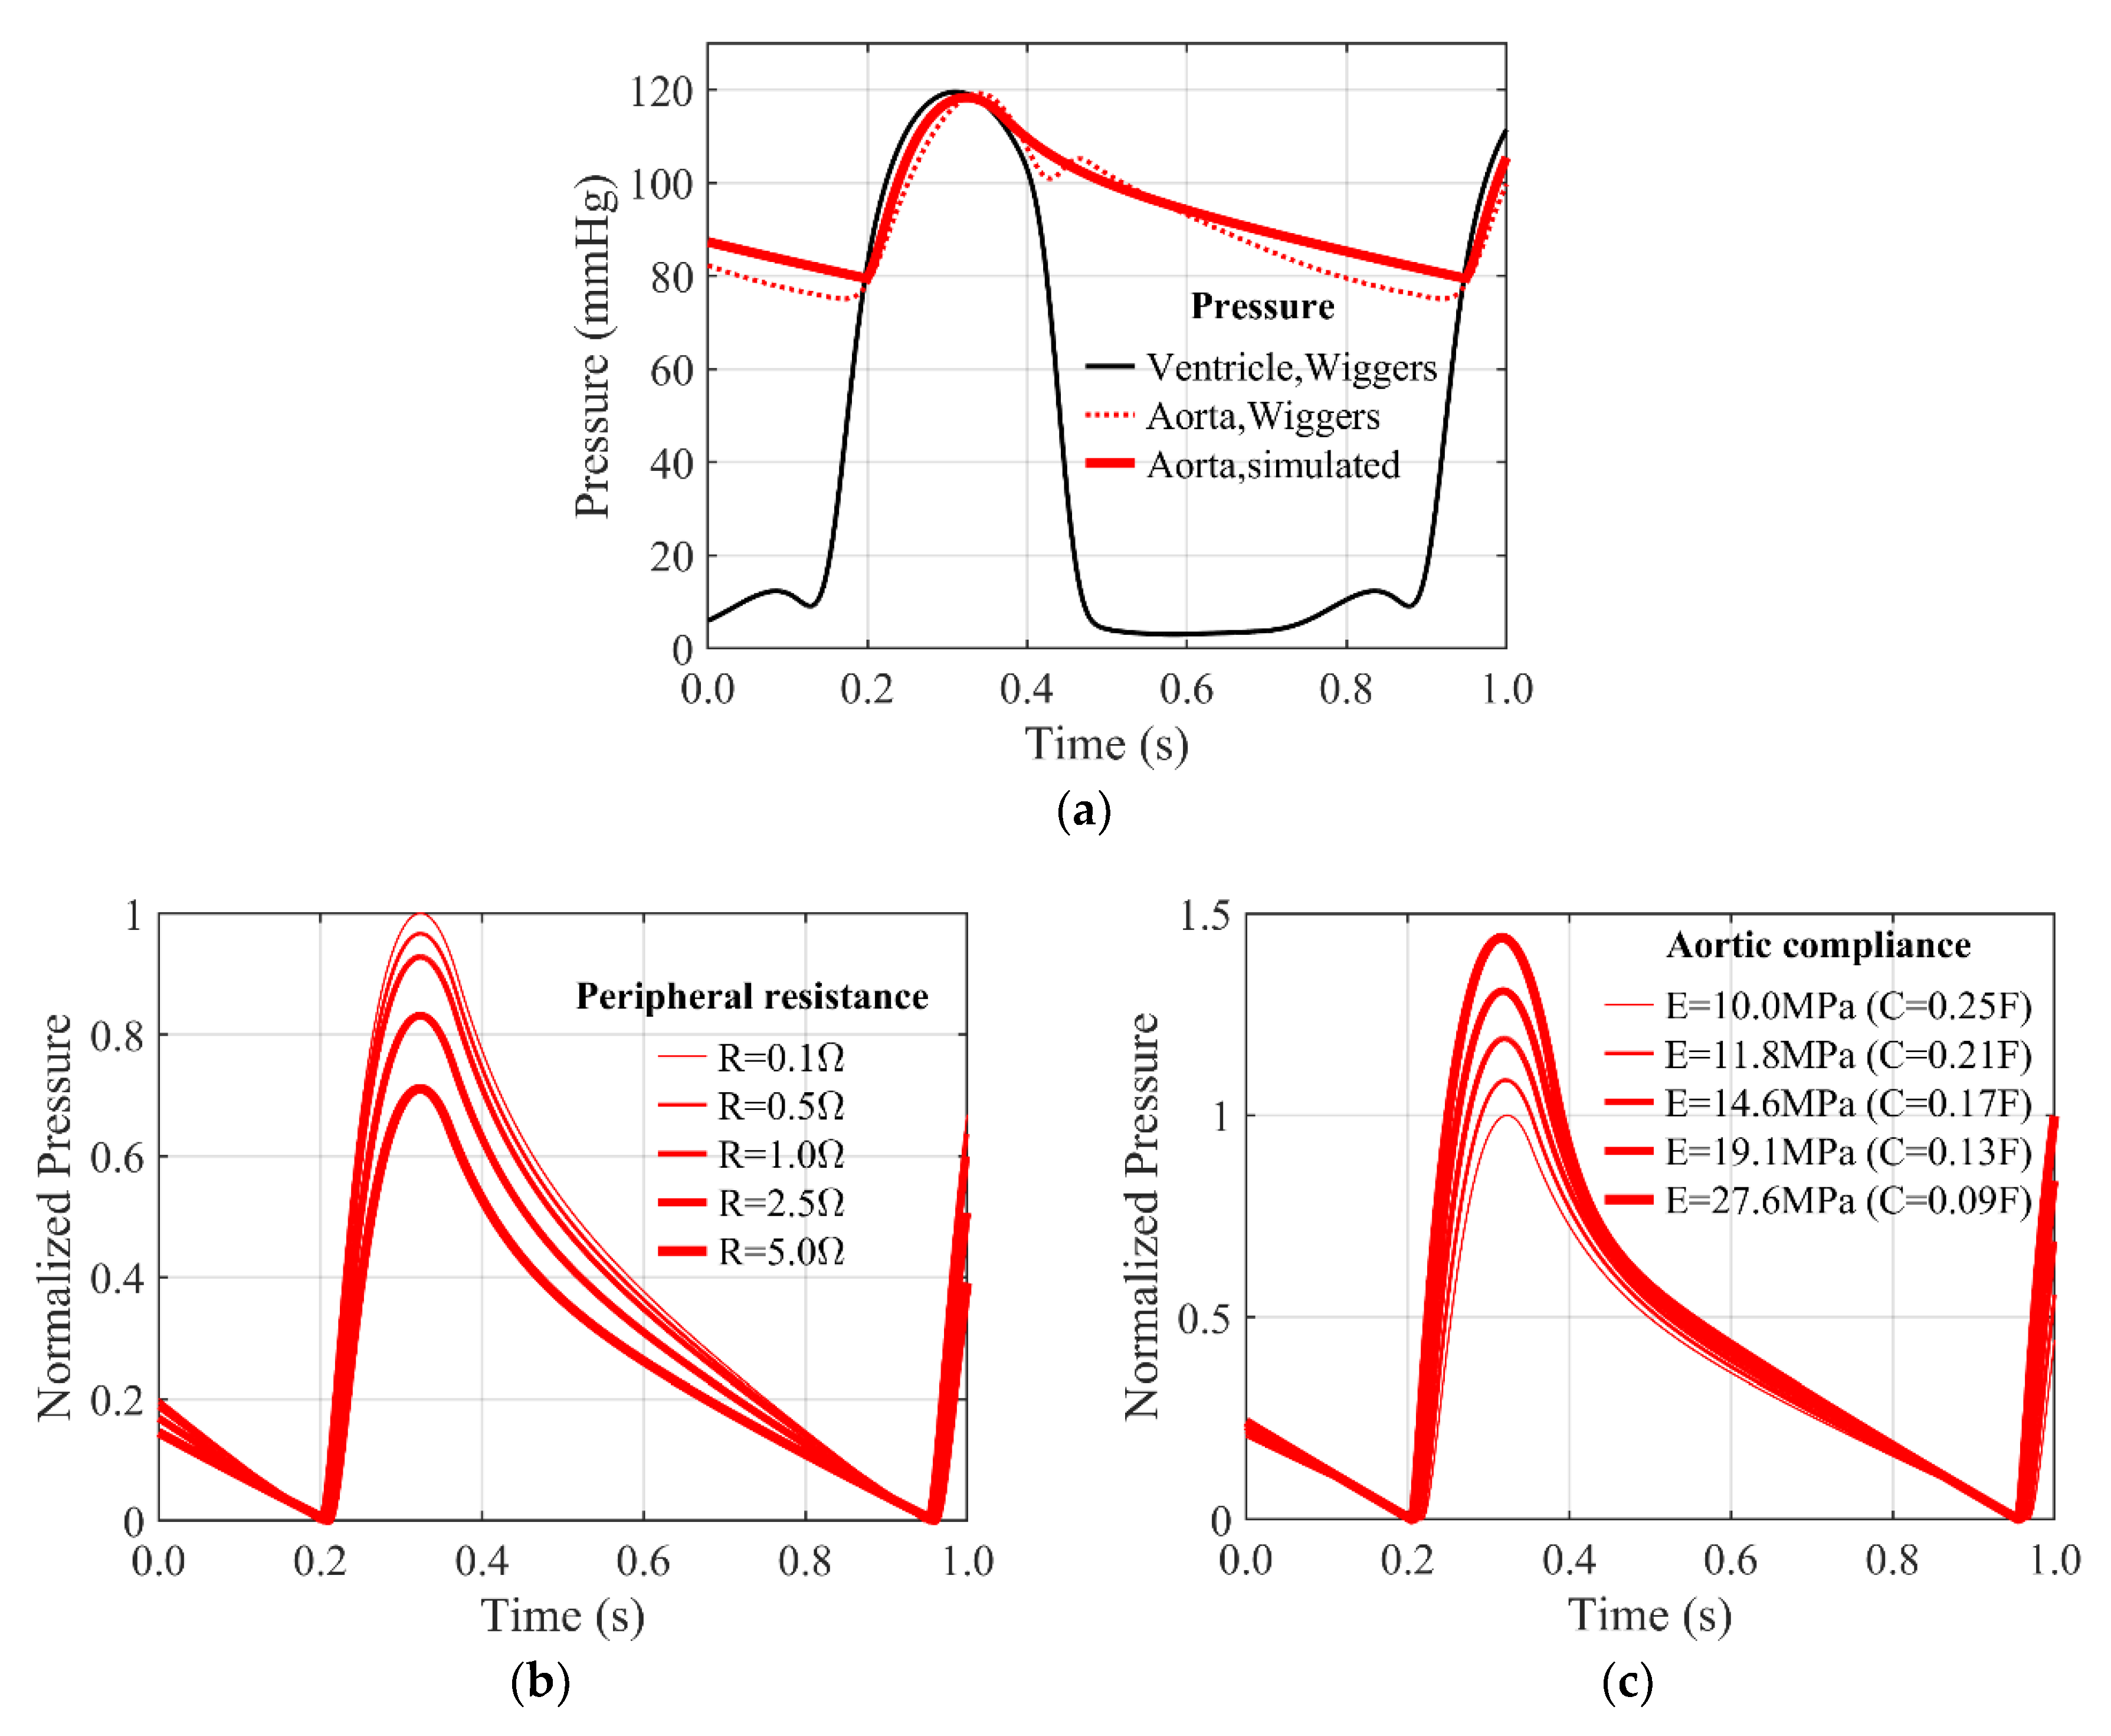
Figure 7a shows the simulation result of the mock circulatory platform. The ventricular pressure in the Wiggers diagram was used as the input to the ventricular voltage source. The simulation shows that the systolic peak and diastolic slopes are reproduced almost identically to the Wiggers diagram within the 70–120 mmHg range. However, most of the aorta of the mock circulatory platform of this study are made of rigid acrylic, so the compliance (i.e., inverse of stiffness) is very low compared to the human body. Therefore, the dicrotic notch is suppressed and difficult to be observed.
In this study, the change in pulse pressure, which is the difference between systolic and diastolic blood pressures, is examined at the aorta. For ease of comparison of pulse pressure, calculated aortic pressures were normalized to the aortic pressure in
Figure 7a, and shifted to have zero as the minimum pressure.
Figure 7b shows the normalized aortic pressure according to peripheral resistance. As a result, as the peripheral resistance increases, the pulse pressure, which is the amplitude of the aortic pressure waveform, decreases.
Figure 7c shows the normalized aortic pressure according to the change of aortic compliance. Compliance decreases inversely with increasing stiffness of the vascular wall. As a result, as the compliance of the vascular wall decreases (the stiffness of the blood vessel wall increases), the pulse pressure, which is the amplitude of the aortic pressure waveform, increases. This is the same result as the higher age; the stiffness of the vascular wall increases, the diastolic blood pressure rises, and the systolic blood pressure rises and the pulse pressure increases.
Table 4 shows the differences, advantages, and disadvantages of the platform of this study and the 4-element windkessel model through simulation. The mock circulatory platform of this study has the advantages of controlling the parameters of each artery component, measuring the pressure waveform, and reproducing accurate and detailed waveforms. However, the disadvantage is that dicrotic notches are difficult to observe due to low compliance. This can be improved by replacing other arterial components from rigid acrylics to flexible tubes.
4. Experimental Validation and Parametric Study
The mock circulatory system fabricated in this study was evaluated through experiments. As in the simulation model, pure water (tertiary distilled water) was used as the internal fluid. Peripheral resistance is controlled by changing the open area by turning the knob on the resistance valve, and aortic compliance is controlled by applying additional pressure using the compliance chamber. The experiment was performed at a normal heart rate of 80 BPM, the stroke of the ventricular pump was 10 mm, and the preload, the minimum ventricular volume, was performed at 20 mm. After initial driving, the aortic pressure was adjusted to 70–120 mmHg through the peripheral resistance valve.
4.1. Experimental Results and Validation
The fabricated mock circulatory platform can reproduce ventricular pressure waveforms and aortic pressure waveforms very similar to the Wiggers diagram, like the simulation model.
Figure 8a shows the input volume waveform of the ventricular pump. In the early systolic period, it is compressed with a biased sine wave, and in the late diastolic period, it expands with constant velocity. Systolic is 30% of the total cycle period.
Figure 8b shows the pressure waveforms measured from the fabricated mock circulatory platform. It can be seen that this matches well with the Wiggers diagram, a human standard blood pressure waveform of
Figure 1a. The angle of the resistance valve knob is 45 degrees, and the compliance chamber is in the state where no additional pressure is applied. These blood pressure waveforms and parameter conditions are used as a control for parameter studies through experiments.
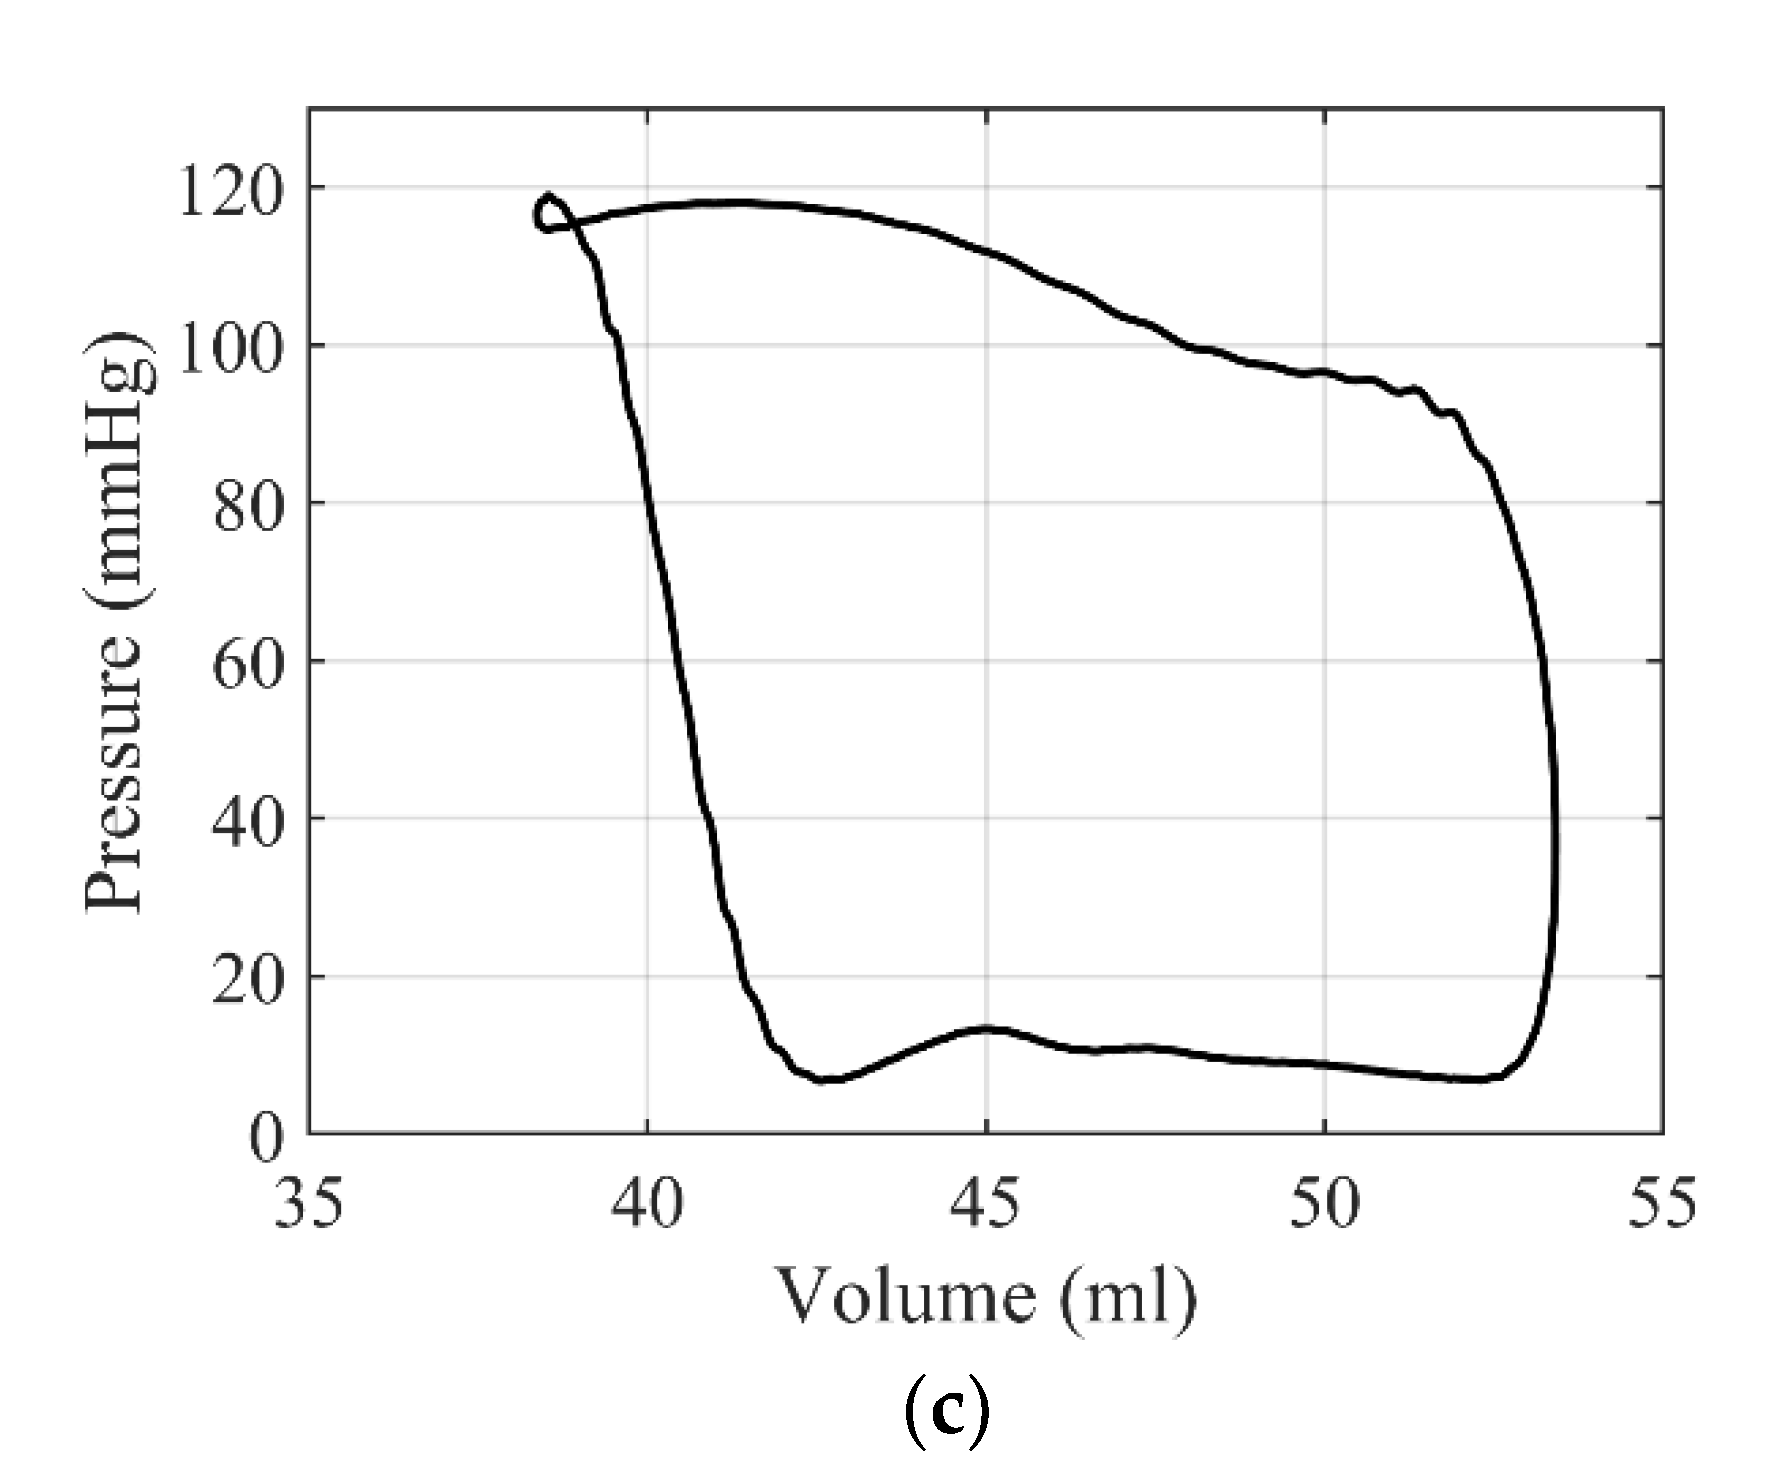
Figure 8c shows a ventricular pressure × 10—volume loop of the fabricated mock circulatory platform. This is similar to the pressure × 10—volume loop calculated from the Wiggers diagram of
Figure 1b.
However, most of the aorta are made of acrylic for parameter control in the mock circulatory platform of this study. Therefore, the dicrotic notch is very small in the aortic pressure waveform because the overall compliance is very small compared to the human body. In addition, the dicrotic notch is covered because it is generated at the same time as the valve closing noise, and is rarely observed since it is removed together with the valve closing noise by a low pass filter. Moreover, since the ventricular pump is made of rigid acrylic, unlike the human body with high compliance, the stroke volume required for blood pressure generation is small, and isovolumic compression and relaxation are impossible.
4.2. Parametric Study on Peripheral Resistance
Parametric studies of peripheral resistance were performed experimentally. The peripheral resistance is controlled through the opening angle of the resistance valve mounted on the reservoir module shown in
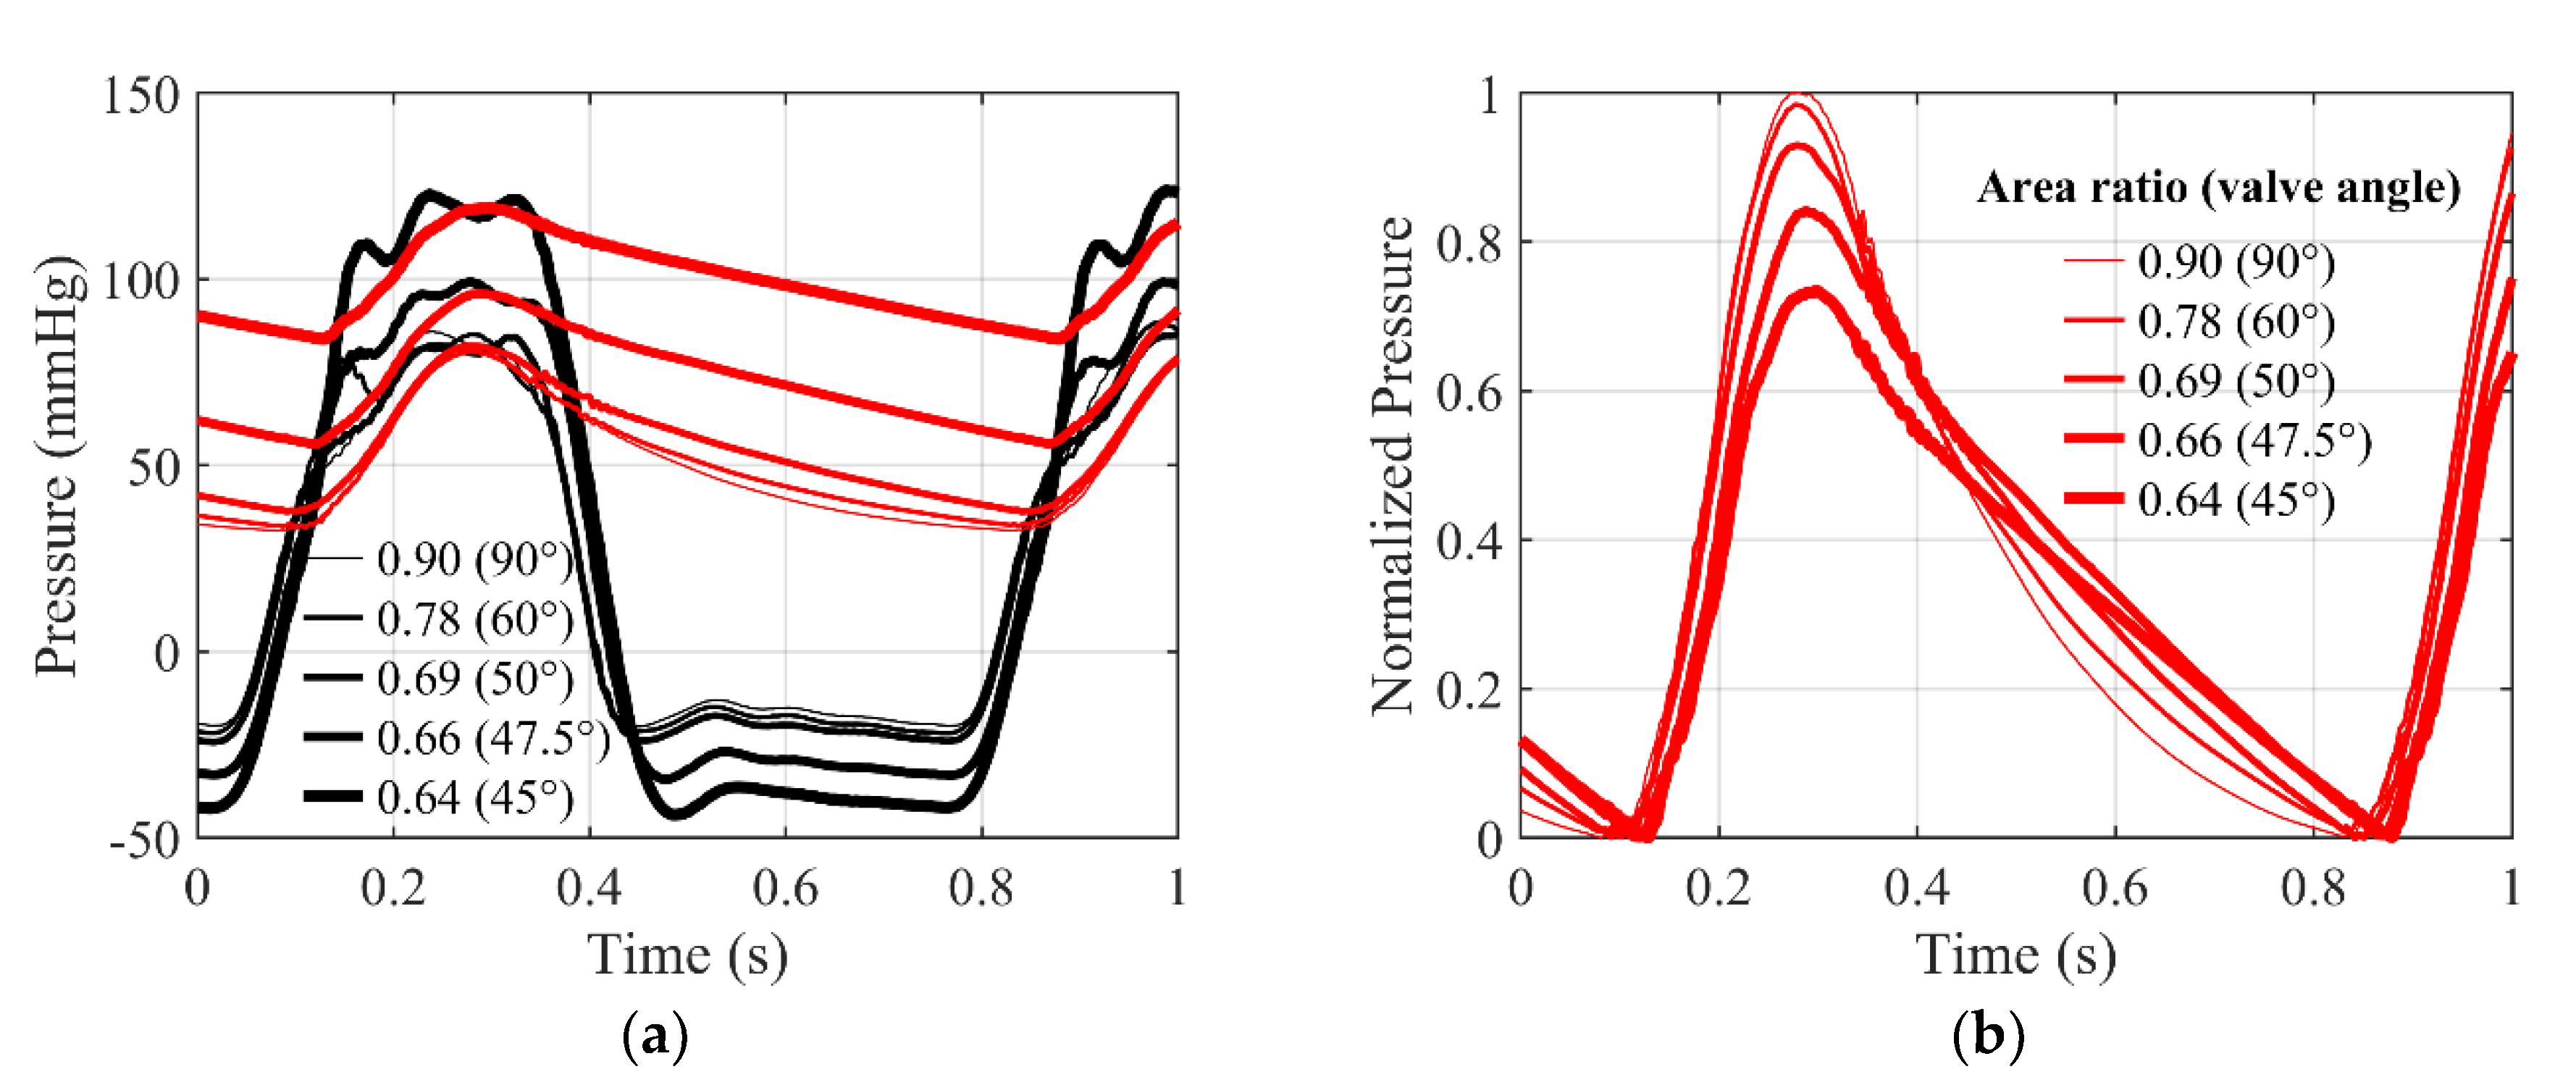
Figure 4a. The valve angle was adjusted from 90 degrees to 45 degrees over 5 steps, thereby reducing the open area ratio from 0.9 to 0.64. When the valve angle is 90 degrees, the area ratio is 0.9, the maximum, and the resistance is the minimum. As the valve angle decreases, the open area ratio decreases and the resistance increases.
Figure 9a shows pressure waveform according to area ratio. In the case of ventricular pressure, systolic pressure increases as peripheral resistance increases, diastolic pressure decreases, and as a result, peak-to-peak amplitude increases. In the case of aortic pressure, systolic pressure increases as peripheral resistance increases, diastolic pressure increases more, and as a result, peak-to-peak amplitude decreases.
Figure 9b shows the normalized aortic pressure waveform. To compare the pulse pressure, measured aortic pressures were normalized to the baseline aortic pressure in
Figure 8b, and shifted to have zero as the minimum value. As the valve angle decreases, the area ratio decreases and the peripheral resistance increases. At the same time, it can be seen that the pulse pressure decreases. This is consistent with the change in pulse pressure according to the peripheral resistance predicted through the simulation model of
Figure 7b. Therefore, the mock circulatory platform of this study can reproduce the blood pressure waveform according to the peripheral resistance.
4.3. Parametric Study on Aortic Compliance
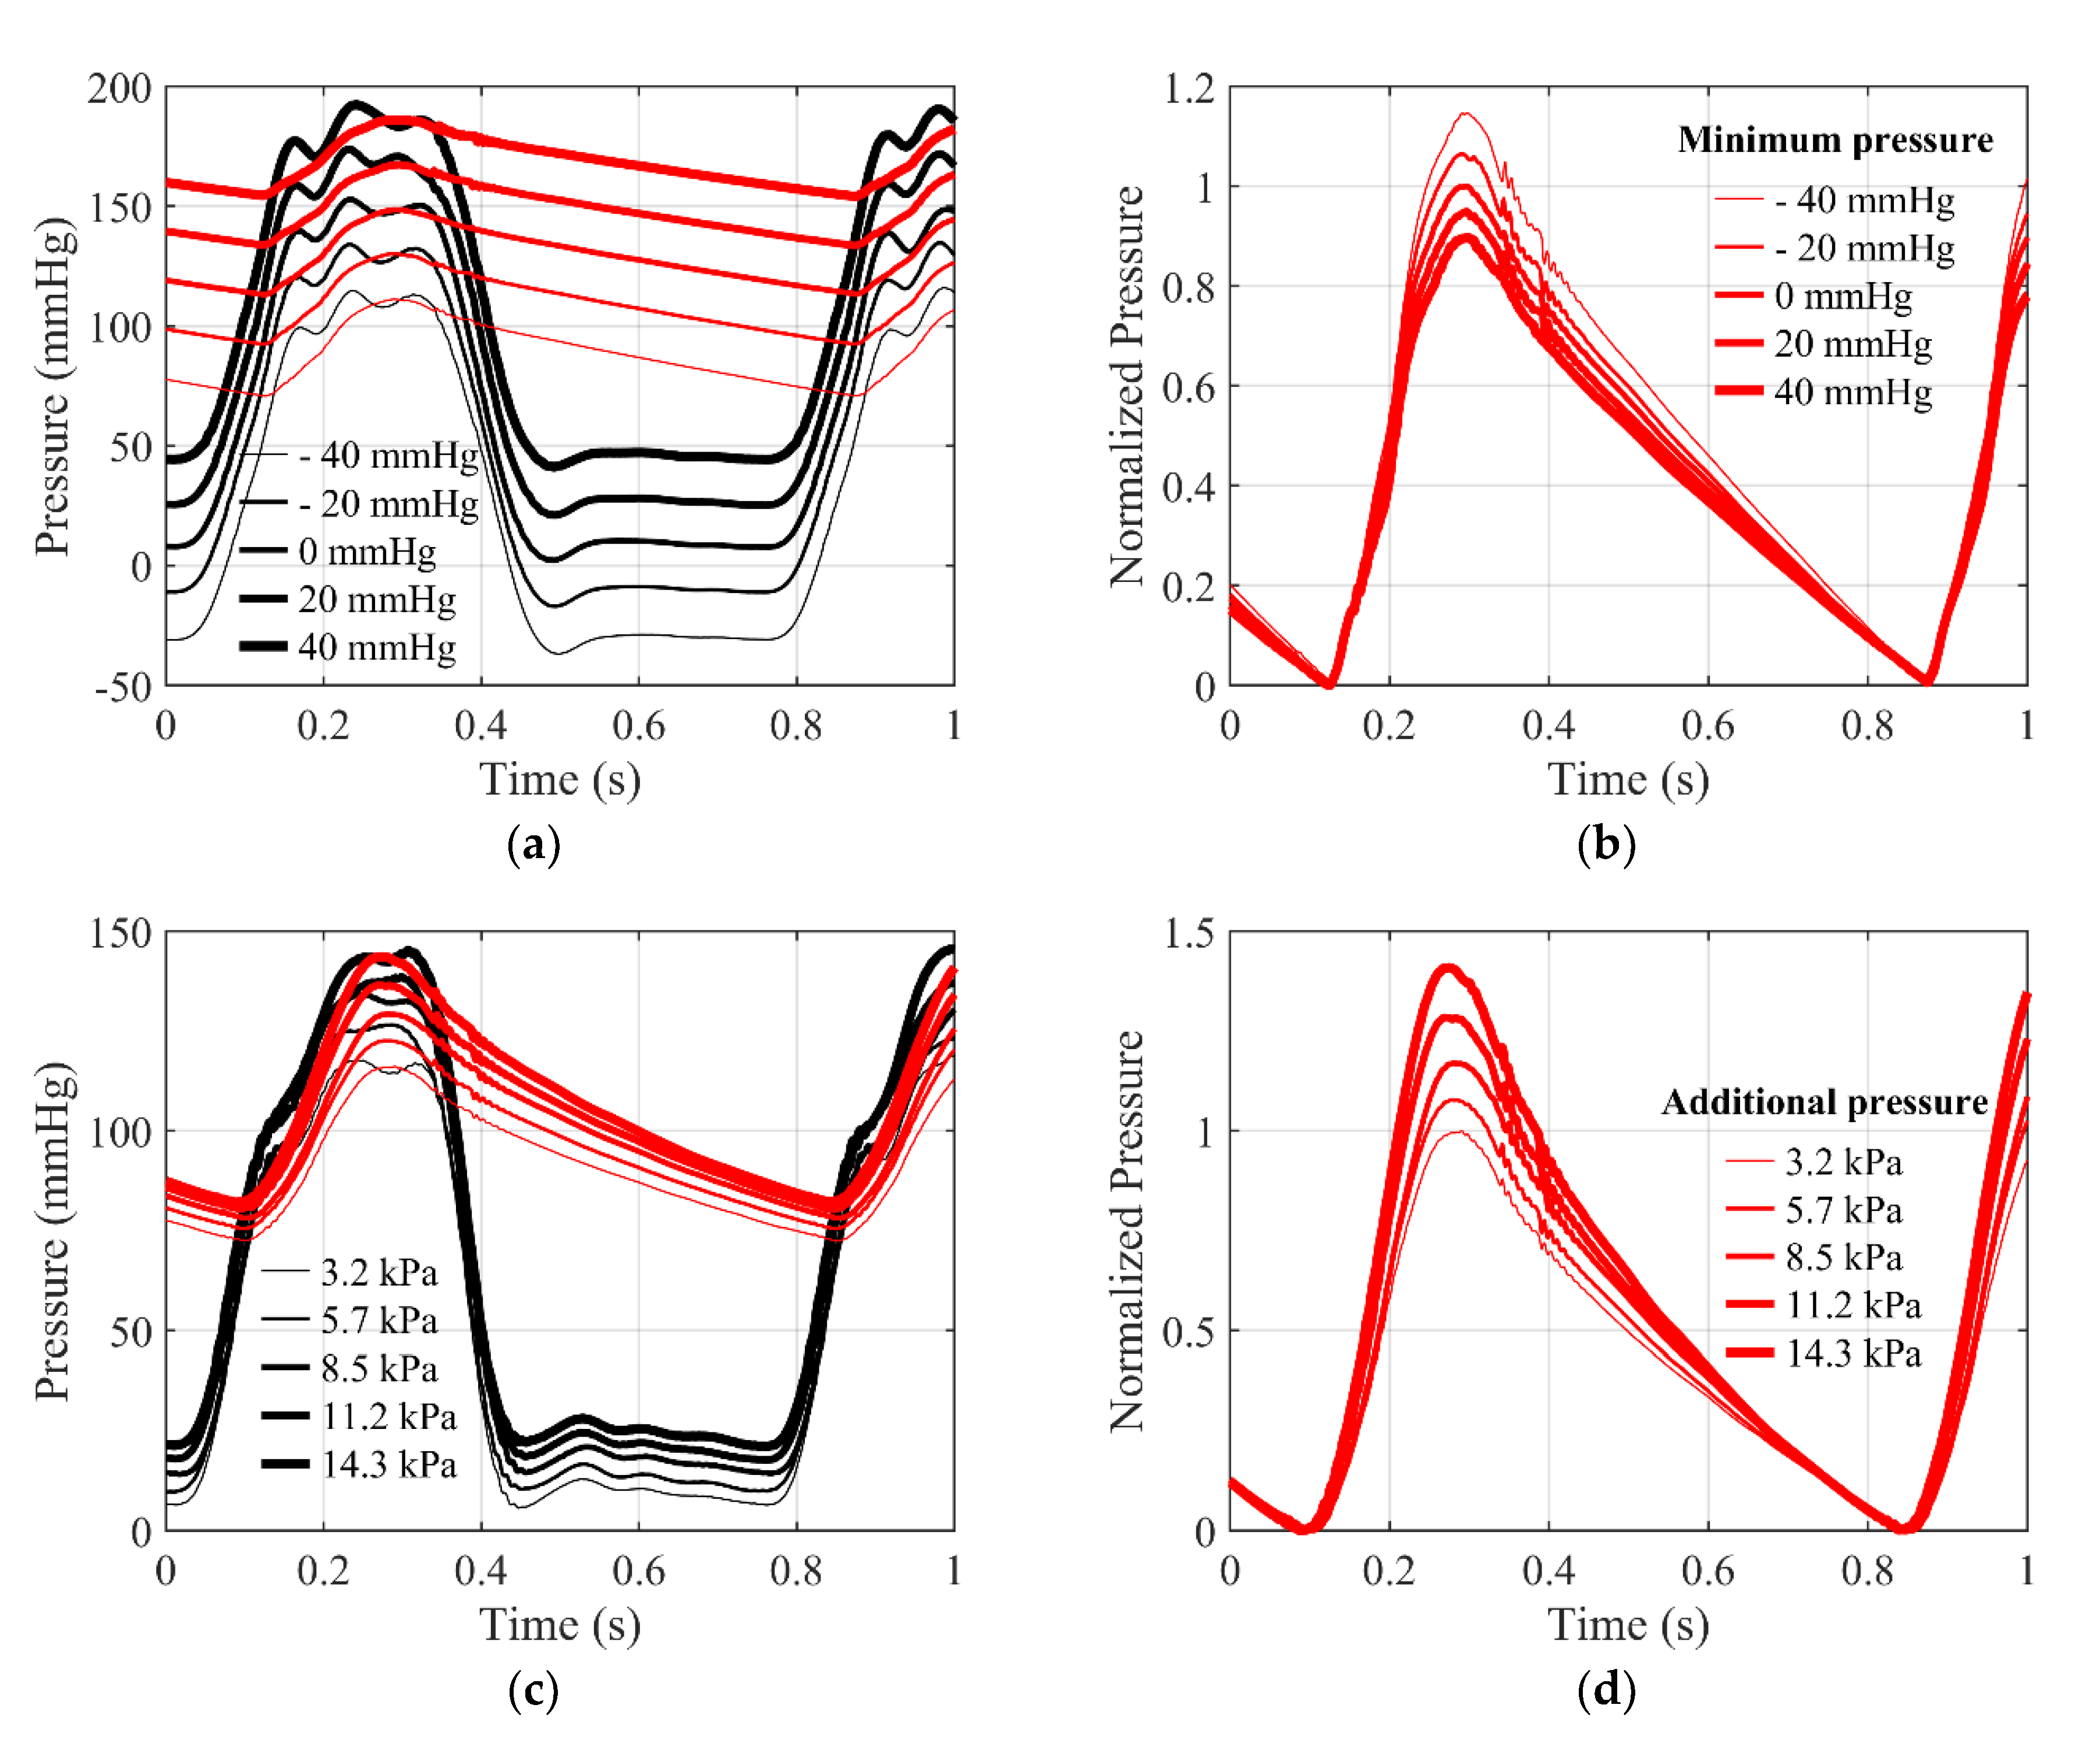
Parametric studies of aortic compliance were performed experimentally. In this paper, aortic compliance is controlled by pressurization of the compliance chamber applied to the ascending aorta. The pressurized additional pressure was adjusted from 3.2 kPa to 14.3 kPa over 5 steps. The air inside the compliance chamber pressurizes the ascending aorta with a pressurizing cylinder and indirectly increases the stiffness of the vascular wall. Therefore, as additional pressure increases, stiffness increases, and inversely, compliance decreases. In addition, the method of directly pressurizing the fluid, the way existing cardiovascular simulators control compliance, was compared with. This is the same as the method of adjusting the minimum pressure through the reservoir in the mock circulatory platform of this study, and is hereinafter referred to as the reservoir method. The reservoir method also adjusted the minimum pressure from −40 mmHg to 40 mmHg over 5 steps.
Figure 10a shows the pressure waveform according to the minimum pressure of the reservoir method, which is how the existing cardiovascular simulator controls compliance. As a result of the experiment, as the minimum pressure of the reservoir increased, diastolic pressure and systolic pressure increased in both the ventricle and the aorta. The amount of diastolic and systolic growth is similar and appears to move parallel.
Figure 10b shows the normalized aortic pressure waveforms. To compare the pulse pressures, measured aortic pressures were normalized to the baseline aortic pressure in
Figure 8b, and shifted to have zero as the minimum pressure. Theoretically, as the minimum pressure of the reservoir increases, the fluid inside the blood vessel is indirectly pressurized, the stiffness applied to the fluid increases, and it can be predicted that the compliance decreases. According to the simulation model in
Figure 7c, it can be predicted that the pulse pressure will increase. However, as a result of the experiment, pulse pressure decreased according to increases in the minimum pressure of the reservoir. This is the opposite of the change in pulse pressure according to the aortic compliance predicted through the simulation model.
Figure 10c shows the pressure waveform according to the additional pressure. As a result of the experiment, diastolic and systolic blood pressure increased in both the ventricle and the aorta as the additional pressure in the compliance chamber increased. The increase in systolic pressure is greater than the increase in diastolic pressure, resulting in an increase in peak-to-peak amplitude.
Figure 10d shows a normalized aortic pressure waveform. To compare the pulse pressure, measured aortic pressures were normalized to the baseline aortic pressure in
Figure 8b, and shifted to have zero as the minimum value. As expected, as the additional pressure in the compliance chamber increases, stiffness of the vascular wall increases indirectly, and compliance decreases. As a result of the experiment, pulse pressure increased according to increasing the additional pressure of the compliance chamber. This is consistent with the change in pulse pressure according to the aortic compliance predicted through the simulation model in
Figure 7c. Therefore, the mock circulatory platform of this study can reproduce the blood pressure waveform according to aortic compliance by applying a new compliance chamber.
5. Conclusions
In this study, the new mock circulatory platform was designed, fabricated and evaluated to overcome the limitations that existing simulators do not reflect the actual physiology of the cardiovascular system. The new mock circulatory platform was designed based on the physiology of each component, whose key parameters such as resistance and compliance can be adjusted. From the evaluation through the simulation model and experimental measurements, the mock circulatory platform can effectively reproduce the blood pressure waveform close to the Wiggers diagram, which represents the human body standard. In addition, parametric studies on the aortic compliance and the peripheral resistance were performed. The fabricated mock circulatory platform showed very close pressure waveforms in both cases of the simulation model and experimental measurement results. A new method for controlling the compliance of the aorta was suggested in this study. Previous studies have regulated the compliance by pressurizing the fluid with an air spring, increasing the pressure of the entire system but not actually the changing the compliance. On the other hand, the new compliance chamber exerts the pressure on the outer wall of the ascending aorta, changing the compliance of the wall. The result showed the same trend as in the simulation model, implying that the mock circulatory platform of this study can reproduce blood pressure waveforms based on the physiology of each component. The designed platform can generate a controllable pressure waveform based on the physiology of the cardiovascular system, and it can be applied to test the accuracy of the blood pressure measurement devices. It can also be used as a haptic actuator/simulator for palpation training. The platform of this study can be applied to the reproduction of various palpation feedbacks such as aortic waveforms that need to be carefully handled during surgery and femoral arterial waveforms during catheterization.
However, except the ascending aorta of the proposed platform, other aortas are made of rigid acrylic, which has less compliance than the human body. In the future, the cardiovascular components other than the ascending aorta can be updated with flexible tubes and new compliance chambers in this study, to fully simulate the human cardiovascular system and reproduce the same or various blood pressure waveforms as in the Wiggers diagram. Based on the proposed platform, the brachial and radial arteries will be added for palpation training of healthcare professionals in future works.
Author Contributions
Conceptualization, Y.-M.K., J.K., S.-Y.W., T.-H.Y. and Y.-H.P.; methodology, T.-H.Y. and Y.-H.P.; software, J.-H.J. and T.-H.Y.; validation, B.L., J.H. and J.-H.J.; formal analysis, B.L., J.H. and J.-H.J.; investigation, B.L., J.H. and J.-H.J.; resources, B.L., T.-H.Y. and Y.-H.P.; data curation, B.L., J.H. and J.-H.J.; writing—original draft preparation, B.L. and J.-H.J.; writing—review and editing, T.-H.Y. and Y.-H.P.; visualization, B.L., J.-H.J., T.-H.Y. and Y.-H.P.; supervision, T.-H.Y. and Y.-H.P.; project administration, T.-H.Y. and Y.-H.P.; funding acquisition, Y.-M.K., J.K., S.-Y.W., T.-H.Y. and Y.-H.P. All authors have read and agreed to the published version of the manuscript.
Funding
This research received no external funding.
Acknowledgments
This work was supported by “Human Resources Program in Energy Technology” of the Korea Institute of Energy Technology Evaluation and Planning (KETEP), granted financial resources from the Ministry of Trade, Industry & Energy, Republic of Korea. (No.20204030200050). This research was supported by a research grant (KSN2012110) from the Korea Institute of Oriental Medicine.
Conflicts of Interest
The authors declare no conflict of interest.
References
- Vander Poorten, E.; Demeester, E.; Lammertse, P. Haptic feedback for medical applications, a survey. In Proceedings of the Actuator, Bremen, Germany, 18–20 July 2012; pp. 519–525. [Google Scholar]
- Hu, J.; Chang, C.Y.; Tardella, N.; Pratt, J.; English, J. Effectiveness of haptic feedback in open surgery simulation and training systems. Stud. Health Technol. Inform. 2006, 119, 213–218. [Google Scholar] [PubMed]
- Condino, S.; Viglialoro, R.M.; Fani, S.; Bianchi, M.; Morelli, L.; Ferrari, M.; Bicchi, A.; Ferrari, V. Tactile augmented reality for arteries palpation in open surgery training. In Proceedings of the International Conference on Medical Imaging and Augmented Reality; Springer: Cham, Switzerland, 2016; Volume 9805 LNCS, pp. 186–197. [Google Scholar] [CrossRef]
- Li, M.; Luo, S.; Nanayakkara, T.; Seneviratne, L.D.; Dasgupta, P.; Althoefer, K. Multi-fingered haptic palpation using pneumatic feedback actuators. Sens. Actuators A Phys. 2014, 218, 132–141. [Google Scholar] [CrossRef]
- Ullrich, S.; Kuhlen, T. Haptic palpation for medical simulation in virtual environments. IEEE Trans. Vis. Comput. Graph. 2012, 18, 617–625. [Google Scholar] [CrossRef] [PubMed]
- Coles, T.R.; John, N.W.; Gould, D.; Caldwell, D.G. Integrating haptics with augmented reality in a femoral palpation and needle insertion training simulation. IEEE Trans. Haptics 2011, 4, 199–209. [Google Scholar] [CrossRef] [PubMed]
- Esper, S.A.; Pinsky, M.R. Arterial waveform analysis. Best Pract. Res. Clin. Anaesthesiol. 2014, 28, 363–380. [Google Scholar] [CrossRef] [PubMed]
- Kohara, K.; Tabara, Y.; Tomita, H.; Nagai, T.; Igase, M.; Miki, T. Clinical usefulness of the second peak of radial systolic blood pressure for estimation of aortic systolic blood pressure. J. Hum. Hypertens. 2009, 23, 538–545. [Google Scholar] [CrossRef] [Green Version]
- Yang, T.H.; Jo, G.; Koo, J.H.; Woo, S.Y.; Kim, J.U.; Kim, Y.M. A compact pulsatile simulator based on cam-follower mechanism for generating radial pulse waveforms. Biomed. Eng. Online 2019, 18, 1–18. [Google Scholar] [CrossRef] [PubMed] [Green Version]
- Pulsatile Blood Pumps. Available online: https://www.harvardapparatus.com/pumps-liquid-handling/pulsatile-blood-pumps/pulsatile-blood-pumps.html (accessed on 20 June 2020).
- Endovascular Simulator Creates Physiological Pulsatile Flow and Pressures. Available online: https://vivitrolabs.com/product/endovascular-ev-simulator/ (accessed on 20 June 2020).
- Legendre, D.; Fonseca, J.; Andrade, A.; Biscegli, J.F.; Manrique, R.; Guerrino, D.; Prakasan, A.K.; Ortiz, J.P.; Lucchi, J.C. Mock circulatory system for the evaluation of left ventricular assist devices, endoluminal prostheses, and vascular diseases. Artif. Organs 2008, 32, 461–467. [Google Scholar] [CrossRef] [PubMed]
- Zannoli, R.; Corazza, I.; Branzi, A. Mechanical simulator of the cardiovascular system. Phys. Med. 2009, 25, 94–100. [Google Scholar] [CrossRef] [PubMed]
- Yokoyama, Y.; Kawaguchi, O.; Shinshi, T.; Steinseifer, U.; Takatani, S. A new pulse duplicator with a passive fill ventricle for analysis of cardiac dynamics. J. Artif. Organs 2010, 13, 189–196. [Google Scholar] [CrossRef] [PubMed]
- Brum, J.; Bia, D.; Benech, N.; Balay, G.; Armentano, R.; Negreira, C. Set up of a cardiovascular simulator: Application to the evaluation of the dynamical behavior of atheroma plaques in human arteries. Phys. Procedia 2010, 3, 1095–1101. [Google Scholar] [CrossRef] [Green Version]
- Yang, T.H.; Kim, J.U.; Kim, Y.M.; Koo, J.H.; Woo, S.Y. A New Blood Pulsation Simulator Platform Incorporating Cardiovascular Physiology for Evaluating Radial Pulse Waveform. Available online: https://www.hindawi.com/journals/jhe/2019/4938063/ (accessed on 20 June 2020).
- Mitchell, J.R.; Wang, J.J. Expanding application of the Wiggers diagram to teach cardiovascular physiology. Adv. Physiol. Educ. 2015, 38, 170–175. [Google Scholar] [CrossRef] [PubMed] [Green Version]
- Kokalari, I.; Karaja, T.; Guerrisi, M. Review on lumped parameter method for modeling the blood flow in systemic arteries. J. Biomed. Sci. Eng. 2013, 6, 92–99. [Google Scholar] [CrossRef] [Green Version]
- Stergiopulos, N.; Westerhof, B.E.; Meister, J.-J.; Westerhof, N. The four-element windkessel model. Annu. Int. Conf. IEEE Eng. Med. Biol. Proc. 1996, 4, 1715–1716. [Google Scholar] [CrossRef]
- Rideout, V.C.; Dick, D.E. Difference-Differential Equations for Fluid Flow in Distensible Tubes. IEEE Transac. Biomed. Eng. 1967, BME-14, 171–177. [Google Scholar] [CrossRef] [PubMed]
- Nichols, W.W.; O’Rourke, M.F.; Vlachopoulos, C.; Hoeks, A.P.; Reneman, R.S. McDonald’s Blood Flow in Arteries: Theoretical, Experimental and Clinical Principles; CRC Press: Boca Raton, FL, USA, 2011; ISBN 9781444128789. [Google Scholar]
- Su, J.; Manisty, C.; Simonsen, U.; Howard, L.S.; Parker, K.H.; Hughes, A.D.; Su, J. Pulmonary artery wave propagation and reservoir function in conscious man: Impact of pulmonary vascular disease, respiration and dynamic stress tests. Authors. J. Physiol. C 2017, 595, 6463–6476. [Google Scholar] [CrossRef] [PubMed]
- Casas, B.; Lantz, J.; Viola, F.; Cedersund, G.; Bolger, A.F.; Carlhäll, C.J.; Karlsson, M.; Ebbers, T. Bridging the gap between measurements and modelling: A cardiovascular functional avatar. Sci. Rep. 2017, 7, 1–15. [Google Scholar] [CrossRef] [Green Version]
© 2020 by the authors. Licensee MDPI, Basel, Switzerland. This article is an open access article distributed under the terms and conditions of the Creative Commons Attribution (CC BY) license (http://creativecommons.org/licenses/by/4.0/).

 ,
, 


 : ventricular pressure,
  : aortic pressure; (b) normalized aortic pressure waveform according to valve angle.

 : ventricular pressure,
  : aortic pressure; (b) normalized aortic pressure waveform according to minimum pressure of the reservoir method; (c) measured pressure waveforms according to additional pressure of the new compliance chamber,
  : ventricular pressure,
  : aortic pressure; (d) normalized aortic pressure waveform according to additional pressure of the new compliance chamber.

