Article

A Comparison of “Bottom-Up” and “Top-Down” Approaches to the Synthesis of Pt/C Electrocatalysts

1
Technological Department, Platov South-Russian State Polytechnic University (NPI), 346428 Novocherkassk, Russia
2
Department of Physical Materials Science, National University of Science and Technology “MISiS”, 119049 Moscow, Russia
3
Physical Department, Southern Federal University, 344090 Rostov-on-Don, Russia
*
Author to whom correspondence should be addressed.
Processes 2020, 8(8), 947; https://doi.org/10.3390/pr8080947
Submission received: 6 May 2020 / Revised: 22 July 2020 / Accepted: 28 July 2020 / Published: 6 August 2020
(This article belongs to the Special Issue Synthesis and Application of Nano- and Microdispersed Systems)

Abstract

:
Three 40 wt % Pt/C electrocatalysts prepared using two different approaches—the polyol process and electrochemical dispersion of platinum under pulse alternating current—and a commercial Pt/C catalyst (Johnson Matthey prod.) were examined via X-ray diffraction (XRD) and transmission electron microscopy (TEM). The stability characteristics of the Pt/C catalysts were studied via long-term cycling, revealing that, for all cycling modes, the best stability was achieved for the Pt/C catalyst with the largest platinum nanoparticle sizes, which was synthesized via electrochemical dispersion of platinum under pulse alternating current. Our results show that the mass and specific electrocatalytic activities of Pt/C catalysts toward ethanol electrooxidation are determined by the value of the electrochemically active Pt surface area in the catalysts.

1. Introduction

A vast amount of global experience has so far been accumulated in the creation of electrocatalytic materials for solid polymer fuel elements. In particular, elucidating the effect of composition and type (platinum or platinum-free systems) of catalyst [1,2], size and content of electroactive particles [3], composition and structure of support [4,5], and parameters that determine the performance of the catalyst at the nanolevel, i.e., adsorption site structure [6] or the presence of metal nanoparticle defects [7], on the efficiency of materials involved in the electrocatalytic processes running in proton exchange membrane fuel cells (PEMFCs) is within the scope of many relevant works.
In addition to the long-term study of platinum-free electrocatalytic systems [1,8,9], attempts are still being made to reduce the platinum content in the materials via the creation of composites, where platinum is partly replaced with a base metal (alloys or core–shell structures) [10,11,12]. So, real PEMFCs still operate on pure Pt/С catalysts with a large amount (40 wt % or higher) of platinum. The above parameters that determine the performance of the electrocatalytic material can be varied by making relevant changes in the synthesis route. Currently, Pt/C electrocatalysts can be obtained using two main approaches. The first is the so-called “bottom-up” approach, where platinum nanoparticles are produced via the chemical reduction of platinum ions to metal Pt particles using impregnation and microemulsion methods [13]. The other is represented by the “top-down” ways, where the formation of platinum particles is achieved by the fragmentation of bulk platinum to nanosized particles. Among these methods are ball-milling and laser ablation [14]. In other words, all top-down methods today are based primarily on physical phenomena. The use of chemical (or electrochemical) top-down methods for the synthesis of metal nanoparticles and, especially, supported nanocatalysts is a rather rare phenomenon. Although the influence of the synthesis conditions of Pt-based catalysts on their electrocatalytic activity has already been investigated in some works [15,16], only impregnation and microemulsion approaches were taken into account for this goal; that is, two chemical bottom-up methods were compared. Thus, in the present work, the properties of Pt/C catalysts obtained by two methods, which are both chemical but belong to the two different groups of methods (a top-down approach and a bottom-up approach), are compared for the first time.

2. Materials and Methods

2.1. Chemicals

In the presented work, the following chemicals and materials were used: hexachloroplatinic acid hexahydrate, H2[PtCl6]·6H2O (ACS reagent, ≥37.50% Pt basis, Merck KGa, Darmstadt, Germany); sodium borohydride, NaBH4 (ReagentPlus®, 99%, Sigma-Aldrich, USA); sodium hydroxide, NaOH (BioXtra, ≥98%, Sigma-Aldrich, St. Louis, Mo., USA); ethylene glycol, C2H6O2 (ReagentPlus®, ≥99%, Sigma-Aldrich, USA); sulfuric acid, H2SO4 (99.999%, Sigma-Aldrich, USA); ethanol, CH3CH2OH (95%, Sigma-Aldrich, USA); ammonium hydroxide solution, NH4OH (ACS reagent, 28.0–30.0% NH3 basis, Sigma-Aldrich); acetone, CH3COCH3 (ACS reagent, ≥99.5%, Sigma-Aldrich, USA); platinum foil (thickness 0.5 mm, 99.99% trace metals basis, Sigma-Aldrich); and carbon, Black Vulcan XC 72R (Fuel Cell Store ©, College Station, TX, USA). Nafion™ perfluorinated resin, aqueous dispersion (10 wt % in H2O, eq. wt. 1000), was also used. All solutions were prepared fresh daily in deionized water (purified by a Milli-Q water system).

2.2. Synthesis of Pt/C via the Polyol Process

A carbon support with a weight of 0.2 g and H2[PtCl6]·6H2O solution were added to an ethylene glycol/water (75 mL/30 mL) organic mixture. The carbon support concentration in the electrolyte solution was 2 g L−1. The suspension of carbon support in NaOH solution was homogenized under ultrasound for 30 min. An aqueous ammonium solution was then added dropwise to achieve a solution pH of 11; the mixture was stirred in a magnetic stirrer for another 30 min. After that, 15 mL of a freshly prepared 0.5М NaBH4 solution was introduced under constant stirring (200 rpm); the mixture was then stirred for 50 min. At the end of the synthesis, the suspension was filtered and washed repeatedly with acetone and distilled water to achieve a neutral pH value. The powdered electrocatalyst was dried at a temperature of 75 °C until constant weight was reached. The catalyst obtained by the polyol process was marked as sample “CH”.

2.3. Synthesis of Pt/C via EDPAC

Synthesis of Pt/C via the electrochemical dispersion pulsed alternating current (EDPAC) technique was carried out as follows. Two electrodes made of Pt foil, each with a surface area of 6 cm2, were placed into the electrolyzer with Vulcan XC-72 carbon support suspended in 2M NaOH aqueous solution. The carbon support concentration in the electrolyte solution was 2 g L−1. The suspension of carbon support in the NaOH solution was stirred and cooled to 45–50 °C before synthesis. During the synthesis, a pulsed alternating current with a density of 1 A/cm2 (frequency 50 Hz) was applied to the platinum electrodes to disperse them into metal nanoparticles, as described in a previous work [17]. The synthesis was carried out with constant stirring (200 rpm). The metal loading in the catalyst was controlled via the synthesis time. At the end of the synthesis, the suspension was filtered and rinsed with distilled water to achieve a neutral pH value. The electrocatalyst powder was then dried at a temperature of 75 °C until constant weight was accomplished. The catalyst obtained by the EDPAC method was marked as sample “ED”.
The platinum content in the synthesized Pt/C catalysts determined by thermogravimetry analysis.

2.4. Physical Characterization

Thermogravimetric measurements were made on a Mettler Toledo TGA/DSC 1 in the range of 303–1073 K at a heating rate of 10 K/min under an air atmosphere.
The X-ray diffraction (XRD) data were collected on a Bragg−Brentano D8 Advance Bruker laboratory diffractometer (40 kV/30 mA Cu Kα radiation) equipped with a lynxEye XE detector. The diffractograms were recorded in the angular range 2θ = 20–90 angle at a scan rate of 0.18 angle/min, with an accumulation time of 5 s per spectrogram. A standard powdered LaB6 sample (NISTSRM660a) was used to find the instrumental resolution function. The structural and microstructural characteristics of the composites were determined using the Rietveld refinement technique with two sets of linear combinations of spherical harmonics for the Laue class m3m. The background was simulated with 2θ−6 coefficients of a polynomial function.
The measurements via transmission electron microscopy were made by means of a JEOL JEM 1400 microscope at an accelerating voltage of 120 kV in the light field. The phase composition of powders was determined from the electron diffraction patterns that were indexed using the crystallographic database. Samples were prepared via dispersion in ethanol and exposed to ultrasound for 10 min. A droplet with suspended particles was applied onto copper meshes covered with a carbon film (Holey Carbon Grid). Once the alcohol had evaporated, the meshes were placed in the microscope for further analysis.

2.5. Electrochemical Measurements

All electrochemical measurements were made using a standard three-electrode cell. A working electrode was made following a technique described in a previous work [17]. A platinum wire was used as the counter electrode, and an Ag/AgCl electrode was the reference electrode, although all potentials in the study are given relative to a reversible hydrogen electrode (RHE). The voltages were recalculated relative to the RHE using the Nernst equation and preliminarily measuring the pH values of the solutions used in the experiments.
The electrochemically active surface area (ECSA) was evaluated via CO stripping. The СО adsorption was performed in a pre-deaerated background electrolyte (0.5 M H2SO4) at E = 0.3 V. The ECSA was calculated with respect to the charge used in СОads oxidation, given the fact that its value to oxidize a monolayer of CO adsorbed on Pt is equal to 420 μC cm−2.
The electrocatalytic activity of the Pt/C catalysts was determined via cycling voltammetry through ethanol electrochemical oxidation (0.5 M H2SO4 + 0.5 M EtOH). To characterize the specific activity, the current was correlated with the electrochemically active surface area (cm2) of platinum. The operation stability of the Pt/C electrocatalysts was evaluated via multiple cycling in 0.5М H2SO4 in obedience to stress testing modes [18,19], and the relevant data are listed in Table 1.
The microstructural and electrochemical characteristics of the ED and CH Pt/C catalysts were compared with those of a commercial 40 wt % Pt/C catalyst (Johnson Matthey) that was marked as sample “JM”.

3. Results and Discussion

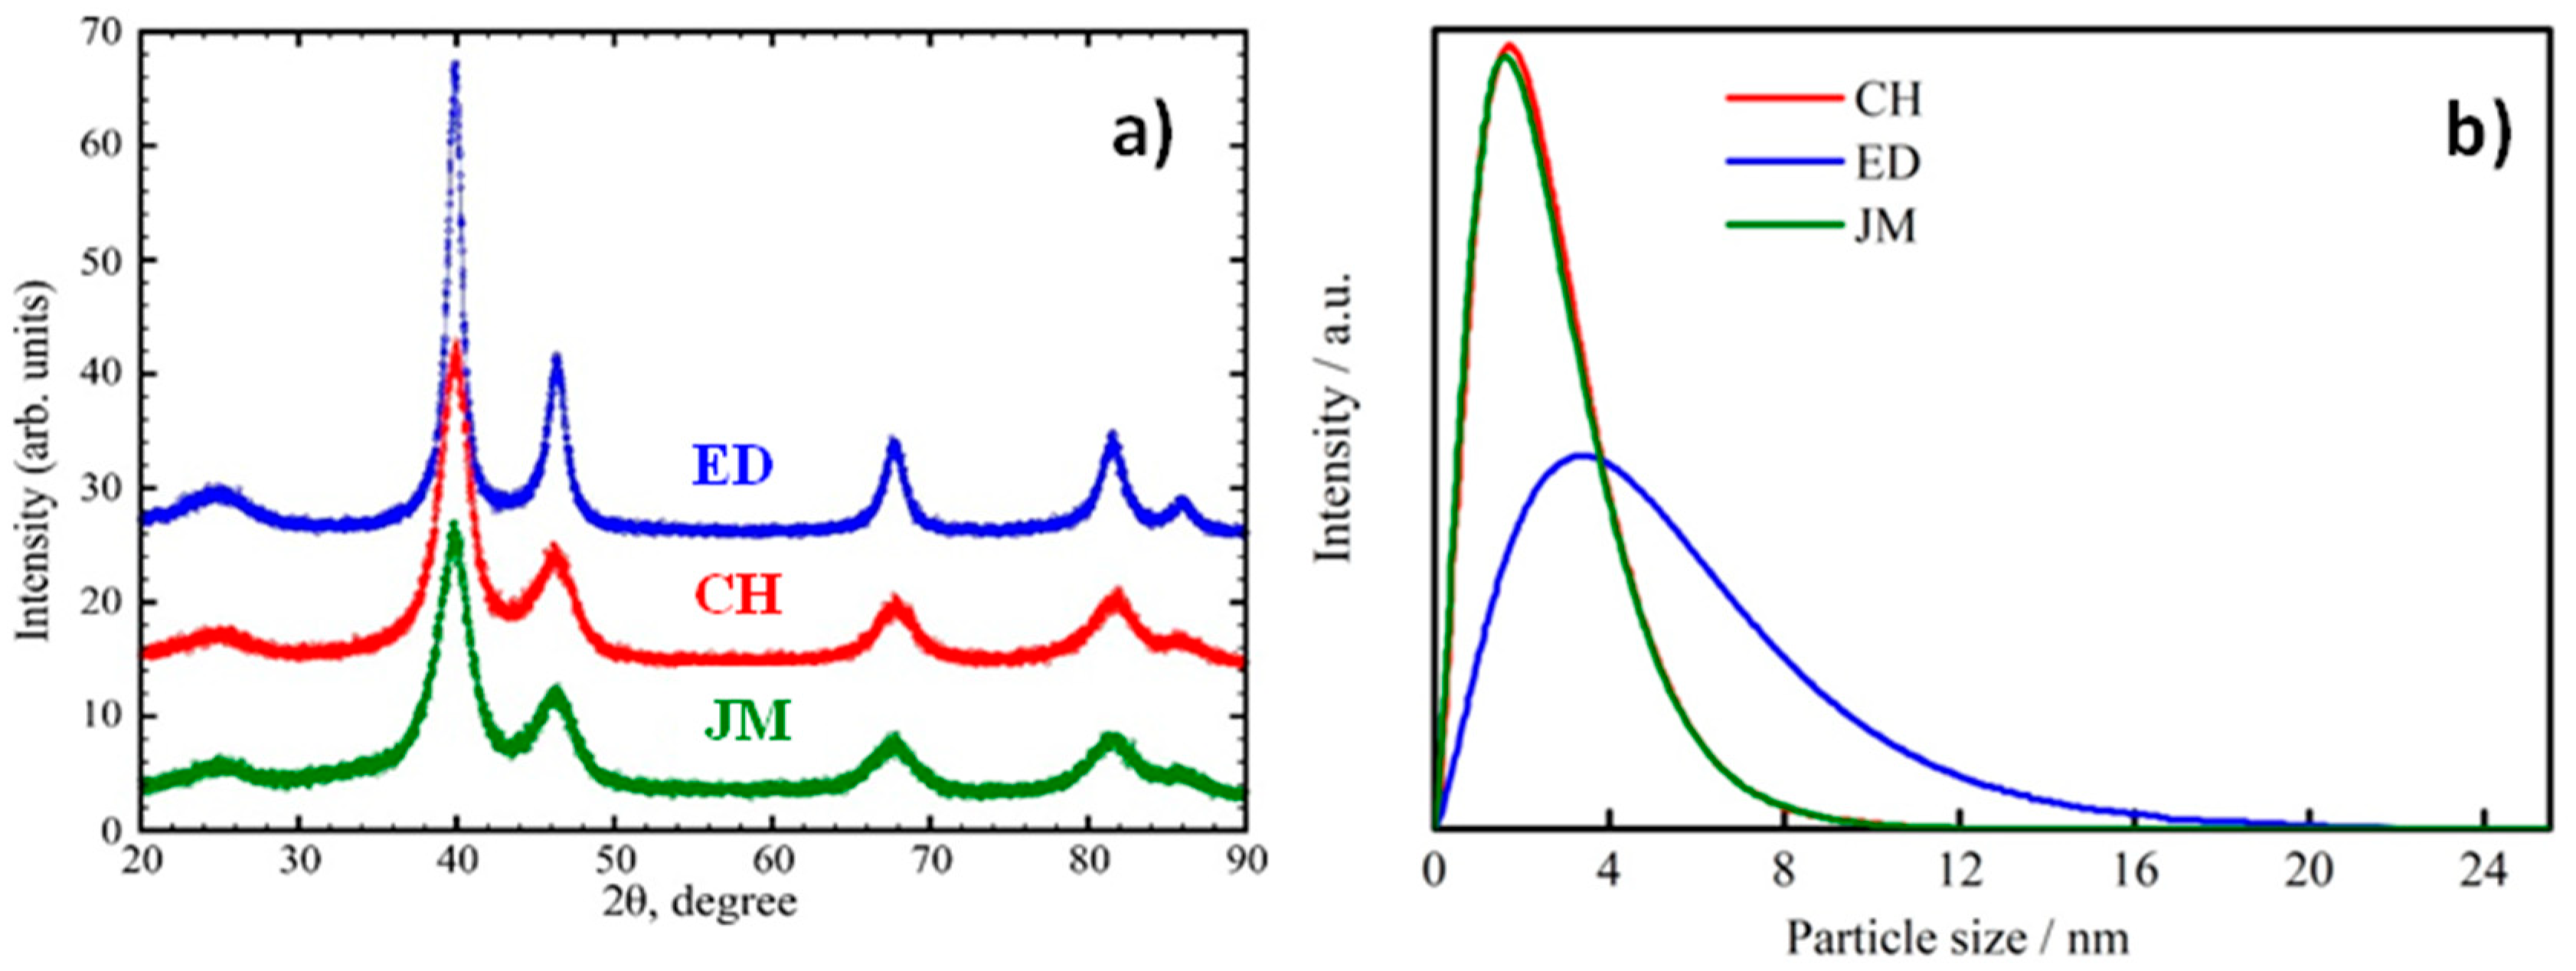
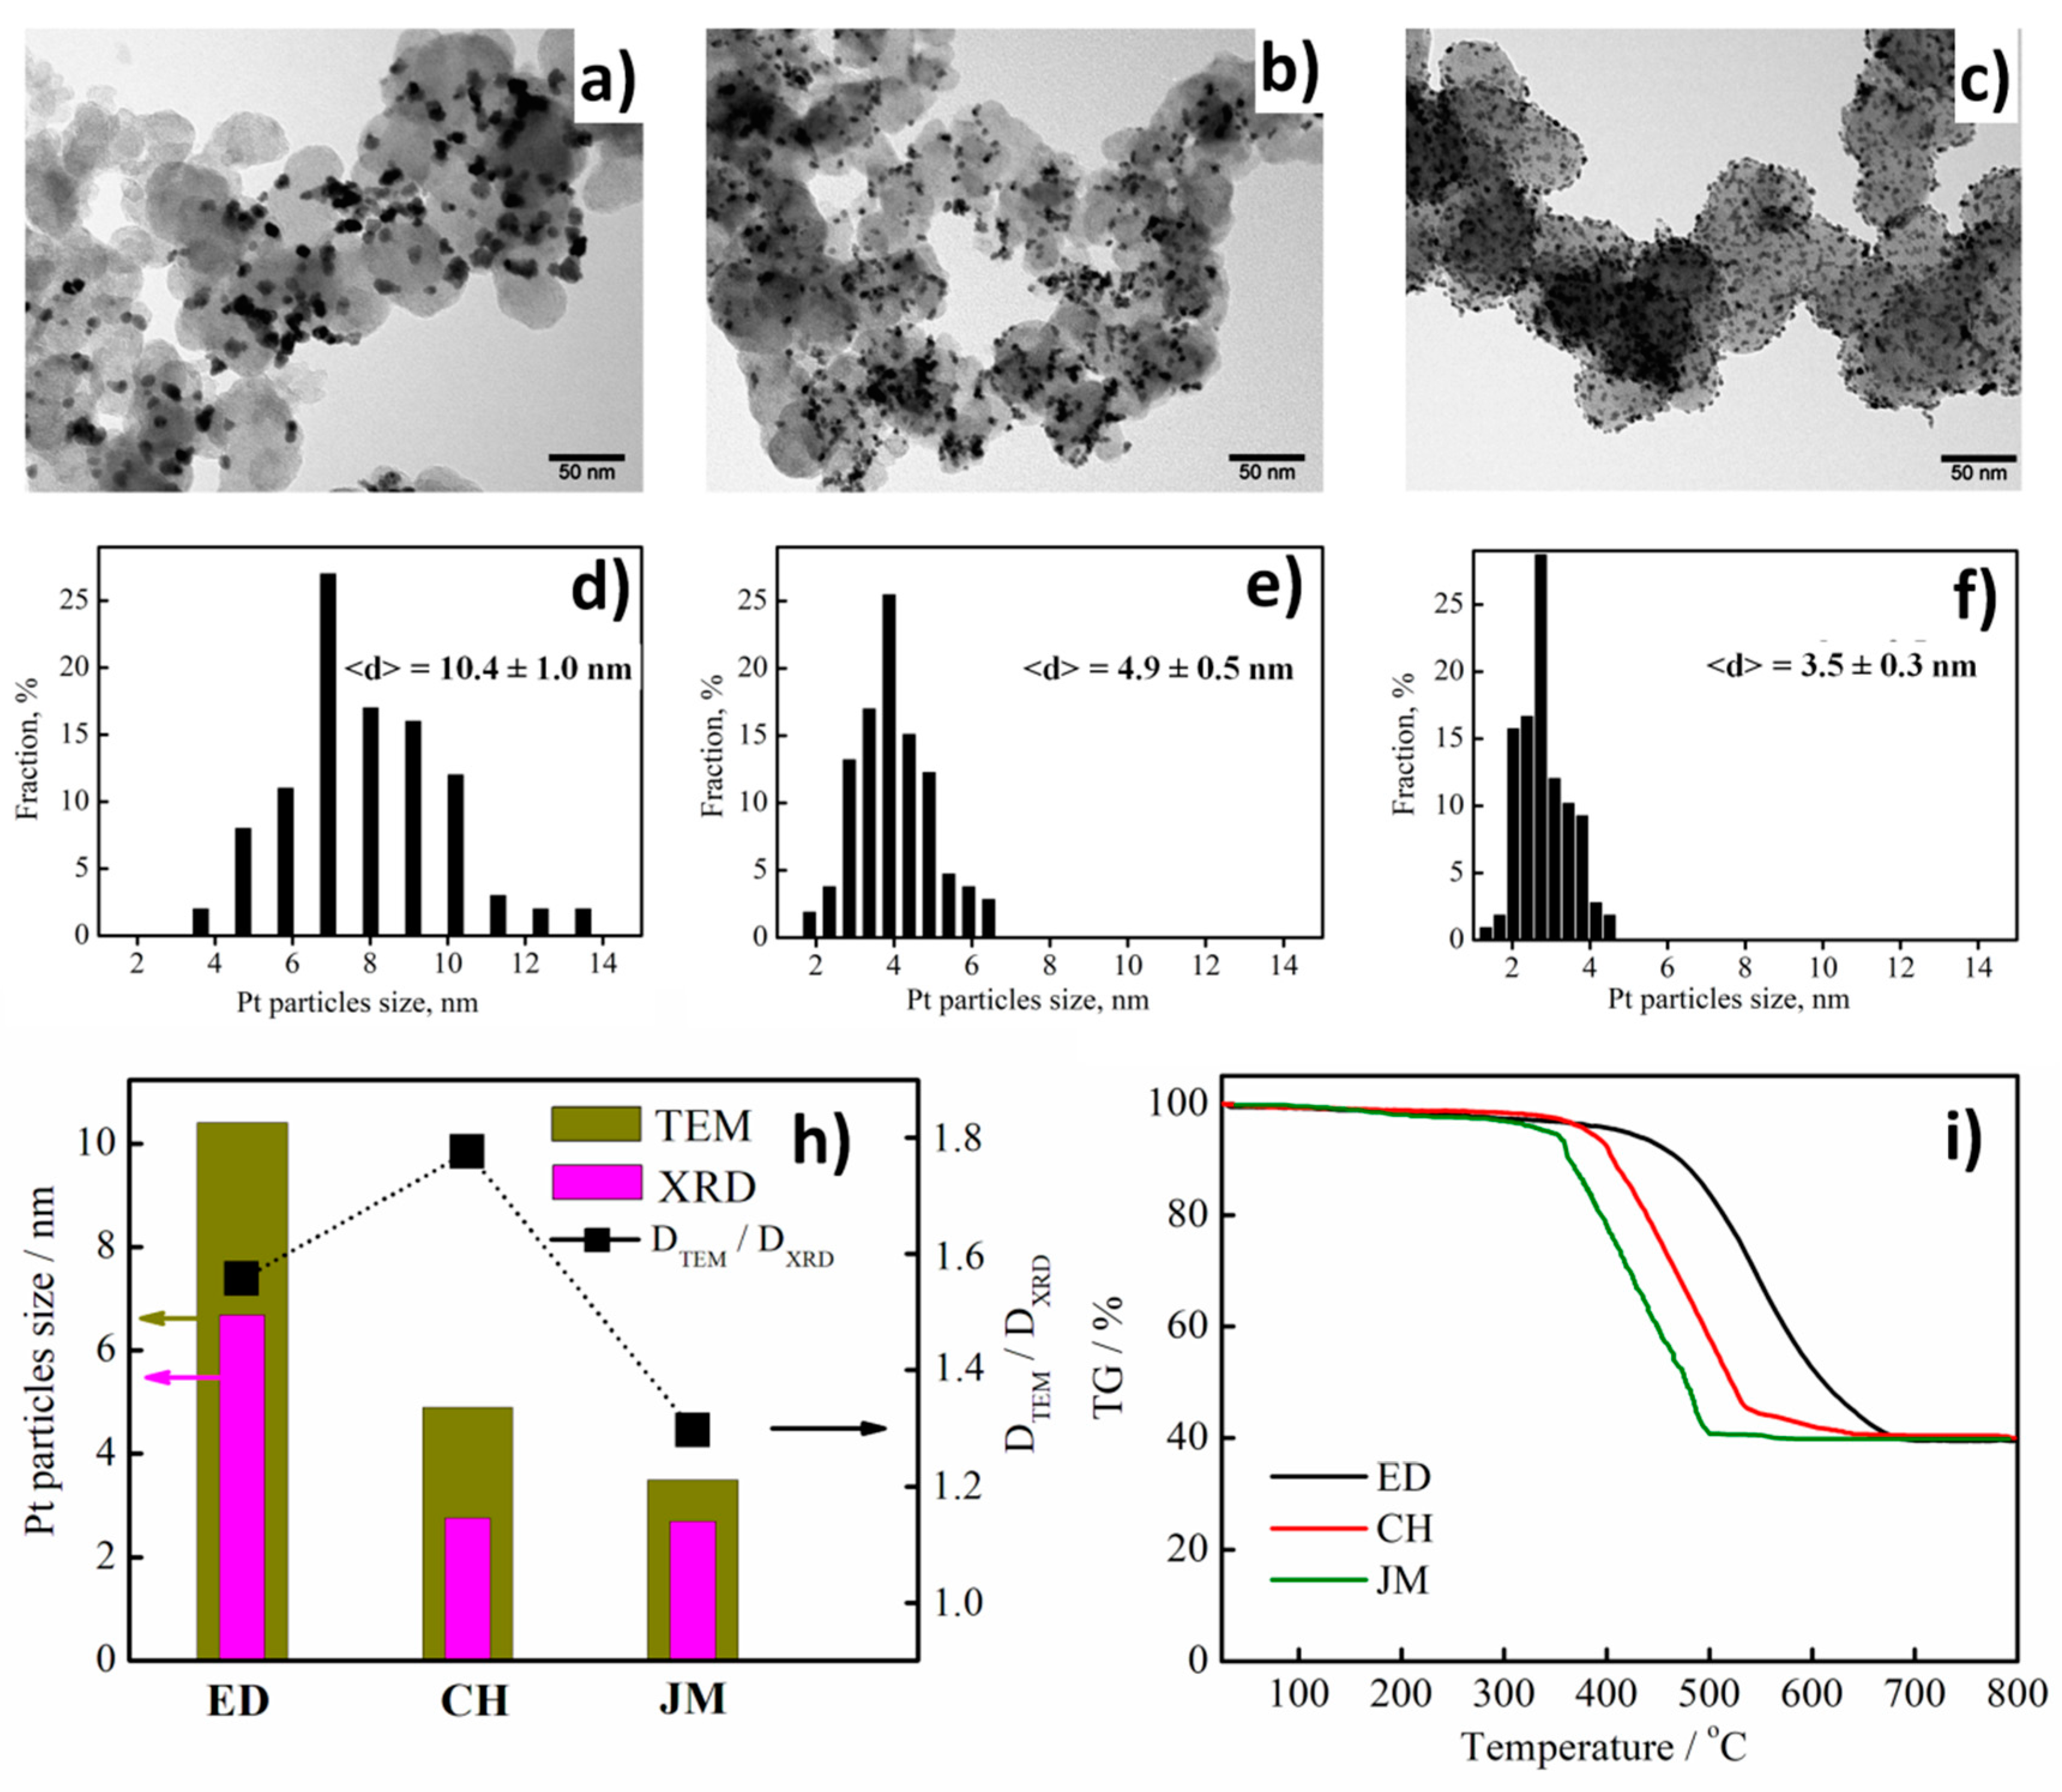
3.1. Physical Characterization of Pt/C Electrocatalysts

All the synthesized Pt/C composites exhibited the presence of XRD reflexes corresponding to an fcc lattice (Fm3m) of platinum, as observed in Figure 1a. The microstructural characteristics, as well as the unit cell parameters of the catalysts, were found via Rietveld refinement of the diffractograms (see Table 1). According to the results, we have the following:
(i) The average Dav value of the Pt nanoparticles in the samples ranges from 2.5 to 4.7 nm; in the case of the ED catalyst prepared via the electrochemical method, the Dav value is almost twice as high as those of the commercial catalyst and the CH sample obtained via the polyol process.
(ii) The unit cell parameter of the Pt/C nanoparticles is smaller than that for bulk Pt, reducing with a decrease in Pt particle size on account of the size effect by analogy with a situation described in a previous work [20].
(iii) The anisotropy factor R = D200/D111, determining the Pt nanoparticle shape [21], is almost equal for all samples and refers to the R factor of a cuboctahedron.
(iv) The geometric surface area of the catalyst nanoparticles, calculated according to the technique reported in a previous work [22], as well as the average size and particle size distribution are given in Table 2. The particle size distributions are also shown in Figure 1b.
It can be clearly seen in the TEM images (Figure 2a–c) of the catalysts that the most uniform distribution of platinum nanoparticles over the carbon support surface was observed in the JM sample. For the CH and JM composites, the Pt nanoparticle sizes were found by TEM to be 4.9 nm and 3.5 nm, respectively, while the ED sample demonstrated an average Pt nanoparticle size of about 10.4 nm. This may be due to a greater degree of agglomeration of platinum nanoparticles in the ED sample.
This tendency of Pt nanoparticle size variation depending on the catalyst synthesis conditions coincides with the XRD results (Figure 2h). Meanwhile, the ratio of Pt nanoparticle sizes evaluated via TEM to those provided by XRD (DTEM/DXRD) is much higher for the ED and CH composites than for the JM sample. This is testimony to the higher degree of agglomeration of ED and CH as compared to the commercial JM composite. That leads us to the following questions: What is the reason for such a large difference in the degree of platinum agglomeration in Pt/C samples obtained via different ways? Does it mean that agglomeration deteriorates the properties of the electrocatalyst?
Recall that the ED sample was produced via the “top-down” route, i.e., by the dispersion of platinum electrodes in the electrochemical cell at high cathode potentials. To interpret the mechanism of formation of platinum nanoparticles from bulk metal in the electrochemical system, we can offer the following explanation: platinum dispersion through (i) the emergence of intermetallic compounds of platinum with the electrolyte cation that is then decomposed by water (electrochemical dispersion) [17]; (ii) the formation of platinum anions stabilized with electrolyte cations that are precursors of platinum nanoparticles (cathodic corrosion) [23].
According to both approaches, platinum particles may form at only the cathode potentials. However, the dispersion of platinum in previous works [17,24,25] was implemented using pulsed electrolysis modes with short-term achievement of high anode potentials (>2 V) that make it possible to form three forms of chemisorbed oxygen and phase platinum oxides, the presence of which may simplify the intercalation of alkaline metal ions in the adsorption layer and thus increase the reaction rate. At low platinum contents in Pt/Al2O3 catalysts, X-ray absorption spectroscopy (XAS) revealed partly oxidized platinum nanoparticles PtOx [24] that were not detected in a Pt/С (20% Pt) catalyst [17,25]. The important role of the anode current component, as well as that of the pH level of the near-electrode layer in terms of anodic dilution of noble metals during electrochemical release of oxygen was mentioned in several works published by Karl Mayrhofer’s scientific group [26,27,28,29,30,31]. The ability to form colloidal Pt particles due to the formation of poorly soluble complexes [Ptδ+…O2δ−] on the electrode surface during charge transfer involving molecular oxygen was also noted in [32].
Thus, in spite of differences in understanding the mechanisms of formation of platinum-group metal nanoparticles via dispersion of a metallic electrode by electric current, it appears that the most important feature of the EDPAC method of producing Pt/C catalysts is the ability to form platinum nanoparticles in the near-electrode layer independently of the properties of the support. That, however, favors the presence of agglomerated platinum particles in the ED sample (Figure 2h) and broadens the platinum particle size distribution (Figure 1a and Figure 2d).
Polyol synthesis of Pt/C catalysts using NaBH4 as a reducing agent is one of the most common methods used to produce platinum-containing catalysts. The high reactivity of NaBH4 as a reducing agent is among its most important benefits, allowing platinum to be reduced [33]. The use of ethylene glycol during the synthesis is due to the ability of glycolic acid anions to adsorb on the platinum particles’ surface and to play the role of a stabilizing agent [34]. Regardless of the presence of a stabilizing agent, the high rate of Pt reduction impedes efficient control of the phase formation processes, resulting in nonuniform Pt nanoparticle distribution within a catalyst. Another reason for platinum agglomeration during the polyol synthesis of Pt/C catalysts is the influence of the carbon support surface state. As is known, the nature and state of the support exert a strong influence on the lattice strain, size, and distribution of mono- and polymetallic platinum-group metal nanoparticles [35,36,37].
Thus, in spite of the fact that both syntheses were carried out under identical hydrodynamic conditions, the degrees of agglomeration of Pt nanoparticles in the catalysts are different, which is due to the fundamentally different mechanisms of Pt nanoparticle formation during the polyol process and EDPAC synthesis.
According to TEM data, the commercial JM catalyst exhibits a uniform distribution of Pt nanoparticles within the support surface and a narrow nanoparticle size distribution (Figure 2c,f,h). In addition, with a decrease in the size of Pt nanoparticles in the catalyst, the temperature of the onset of thermal oxidation of carbon also decreased during thermogravimetric analysis of the Pt/C sample (Figure 2i). It should be also noted that the platinum content in the synthesized Pt/C catalysts determined by thermogravimetry was 40 ± 1 wt %.
The presence of platinum agglomerates in the ED catalyst reduces the electrochemically active surface area (ECSA) of ED. Only a part of the platinum surface participates in redox processes, decreasing the mass activity of the catalyst. Meanwhile, studies [38,39] have revealed a positive effect of agglomerated Pt particles on the kinetics of СО oxidation, due to the fact that OH and CO species participating in the reaction are adsorbed on different nanoparticles, resulting in inter-particle processes.

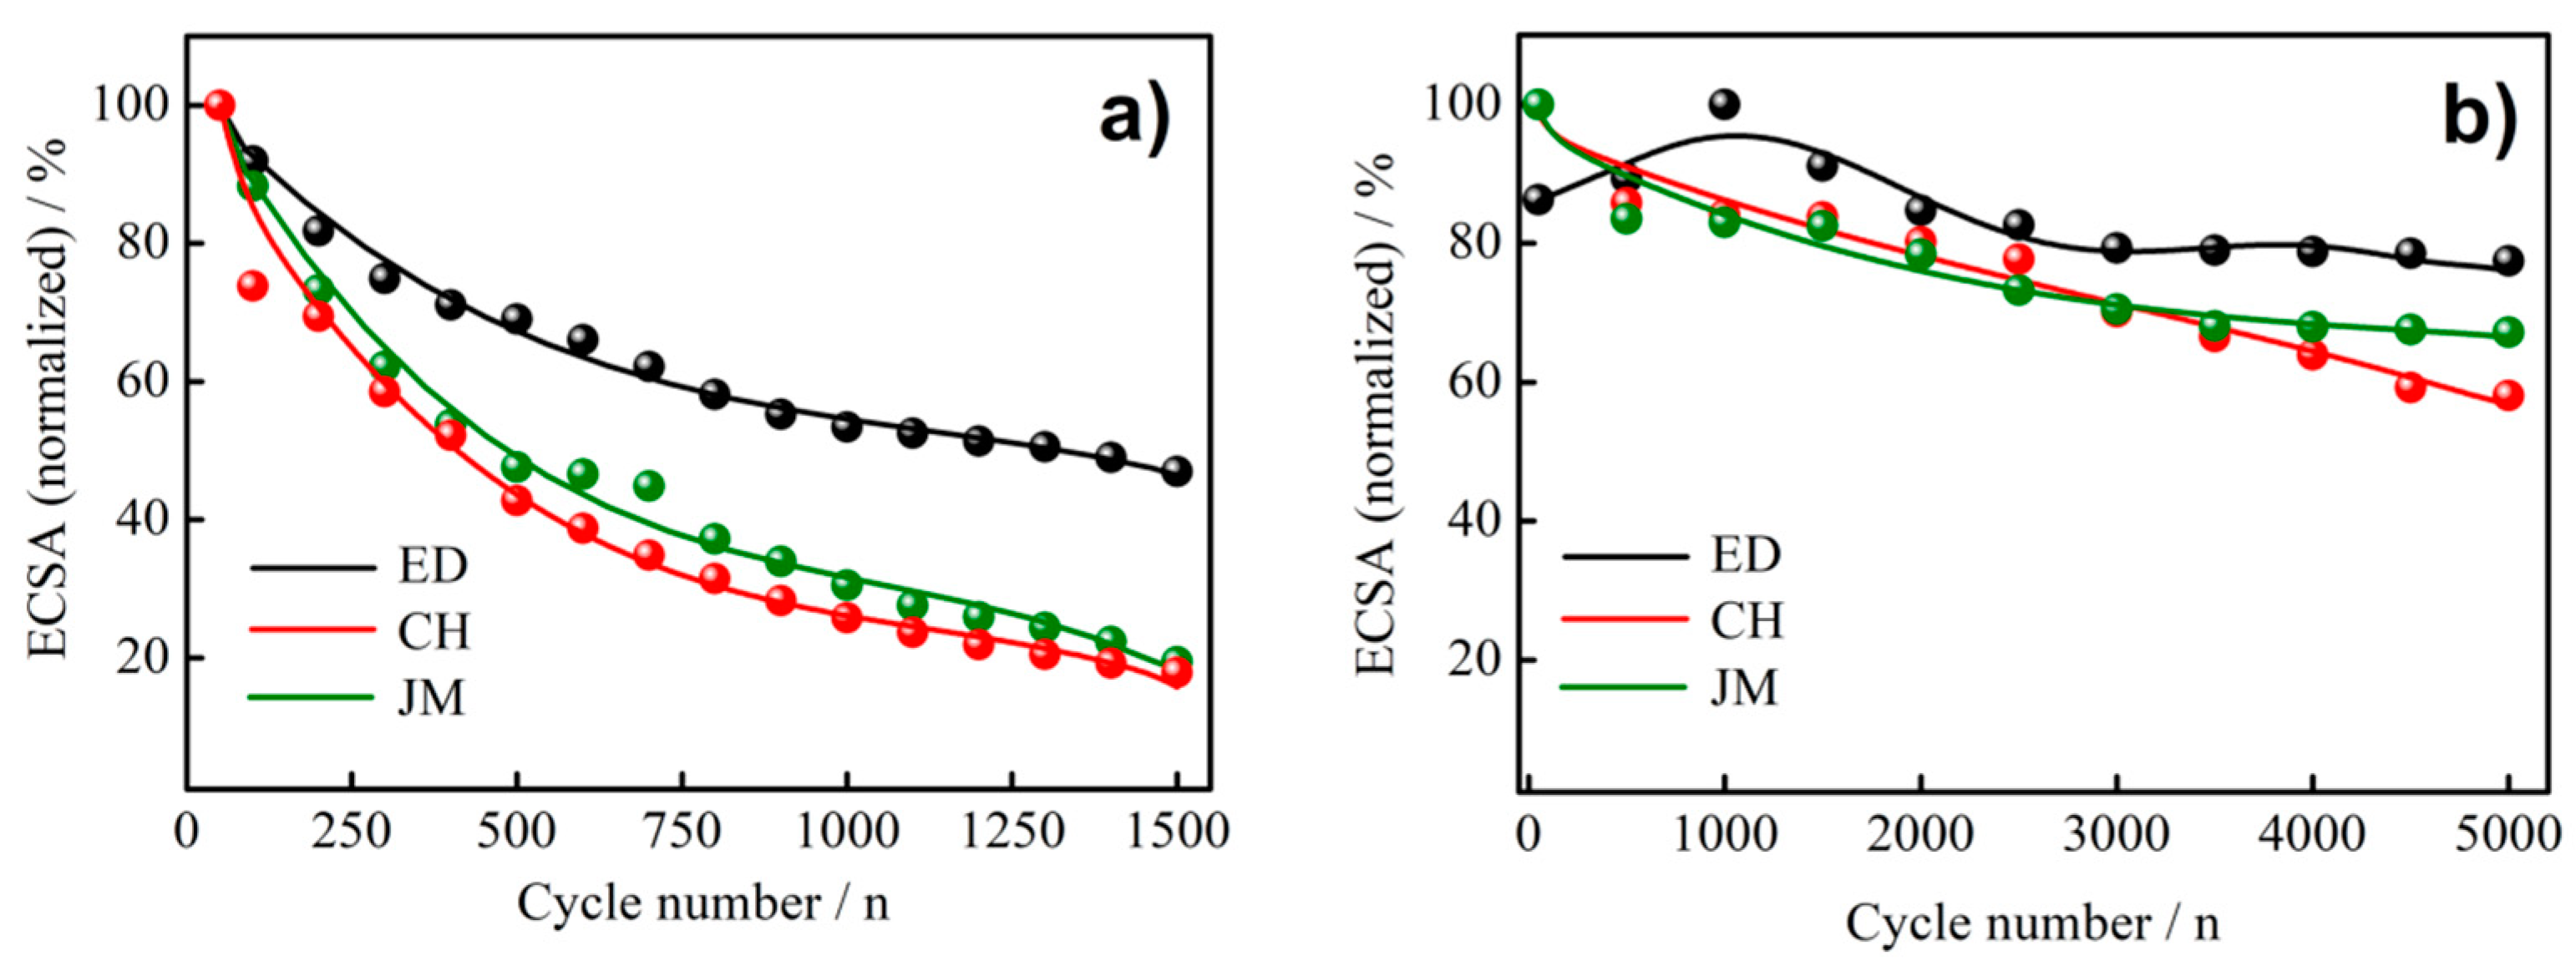
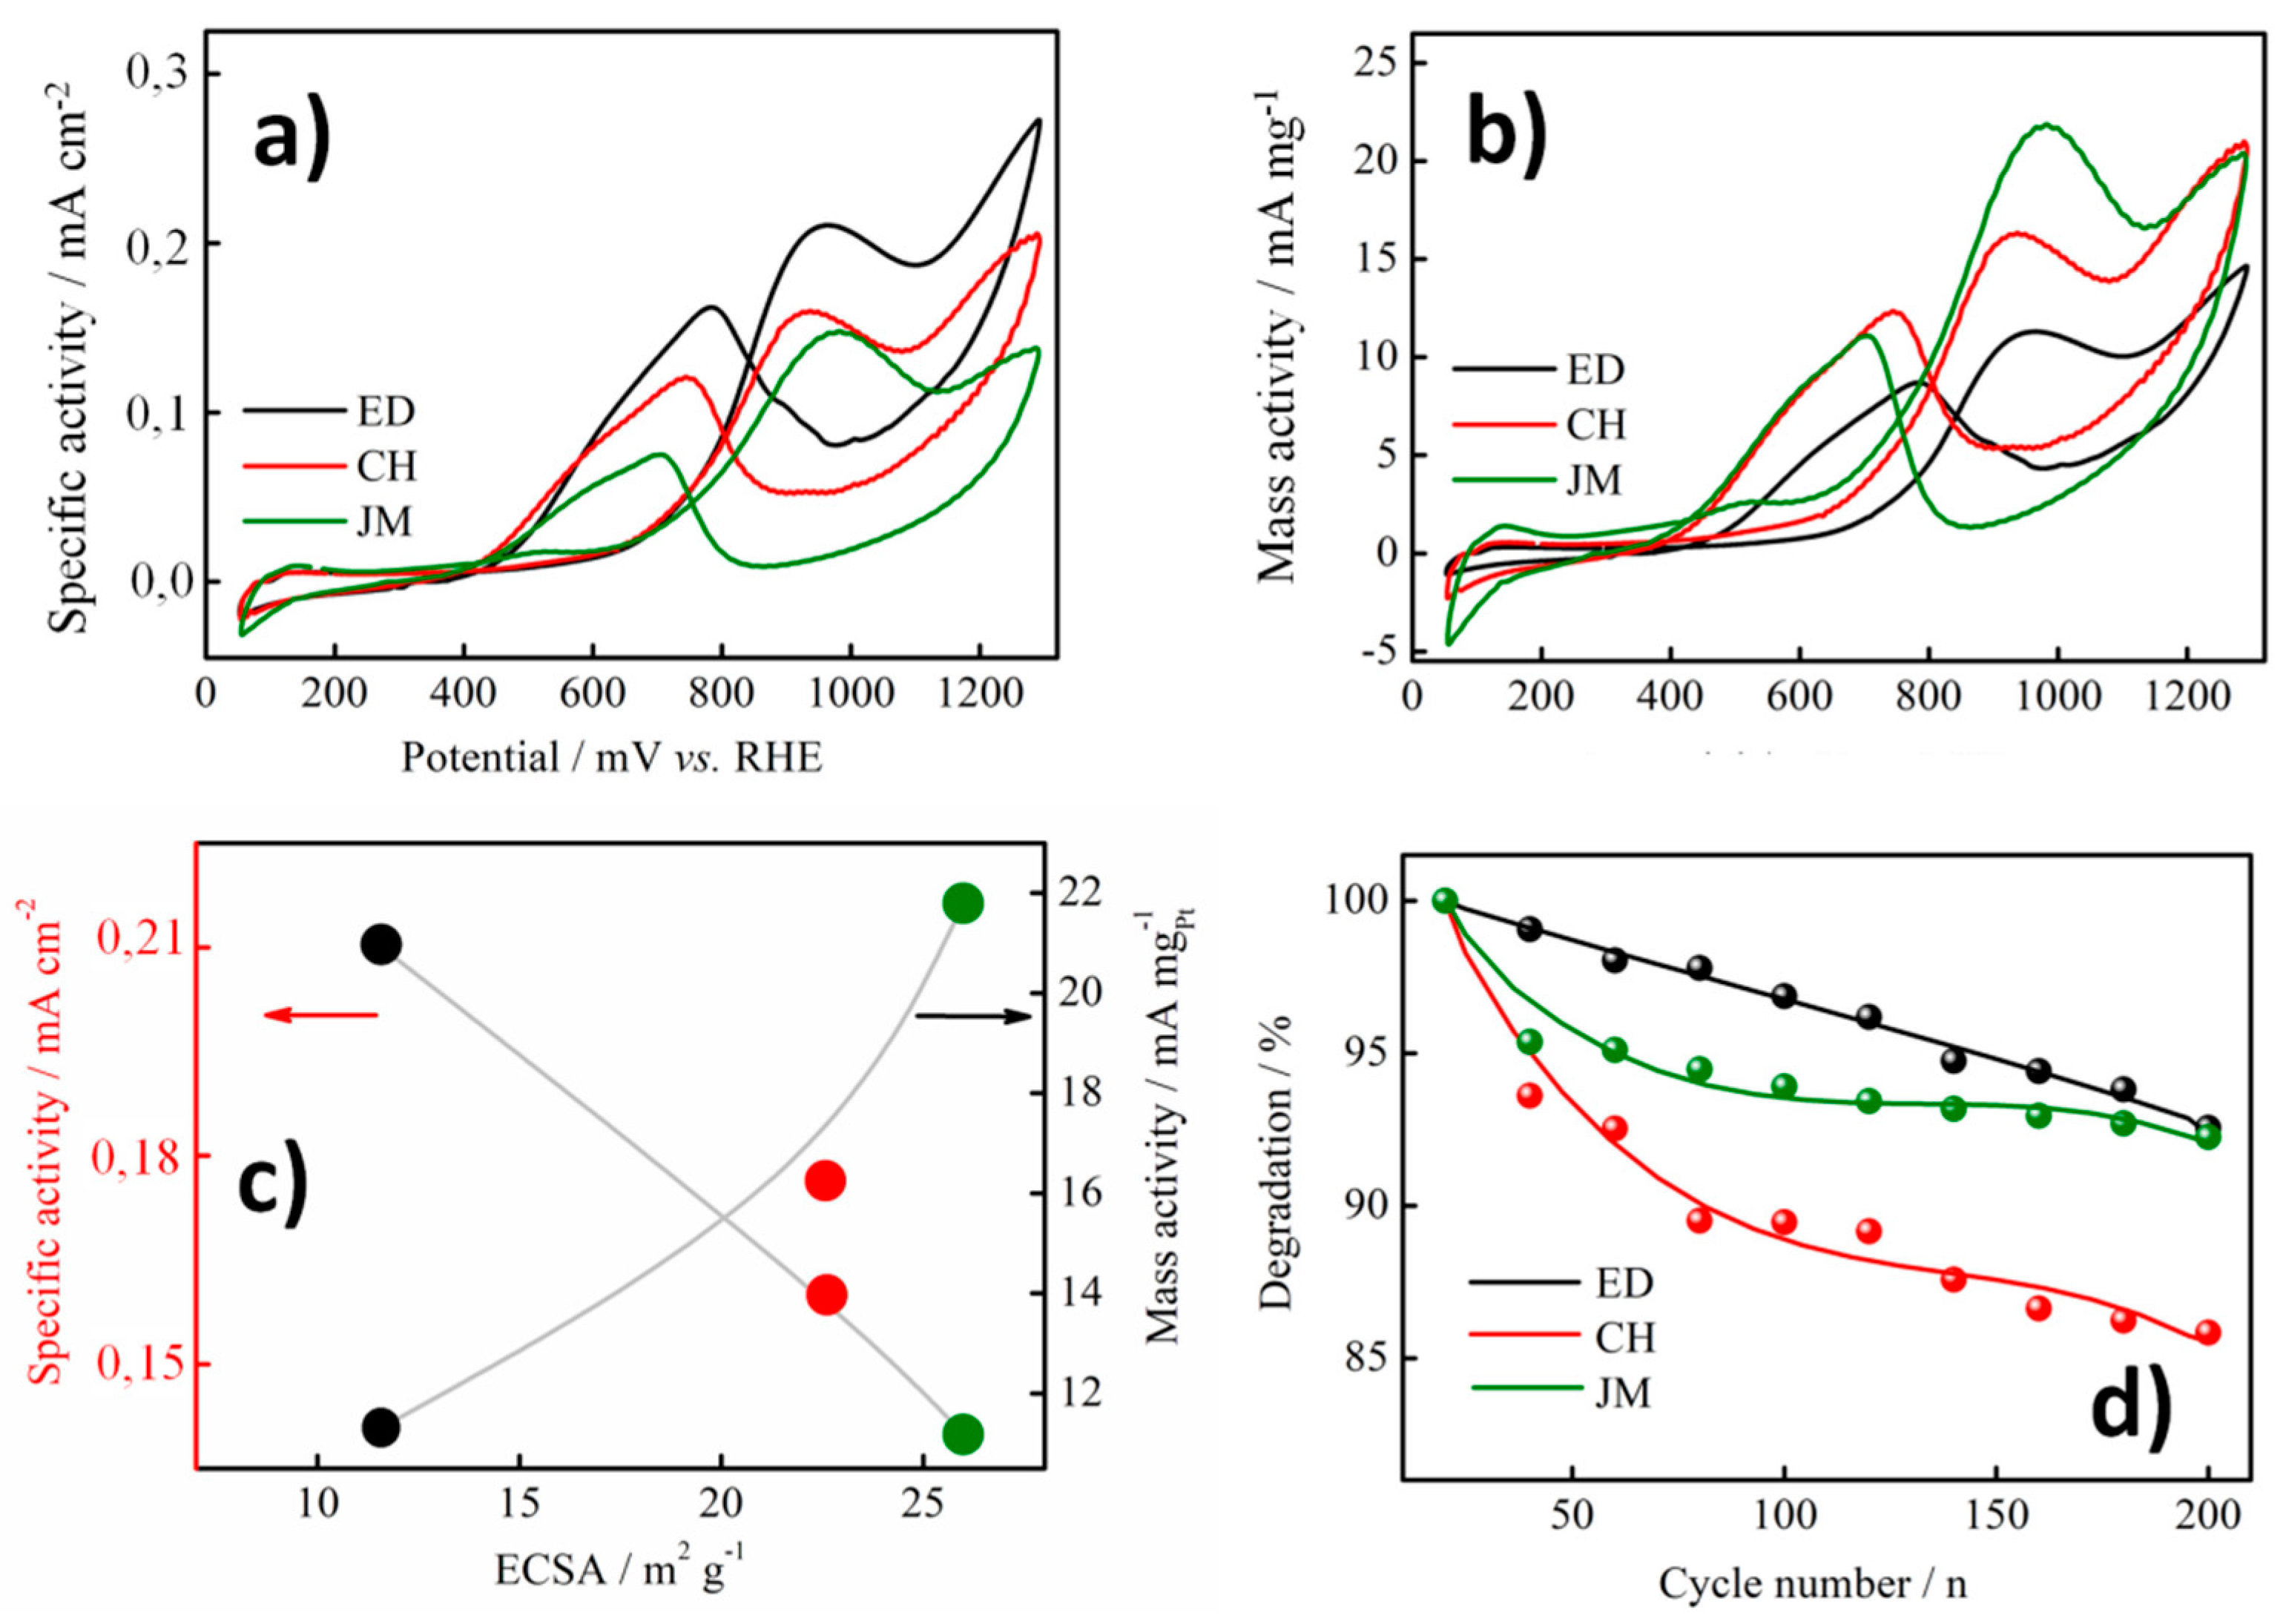
3.2. Electrochemical Measurements

The electrochemically active surface area (ECSA) is one of most important characteristics of Pt/C electrocatalysts. To evaluate the surface area of porous materials, there is a frequently used method based on physical adsorption of nitrogen, the so-called Brunauer–Emmett–Teller BET method [40]. However, for Pt/C catalysts, most important is the surface area of the platinum particles, on which an electrochemical reaction is possible [41].
Among the most popular electrochemical methods for evaluation of the ECSA in Pt/C electrocatalysts is hydrogen underpotential deposition (HUPD) [42]. Typically, to determine the ECSA with respect to the charge involved in hydrogen desorption (via the HUPD method), cyclic voltammograms are recorded in different potential ranges [43]. Figure 3a displays part of the cyclic voltammogram (СV) curves (sample СН) for the Н2 adsorption/desorption region, acquired in 0.5 M H2SO4 under nitrogen in potential ranges of 0.03–1.3 V and 0.05–1.3 V vs. RHE. Even a slight shift in the cyclic potential boundary by 20 mV to the cathode range alters the ECSA value (the shaded area in Figure 3a), i.e., this method brings some experimental errors, which leads to an increase in the ECSA for Pt/C electrocatalysts (Table 2). Moreover, the accuracy in determining the ECSA via the HUPD method may decrease because of a spill-over effect based on the transition (surface diffusion) of poorly adsorbed hydrogen from the Pt surface to the carbon support surface, resulting in a smaller amount of electricity consumed for adsorption/desorption of H2 and, consequently, in a lower ECSA value.
For this reason, the ECSAs of the Pt/C electrocatalysts were evaluated using CO stripping (Figure 3b,c). CO stripping is the most commonly discussed electrocatalytic reaction [44,45,46,47,48]. The mechanism of electrooxidation of СО on a Pt surface is described by the Langmuir–Hinshelwood mechanism. The ECSA is determined with respect to the charge involved in СОads oxidation, given that the oxidation of a CO monolayer adsorbed on Pt requires a value of 420 μC cm−2.
It was observed that the ECSA increased with decreasing Pt particle size in the catalyst at all degrees of particle agglomeration (Table 3, Figure 2h). The highest ECSA value was for the commercial JM catalyst at 26 ± 0.5 m2 g−1. It should be noted that in various studies (Table 3), the ECSA values of the JM catalyst (40 wt % Pt) differed from each other by more than a factor of 10 (from 18 to 190 m2 g−1), despite the fact that quite similar procedures were used to prepare the “catalytic inks” and working electrodes.
It is worth mentioning that the Eonset and Epeak values behave as a function of the average platinum nanoparticle size, being the highest for the JM Pt/C catalyst. This dependence seems to be due to a rise in the binding energy of СО and the Pt surface with decreasing Pt nanoparticle size [48]. Among other reasons could be the difference in the degree of surface defectiveness of the particles that are the active centers for OHads adsorption and the variance in COads surface mobility [45,48].
The most important functional feature of Pt/C electrocatalysts is their operation stability, maintaining stability of their ECSA. Degradation of a Pt/C electrocatalyst can be due to the dilution of platinum nanoparticles, their agglomeration and isolation by the ionomer, or oxidation of the carbon support [19,49,50]. The operation stability of the Pt/C electrocatalysts was evaluated using express tests in different voltammetric cyclic modes. The cyclic conditions corresponding to express testing modes were applied in this work [18,19] to study the operation stability of the electrocatalysts (Table 1).
During cycling of the Pt/C catalysts in Mode 1, the relative change in ECSA was 47% (ED) to 17.8% (CH). The ECSA of the ED sample decreased in a monotonic manner (Figure 4a), while the CH and JM samples exhibited high rates of degradation. The СН and JM composites lost more than 80% of their electrochemically active surface areas, with surface area losses of more than 40% at 500 cycles.
A similar tendency was observed during cycling in Mode 2. It is worth mentioning that the ECSA of the ED sample in this cycling mode reached a maximum value by only the 1000th cycle, which is due to the presence of partly oxidized Pt nanoparticles obtained via electrochemical dispersion [17,51] and, consequently, to slower catalytic activity upon cycling in a narrow potential range.
The electrocatalytic activity of the Pt/C catalysts was studied by using the example of ethanol oxidation reaction (EOR). Figure 5a,b shows the cyclic voltammograms (CVs) of the Pt/C catalysts in 0.5 M H2SO4 + 0.5 M EtOH electrolyte. The anodic CV range at E = 0.7–1.1 V exhibits the ethanol oxidation peak. The decrease in current density at potentials E ≥ 1.0 V is due to the removal of adsorbed ethanol intermediates and to the adsorption of oxygen-containing particles. The cathodic CV range also reveals the ethanol oxidation peak, but at potential values of E = 0.9 ÷ 0.4 V.
It is worth mentioning the influence of the ECSA of Pt/C catalysts on their mass (MA) and specific activity (SA) as determined using the current density of the ethanol oxidation peak in the anodic CV range. As seen in Figure 5c, the larger the ECSA, the lower the surface activity of the Pt/C catalysts, while the mass activity as a function of the ECSA follows the reverse trend.
The stability of the Pt/C catalysts (Figure 5d) obtained in 0.5 M H2SO4 electrolyte containing 0.5 M EtOH was estimated from the decrease in current density of the ethanol oxidation peak in the anodic CV range during 200 cycles of the Pt/C catalysts in the potential range of 0.05–1.3 V.
The ED composite exhibited a characteristic linear decrease in catalytic activity in the EOR. The commercial JM sample revealed a comparatively high degree of degradation in the first 50–100 cycles. However, by the 200th cycle, the degree of degradation of the JM and ED catalysts was ~7%, whereas that for the CH sample reached ~14% (Figure 5d). The relatively low tendency of the ED sample to degrade during cycling in both 0.5 M H2SO4 and 0.5 M H2SO4 + 0.5 M EtOH electrolyte seems to be thanks to the larger sizes of its Pt particles, which impede their quick agglomeration. Moreover, it was shown in a previous work [17] that Pt nanoparticles prepared via the electrochemical dispersion of platinum electrodes exhibit (100) crystallographic orientation of the Pt nanoparticles, which is more energetically favorable for the adsorption of oxygen atoms [70].

4. Conclusions

Two Pt/C catalysts were produced via fundamentally different methods. The ED sample obtained via electrochemical dispersion of platinum under the action of a pulsed alternating current (top-down) was characterized by a broad platinum nanoparticle size distribution; the average Pt nanoparticle size provided by TEM was 10.4 nm. The CH composite produced via the polyol (bottom-up) method revealed a narrow Pt nanoparticle size distribution in comparison to the ED sample; the average Pt nanoparticle size was found to be 4.9 nm. Both catalysts were compared with a commercial Pt/C composite (Johnson Matthey, or JM) that evidenced the lowest degree of platinum nanoparticle agglomeration (against ED and CH). The ECSA value of the commercial JM sample was shown to strongly differ in various literature sources. Thus, both the ECSA and the catalytic activity of Pt/C electrocatalysts depend on the working electrode formation method and the experimental conditions. Moreover, the mass and specific activities of the catalysts are first of all determined by the ECSA value. Thus, it is essential to compare the different Pt/C catalysts in terms of their mass and specific activities.
To conclude, the bottom-up approach enabled us to obtain a Pt/C electrocatalyst (CH sample) in which the average size of platinum nanoparticles was 4.9 nm and nanoparticles were uniformly distributed within a carbon support surface. On the one hand, a relatively high ECSA ensured high weight activity of the CH catalyst in the EOR process; on the other hand, the degree of degradation of the catalyst during long-term cycling in 0.5 M H2SO4 and 0.5 M H2SO4 + 0.5 M EtOH electrolytes was relatively high. The top-down method, namely, the electrochemical dispersion of platinum under the action of pulsed alternating current, allowed us to produce a Pt/C electrocatalyst (ED) with larger platinum nanoparticles (10.4 nm) and a comparatively low ECSA value that exhibited high stability during cycling, whether placed in the background electrolyte or in ethanol. Despite the fact that samples JM and CH have higher mass activity in comparison with ED, these samples also have a higher tendency to degrade. Based on this, it can be assumed that, as a result, the mass activity of samples JM and CH is at least that of the ED sample. However, to establish this as fact, it is necessary to carry out longer experiments not in model conditions but in a single cell of a fuel cell.

Author Contributions

Investigation, N.F., I.L., D.K., and M.G.; writing—original draft preparation, A.K.; supervision, N.S. All authors have read and agreed to the published version of the manuscript.

Funding

This work was supported by the Russian Foundation for Basic Research (grant no. 18-33-20064 mol_a_ved).

Conflicts of Interest

The authors declare no conflict of interest.

References

  1. Lin, C.-Y.; Zhang, D.; Zhao, Z.; Xia, Z. Covalent Organic Framework Electrocatalysts for Clean Energy Conversion. Adv. Mater. 2017, 30, 1703646. [Google Scholar] [CrossRef]
  2. Jung, N.; Chung, D.Y.; Ryu, J.; Yoo, S.J.; Sung, Y.-E. Pt-Based nanoarchitecture and catalyst design for fuel cell applications. Nano Today 2014, 9, 433–456. [Google Scholar] [CrossRef]
  3. Antolini, E. Structural parameters of supported fuel cell catalysts: The effect of particle size, inter-particle distance and metal loading on catalytic activity and fuel cell performance. Appl. Catal. B Environ. 2016, 181, 298–313. [Google Scholar] [CrossRef]
  4. Park, Y.-C.; Tokiwa, H.; Kakinuma, K.; Watanabe, M.; Uchida, M. Effects of carbon supports on Pt distribution, ionomer coverage and cathode performance for polymer electrolyte fuel cells. J. Power Sour. 2016, 315, 179–191. [Google Scholar] [CrossRef] [Green Version]
  5. Sharma, S.; Pollet, B.G. Support materials for PEMFC and DMFC electrocatalysts—A review. J. Power Sour. 2012, 208, 96–119. [Google Scholar] [CrossRef]
  6. Han, B.C.; Miranda, C.R.; Ceder, G. Effect of particle size and surface structure on adsorption of O and OH on platinum nanoparticles: A first-principles study. Phys. Rev. B 2008, 77, 075410. [Google Scholar] [CrossRef] [Green Version]
  7. Chen, Q.-S.; Vidal-Iglesias, F.J.; Solla-Gullón, J.; Sun, S.-G.; Feliu, J.M. Role of surface defect sites: From Pt model surfaces to shape-controlled nanoparticles. Chem. Sci. 2012, 3, 136–147. [Google Scholar] [CrossRef]
  8. Chen, Z.; Higgins, D.; Yu, A.; Zhang, L.; Zhang, J. A review on non-precious metal electrocatalysts for PEM fuel cells. Energy Environ. Sci. 2011, 4, 3167–3192. [Google Scholar] [CrossRef]
  9. Brouzgou, A.; Song, S.; Tsiakaras, P. Low and non-platinum electrocatalysts for PEMFCs: Current status, challenges and prospects. Appl. Catal. B Environ. 2012, 127, 371–388. [Google Scholar] [CrossRef]
  10. Pryadchenko, V.V.; Srabionyan, V.V.; Kurzin, A.A.; Bulat, N.V.; Shemet, D.B.; Avakyan, L.A.; Belenov, S.V.; Volochaev, V.A.; Zizak, I.; Guterman, V.E.; et al. Bimetallic PtCu core-shell nanoparticles in PtCu/C electrocatalysts: Structural and electrochemical characterization. Appl. Catal. A Gen. 2016, 525, 226–236. [Google Scholar] [CrossRef]
  11. Yang, H. Platinum-Based Electrocatalysts with Core-Shell Nanostructures. Angew. Chem. Int. Ed. 2011, 50, 2674–2676. [Google Scholar] [CrossRef] [PubMed]
  12. Zou, J.; Wu, M.; Ning, S.; Huang, L.; Kanga, X.; Chen, S. Ru@Pt Core-Shell Nanoparticles: Impact of the Atomic Ordering of the Ru Metal Core on the Electrocatalytic Activity of the Pt Shell. ACS Sustain. Chem. Eng. 2019, 7, 9007–9016. [Google Scholar] [CrossRef]
  13. Sharma, G.; Kumar, D.; Kumar, A.; Al-Muhtaseb, A.H.; Pathania, D.; Naushad, M.; Mola, G.T. Revolution from monometallic to trimetallic nanoparticle composites, various synthesis methods and their applications: A review. Mater. Sci. Eng. C 2017, 71, 1216–1230. [Google Scholar] [CrossRef] [PubMed]
  14. Jamkhande, P.G.; Ghule, N.W.; Bamer, A.H.; Kalaskar, M.G. Metal nanoparticles synthesis: An overview on methods of preparation, advantages and disadvantages, and applications. J. Drug Deliv. Sci. Technol. 2019, 53, 101174. [Google Scholar] [CrossRef]
  15. Alegre, C.; Gálvez, M.E.; Moliner, R.; Baglio, V.; Aricò, A.; Lázaro, M.J.; Gresa, C.A. Towards an optimal synthesis route for the preparation of highly mesoporous carbon xerogel-supported Pt catalysts for the oxygen reduction reaction. Appl. Catal. B Environ. 2014, 147, 947–957. [Google Scholar] [CrossRef] [Green Version]
  16. Hernández-Fernández, P.; Rojas, S.; Ocón, P.; Gómez de la Fuente, J.L.; San Fabian, J.; Sanza, J.; Peña, M.A.; Garcia-Garcia, F.J.; Terreros, P.; Fierro, J.L.G. Influence of the Preparation Route of Bimetallic Pt-Au Nanoparticle Electrocatalysts for the Oxygen Reduction Reaction. J. Phys. Chem. C 2007, 111, 2913–2923. [Google Scholar] [CrossRef]
  17. Leontyev, I.; Kuriganova, A.; Kudryavtsev, Y.; Dkhil, B.; Smirnova, N. New life of a forgotten method: Electrochemical route toward highly efficient Pt/C catalysts for low-temperature fuel cells. Appl. Catal. A Gen. 2012, 431, 120–125. [Google Scholar] [CrossRef]
  18. Shinohara, K.; Ohma, A.; Iiyama, A.; Yoshida, T.; Daimaru, A. Membrane and Catalyst Performance Targets for Automotive Fuel Cells by FCCJ Membrane, Catalyst, MEA WG. ECS Meet. Abstr. 2011, 41, 775–784. [Google Scholar] [CrossRef]
  19. Zhang, S.; Yuan, X.-Z.; Hin, J.N.C.; Wang, H.; Friedrich, K.A.; Schulze, M. A review of platinum-based catalyst layer degradation in proton exchange membrane fuel cells. J. Power Sour. 2009, 194, 588–600. [Google Scholar] [CrossRef]
  20. Leontyev, I.N.; Kuriganova, A.B.; Leontyev, N.G.; Hennet, L.; Rakhmatullin, A.; Smirnova, N.V.; Dmitriev, V. Size dependence of the lattice parameters of carbon supported platinum nanoparticles: X-Ray diffraction analysis and theoretical considerations. RSC Adv. 2014, 4, 35959–35965. [Google Scholar] [CrossRef]
  21. Leontyev, I.N.; Belenov, S.V.; Guterman, V.E.; Haghi-Ashtiani, P.; Shaganov, A.P.; Dkhil, B. Catalytic Activity of Carbon-Supported Pt Nanoelectrocatalysts. Why Reducing the Size of Pt Nanoparticles is Not Always Beneficial. J. Phys. Chem. C 2011, 115, 5429–5434. [Google Scholar] [CrossRef]
  22. Leontyev, I.N.; Kuriganova, A.B.; Allix, M.; Rakhmatullin, A.; Timoshenko, P.E.; Maslova, O.A.; Mikheykin, A.S.; Smirnova, N.V. On the Evaluation of the Average Crystalline Size and Surface Area of Platinum Catalyst Nanoparticles. Phys. Status Solidi B 2018, 255. [Google Scholar] [CrossRef]
  23. Yanson, A.I.; Rodriguez, P.; Garcia-Araez, N.; Mom, R.V.; Tichelaar, F.D.; Koper, M.T.M. Cathodic Corrosion: A Quick, Clean, and Versatile Method for the Synthesis of Metallic Nanoparticles. Angew. Chem. Int. Ed. 2011, 50, 6346–6350. [Google Scholar] [CrossRef] [PubMed]
  24. Doronkin, D.E.; Kuriganova, A.B.; Leontyev, I.N.; Baier, S.; Lichtenberg, H.; Smirnova, N.V.; Grunwaldt, J.-D. Electrochemically Synthesized Pt/Al2O3 Oxidation Catalysts. Catal. Lett. 2015, 146, 452–463. [Google Scholar] [CrossRef]
  25. Novikova, K.; Kuriganova, A.; Leontyev, I.; Gerasimova, E.; Maslova, O.; Rakhmatullin, A.; Smirnova, N.V.; Dobrovolsky, Y. Influence of Carbon Support on Catalytic Layer Performance of Proton Exchange Membrane Fuel Cells. Electrocatalysis 2017, 9, 22–30. [Google Scholar] [CrossRef]
  26. Cherevko, S.; Topalov, A.A.; Zeradjanin, A.R.; Katsounaros, I.; Mayrhofer, K.J.J. Gold dissolution: Towards understanding of noble metal corrosion. RSC Adv. 2013, 3, 16516. [Google Scholar] [CrossRef]
  27. Cherevko, S.; Zeradjanin, A.R.; Topalov, A.A.; Kulyk, N.; Katsounaros, I.; Mayrhofer, K.J.J. Dissolution of Noble Metals during Oxygen Evolution in Acidic Media. ChemCatChem 2014, 6, 2219–2223. [Google Scholar] [CrossRef]
  28. Katsounaros, I.; Meier, J.C.; Klemm, S.O.; Topalov, A.A.; Biedermann, P.U.; Auinger, M.; Mayrhofer, K.J.J. The effective surface pH during reactions at the solid–liquid interface. Electrochem. Commun. 2011, 13, 634–637. [Google Scholar] [CrossRef]
  29. Klemm, S.O.; Karschin, A.; Schuppert, A.K.; Topalov, A.A.; Mingers, A.M.; Katsounaros, I.; Mayrhofer, K.J.J. Time and potential resolved dissolution analysis of rhodium using a microelectrochemical flow cell coupled to an ICP-MS. J. Electroanal. Chem. 2012, 677, 50–55. [Google Scholar] [CrossRef]
  30. Topalov, A.A.; Cherevko, S.; Zeradjanin, A.R.; Meier, J.C.; Katsounaros, I.; Mayrhofer, K.J.J. Towards a comprehensive understanding of platinum dissolution in acidic media. Chem. Sci. 2014, 5, 631–638. [Google Scholar] [CrossRef] [Green Version]
  31. Topalov, A.A.; Katsounaros, I.; Auinger, M.; Cherevko, S.; Meier, J.C.; Klemm, S.O.; Mayrhofer, K. Dissolution of Platinum: Limits for the Deployment of Electrochemical Energy Conversion? Angew. Chem. Int. Ed. 2012, 51, 12613–12615. [Google Scholar] [CrossRef] [Green Version]
  32. Kasatkin, V.E.; Tytik, D.L.; Revina, A.A.; Busev, S.A.; Abaturov, M.A.; Vysotskii, V.V.; Roldugin, V.I.; Kazanskii, L.P.; Kuz’Min, V.I.; Gadzaov, A.; et al. Electrochemical synthesis of iron and platinum nanoparticles in deionized water. Prot. Met. Phys. Chem. Surf. 2015, 51, 973–979. [Google Scholar] [CrossRef]
  33. Chen, J.; Jiang, C.; Yang, X.; Feng, L.; Gallogly, E.B.; Wang, R. Studies on how to obtain the best catalytic activity of Pt/C catalyst by three reduction routes for methanol electro-oxidation. Electrochem. Commun. 2011, 13, 314–316. [Google Scholar] [CrossRef]
  34. Qi, J.; Jiang, L.; Jing, M.; Tang, Q.; Sun, G. Preparation of Pt/C via a polyol process—Investigation on carbon support adding sequence. Int. J. Hydrogen Energy 2011, 36, 10490–10501. [Google Scholar] [CrossRef]
  35. Comignani, V.; Sieben, J.M.; Sanchez, M.D.; Duarte, M.M.E. Influence of carbon support properties on the electrocatalytic activity of PtRuCu nanoparticles for methanol and ethanol oxidation. Int. J. Hydrogen Energy 2017, 42, 24785–24796. [Google Scholar] [CrossRef]
  36. Fraga, M.A.; Jordão, E.; Mendes, M.J.; Freitas, M.M.A.; Faria, J.L.; Figueiredo, J.L. Properties of Carbon-Supported Platinum Catalysts: Role of Carbon Surface Sites. J. Catal. 2002, 209, 355–364. [Google Scholar] [CrossRef]
  37. Gurrath, M.; Kuretzky, T.; Boehm, H.P.; Okhlopkova, L.B.; Lisitsyn, A.S.; Likholobov, V.A. Palladium catalysts on activated carbon supports. Carbon 2000, 38, 1241–1255. [Google Scholar] [CrossRef]
  38. López-Cudero, A.; Solla-Gullón, J.; Herrero, E.; Aldaz, A.; Feliu, J.M. CO electrooxidation on carbon supported platinum nanoparticles: Effect of aggregation. J. Electroanal. Chem. 2010, 644, 117–126. [Google Scholar] [CrossRef]
  39. Maillard, F.; Schreier, S.; Hanzlik, M.; Savinova, E.R.; Weinkauf, S.; Stimming, U. Influence of particle agglomeration on the catalytic activity of carbon-supported Pt nanoparticles in CO monolayer oxidation. Phys. Chem. Chem. Phys. 2005, 7, 385–393. [Google Scholar] [CrossRef]
  40. Brunauer, S.; Emmett, P.H.; Teller, E. Adsorption of Gases in Multimolecular Layers. J. Am. Chem. Soc. 1938, 60, 309–319. [Google Scholar] [CrossRef]
  41. Watt-Smith, M.J.; Friedrich, J.M.; Rigby, S.P.; Ralph, T.R.; Walsh, F.C. Determination of the electrochemically active surface area of Pt/C PEM fuel cell electrodes using different adsorbates. J. Phys. D Appl. Phys. 2008, 41, 174004. [Google Scholar] [CrossRef]
  42. Li, W.; Lane, A.M. Resolving the HUPD and HOPD by DEMS to determine the ECSA of Pt electrodes in PEM fuel cells. Electrochem. Commun. 2011, 13, 913–916. [Google Scholar] [CrossRef]
  43. Thomas, J.M. Handbook of Heterogeneous Catalysis, 2nd Completely Revised and Enlarged Edition; Ertl, G., Knözinger, H., Schüth, F., Weitkamp, J., Eds.; Wiley: Hoboken, NJ, USA, 2008; Volume 8. [Google Scholar]
  44. Abe, K.; Uchida, H.; Inukai, J. Electro-Oxidation of CO Saturated in 0.1 M HClO4 on Basal and Stepped Pt Single-Crystal Electrodes at Room Temperature Accompanied by Surface Reconstruction. Surfaces 2019, 2, 315–325. [Google Scholar] [CrossRef] [Green Version]
  45. Arenz, M.; Mayrhofer, K.J.J.; Stamenković, V.; Blizanac, B.B.; Tomoyuki, T.; Ross, P.N.; Marković, N.M. The Effect of the Particle Size on the Kinetics of CO Electrooxidation on High Surface Area Pt Catalysts. J. Am. Chem. Soc. 2005, 127, 6819–6829. [Google Scholar] [CrossRef]
  46. Farias, M.J.S.; Busó-Rogero, C.; Vidal-Iglesias, F.J.; Solla-Gullón, J.; Camara, G.A.; Feliu, J.M. Mobility and Oxidation of Adsorbed CO on Shape-Controlled Pt Nanoparticles in Acidic Medium. Langmuir 2017, 33, 865–871. [Google Scholar] [CrossRef] [PubMed] [Green Version]
  47. Liu, Y.; Duan, Z.; Henkelman, G. Computational design of CO-tolerant Pt3M anode electrocatalysts for proton-exchange membrane fuel cells. Phys. Chem. Chem. Phys. 2019, 21, 4046–4052. [Google Scholar] [CrossRef] [PubMed]
  48. Maillard, F.; Savinova, E.R.; Stimming, U. CO monolayer oxidation on Pt nanoparticles: Further insights into the particle size effects. J. Electroanal. Chem. 2007, 599, 221–232. [Google Scholar] [CrossRef]
  49. Lafforgue, C.; Zadick, A.; Dubau, L.; Maillard, F.; Chatenet, M. Selected Review of the Degradation of Pt and Pd-based Carbon-supported Electrocatalysts for Alkaline Fuel Cells: Towards Mechanisms of Degradation. Fuel Cells 2018, 18, 229–238. [Google Scholar] [CrossRef]
  50. Weber, P.; Werheid, M.; Janssen, M.; Oezaslan, M. Fundamental Insights in Degradation Mechanisms of Pt/C Nanoparticles for the ORR. ECS. Transactions 2018, 86, 433–445. [Google Scholar]
  51. Kuriganova, A.; Leontyeva, D.V.; Smirnova, N. On the mechanism of electrochemical dispersion of platinum under the action of alternating current. Russ. Chem. Bull. 2015, 64, 2769–2775. [Google Scholar] [CrossRef]
  52. Zhang, C.; Hu, J.; Wang, X.; Zhang, X.; Toyoda, H.; Nagatsu, M.; Meng, Y. High performance of carbon nanowall supported Pt catalyst for methanol electro-oxidation. Carbon 2012, 50, 3731–3738. [Google Scholar] [CrossRef]
  53. Wang, X.X.; Tan, Z.H.; Zeng, M.; Wang, J.N. Carbon nanocages: A new support material for Pt catalyst with remarkably high durability. Sci. Rep. 2014, 4, 4437. [Google Scholar] [CrossRef] [PubMed] [Green Version]
  54. Zhang, Z.; Wang, Y.; Wang, X. Nanoporous bimetallic Pt-Au alloy nanocomposites with superior catalytic activity towards electro-oxidation of methanol and formic acid. Nanoscale 2011, 3, 1663–1674. [Google Scholar] [CrossRef]
  55. Garsany, Y.; Singer, I.L.; Swider-Lyons, K.E. Impact of film drying procedures on RDE characterization of Pt/VC electrocatalysts. J. Electroanal. Chem. 2011, 662, 396–406. [Google Scholar] [CrossRef]
  56. Basu, D.; Basu, S. Synthesis and characterization of Pt-Au/C catalyst for glucose electro-oxidation for the application in direct glucose fuel cell. Int. J. Hydrogen Energy 2011, 36, 14923–14929. [Google Scholar] [CrossRef]
  57. Fu, T.; Fang, J.; Wang, C.; Zhao, J. Hollow porous nanoparticles with Pt skin on a Ag-Pt alloy structure as a highly active electrocatalyst for the oxygen reduction reaction. J. Mater. Chem. A 2016, 4, 8803–8811. [Google Scholar] [CrossRef]
  58. Saleh, F.S.; Easton, E.B. Assessment of the ethanol oxidation activity and durability of Pt catalysts with or without a carbon support using Electrochemical Impedance Spectroscopy. J. Power Sour. 2014, 246, 392–401. [Google Scholar] [CrossRef]
  59. Sohn, H.; Xiao, Q.; Seubsai, A.; Ye, Y.; Lee, J.; Han, H.; Park, S.; Chen, G.; Lu, Y. Thermally Robust Porous Bimetallic (NixPt1–x) Alloy Mesocrystals within Carbon Framework: High-Performance Catalysts for Oxygen Reduction and Hydrogenation Reactions. ACS Appl. Mater. Interfaces 2019, 11, 21435–21444. [Google Scholar] [CrossRef]
  60. Jiang, Z.-J.; Jiang, Z.-J.; Meng, Y. High catalytic performance of Pt nanoparticles on plasma treated carbon nanotubes for electrooxidation of ethanol in a basic solution. Appl. Surf. Sci. 2011, 257, 2923–2928. [Google Scholar] [CrossRef]
  61. Jung, J.H.; Park, H.J.; Kim, J.; Hur, S.H. Highly durable Pt/graphene oxide and Pt/C hybrid catalyst for polymer electrolyte membrane fuel cell. J. Power Sour. 2014, 248, 1156–1162. [Google Scholar] [CrossRef]
  62. Zeng, M.; Wang, X.X.; Tan, Z.H.; Huang, X.X.; Wang, J.N. Remarkable durability of Pt-Ir alloy catalysts supported on graphitic carbon nanocages. J. Power Sour. 2014, 264, 272–281. [Google Scholar] [CrossRef]
  63. Sakthivel, M.; Drillet, J.-F. An extensive study about influence of the carbon support morphology on Pt activity and stability for oxygen reduction reaction. Appl. Catal. B Environ. 2018, 231, 62–72. [Google Scholar] [CrossRef]
  64. Song, J.; Li, G.; Qiao, J. Ultrafine porous carbon fiber and its supported platinum catalyst for enhancing performance of proton exchange membrane fuel cells. Electrochim. Acta 2015, 177, 174–180. [Google Scholar] [CrossRef]
  65. Naidoo, Q.-L.; Naidoo, S.; Petrik, L.; Nechaev, A.; Ndungu, P. The influence of carbon based supports and the role of synthesis procedures on the formation of platinum and platinum-ruthenium clusters and nanoparticles for the development of highly active fuel cell catalysts. Int. J. Hydrogen Energy 2012, 37, 9459–9469. [Google Scholar] [CrossRef]
  66. Liu, Z.; Hong, L.; Tham, M.P.; Lim, T.H.; Jiang, H. Nanostructured Pt/C and Pd/C catalysts for direct formic acid fuel cells. J. Power Sour. 2006, 161, 831–835. [Google Scholar] [CrossRef]
  67. Alekseenko, A.A.; Guterman, V.E.; Volochaev, V.A.; Belenov, S.V.; Vladimir, G. Effect of wet synthesis conditions on the microstructure and active surface area of Pt/C catalysts. Inorg. Mater. 2015, 51, 1258–1263. [Google Scholar] [CrossRef]
  68. Zhou, Z.; Wang, S.; Zhou, W.; Wang, G.; Jiang, L.; Li, W.; Song, S.; Liu, J.; Sun, G.; Xin, Q. Novel synthesis of highly active Pt/C cathode electrocatalyst for direct methanol fuel cell. Chem. Commun. 2003, 394–395. [Google Scholar] [CrossRef] [PubMed]
  69. Lebègue, E.; Baranton, S.; Coutanceau, C. Polyol synthesis of nanosized Pt/C electrocatalysts assisted by pulse microwave activation. J. Power Sour. 2011, 196, 920–927. [Google Scholar] [CrossRef]
  70. Gu, Z.; Balbuena, P.B. Absorption of Atomic Oxygen into Subsurfaces of Pt(100) and Pt(111): Density Functional Theory Study. J. Phys. Chem. C 2007, 111, 9877–9883. [Google Scholar] [CrossRef]
Figure 1. (a) XRD powder patterns of the Pt/C catalysts; (b) Particle size distribution of catalysts. The blue line refers to the catalyst prepared by the electrochemical dispersion pulsed alternating current technique (ED), the green curve is associated with commercial catalyst (JM), and the red curve is from the catalyst obtained by the polyol process (CH).
Processes 08 00947 g001
Figure 2. (a)–(c) Transmission electron microscopy images and (d)–(f) platinum particle size distributions in the Pt/C electrocatalysts: ED (a,d), CH (b,e), and JM (c,f) samples; a comparison of Pt particle sizes (D111) evaluated via XRD and TEM (h); TGA of the ED, CH, and JM samples (i).
Processes 08 00947 g002
Figure 3. (a) Н2 adsorption/desorption range of cyclic voltammogram (CV) curves of Pt/C (sample CH) in 0.5 М H2SO4, N2 atmosphere, potential ranges 0.03–1.3 V (1), 0.05–1.3 V vs. the reversible hydrogen electrode (RHE) (2); CO stripping on the Pt/C catalysts ED (b), CH (c), and JM (d) in electrolyte 0.5 M H2SO4 with a scan rate of 20 mV s−1.
Processes 08 00947 g003
Figure 4. Stability of the Pt/C electrocatalysts as a function of the cyclic potential range: (a) 0.05–1.3 V vs. RHE; (b) 0.6–1.0 V vs. RHE.
Processes 08 00947 g004
Figure 5. CV curves of the ED, CH, and JM Pt/C catalysts in 0.5 M H2SO4 + 0.5 M EtOH, scan rate 20 mV s−1 (a,b); specific activity and mass activity during the ethanol oxidation reaction (EOR) processes versus the ECSA of Pt/C catalysts, black balls—ED sample, red balls—CH sample, green balls—ED sample (c); durability of the ED, CH, and JM Pt/C catalysts in 0.5 M H2SO4 + 0.5 M EtOH (d).
Processes 08 00947 g005
Table 1. Experimental conditions for evaluation of the operation stability of the Pt/C catalysts during cycling. The electrochemically active surface area (ECSA) during cycling was calculated using the HUPD method.
ParameterAccelerated Ageing, Mode 1Soft Ageing, Mode 2
Number of cycles15005000
Electrolyte0.5 М H2SO40.5 М H2SO4
Temperature (°C)22–2322–23
Potential range (V)0.05–1.350.6–1.0
Potential sweep rate (mV s−1)50100
ECSA measurementEvery 100 cyclesEvery 500 cycles
Table 2. XRD data of the Pt/C catalysts.
SampleEDCHJM
Dav (nm)4.742.552.48
ΔDav0.860.50.2
D111 (nm)6.682.762.70
D200 (nm)4.712.082.01
D200/D1110.780.770.83
<D> (nm)5.562.692.68
σ (nm)3.491.631.69
Sgeom (m2 g−1)28.1359.9658.14
a (Å)3.91533.91333.9151
Table 3. Comparative ECSA values of Pt/C electrocatalysts obtained by polyol methods and the commercial JM catalyst in different labs.
Sample Preparation MethodParticle Size, nmECSA (m2 g−1)/TechniqueRef.
JM (40 wt % Pt/C)3.050.9/HUPD[52]
3.546.4/HUPD[53]
-39.4/HUPD[54]
3.149 ± 1/HUPD[55]
4.660.8/HUPD[56]
3.074.5/CO stripping[57]
3.529.0/HUPD[58]
-63.9/HUPD[59]
3.0943.9/HUPD[60]
3.054.21/HUPD[61]
3.046.4/HUPD[62]
5.118.17/HUPD[63]
3.436.3/HUPD[64]
3.76190.0/HUPD[65]
3.518.0 ± 0.1/HUPD 1This work
22.0 ± 0.2/HUPD 2This work
26.0 ± 0.5/CO stripping 3This work
30 wt % Pt/C/polyol process3.6-[66]
19 wt % Pt/C/polyol process2.099.0 ± 10/HUPD[67]
40 wt % Pt/C/polyol process2.9-[68]
40 wt % Pt/C/microwave-assisted polyol synthesis2.6 ± 0.7-[69]
40 wt % Pt/C/polyol synthesis3.158.6/HUPD[49]
40 wt % Pt/C/polyol synthesis2.953.0/HUPD[34]
CH (40 wt % Pt/C)/polyol synthesis2.55 (XRD)13.0 ± 0.1/HUPD 1This work
15.0 ± 0.2/HUPD 2This work
22.0 ± 0.2/CO stripping 3This work
1 Potential range of 0.05–1.30 V; 2 Potential range of 0.03–1.26 V; 3 Eads = 0.3 V vs. RHE.

