Effect of Annealing on Strain Rate Sensitivity of Metallic Glass under Nanoindentation

School of Physics Science and Technology, Xinjiang University, Urumqi 830046, China
Metals 2020, 10(8), 1063; https://doi.org/10.3390/met10081063
Submission received: 14 June 2020
/
Revised: 31 July 2020
/
Accepted: 4 August 2020
/
Published: 6 August 2020
(This article belongs to the Special Issue Metallic Glasses: Kinetics, Processing and Applications)
Abstract
:The influence of isothermal annealing on the strain rate sensitivity (SRS) of a Zr-based bulk metallic glass (BMG) was investigated by nanoindentation. A more positive SRS is observed with a decrease in the content of the free volume (FV) of the sample. Furthermore, the SRS becomes nearly constant with increasing annealing time when the FV is annealed out. By taking into consideration the FV-assisted activation and combination of the shear transformation zones (STZs), the underlying mechanism is well understood. The current work may offer useful insights into the correlation between the microstructure and mechanical properties of BMGs.
1. Introduction
Strain rate is believed to have a significant effect on the deformation dynamics of bulk metallic glasses (BMGs) [1,2,3]. Due to the high-resolution load–displacement data and a minimally preparing influence on the mechanical behavior, nanoindentation becomes an efficient method of understanding the dependence of mechanical properties on the strain rate in BMGs [2,4,5,6,7]. For instance, it is demonstrated that the serrated flow is more conspicuous under slower indentation rates [4,6,7,8]. The underlying mechanism is usually ascribed to the spatiotemporal behavior of shear bands (SBs) [9,10]. A sufficiently low indentation will result in discontinuous and isolated SBs, while the simultaneous operation of multiple SBs is needed to accommodate the rapidly imposed strain under high indentation rates, i.e., the serrated events are restrained. It is therefore expected that the indentation rate will have a direct impact on the yielding strength or hardness, because the latter is strongly influenced by the initiation and propagation of the SBs [11,12,13,14].
Due to the absence of long-range order, there are no dislocations or other crystalline defects in BMGs. Upon loading, the casting defects, i.e., free volume (FV), act as the basic stress concentrators. Specifically, a concentrator firstly initiates an embryonic SB by activating a group of shear transformation zones (STZs) locally, and when the embryonic SB becomes larger than a critical size, it will result in the formation of a mature SB, which corresponds to the yield of BMGs [12,14,15,16]. In this regard, the actual fundamental factor that influences the correlation between yielding strength (or hardness) and strain rate is the FV, which is a key parameter controlling the activation of the STZs [17,18,19]. Sub- (glass transition temperature) annealing, which can apparently annihilate the FV in BMGs [20,21], is therefore supposed to have a direct effect on the strain rate sensitivity (SRS) of hardness. For instance, Bhattacharyya et al. [5] reported a more negative SRS in a structural relaxed (sub- annealing) sample, and attributed this correlation to the lower content of FV and the stronger relaxation-induced hardening under lower strain rates. However, Xue et al. [22] demonstrated a positive but less sensitive SRS in the annealed specimen, which was ascribed to a lower production of FV throughout the deformation and a weaker softening under the higher strain rate. Analogous inconsistent results can also be found in other literatures, but the underlying mechanism is still under debate [23,24,25,26,27,28]. Evidently, how the SRS of BMGs is affected by the structural state is not clear yet. Further investigation is needed to obtain more insights into this issue. In this work, the dependence of SRS on the structural state of a Zr-based BMG is investigated both in as-cast and structurally relaxed states. A more positive SRS is found accompanying the decreasing FV content. Meanwhile, the SRS becomes nearly constant with increasing annealing time when the FV is annealed out.
2. Materials and Methods
Zr52.5Cu17.9Ni14.6Al10Ti5 (Vit 105) BMG plates with dimensions of 40 × 20 × 2.5 mm3 were obtained by arc-melting and drop casting methods, which can be found in [12]. The as-cast plates were cut into cubic specimens with dimensions of 5 × 5 × 2 mm3 for indentation tests. The isothermal annealing was carried out in a muffle furnace by sealing the samples in evacuated quartz capsules. There were six groups of samples with different structural states, which were labeled as “a”, “b”, “c”, “d”, “e” and “f”. Sample “a” was as-cast. Samples “b”, “c” and “d” were annealed at 550 K, 600 K and 650 K for 30 min, respectively. Samples “e” and “f” were annealed at 650 K for 2 h and 24 h, respectively. The detailed annealing parameters are listed in Table 1. The amorphous state of all samples was identified through X-ray diffraction and high-resolution transmission electron microscopy (HRTEM, JEOL JEM-2100F, Tokyo, Japan). The FV changes induced by isothermal annealing were indirectly measured by differential scanning calorimetry (DSC). DSC tests with a heating rate of 0.33 K/s were conducted using a TA Q2000 thermal analysis instrument in a flow of argon.
Prior to the indentation tests, the surfaces of the specimens were ground and polished to a mirror finish. Nanoindentation tests were performed in a Nanovea PB 1000 system (Irvine, CA, USA) with a standard Berkovich tip indenter. All of the samples were indented under a load-controlled mode and the peak load, Pmax, was fixed at 300 mN. The selection of 300 mN was intended to eliminate the effect of indentation size on the hardness [29]. The loading rates, , were chosen as Pmax/300, Pmax/150, Pmax/30 and Pmax/15 mN/s, respectively. The determination of the loading rate employed in this work was bounded by experimental limitations; slow loading rates are complicated by thermal and electronic drift, while data acquisition rates are insufficient to resolve extremely rapid cases. To assistance in the analysis of the variation of hardness with the strain rate, all of the loading rates, , adopted in this study were transformed into the equivalent strain rate based on the equation deduced by Pan et al. [30]: . A lateral distance of 20 μm between two adjacent indentations was adopted to remove the overlap of the plastic regions. At least 16 indentations were conducted far from the bulk boundary under each condition for the reliability of the data. After tests, scanning electron microscopy (SEM; SU6600, Tokyo, Japan) was used to identify the surface morphologies of the indentations for a more accurate hardness calculation.
3. Results
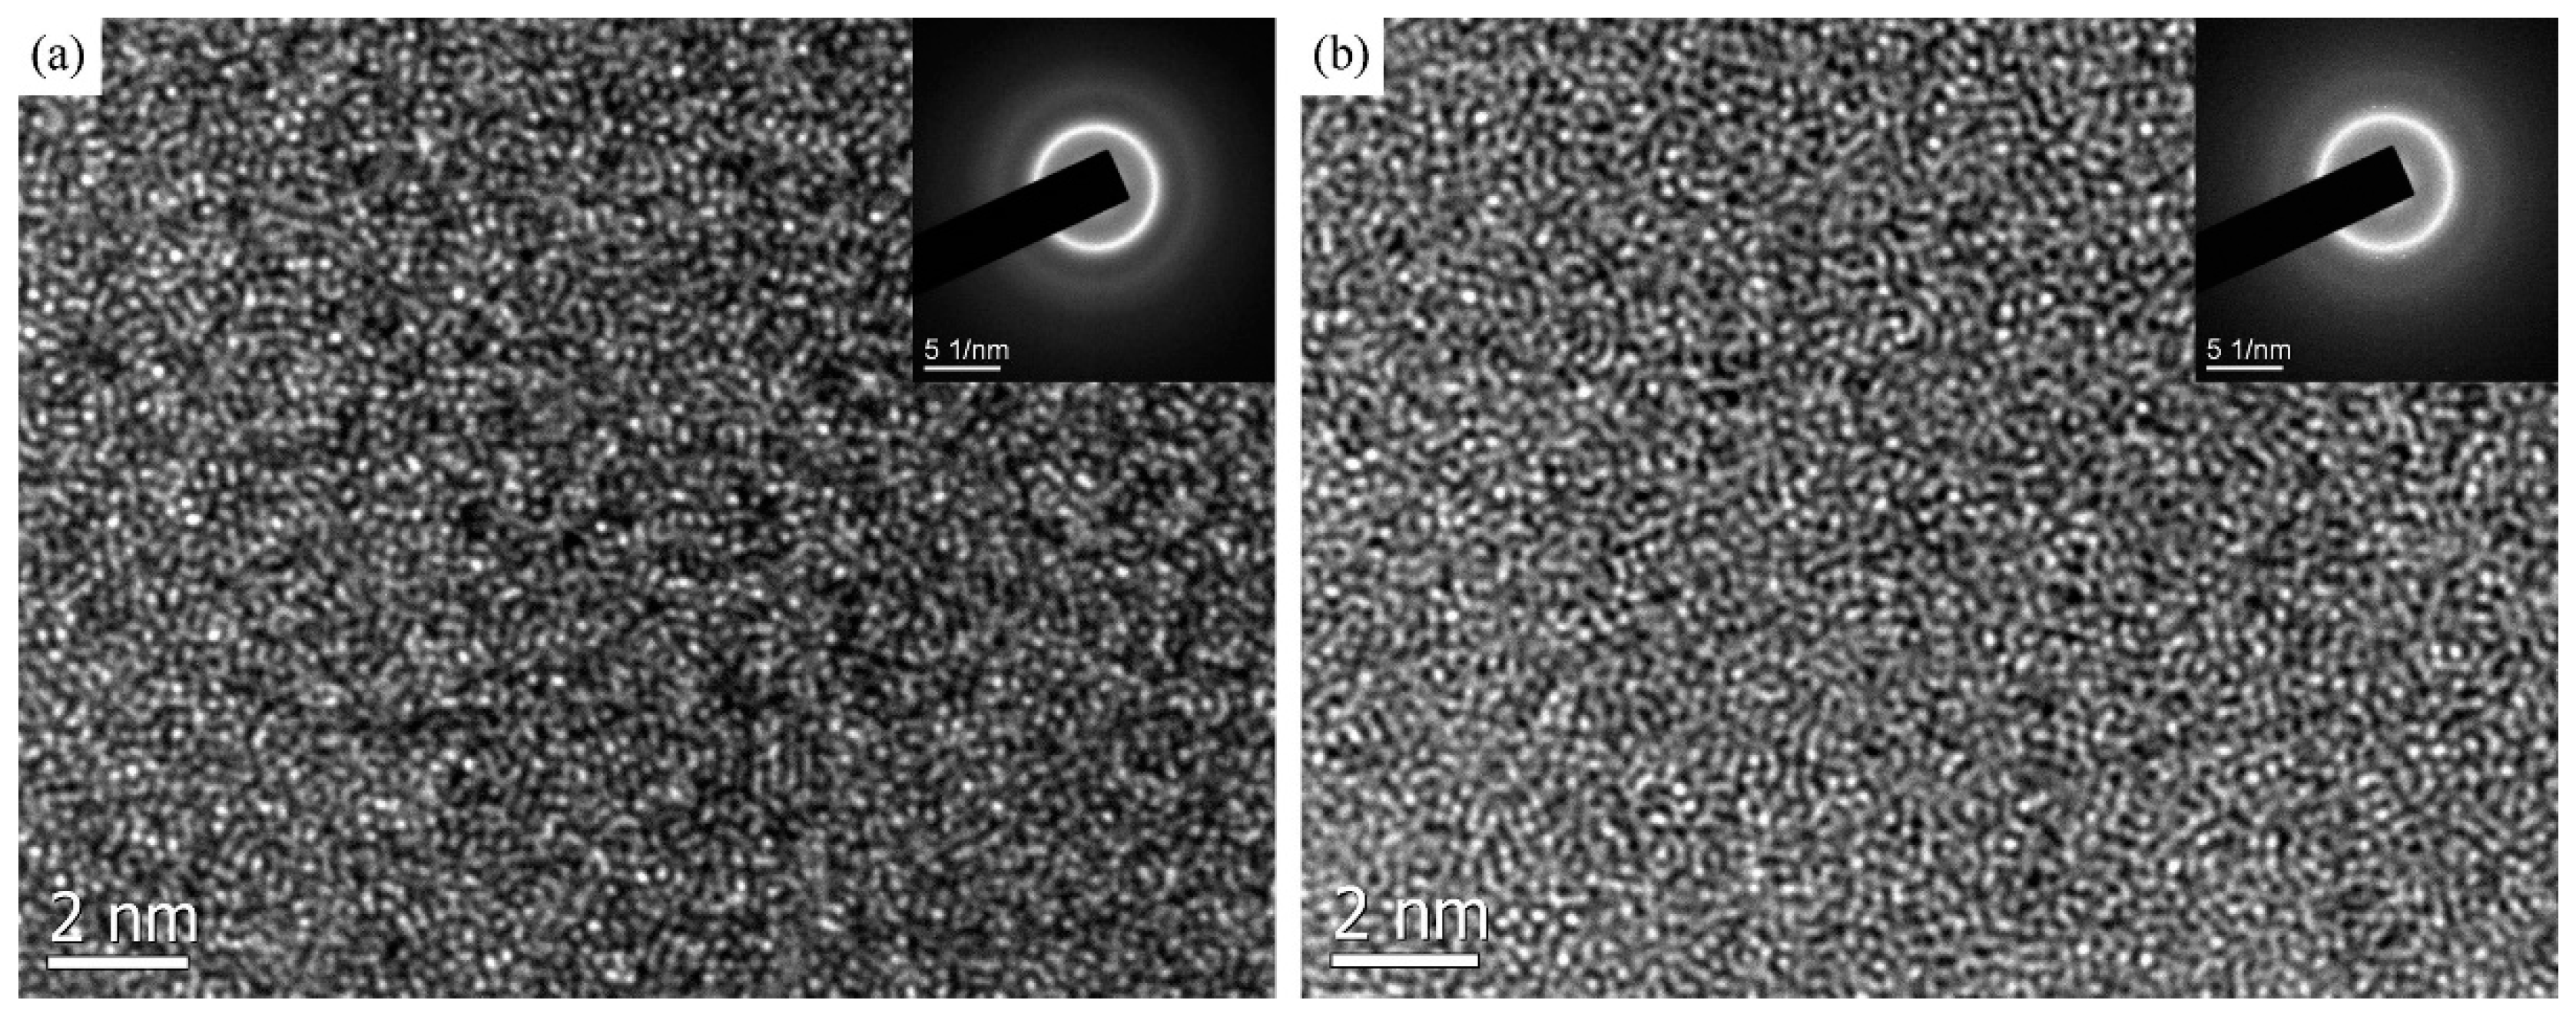
HRTEM images of samples “a” and “f” are presented in Figure 1a,b, respectively. Accordingly, it can be found that all of the atoms distribute randomly, which indicates a glassy state of the samples. In addition, the corresponding selected area electron diffraction (SAED) patterns are displayed in the upper right corner of the HRTEM images. Obviously, they further confirm the amorphous structure of the specimens. Considering that sample “f” was annealed at the highest temperature (650 K) for the longest time (24 h) in this work, the above results corroborate that all the samples used in this work have a fully amorphous nature.
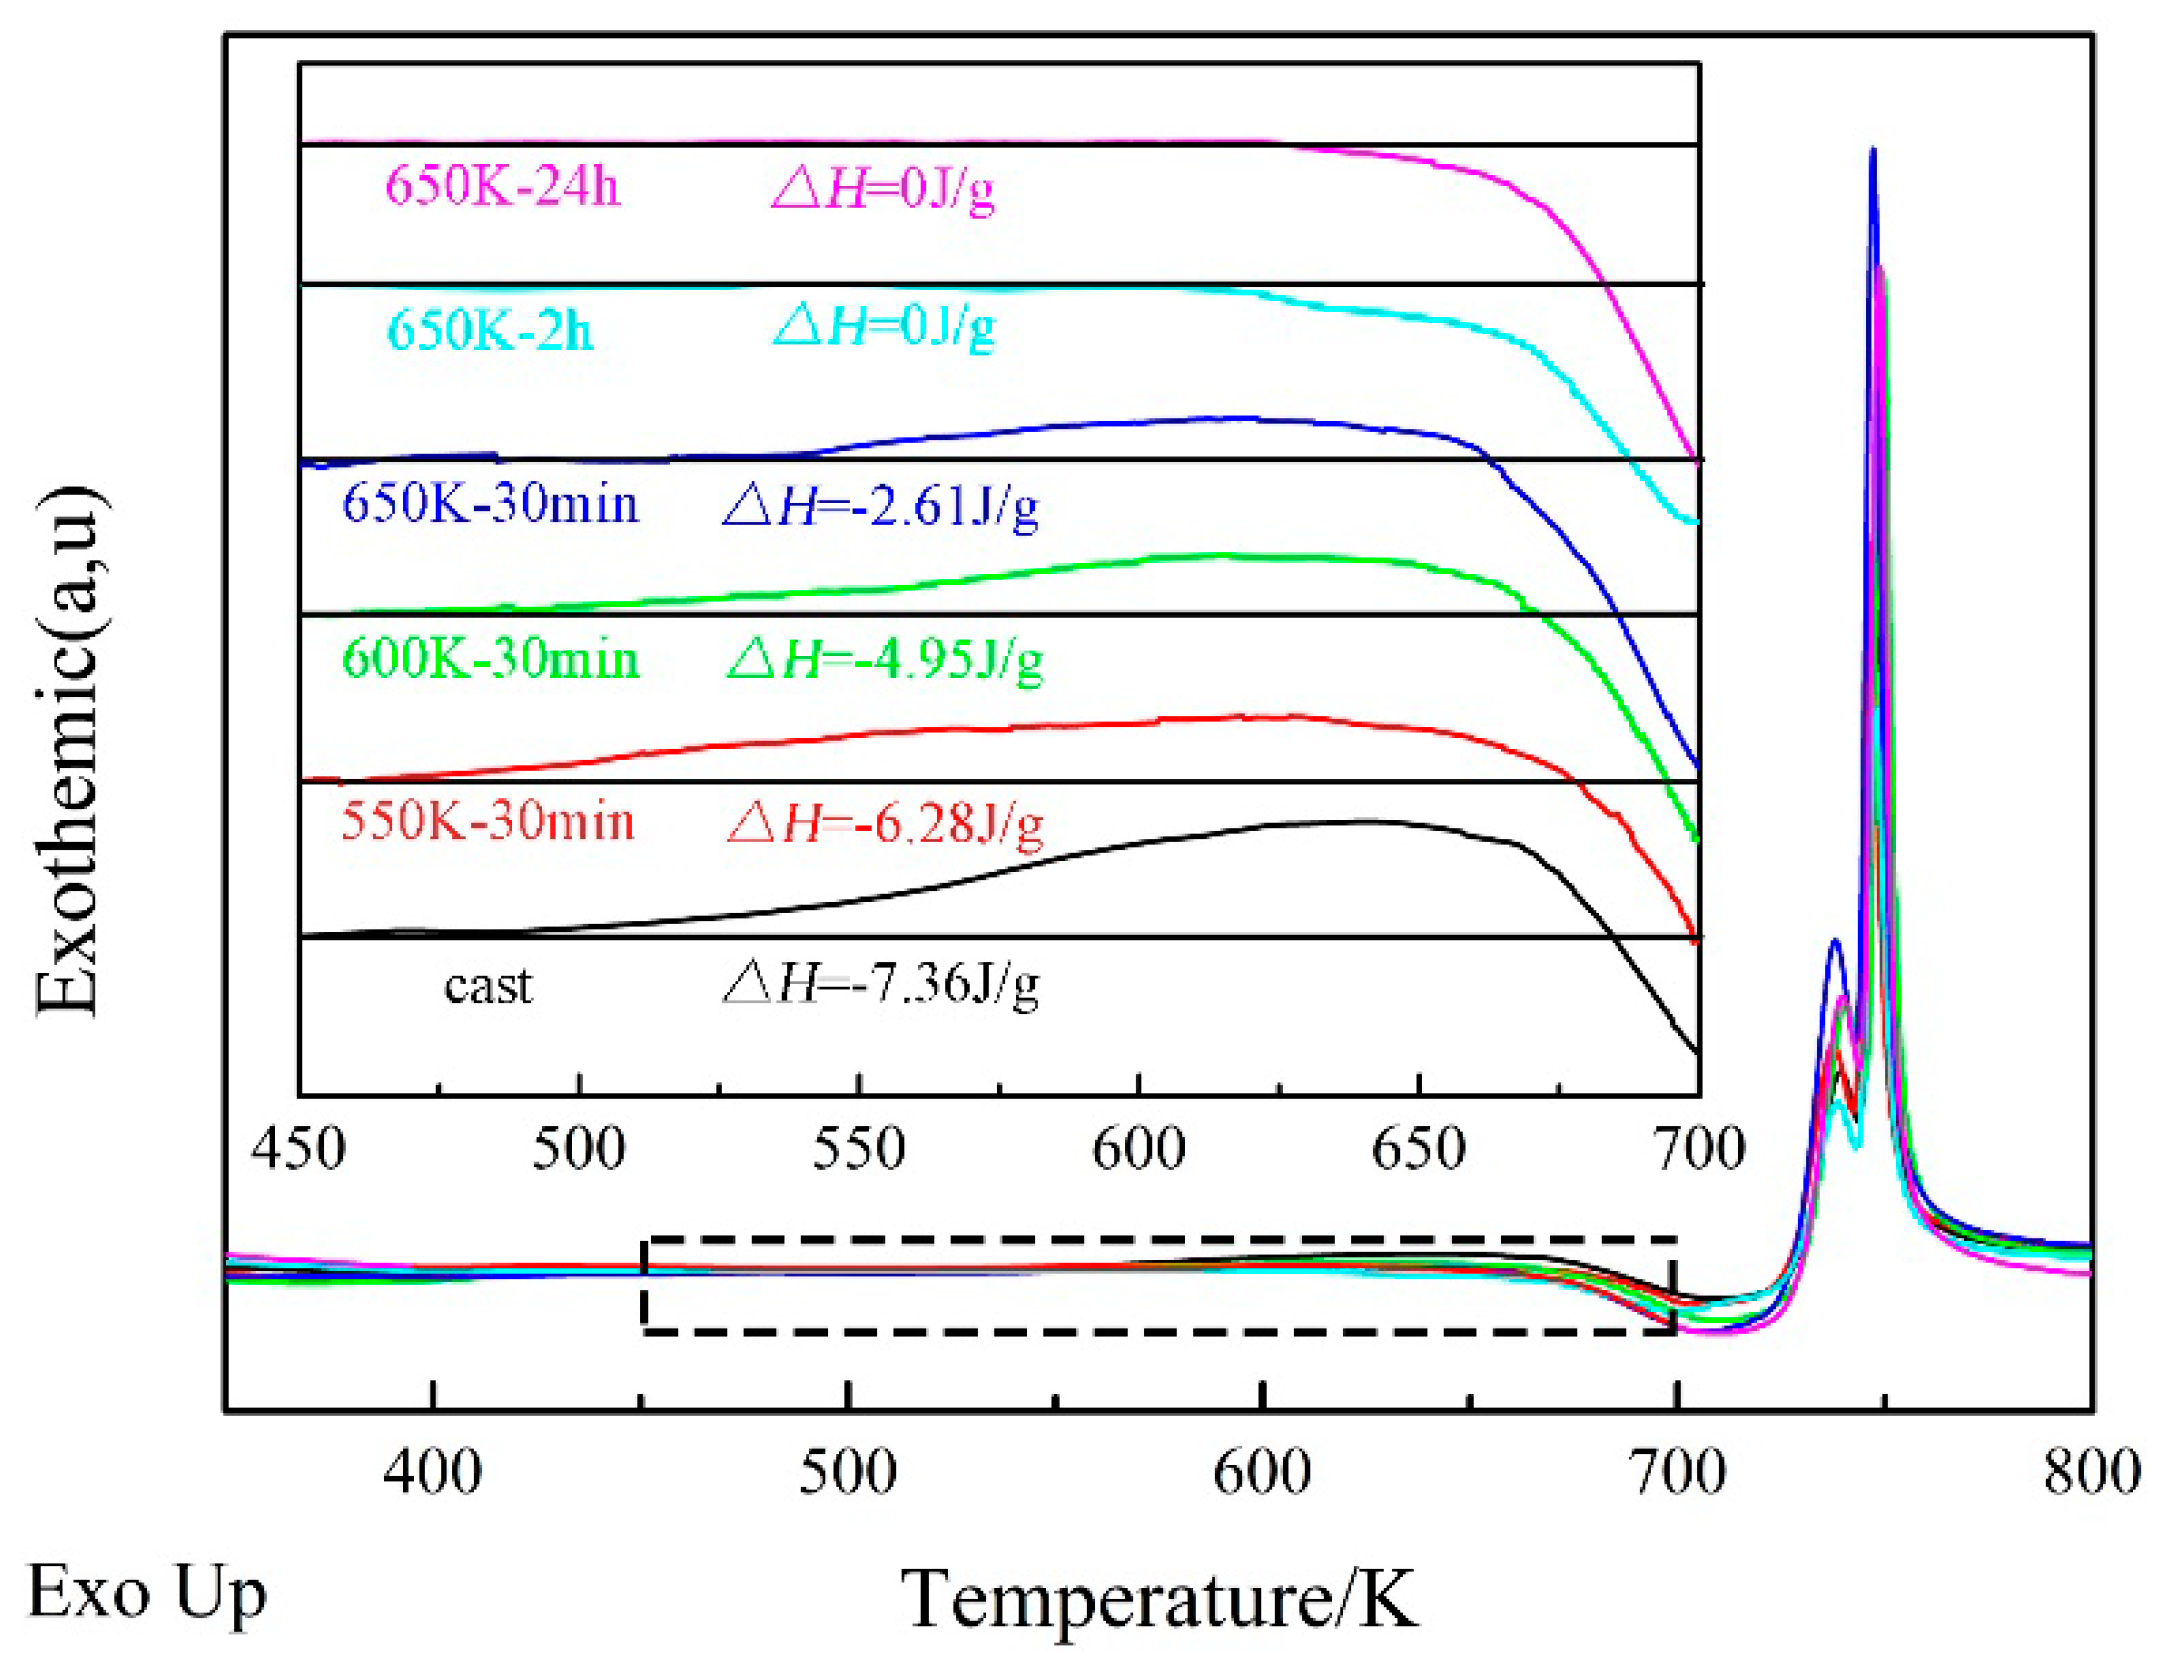
The DSC curves are shown in Figure 2. Apparently, all of the samples exhibit similar glass transition and crystallization. However, as shown in the inset of Figure 2, an obvious difference can be found by amplifying the excess relaxation before the glass transition. It is accepted that the heat release () of the excess relaxation prior to glass transition could be treated as an indicator of the excess FV () in BMGs. The relationship can be written as: [31,32], where is a constant of the material. Accordingly, it can be found that the FV concentration decreases monotonically with the increasing annealing temperature or annealing time. In particular, samples “e” and “f” do not exhibit exothermic behavior prior to the glass transition (), indicating that the FV in these samples is almost annealed out.
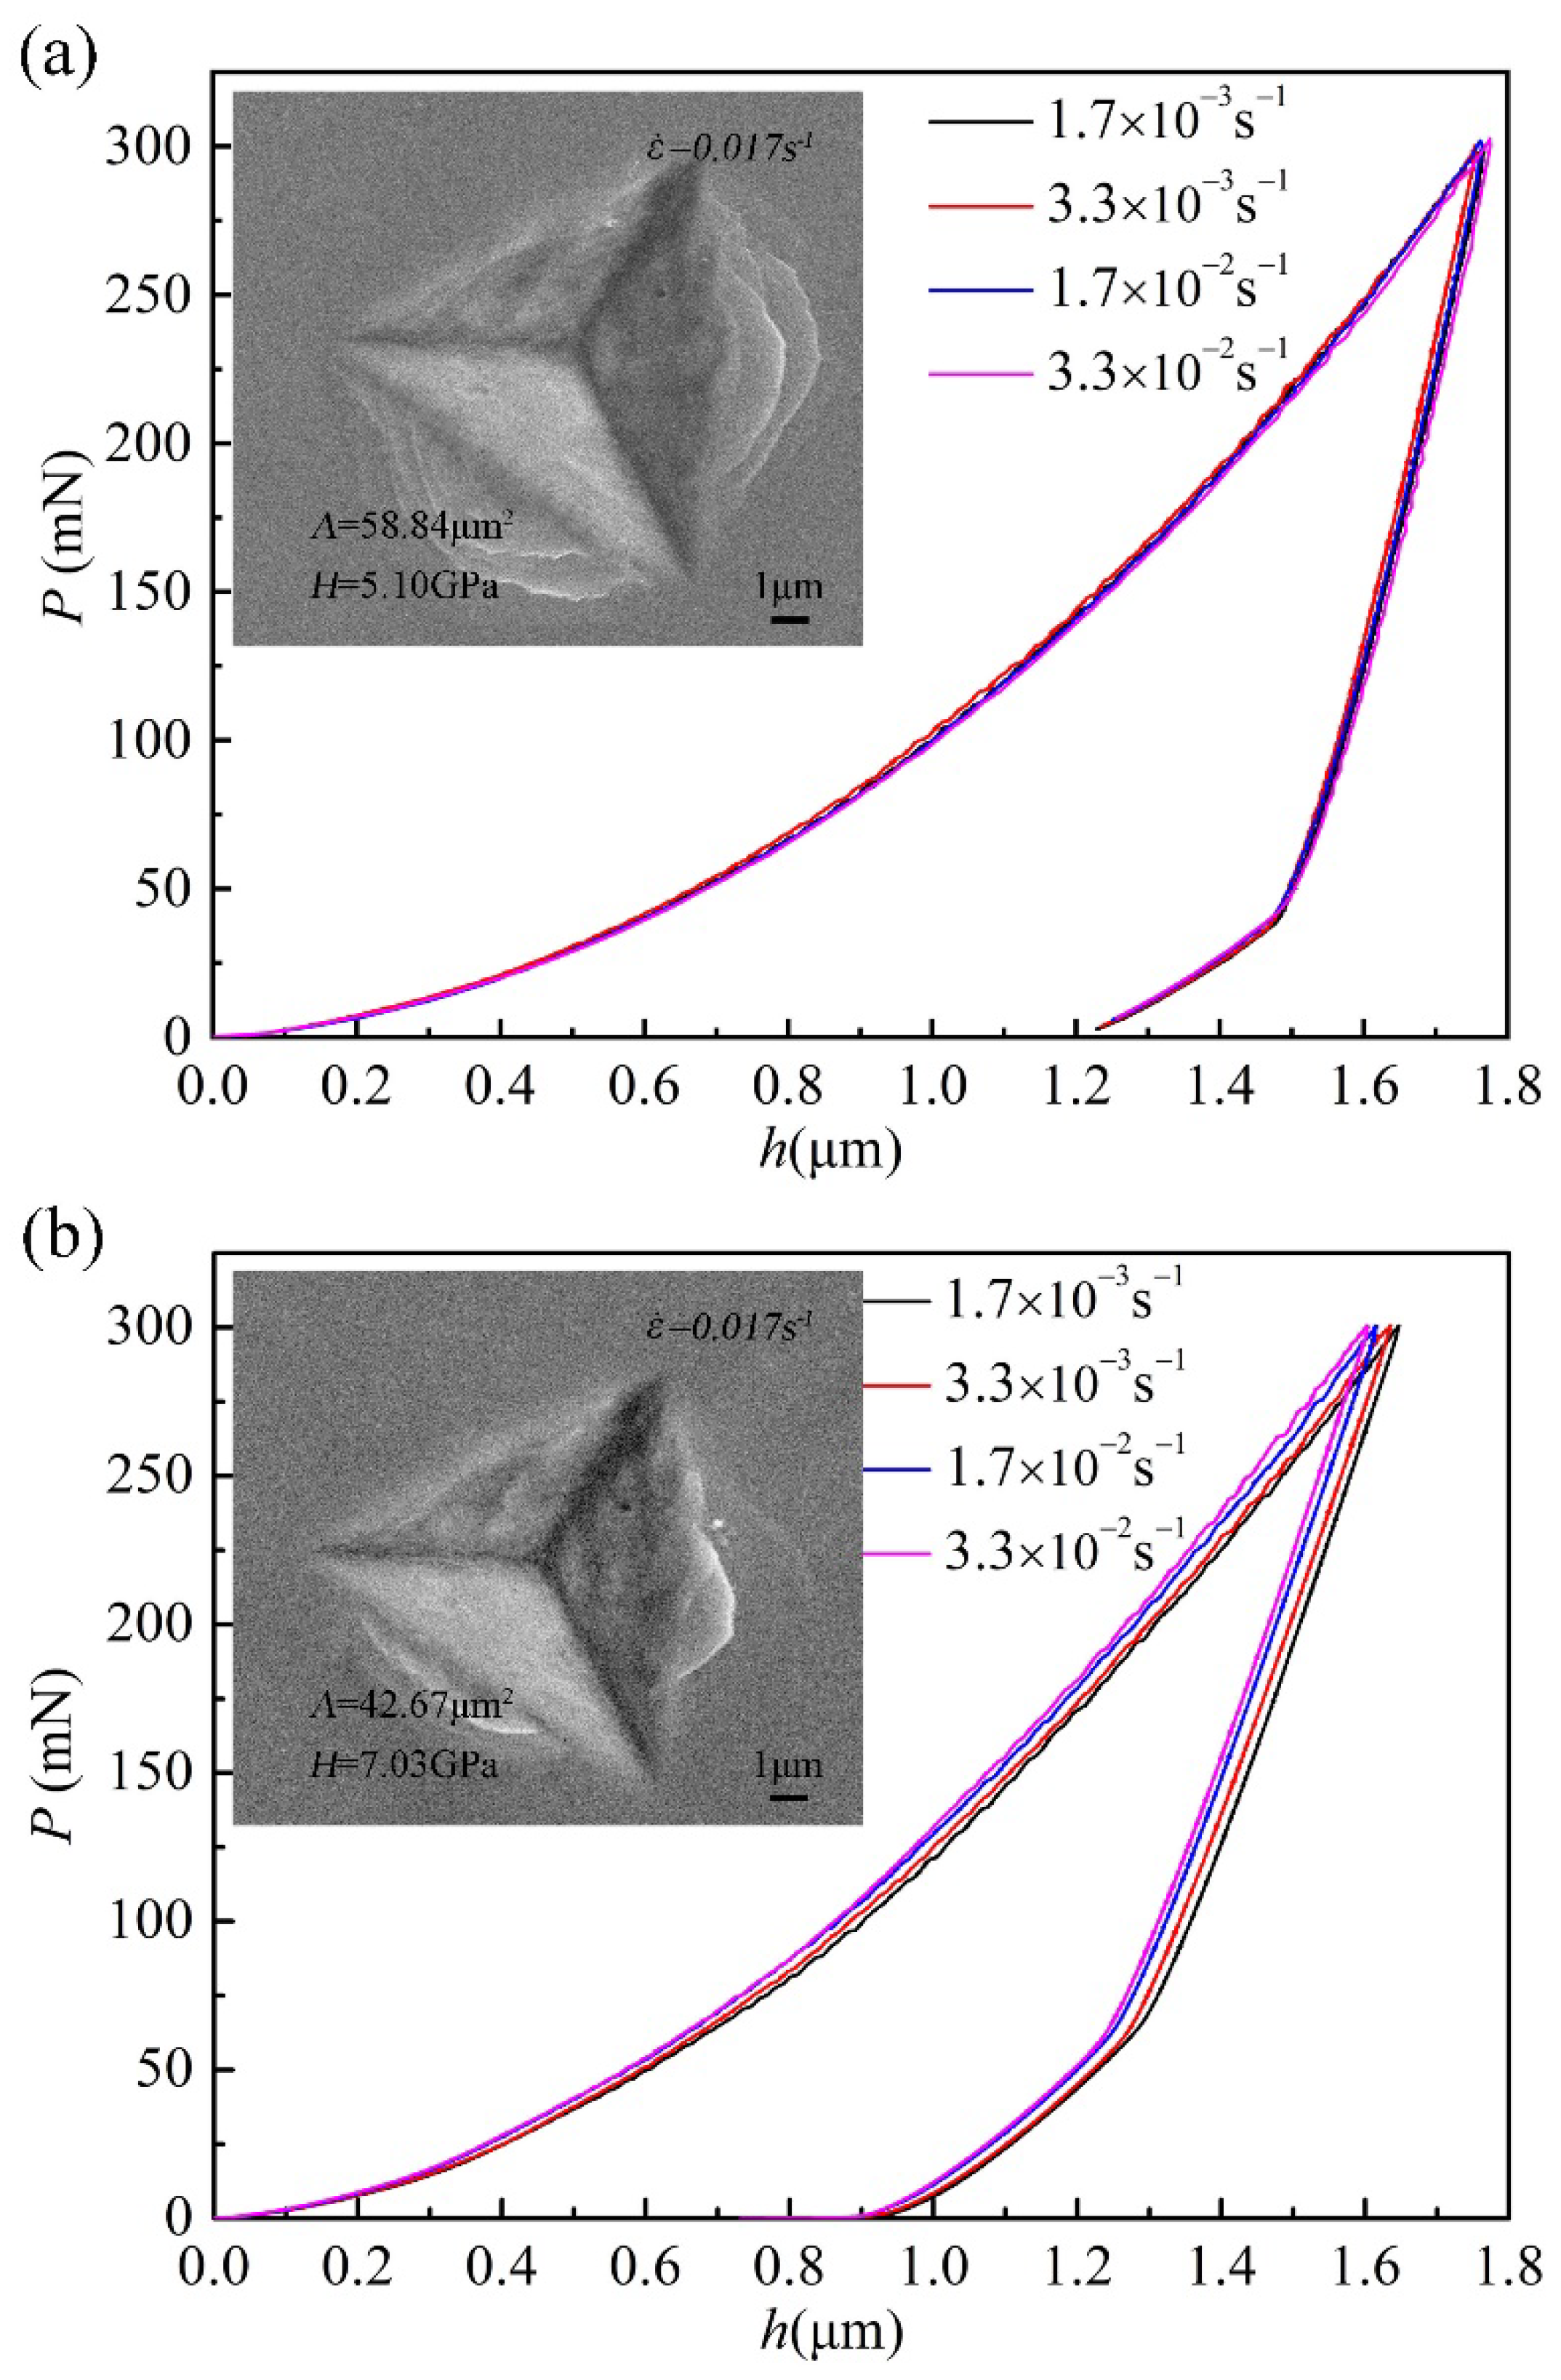
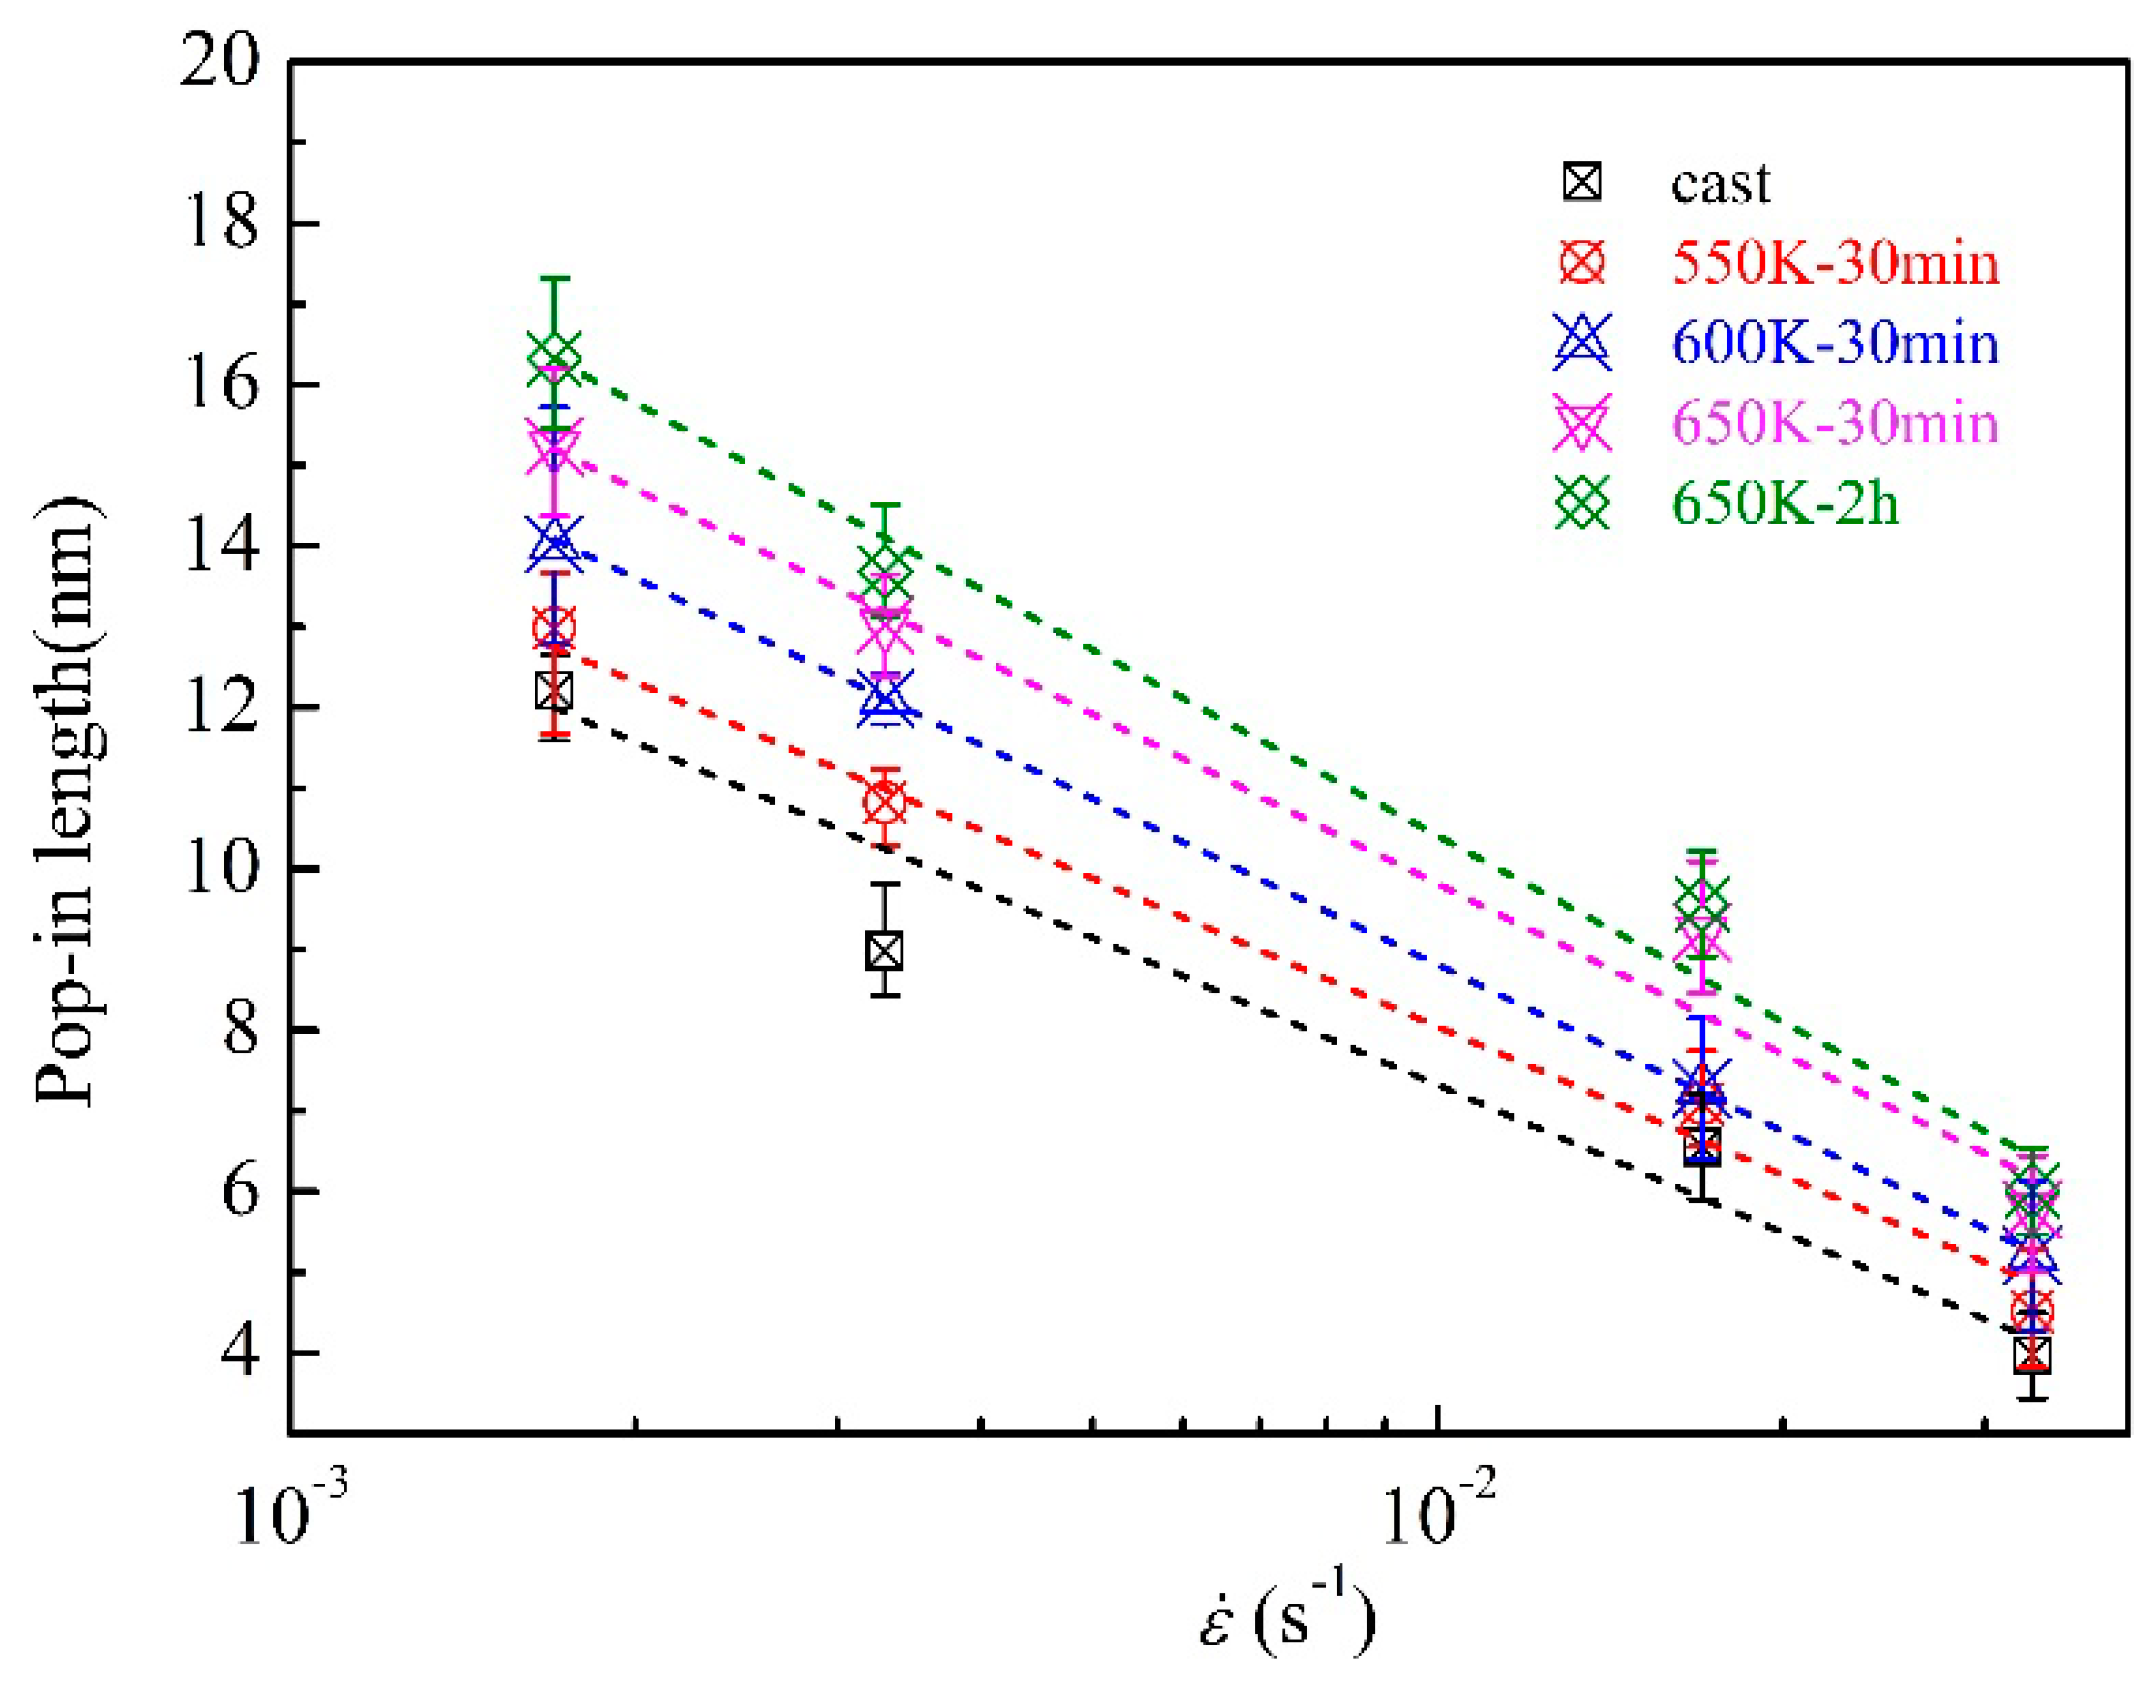
Figure 3a,b demonstrate the representative load–displacement (P-h) curves of samples “a” and “d” under different strain rates, respectively (Figure 3a is cited from my previous work [29]). The insets show the SEM micrographs of indentations tested with the equivalent strain rate of 0.017 s−1, which implies considerable pile-ups around the indents. It is pointed out that the pile-up changes the effective contact area and hence may lead to errors in the calculation of hardness by the Oliver–Pharr method [5,33]. As a consequence, Meyer’s hardness, defined as , is adopted in this work. Here, , is the true contact area and is the averaged length from the corner to the center of the triangular impression with the help of SEM [29,34]. From Figure 3a, it can be found that the curvature of the loading section of the P-h curves for sample “a” increases slightly with increasing strain rate, which indicates a higher load is needed under a larger strain rate for a same indentation depth, i.e., a positive dependence of hardness on strain rate. Moreover, a more pronounced rise of the curvature can be found during the loading segment of the P-h curves for sample “d”, as demonstrated in Figure 3b, which means a larger SRS caused by annealing. In addition, as shown in Figure 3a,b, apparent displacement bursts (i.e., pop-in) can be observed during the loading section, especially at lower strain rates. A more intuitive representation of the correlation between the average length of pop-in, which is counted using the method pointed out by Burgess et al. [3] and the equivalent strain rate, is illustrated in Figure 4. Strikingly, the average length of pop-in decreases by increasing either the strain rate or FV content. This considerable variation may be ascribed to the inhomogeneous flow of the material underneath the indenter [3,15].
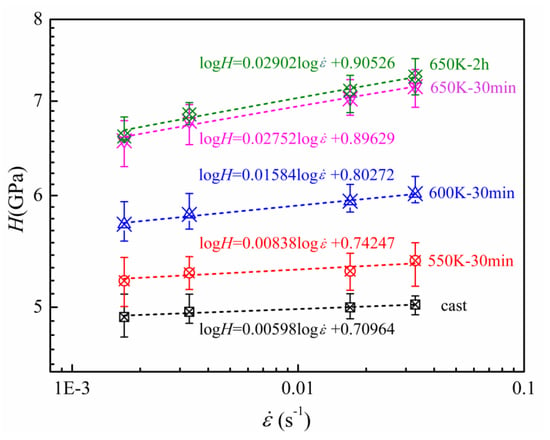
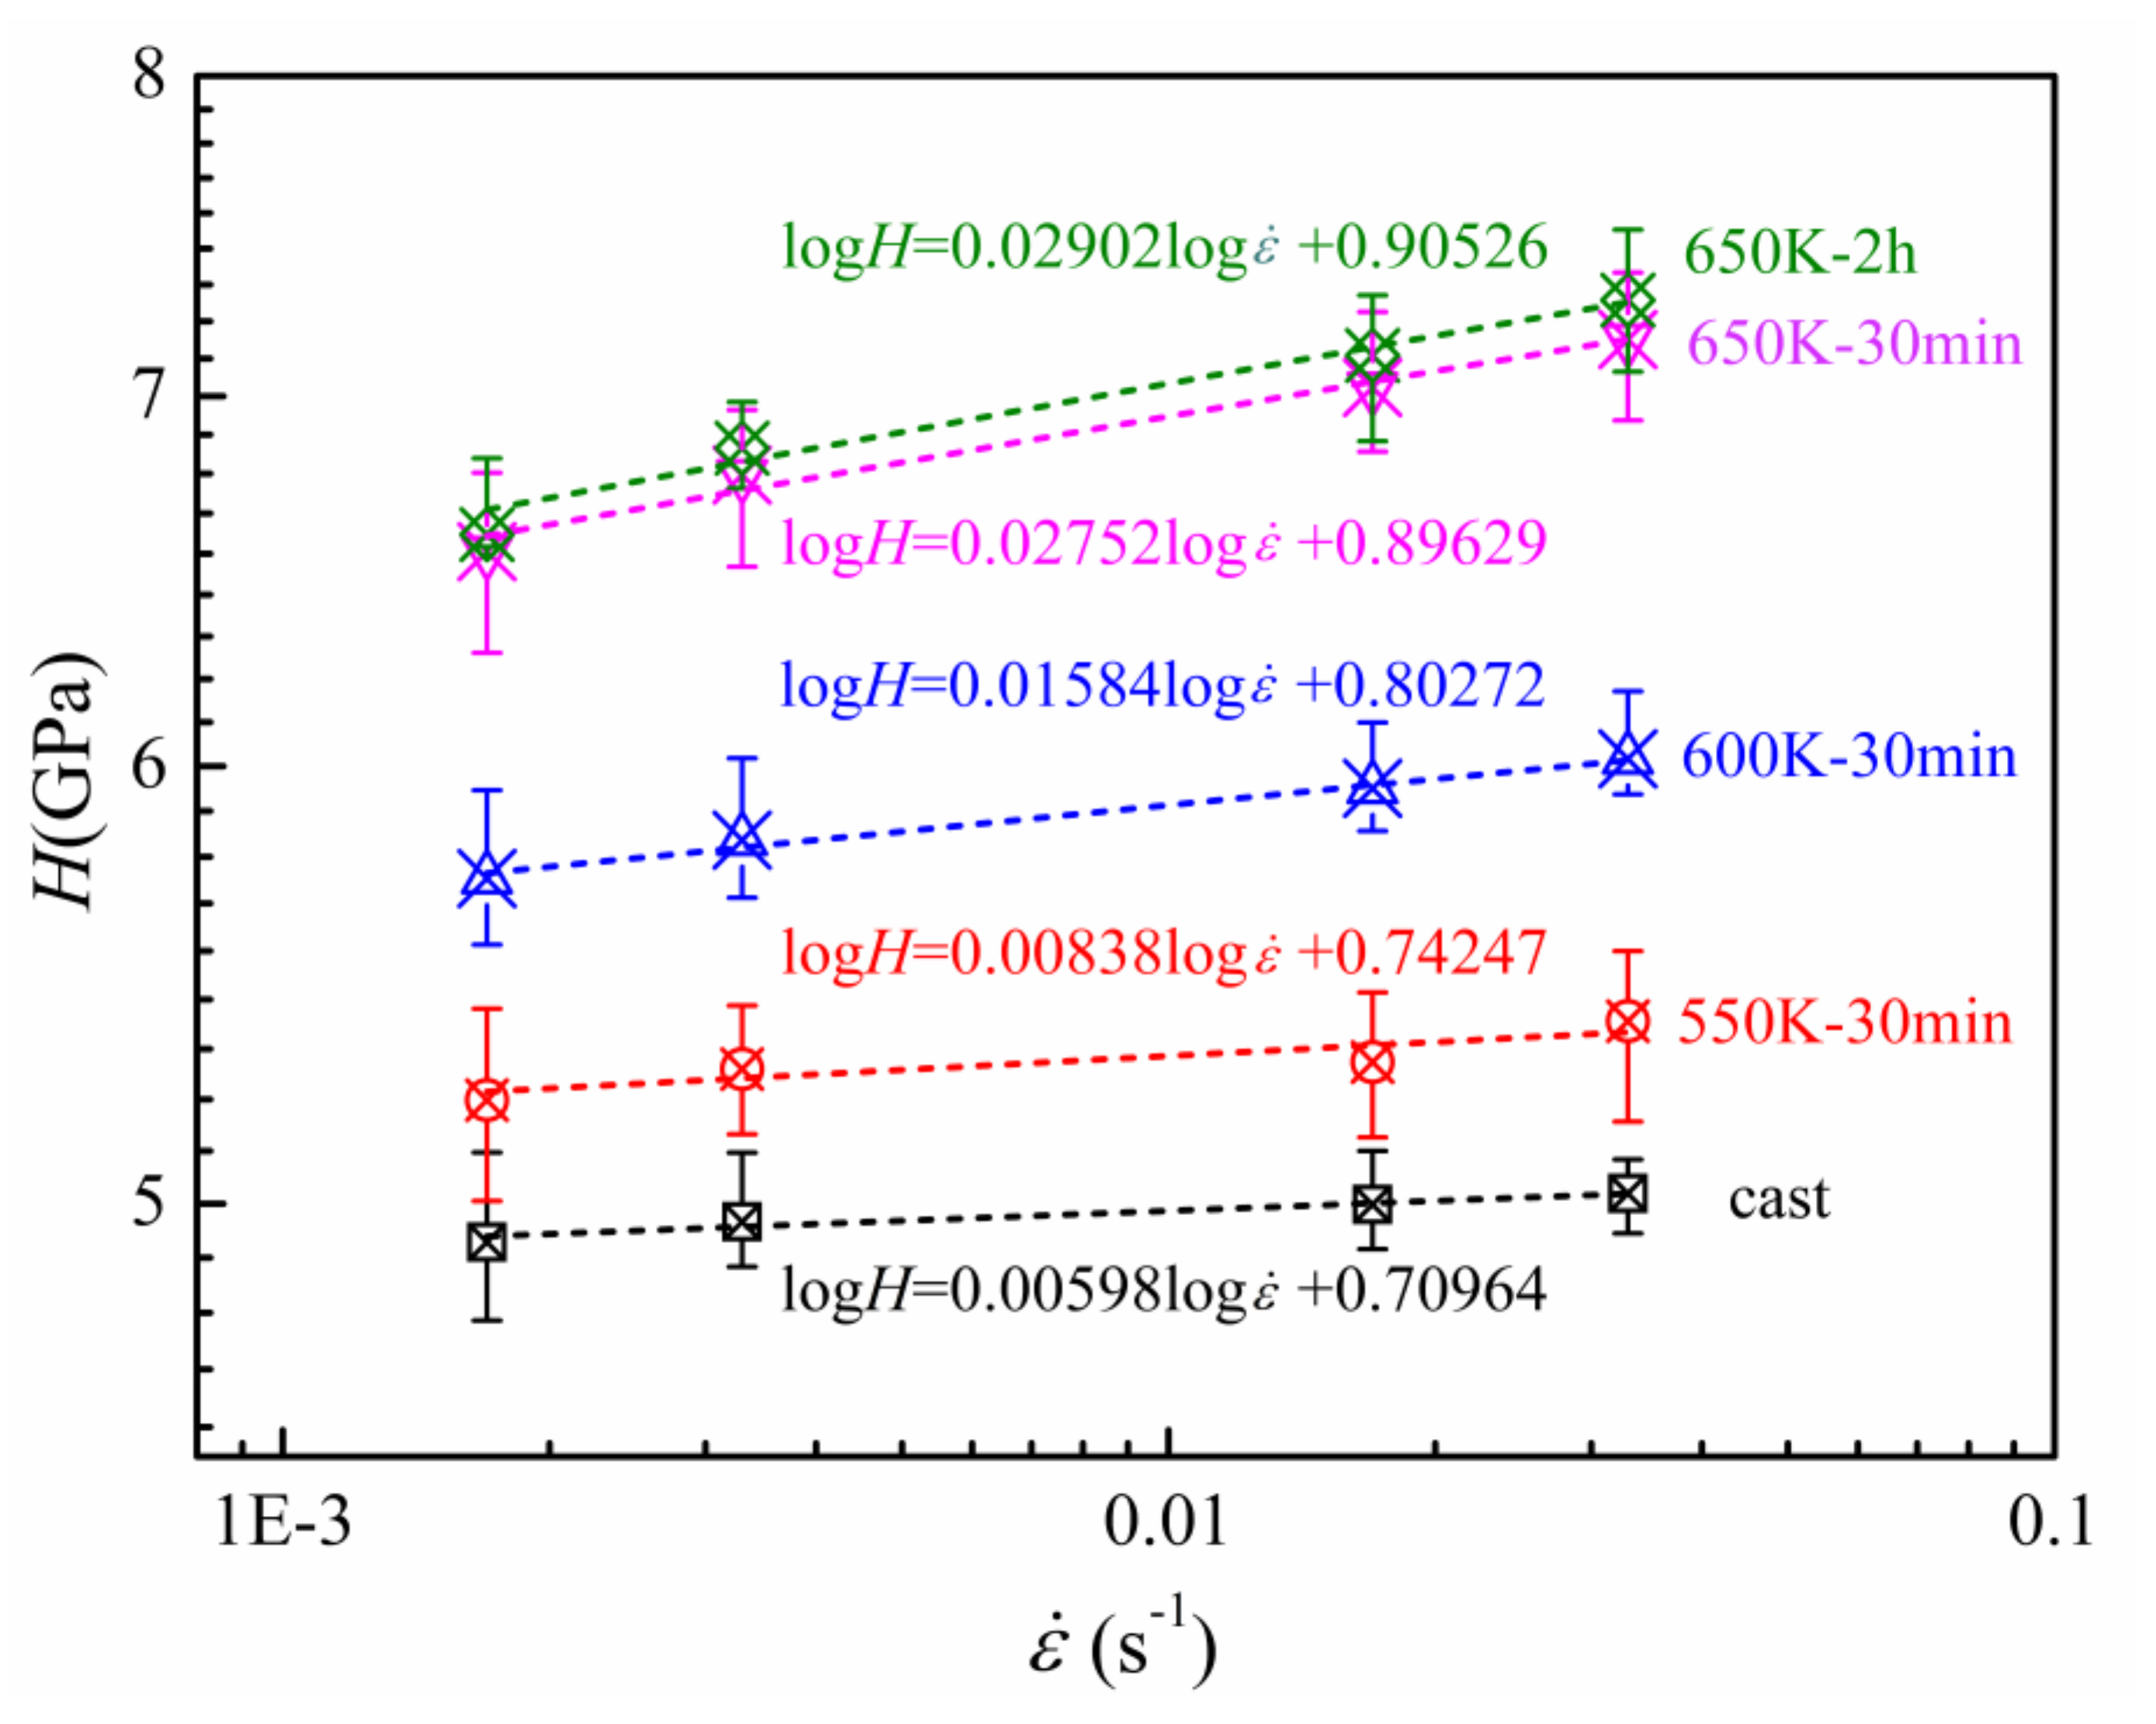
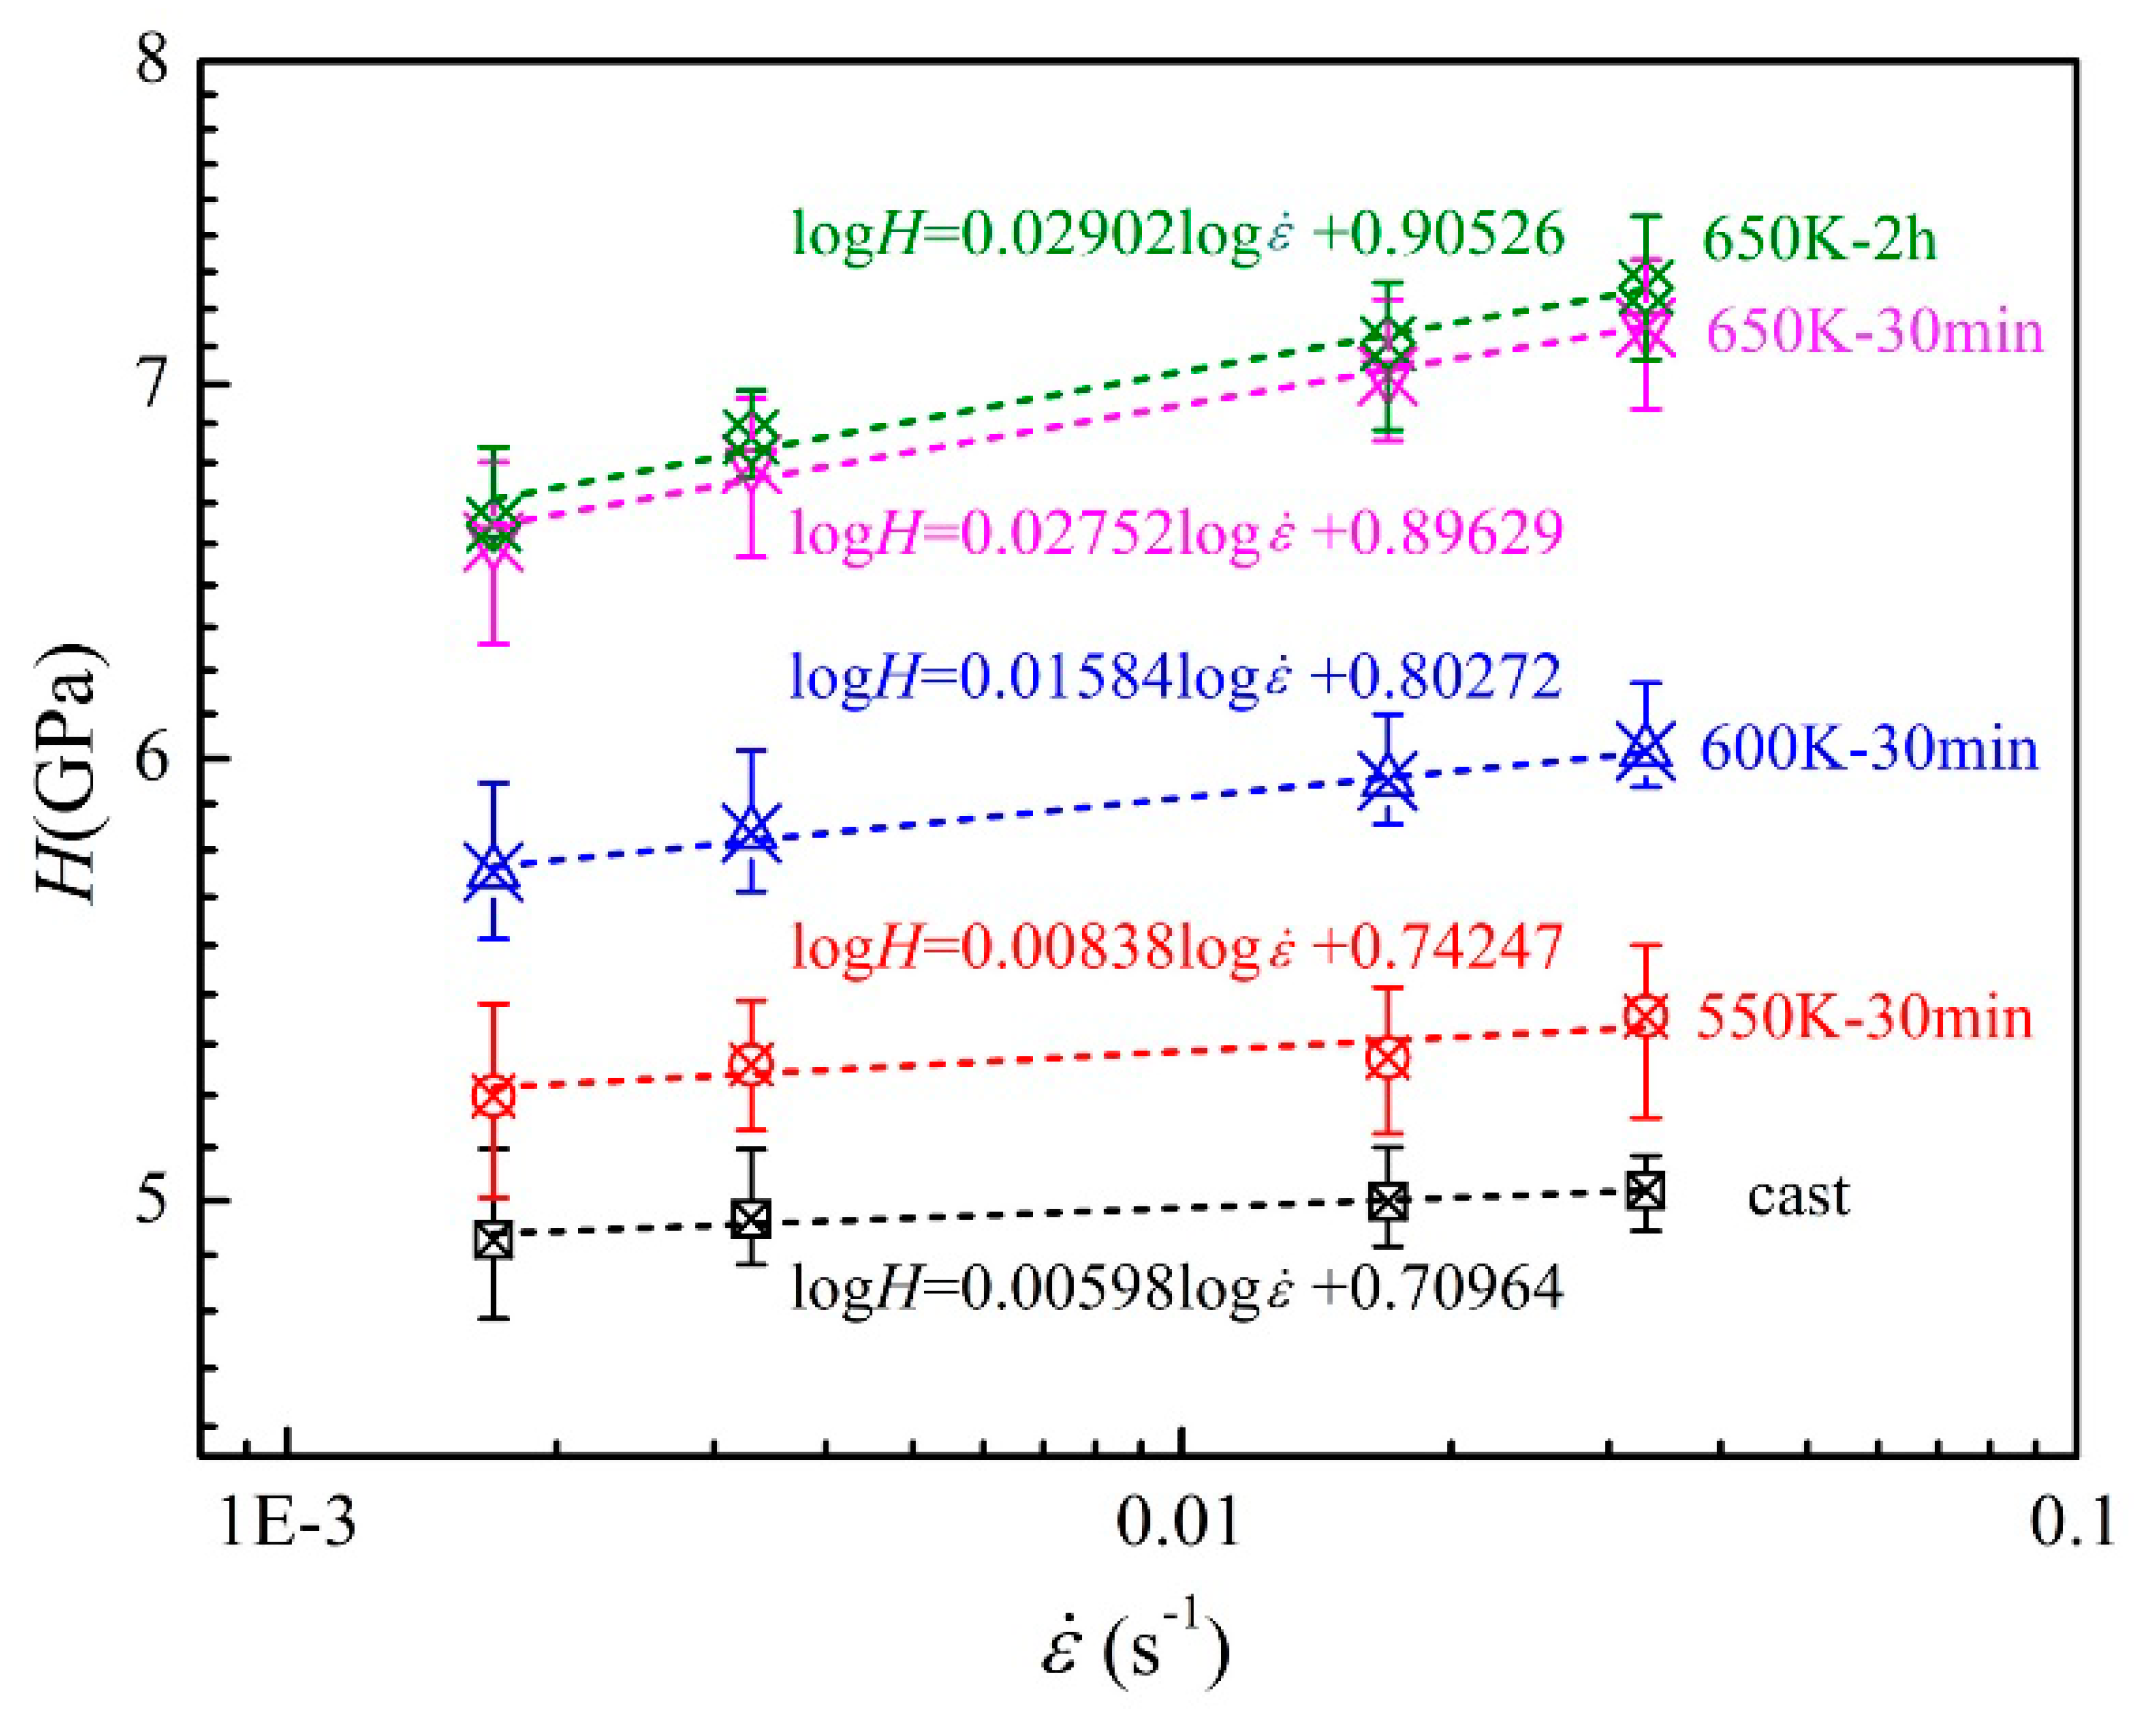
The variance of hardness with strain rate is presented in Figure 5 in double-logarithmic coordinates. The SRS exponent is evaluated by:
Here, and correspond to the indentation hardness and equivalent strain rate, respectively. Therefore, is the slope of the dotted line obtained via fitting the dependence of the hardness on the equivalent strain rate presented in Figure 5. Evidently, for all samples, is positive and has a monotonous increase with the decreasing FV. More importantly, the SRS of sample “d” is very close to that of sample “e”. Taking into consideration the extremely low content of FV in the two samples, it indicates that the SRS of the BMG will remain constant when the FV is annealed out. To get further insight into the dependence of SRS on the structural state, the same nanoindentation tests were performed on sample “f”. As demonstrated in Figure 6, is about 0.0298, which is approximately equal to that observed for sample “e”. This confirms that the SRS becomes nearly constant with increasing annealing time in the fully annealed BMG.
4. Discussion
It has been suggested that the BMG structure could be considered as a composite consisting of an elastic backbone and liquid-like regions containing a high density of FV [35,36]. Upon loading, STZ operation is more likely to occur around the weaker zones with excess FV through the diffusion and rearrangements of the atoms [37,38,39]. Once the external stress reaches a critical value, the activated STZs extend outwards and connect with each other. This results in the formation of a mature SB and gives rise to an irreversible yield of BMG [14,39,40]. The critical stress can be treated as the yielding strength or the hardness. During this process, the activation of STZs occurs first, and then plasticity grows, leading to the creation of FV [41]. In order to describe the homogeneous elastoplastic behavior of BMGs, Jiang et al. [41] proposed a constitutive model by incorporating the interaction of FV dynamic and shear transformations. The dimensionless constitutive equations are:
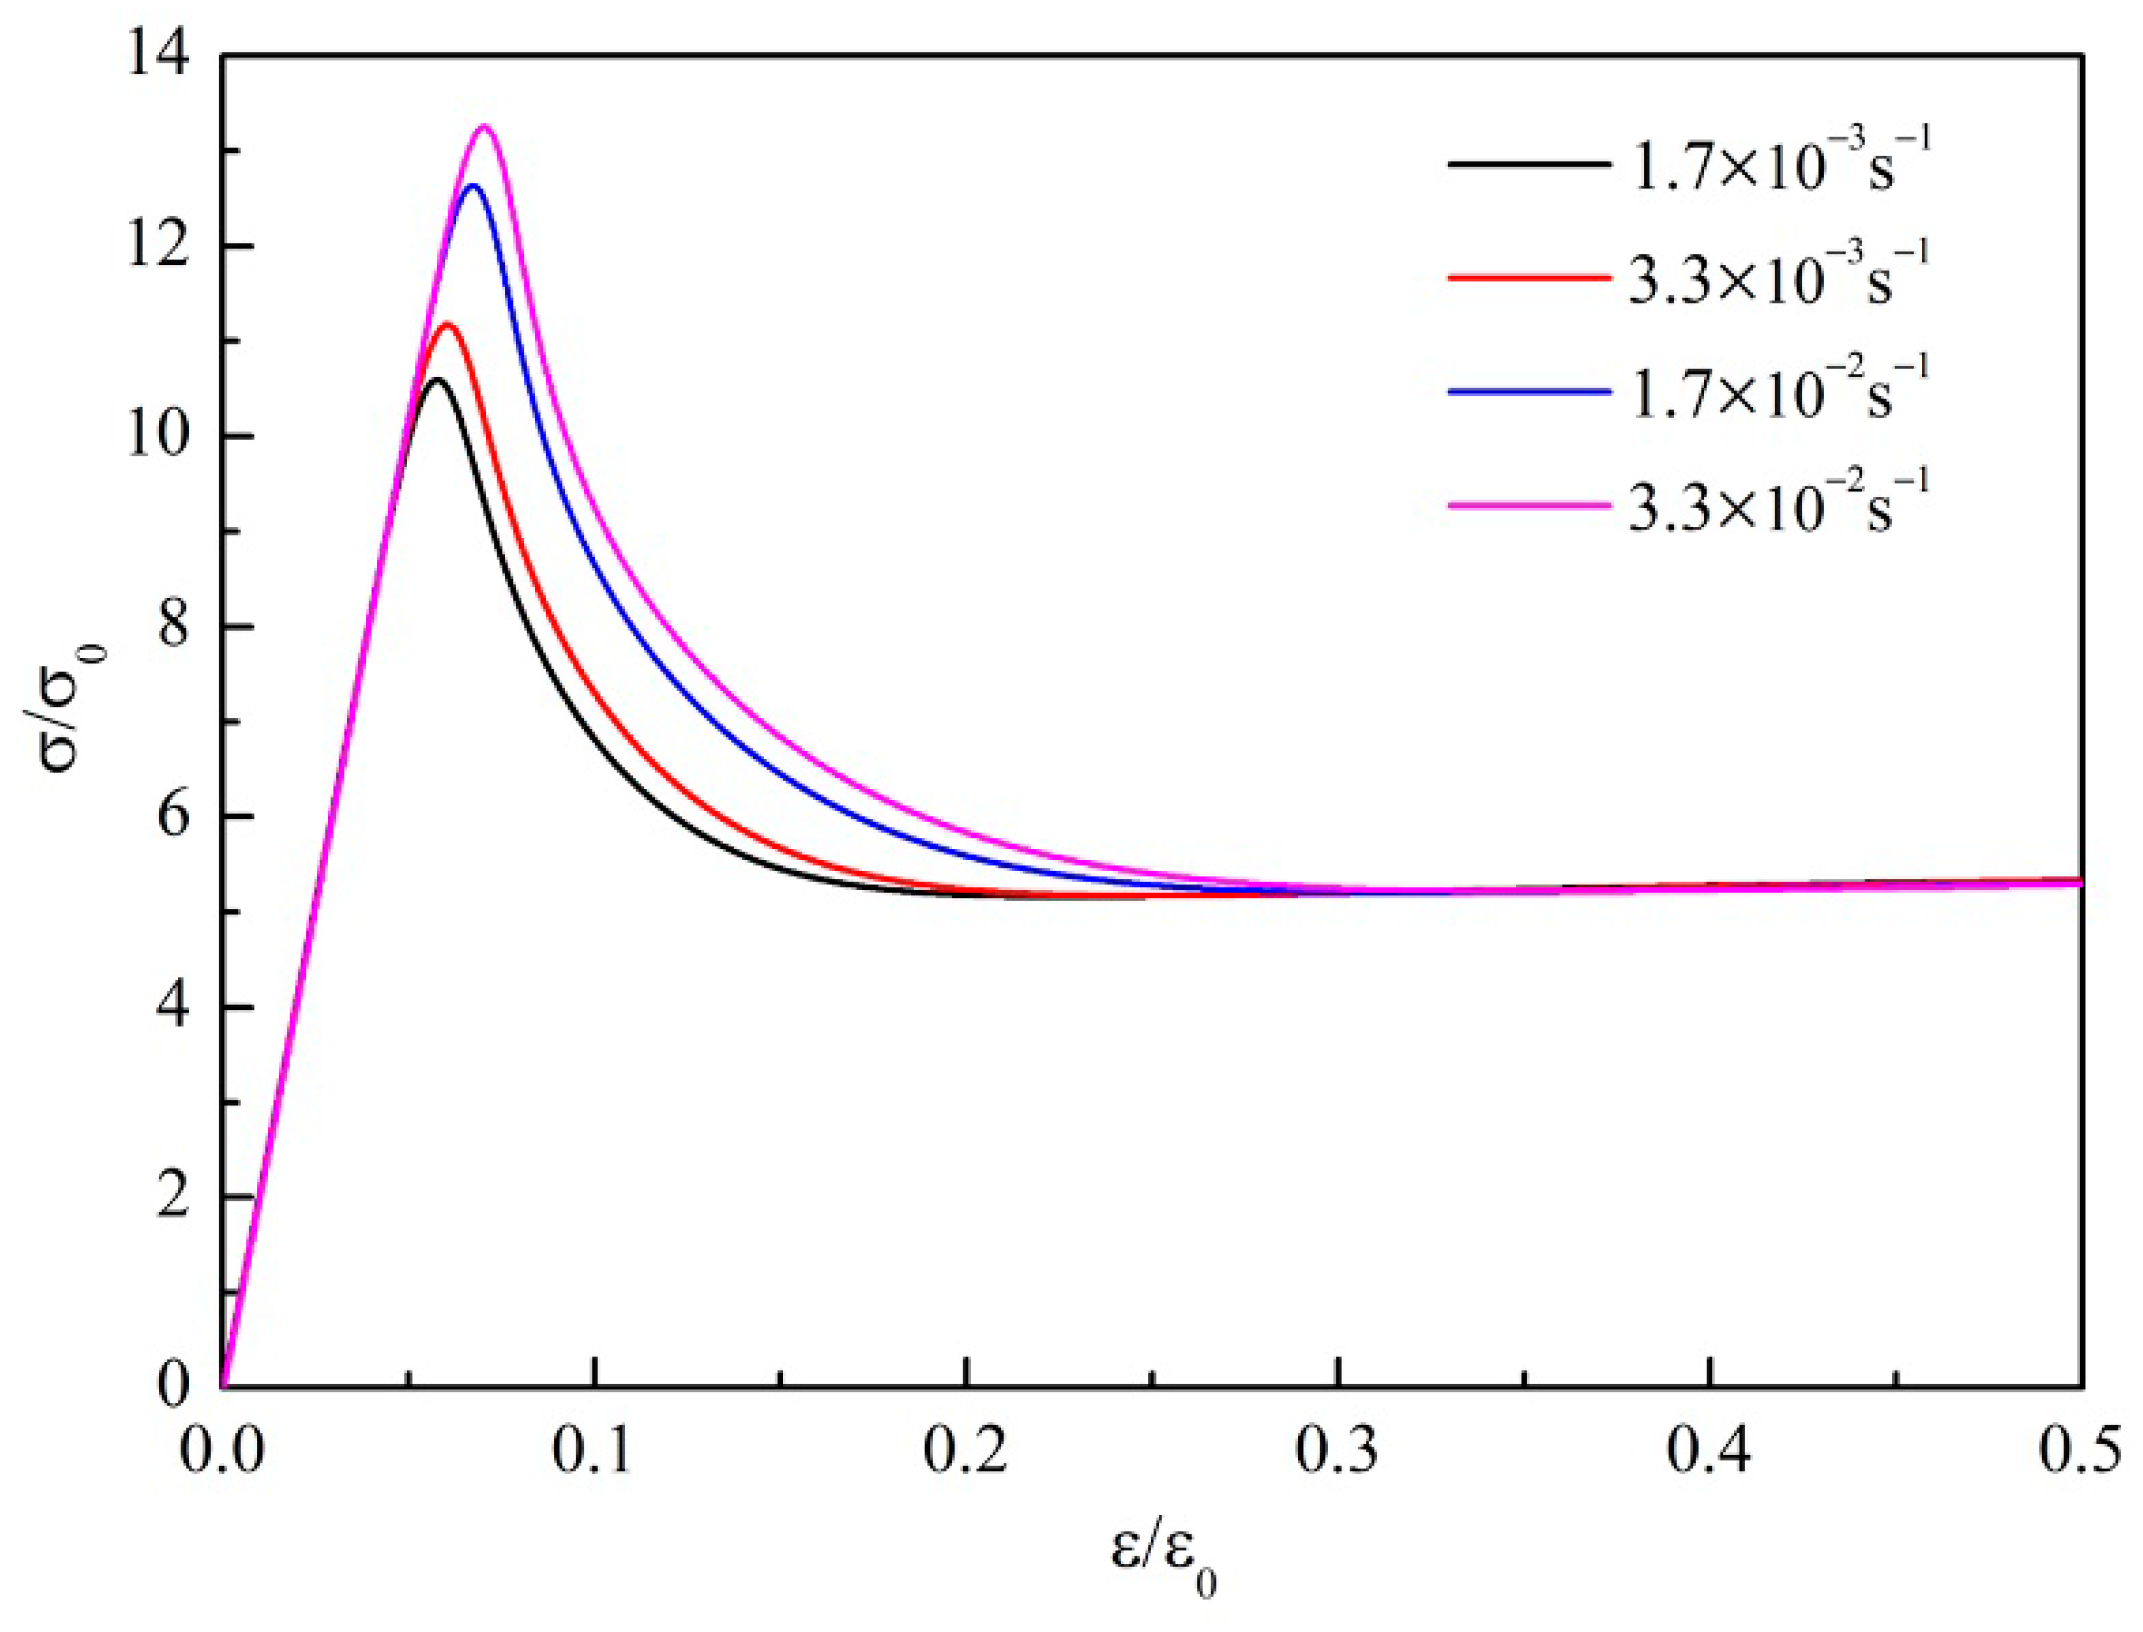
where is the plastic strain rate, is the average free volume concentration, and represent, respectively, the bias and summation of normalized populations of two STZ states, is the shear stress, is the ambient temperature, is the shear modulus, is the overall shear strain rate, is the proportional coefficient between the STZ creation/annihilation rate and the plastic work rate, is a dilatancy factor, is a characteristic pressure and is the ratio of the coefficient and the geometrical factor . , where is the STZ activation energy and is the Boltzmann constant. The detailed definitions or values of the other parameters can be found in [41]. As for the Vit 105 BMG, it is justifiable to take the parameters to be the same as for Vit 1, as summarized in [41]. A numerical relationship between and is illustrated in Figure 7 at a fixed temperature of 298 K and an initial system (, , and ) under different strain rates. Obviously, a higher strain rate corresponds to a higher stress overshoot, i.e., a larger hardness. This can be well understood in terms of the FV-assisted activation and connection of the STZs. The FV dynamics include not only stress-induced creation but also diffusion-induced annihilation [18,42,43,44] and the production term can be written as [43]:
where is a temperature-dependent proportionality factor, is the loading rate during indentation and is the concentration of pre-existing FV. Accordingly, it can be found that the created FV upon loading is proportional to the indentation loading rate and the pre-existing FV. Upon loading, a higher strain rate means a larger stress and an expected larger plastic deformation for the same loading time. However, the growth of plasticity is dominated by STZs and the activation of STZs is assisted by FV [45,46]. A higher strain rate also leads to a delay for both the activation of the STZs and the production of the FV because of the shorter time. Then, the population of activated STZs will be less than its anticipant number and cannot match the expected plastic deformation to the corresponding stress. A higher stress is required to activate more STZs. This leads to a higher yield stress prior to strain softening (stress drop), and therefore a more pronounced stress overshoot is examined at larger strain rates, as demonstrated in Figure 7. This is in line with the results reported by others [40,41,47,48]. Consequently, it is reasonable to conclude that a larger stress is required to activate STZs under a higher strain rate. This corresponds to the positive SRS demonstrated in Figure 5.
In the context of sample “a”, the potential sites for the initiation of the STZs is relatively large because of the abundant pre-existing FV. Therefore, under a higher strain rate, the delay of the activation of the STZs and the corresponding stress overshoot is expected to be slight, which finally results in a weak influence of strain rate on hardness. However, the potential positions for the initiation of the STZs is less and less, in descending order from sample “a” to sample “d”, due to the lower and lower pre-existing FV. In this case, the lack of initiation sites combines with the shorter time for the activation, which leads to a remarkable delay of the activation of STZs at a higher strain rate, which finally results in a larger and larger stress overshoot, i.e., a more positive SRS, in ascending order from sample “a” to sample “d”. This is consistent with the results observed in Figure 5. As for samples “e” and “f”, the pre-existing FV is almost annealed out, i.e., the FV contents are equal to each other. In light of Equation (7), the newly generated FV is also the same. Moreover, the peak load and loading rates adopted for the two samples were identical. Therefore, the FV-assisted activation and accumulation of STZs is almost same in the two samples. In other words, the SRS index is nearly constant when the FV is annealed out. This agrees well with the nearly identical value observed in samples “e” and “f”.
After yielding, under a higher strain rate, there is a larger amount of activated STZs resulting from the higher stress overshoot, which in turn contributes to a larger net creation of FV. The increase of the strain rate gives rise to positive feedback between the STZ and the FV [8]. The higher the strain rate, the larger the number of activated STZs, and thus the higher the density of SBs. During nanoindentation, the total plastic displacement can be written as: ,where is the average length of pop-in during the loading segment and is the SB density [15]. In load-controlled experiments under different strain rates, is approximately equal. Therefore, the average plastic strain sustained by each SB, i.e., the average length of pop-in, is smaller under a higher strain rate. This is in conformity with both the smoother P-h curves presented Figure 3 and the smaller pop-in length demonstrated Figure 4 at higher strain rates. The correlation between pop-in length and the structural state can also be understood from the above analysis. According to the results shown in Figure 2 and Equation (7), it is reasonable to conclude that the amounts of both the initial and the newly generated FV have a monotonous decrease, in descending order from sample “a” to sample “f”. Therefore, the SB density, i.e., , is smaller in the sample with a lower initial content of FV, which is in good agreement with the surface morphologies observed in Figure 3 and the larger pop-in length presented in Figure 4.
5. Conclusions
In summary, the effect of annealing on the SRS of metallic glass was examined based on a series of nanoindentations. A positive dependence of hardness on the strain rate is observed and the SRS index has a monotonous increase with a decrease in the content of FV in the BMGs. Furthermore, the SRS becomes nearly constant when the FV is annealed out. Based on a constitutive model, which incorporates the interaction of FV dynamics and shear transformations, the positive SRS is ascribed to the delay in the activation of STZs at higher strain rates. The isothermal annealing below glass transition temperature reduces the free volume content in the BMG samples, which results in a reduction in the potential sites for the nucleation of the STZs. The more severe lack of nucleation sites, together with the shorter time for the activation, result in a more significant delay in the activation of STZs at higher strain rates, which finally gives rise to a more positive SRS.
Funding
This work is supported financially by the Natural Science Foundation of Xinjiang Uygur Autonomous Region of China (No. 2019D01C034) and the Doctoral Fund of Xinjiang University, China (No. BS180211).
Conflicts of Interest
The author declares no conflict of interest.
References
- Wang, Y.W.; Bian, X.L.; Wu, S.W.; Hussain, I.; Jia, Y.D.; Yi, J.; Wang, G. Rate dependent of strength in metallic glasses at different temperatures. Sci. Rep. 2016, 6, 27747. [Google Scholar] [CrossRef] [Green Version]
- Tönnies, D.; Samwer, K.; Derlet, P.M.; Volkert, C.A.; Maaß, R. Rate-dependent shear-band initiation in a metallic glass. Appl. Phys. Lett. 2015, 106, 171907–171910. [Google Scholar] [CrossRef]
- Burgess, T.; Laws, K.J.; Ferry, M. Effect of loading rate on the serrated flow of a bulk metallic glass during nanoindentation. Acta Mater. 2008, 56, 4829–4835. [Google Scholar] [CrossRef]
- Schuh, C.A.; Nieh, T.G. A nanoindentation study of serrated flow in bulk metallic glasses. Acta Mater. 2003, 51, 87–99. [Google Scholar] [CrossRef]
- Bhattacharyya, A.; Singh, G.; Prasad, K.E.; Narasimhan, R.; Ramamurty, U. On the strain rate sensitivity of plastic flow in metallic glasses. Mater. Sci. Eng. A 2015, 625, 245–251. [Google Scholar] [CrossRef]
- Shi, Y.; Falk, M.L. Stress-induced structural transformation and shear banding during simulated nanoindentation of a metallic glass. Acta Mater. 2007, 55, 4317–4324. [Google Scholar] [CrossRef]
- Zhang, M.; Wang, Y.J.; Dai, L.H. Understanding the serrated flow and Johari-Goldstein relaxation of metallic glasses. J. Non Cryst. Solids. 2016, 444, 23–30. [Google Scholar] [CrossRef] [Green Version]
- Liao, G.; Long, Z.; Zhao, M.; Zhong, M.; Liu, W.; Chai, W. Serrated flow behavior in a Pd-based bulk metallic glass under nanoindentation. J. Non Cryst. Solids. 2017, 460, 47–53. [Google Scholar] [CrossRef]
- Jiang, S.Y.; Jiang, M.Q.; Dai, L.H.; Yao, Y.G. Atomistic origin of rate-dependent serrated plastic flow in metallic glasses. Nanoscale Res. Lett. 2008, 3, 524–529. [Google Scholar] [CrossRef] [Green Version]
- Jiang, W.H.; Fan, G.J.; Liu, F.X.; Wang, G.Y.; Choo, H.; Liaw, P.K. Spatiotemporally inhomogeneous plastic flow of a bulk-metallic glass. Int. J. Plast. 2008, 24, 1–16. [Google Scholar] [CrossRef]
- Harmon, J.S.; Demetriou, M.D.; Johnson, W.L.; Samwer, K. Anelastic to plastic transition in metallic glass-forming liquids. Phys. Rev. Lett. 2007, 99, 135502–135505. [Google Scholar] [CrossRef] [Green Version]
- Li, M.C.; Jiang, M.Q.; Yang, S.; Jiang, F.; He, L.; Sun, J. Effect of strain rate on yielding strength of a Zr-based bulk metallic glass. Mater. Sci. Eng. A 2017, 680, 21–26. [Google Scholar] [CrossRef] [Green Version]
- Shimizu, F.; Ogata, S.; Li, J. Yield point of metallic glass. Acta Mater. 2006, 54, 4293–4298. [Google Scholar] [CrossRef]
- Liu, Z.Y.; Yang, Y.; Liu, C.T. Yielding and shear banding of metallic glasses. Acta Mater. 2013, 61, 5928–5936. [Google Scholar] [CrossRef]
- Yang, B.; Nieh, T.G. Effect of the nanoindentation rate on the shear band formation in an Au-based bulk metallic glass. Acta Mater. 2007, 55, 295–300. [Google Scholar] [CrossRef]
- Greer, A.L.; Cheng, Y.Q.; Ma, E. Shear bands in metallic glasses. Mater. Sci. Eng. R 2013, 74, 71–132. [Google Scholar] [CrossRef]
- Li, L.; Homer, E.R.; Schuh, C.A. Shear transformation zone dynamics model for metallic glasses incorporating free volume as a state variable. Acta Mater. 2013, 61, 3347–3359. [Google Scholar] [CrossRef] [Green Version]
- Jiang, M.Q.; Wilde, G.; Dai, L.H. Shear band dilatation in amorphous alloys. Scr. Mater. 2017, 127, 54–57. [Google Scholar] [CrossRef] [Green Version]
- Zhao, P.Y.; Li, J.; Hwang, J.; Wang, Y.Z. Influence of nanoscale structural heterogeneity on shear banding in metallic glasses. Acta Mater. 2017, 134, 104–115. [Google Scholar] [CrossRef]
- Murali, P.; Ramamurty, U. Embrittlement of a bulk metallic glass due to sub-Tg annealing. Acta Mater. 2005, 53, 1467–1478. [Google Scholar] [CrossRef]
- Jiang, F.; Jiang, M.Q.; Wang, H.F.; Zhao, Y.L.; He, L.; Sun, J. Shear transformation zone volume determining ductile–brittle transition of bulk metallic glasses. Acta Mater. 2011, 59, 2057–2068. [Google Scholar] [CrossRef]
- Xue, F.; Wang, F.; Huang, P.; Lu, T.J.; Xu, K.W. Structural inhomogeneity and strain rate dependent indentation size effect in Zr-based metallic glass. Mater. Sci. Eng. A 2016, 655, 373–378. [Google Scholar] [CrossRef]
- Zhou, Q.; Du, Y.; Han, W.C.; Ren, Y.; Zhai, H.M.; Wang, H.F. Identifying the origin of strain rate sensitivity in a high entropy bulk metallic glass. Scr. Mater. 2019, 164, 121–125. [Google Scholar] [CrossRef]
- Pan, D.; Yokoyama, Y.; Fujita, T.; Liu, Y.H.; Kohara, S.; Inoue, A.; Chen, M.W. Correlation between structural relaxation and shear transformation zone volume of a bulk metallic glass. Appl. Phys. Lett. 2009, 95, 141909. [Google Scholar] [CrossRef]
- Chu, Q.; Xu, S.; Zhu, X.; Zhu, Z.; Zhang, H.; Bai, R.; Lei, Z.; Yan, C. Effects of testing conditions on the deformation behaviour of a Ti-based bulk metallic glass. Mater. Sci. Eng. A 2019, 766, 138404. [Google Scholar] [CrossRef]
- Cheng, L.; Jiao, Z.M.; Ma, S.G.; Qiao, J.W.; Wang, Z.H. Serrated flow behaviors of a Zr-based bulk metallic glass by nanoindentation. J. Appl. Phys. 2014, 115, 084907. [Google Scholar] [CrossRef]
- Ma, Y.; Ye, J.H.; Peng, G.J.; Wen, D.H.; Zhang, T.H. Nanoindentation study of size effect on shear transformation zone size in a Ni–Nb metallic glass. Mater. Sci. Eng. A 2015, 627, 153–160. [Google Scholar] [CrossRef]
- Chen, Z.Q.; Huang, L.; Huang, P.; Xu, K.W.; Wang, F.; Lu, T.J. Clarification on shear transformation zone size and its correlation with plasticity for Zr-based bulk metallic glass in different structural states. Mater. Sci. Eng. A 2016, 677, 349–355. [Google Scholar] [CrossRef]
- Li, M.C.; Jiang, M.Q.; Jiang, F.; He, L.; Sun, J. Testing effects on hardness of a Zr-based metallic glass under nanoindentation. Scr. Mater. 2017, 138, 120–123. [Google Scholar] [CrossRef] [Green Version]
- Pan, D.; Inoue, A.; Sakurai, T.; Chen, M.W. Experimental characterization of shear transformation zones for plastic flow of bulk metallic glasses. Proc. Natl Acad. Sci. USA 2008, 105, 14769–14772. [Google Scholar] [CrossRef] [Green Version]
- Evenson, Z.; Busch, R. Equilibrium viscosity, enthalpy recovery and free volume relaxation in a Zr44Ti11Ni10Cu10Be25 bulk metallic glass. Acta Mater. 2011, 59, 4404–4415. [Google Scholar] [CrossRef]
- Li, M.C.; Jiang, M.Q.; Li, G.; He, L.; Sun, J.; Jiang, F. Ductile to brittle transition of fracture of a Zr-based bulk metallic glass: Strain rate effect. Intermetallics 2016, 77, 34–40. [Google Scholar] [CrossRef]
- Oliver, W.C.; Pharr, G.M. An improved technique for determining hardness and elastic modulus using load and displacement sensing indentation experiments. J. Mater. Res. 1992, 7, 1564–1583. [Google Scholar] [CrossRef]
- Jang, J.-I.; Yoo, B.-G.; Kim, Y.-J.; Oh, J.-H.; Choi, I.-C.; Bei, H. Indentation size effect in bulk metallic glass. Scr. Mater. 2011, 64, 753–756. [Google Scholar] [CrossRef]
- Ye, J.C.; Lu, J.; Liu, C.T.; Wang, Q.; Yang, Y. Atomistic free-volume zones and inelastic deformation of metallic glasses. Nat. Mater. 2010, 9, 619–623. [Google Scholar] [CrossRef]
- Lu, Z.; Yang, X.N.; Sun, B.A.; Li, Y.Z.; Chen, K.; Wang, W.H.; Bai, H.Y. Divergent strain acceleration effects in metallic glasses. Scr. Mater. 2017, 130, 229–233. [Google Scholar] [CrossRef]
- Şopu, D.; Scudino, S.; Bian, X.L.; Gammer, C.; Eckert, J. Atomic-scale origin of shear band multiplication in heterogeneous metallic glasses. Scr. Mater. 2020, 178, 57–61. [Google Scholar] [CrossRef]
- Wang, C.; Cao, Q.P.; Wang, X.D.; Zhang, D.X.; Ramamurty, U.; Narayan, R.L.; Jiang, J. Intermediate Temperature Brittleness in Metallic Glasses. Adv. Mater. 2017, 29, 1605537–1605542. [Google Scholar] [CrossRef]
- Li, M.C.; Jiang, M.Q.; Ding, G.; Peng, Z.H.; Jiang, F.; He, L.; Sun, J. The correlation between weakest configurations and yield strength of Zr-based metallic glasses. J. Non Cryst. Solids 2017, 468, 52–57. [Google Scholar] [CrossRef] [Green Version]
- Wang, S.; Ye, Y.F.; Sun, B.A.; Liu, C.T.; Shi, S.Q.; Yang, Y. Softening-induced plastic flow instability and indentation size effect in metallic glass. J. Mehc. Phys. Solids 2015, 77, 70–85. [Google Scholar] [CrossRef]
- Jiang, M.Q.; Wilde, G.; Dai, L.H. Origin of stress overshoot in amorphous solids. Mech. Mater. 2015, 81, 72–83. [Google Scholar] [CrossRef]
- Heggen, M.; Spaepen, F.; Feuerbacher, M. Creation and annihilation of free volume during homogeneous flow of a metallic glass. J. Appl. Phys. 2005, 97, 033506. [Google Scholar] [CrossRef] [Green Version]
- De Hey, P.; Sietsma, J.; Van Den Beukel, A. Structural disordering in amorphous Pd40Ni40P20 induced by high temperature deformation. Acta Mater. 1998, 46, 5873–5882. [Google Scholar] [CrossRef]
- Spaepen, F. A microscopic mechanism for steady state inhomogeneous flow in metallic glasses. Acta Metall. 1977, 25, 407–415. [Google Scholar] [CrossRef]
- Qu, D.D.; Liss, K.D.; Sun, Y.J.; Reid, M.; Almer, J.D.; Yan, K.; Wang, Y.B.; Liao, X.Z.; Shen, J. Structural origins for the high plasticity of a Zr–Cu–Ni–Al bulk metallic glass. Acta Mater. 2012, 61, 321–330. [Google Scholar] [CrossRef]
- Chen, L.Y.; Fu, Z.D.; Zhang, G.Q.; Hao, X.P.; Jiang, Q.K.; Wang, X.D.; Cao, Q.P.; Franz, H.; Liu, Y.G.; Xie, H.S.; et al. New Class of Plastic Bulk Metallic Glass. Phys. Rev. Lett. 2008, 100, 075501. [Google Scholar] [CrossRef] [PubMed]
- Kawamura, Y.; Shibata, T.; Inoue, A.; Masumoto, T. Stress overshoot in stress-strain curves of Zr65Al10Ni10Cu15 metallic glass. Appl. Phys. Lett. 1997, 71, 779–781. [Google Scholar] [CrossRef]
- Koumakis, N.; Laurati, M.; Egelhaaf, S.U.; Brady, J.F.; Petekidis, G. Yielding of Hard-Sphere Glasses during Start-Up Shear. Phys. Rev. Lett. 2012, 108, 098303–098307. [Google Scholar] [CrossRef] [Green Version]
Figure 1.
High-resolution transmission electron microscopy images and the corresponding selected area electron diffraction patterns of Vit105 samples (a) as-cast and (b) 650 K–30 min annealed.
Figure 1.
High-resolution transmission electron microscopy images and the corresponding selected area electron diffraction patterns of Vit105 samples (a) as-cast and (b) 650 K–30 min annealed.

Figure 2.
Differential scanning calorimetry curves of all the samples, the inset shows the different exothermic signals before the glass transition.
Figure 2.
Differential scanning calorimetry curves of all the samples, the inset shows the different exothermic signals before the glass transition.

Figure 3.
Representative P-h curves under different equivalent strain rates but a fixed peak load of 300 mN for (a) as-cast and (b) 650 K–30 min annealed, the insets show the SEM micrographs of nanoindentation tested at the equivalent strain rate of 0.017 s−1.
Figure 3.
Representative P-h curves under different equivalent strain rates but a fixed peak load of 300 mN for (a) as-cast and (b) 650 K–30 min annealed, the insets show the SEM micrographs of nanoindentation tested at the equivalent strain rate of 0.017 s−1.

Figure 4.
The variation of pop-in lengths with strain rates for various structural states.

Figure 5.
Variation of hardness with equivalent strain rate in different structural states of Vit 105.
Figure 5.
Variation of hardness with equivalent strain rate in different structural states of Vit 105.

Figure 6.
Dependence of hardness on equivalent strain rate in 650 K–24 h annealed sample, the insert presents the representative load–displacement responses under four strain rates.
Figure 6.
Dependence of hardness on equivalent strain rate in 650 K–24 h annealed sample, the insert presents the representative load–displacement responses under four strain rates.

Figure 7.
The relationship between and at a fixed temperature of 298 K and an initial system (, , and ) under different strain rates.
Figure 7.
The relationship between and at a fixed temperature of 298 K and an initial system (, , and ) under different strain rates.


Table 1.
The annealing parameters of the samples used in this work.
| Sample ID | a | b | c | d | e | f |
|---|---|---|---|---|---|---|
| Annealing temperature (K) | cast | 550 | 600 | 650 | 650 | 650 |
| Annealing time (min) | 0 | 30 | 30 | 30 | 120 | 1440 |
© 2020 by the author. Licensee MDPI, Basel, Switzerland. This article is an open access article distributed under the terms and conditions of the Creative Commons Attribution (CC BY) license (http://creativecommons.org/licenses/by/4.0/).
Share and Cite
MDPI and ACS Style
Li, M. Effect of Annealing on Strain Rate Sensitivity of Metallic Glass under Nanoindentation. Metals 2020, 10, 1063. https://doi.org/10.3390/met10081063
AMA Style
Li M. Effect of Annealing on Strain Rate Sensitivity of Metallic Glass under Nanoindentation. Metals. 2020; 10(8):1063. https://doi.org/10.3390/met10081063
Chicago/Turabian StyleLi, Mingcan. 2020. "Effect of Annealing on Strain Rate Sensitivity of Metallic Glass under Nanoindentation" Metals 10, no. 8: 1063. https://doi.org/10.3390/met10081063
Note that from the first issue of 2016, this journal uses article numbers instead of page numbers. See further details here.