Wave Interaction with Single and Twin Vertical and Sloped Slotted Walls


1
Civil Engineering Department, Kuwait University, Kuwait Safat 13060, Kuwait
2
Coastal Management Program, Environment and Life Sciences Research Center, Kuwait Institute for Scientific Research, Kuwait Safat 13109, Kuwait
*
Authors to whom correspondence should be addressed.
J. Mar. Sci. Eng. 2020, 8(8), 589; https://doi.org/10.3390/jmse8080589
Submission received: 23 July 2020
/
Revised: 2 August 2020
/
Accepted: 4 August 2020
/
Published: 6 August 2020
(This article belongs to the Section Coastal Engineering)
Abstract
:The interaction between waves and slotted vertical walls was experimentally studied in this research to examine the performance of the structure in terms of wave transmission, reflection, and energy dissipation. Single and twin slotted barriers of different slopes and porosities were tested under random wave conditions. A parametric analysis was performed to understand the effect of wall porosity and slope, the number of walls, and the incoming relative wave height and period on the structure performance. The main focus of the study was on wave transmission, which is the main parameter required for coastal engineering applications. The results show that reducing wall porosity from 30% to 10% decreases the wave transmission by a maximum of 35.38% and 38.86% for single and twin walls, respectively, increases the wave reflection up to 47.6%, and increases the energy dissipation by up to 23.7% on average for single walls. For twin-walls, the reduction in wall porosity decreases the wave transmission up to 26.3%, increases the wave reflection up to 40.5%, and the energy dissipation by 13.3%. The addition of a second wall is more efficient in reducing the transmission coefficient than the other wall parameters. The reflection and the energy dissipation coefficients are more affected by the wall porosity than the wall slope or the existence of a second wall. The results show that as the relative wave height increases from 0.1284 to 0.2593, the transmission coefficient decreases by 21.2%, the reflection coefficient decreases by 15.5%, and the energy dissipation coefficient increases by 18.4% on average. Both the transmission and the reflection coefficients increase as the relative wave length increases while the energy dissipation coefficient decreases. The variation in the three coefficients is more significant in deep water than in shallower water.
Keywords:
transmission; reflection; energy dissipation; slope angle; porosity; single-wall; twin-walls1. Introduction
Coastal structures protect ports, harbors, and marinas from waves and currents. Traditional protection structures such as rubble mound breakwaters and concrete caissons provide the required protection, but they have several drawbacks, such as high construction costs and wide space occupancy. Vertical slotted barriers are a cost-effective and environment-friendly alternative that provides protection, reduces the construction cost and time, and provides more effective space for berthing and other facilities. The proposed slotted barrier is a fully immersed type of structure that consists of horizontal slots which permit the passage of water between the open sea and the bounded area.
Many researchers have investigated the effects of the number of walls, wall porosity, and incoming wave heights on the hydrodynamic characteristics of porous barriers [1,2,3,4,5,6,7,8,9]. Several of those researchers [1,2,3,4,5,6,7], agreed that two or more perforated walls might reduce the reflection coefficient of the perforated breakwaters as more wave energy is dissipated within the gap between the structures. Hagiwara [10] and Huang [11] showed that a second barrier has negligible effects on the scattered waves of a vertical wave barrier if the porosity of the second barrier is greater than or equal to 40%.
Neelamani et al. [12] conducted several experiments to examine the wave reflection and run-up characteristics of one to six slotted vertical walls with a non-porous back wall. They concluded that increasing the wall’s porosity from 10% to 30% decreases the wave reflection. The results of Huang [13] and Isaacson et al. [14] showed that increasing the porosity of a wall decreases wave reflection but increases wave transmission. Koraim [15] studied the performance of a wall consisting of one row of vertical slots theoretically and experimentally. He concluded that the transmission coefficient decreases as the wavenumber, kh, and wave steepness, , increase, and as the wall porosity, P decreases. On the other hand, he concluded the opposite trends for the reflection coefficient.
The studies [16,17,18] relate the reduction in the reflection coefficient to the increase in the wave steepness in the case of perforated caissons. This relationship is concluded because the energy dissipation increases at the perforated front wall for steeper waves. For the case of fixed wave periods, energy dissipation increases as the incident wave height increases resulting in smaller transmission coefficients and larger reflection coefficients [11].
Most of the studies in this subject focus on the relationship between the wave reflection, transmission, and energy dissipation by varying the wall porosity and the number of walls. Few studies have focused on the effect of the wall slope angle θ. Neelamani and Sandhya [19] showed that the reflection coefficient, , decreases with increasing the wall slope, cot θ, for dentated non-porous seawalls. They also found that seawalls with θ = 50 and 60 receive more pressure due to the plunging effects compared to vertical walls.
Muttray and Oumeraci [20] conducted physical experiments to study the wave transformation using vertical and sloping perforated thin walls of varying porosities under regular waves. A series of predictive empirical equations were developed for wave transmission, reflection, and energy dissipation on permeable slopes between θ = 0 and θ = 40. The results showed that the wave transmission decreases near linearly with increasing wave height and is slightly higher for the cases of slopped walls than for the case of vertical walls. Moreover, they found that the reflection decreases significantly for the case of permeable slopes. Mallayachari and Sundar [21] conducted a detailed study on the behavior of slopped and vertical seawalls. They concluded that porous slopped walls dissipate more wave energy and reduce the reflection coefficient more efficiently than the vertical porous walls.
The motivation of this study is to investigate the effect of the wall slope, wall porosity, and the number of walls on wave transmission, reflection, and energy dissipation. The structures were subjected to a series of random waves of different properties. Laboratory experiments were conducted at the Coastal Engineering Laboratory of Kuwait Institute for Scientific Research (KISR). Eight different random wave conditions were applied to different structural configurations. In Section 2, The materials and methods of this study are presented. Section 3 presents and discusses the results. The conclusions and recommendations of this study are presented in Section 4.
2. Materials and Methods
A sequence of experimental tests were carried out to assess the performance of various slotted walls in terms of the wave transmission, reflection, and energy dissipation coefficients, , and , respectively. A total of 18 models were tested by varying the wall porosity, the slope angle, and the number of walls at a fixed water depth for different wave conditions. Froude scaling was used to scale the wave properties and structure dimensions. The scale of 1:10 was used to reflect the average wave conditions, water depth, and the typical structure dimensions in the Arabian Gulf (AG) region.
2.1. Model Specifications
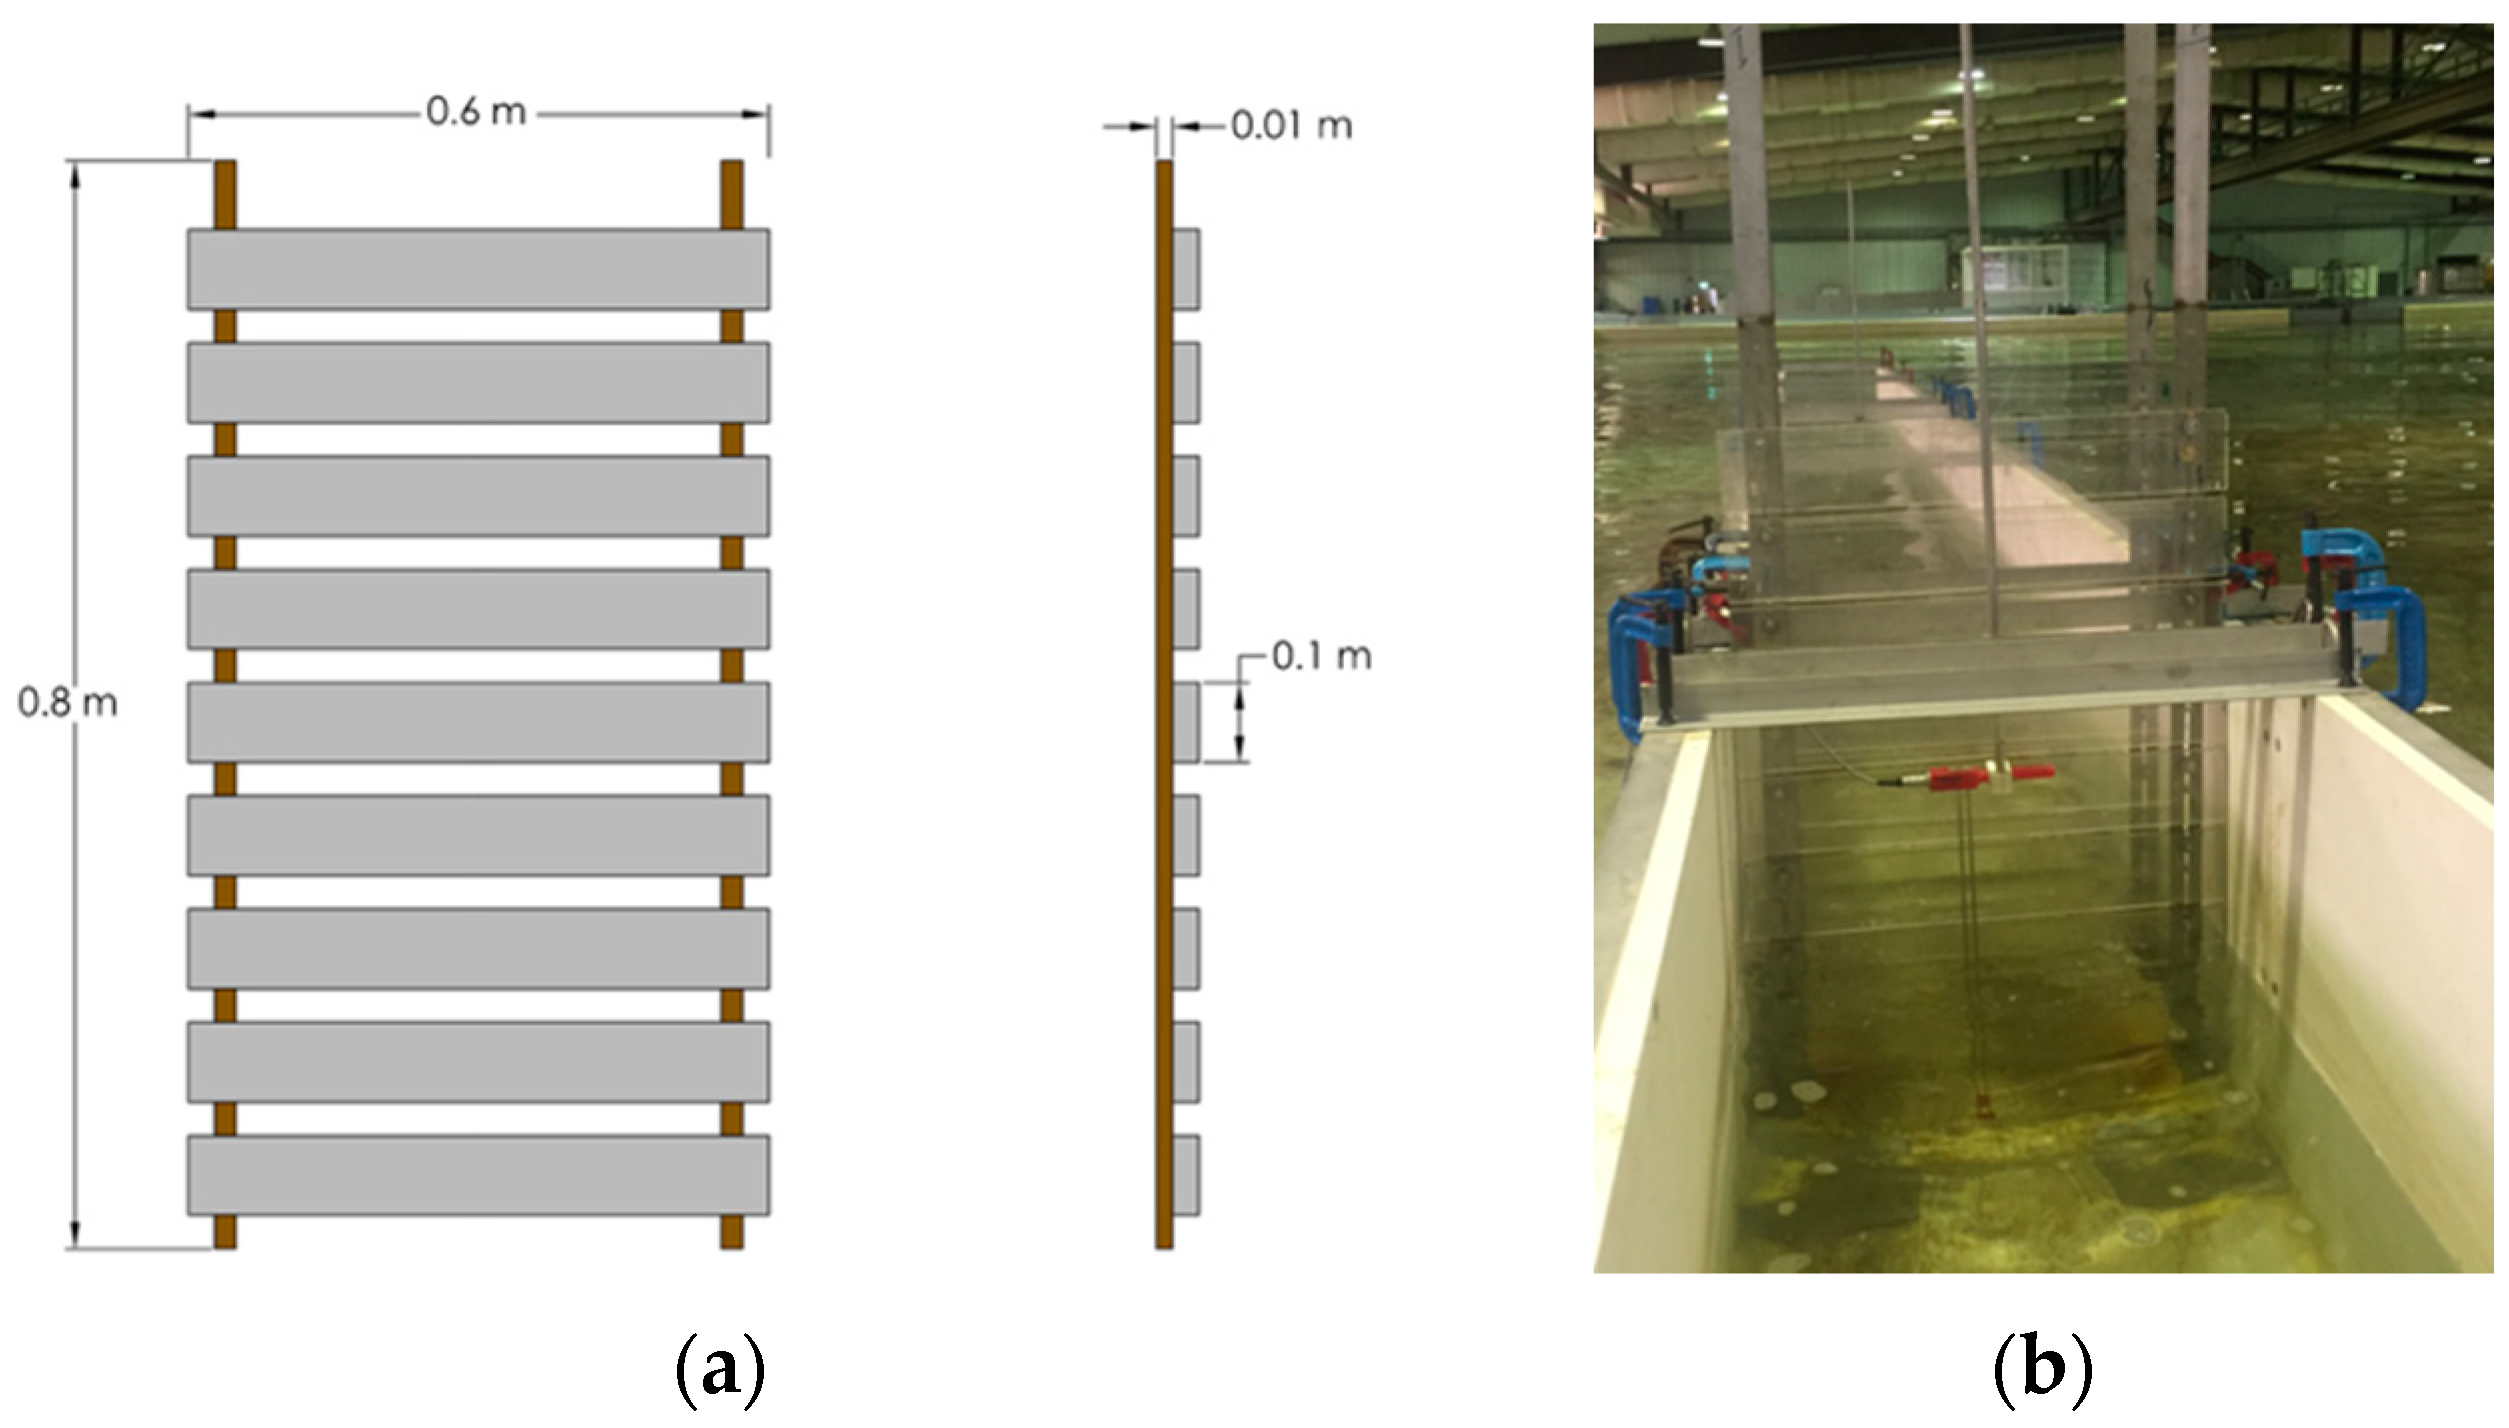
The slotted walls, a of which sample is shown in Figure 1, were fabricated from rectangular panels of acrylic sheets that were assembled and fixed to a steel frame by nuts, washers, and bolts. Each model is located 14 m from the wave generator paddle and is fixed to the flume by stainless steel angles and C-Clamps. The models were fully immersed in the flume, extending to the bottom, and measured 0.6 m wide, 0.8 m high, and 0.01 m thick. The geometric porosity of the walls is the ratio of the opening area to the total area of the wall from the still free surface to the bed. The wall slope angle is taken as the measured angle from the sea bed to the face of the model. Table 1 presents the wall parameters used in this study.
The model panels have a fixed width of 0.1 m. The vertical spacing between the panels was varied depending on the targeted porosity. For models with identical twin walls, the selection of the wall spacing agrees with the conclusion reached by [22]. Ahmed [22] concluded that the optimum location for wall 2 is at 0.25 L, 0.75 L, and 1.25 L (i.e., at the nodes) where the maximum energy dissipation and least reflection occurs. For the wavelengths to be tested, these nodes first occur at distances ranging between 0.365 and 1.118 m from the front wall. Hence, a spacing of 0.2 m is selected to ensure that the waves at the second wall are at a node. The twin walls were fixed to the flumes in the same manner as the single walls.
2.2. Testing Facilities
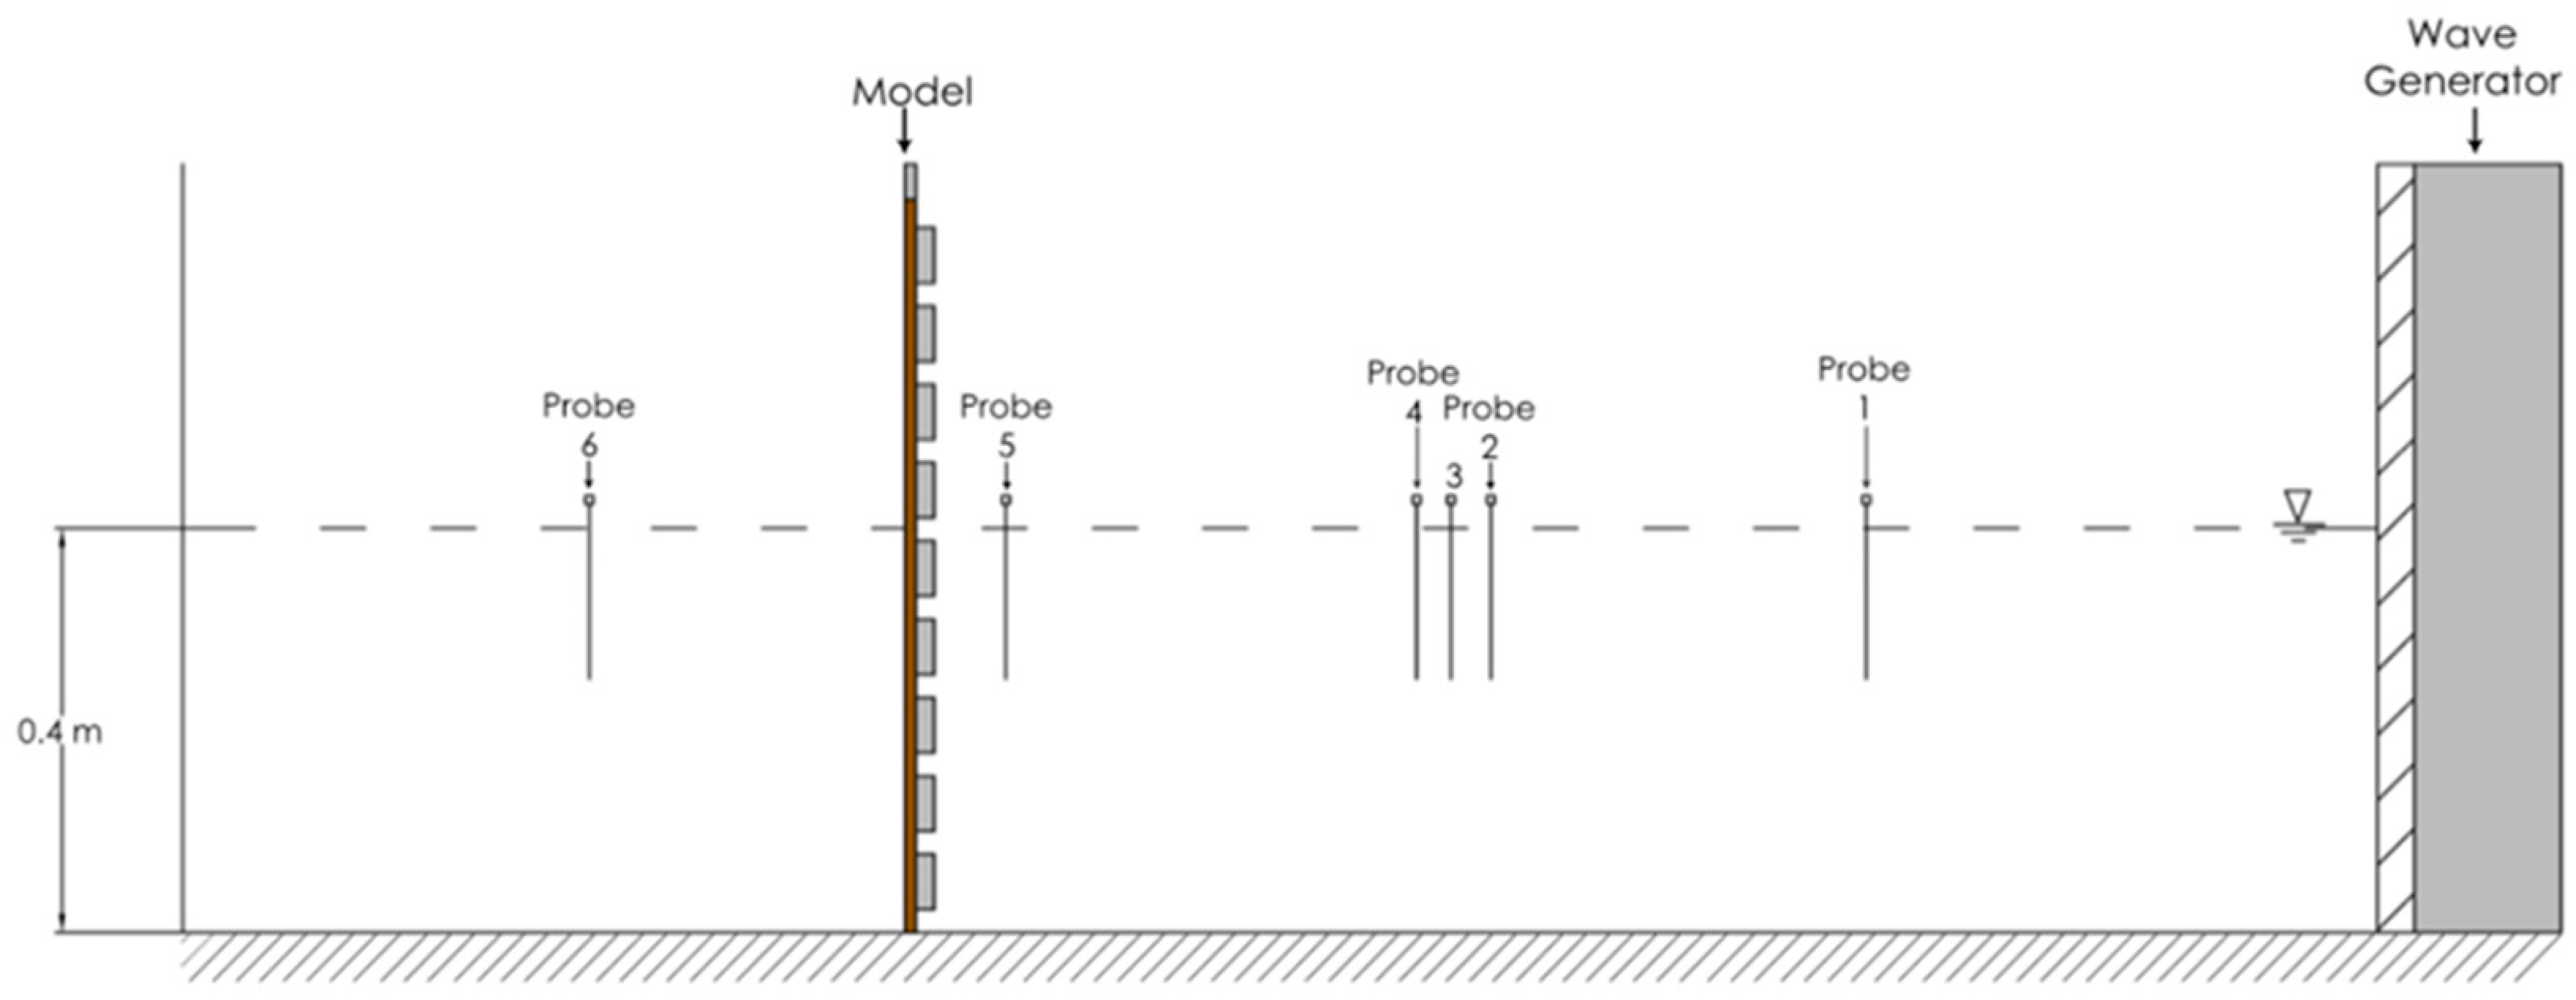
The experiment’s wave flume is 20 m long, 0.6 m wide, and 0.4 m deep. The wavemaker is piston type and manufactured by the Danish Hydraulic Institute (DHI). Six capacitance-type wave probes were used to measure the wave heights at different locations along the flume (Figure 2). Probe 1 is located 6.08 m from the wavemaker and is used to measure the incident significant wave height, His. Probes 2–4 measure the reflected wave heights, and they are located at 10.01 m, 10.47 m, and 10.77 m from the wavemaker, respectively. The wave conditions in front of the first wall were measured using probe 5 which is located 13.96 m from the wavemaker. The transmitted wave height was measured using probe 6, which is located 17.34 m from the wavemaker. The probes were calibrated before each experiment to ensure maximum accuracy. The maximum deviation of the calibration constants from the mean value was less than 0.1%. Basically, for wave reflection analysis, two wave probes are sufficient. Three wave probes (wave probe 2, 3 and 4) to make sure that the wave reflection analysis is possible for all wave conditions without causing singularity issue (i.e., the reflection analysis will not result infinity as output). The locations of the wave probes (probe 2, 3 and 4) is selected such that they are away from one wave length, so that the evanescent mode of the wave during reflection will not contribute in the measurement of wave climate at location 2, 3 and 4. The location of wave probe 6 is also kept more than the longest wave length generated from this study to reduce the data noise on the wave transmission due to the turbulence effect from the model.
The random waves generated in this study follow the JONSWAP spectrum with a peak enhancement factor of 3.3. Eight wave trains were generated corresponding to peak wave periods Tp = 1, 1.5, 2, and 2.5 s, and significant incident wave heights His = 5 and 10 cm. The total time of each experiment was 450 s.
2.3. Wave Specifications
The important dimensionless parameters in this study are the relative wave height, His/d, the relative wave period (or relative water depth), d/Lp, and the wave steepness, His/Lp. The experimental range of each of these parameters is shown in Table 2. These parameters are used to investigate the relationship between the model and the wave parameters.
The reflection coefficient, Kr, is the ratio of the reflected wave height, Hr, to the significant incident wave height, His,
Kr is determined by analyzing the experimental results using the least-squares procedure described by [23]. Three wave probes placed on a line parallel to the wave propagation direction and in reasonable distances from each other simultaneously measure the superposition of incident and reflected wave heights. The average reflection coefficient is calculated using Equation (1).
To calculate the transmission coefficient, Kt, the data from Probe 6 were analyzed using Fast Fourier Transform (FFT) techniques to produce the spectral density histogram [24]. The histogram plots the spectral energy against the wave frequency, resulting in the spectral variance, . The time-domain parameter, Hst, known as the transmitted wave height, was calculated using the following equation
Then, Kt is calculated using
Using the energy conservation law, the wave energy dissipation coefficient, Kl, is derived:
3. Results and Discussion
3.1. General
The data from the experimental runs have been studied and analyzed to determine Kt, Kr, and Kl. Table 3 presents the highest and lowest values for Kt, Kr, and Kl obtained from the experiments. Changing the wave conditions and the wall configurations (i.e., N, P, and θ), as seen in Table 3, caused significant variation in Kt, Kr, and Kl.
In the next sections, the effect of the wall parameters and wave characteristics on Kt, Kr, and Kl, respectively, is discussed.
3.2. Wave Transmission Coefficient, Kt
3.2.1. Effect of Porosity
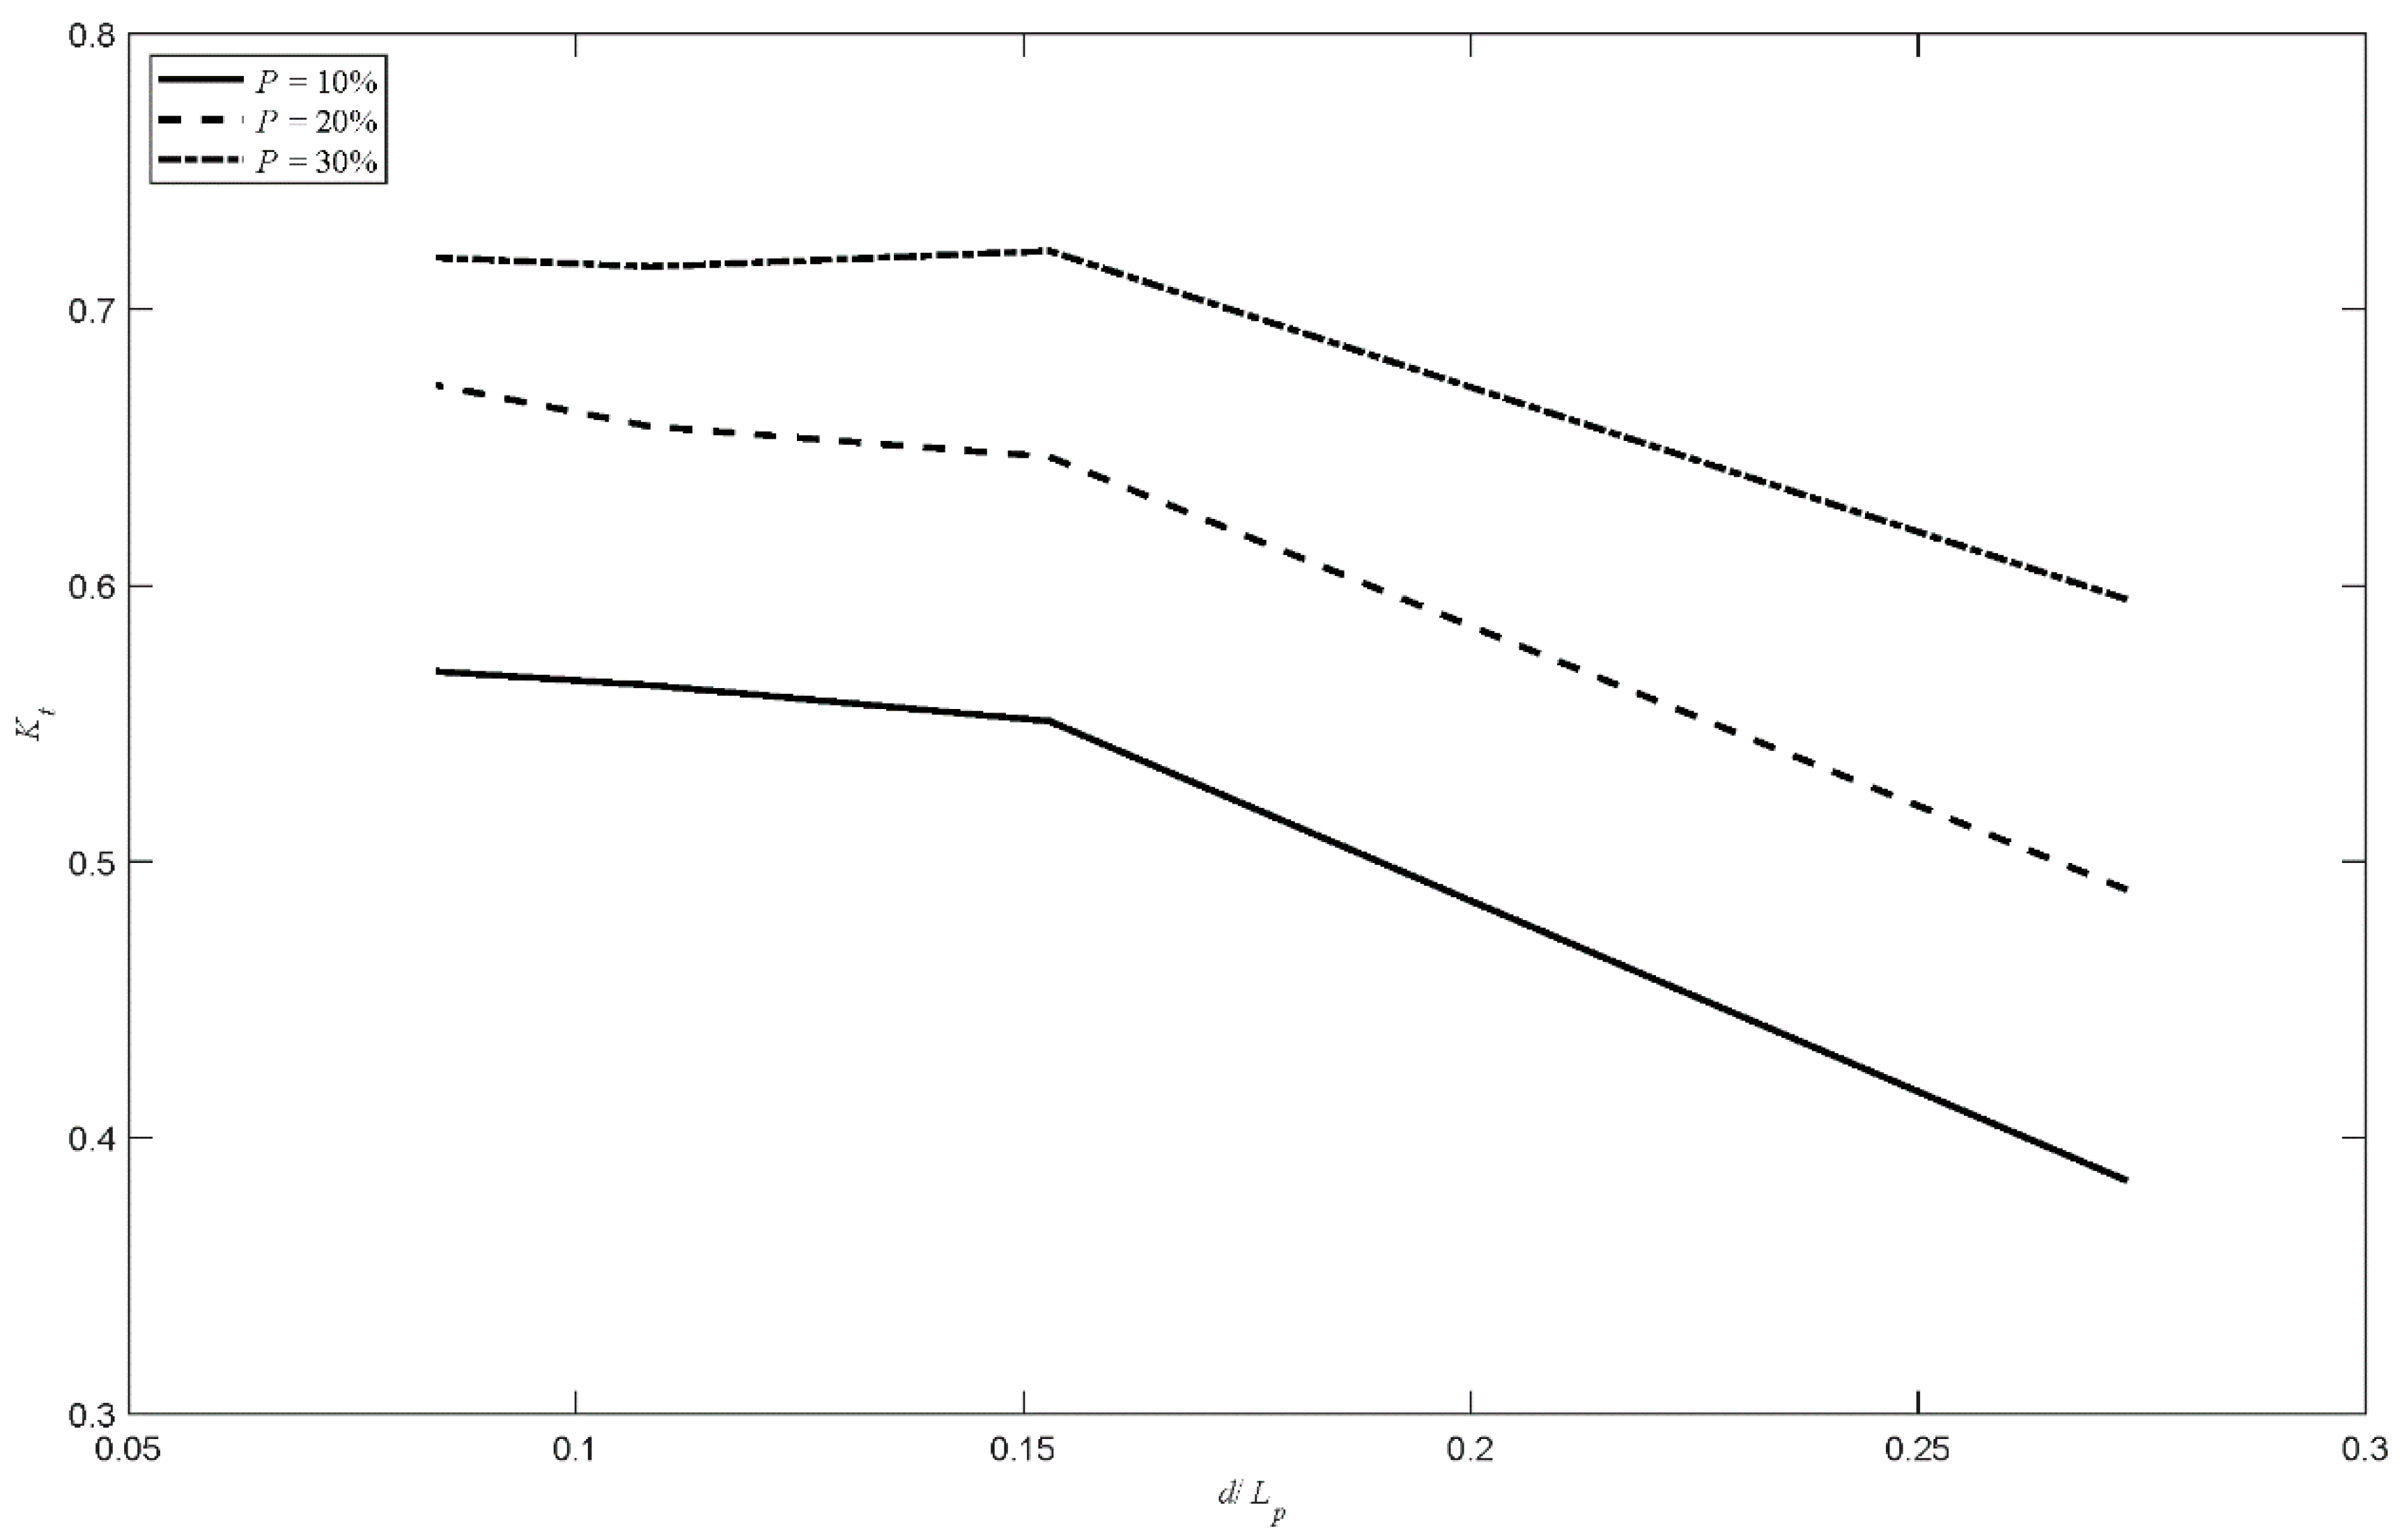
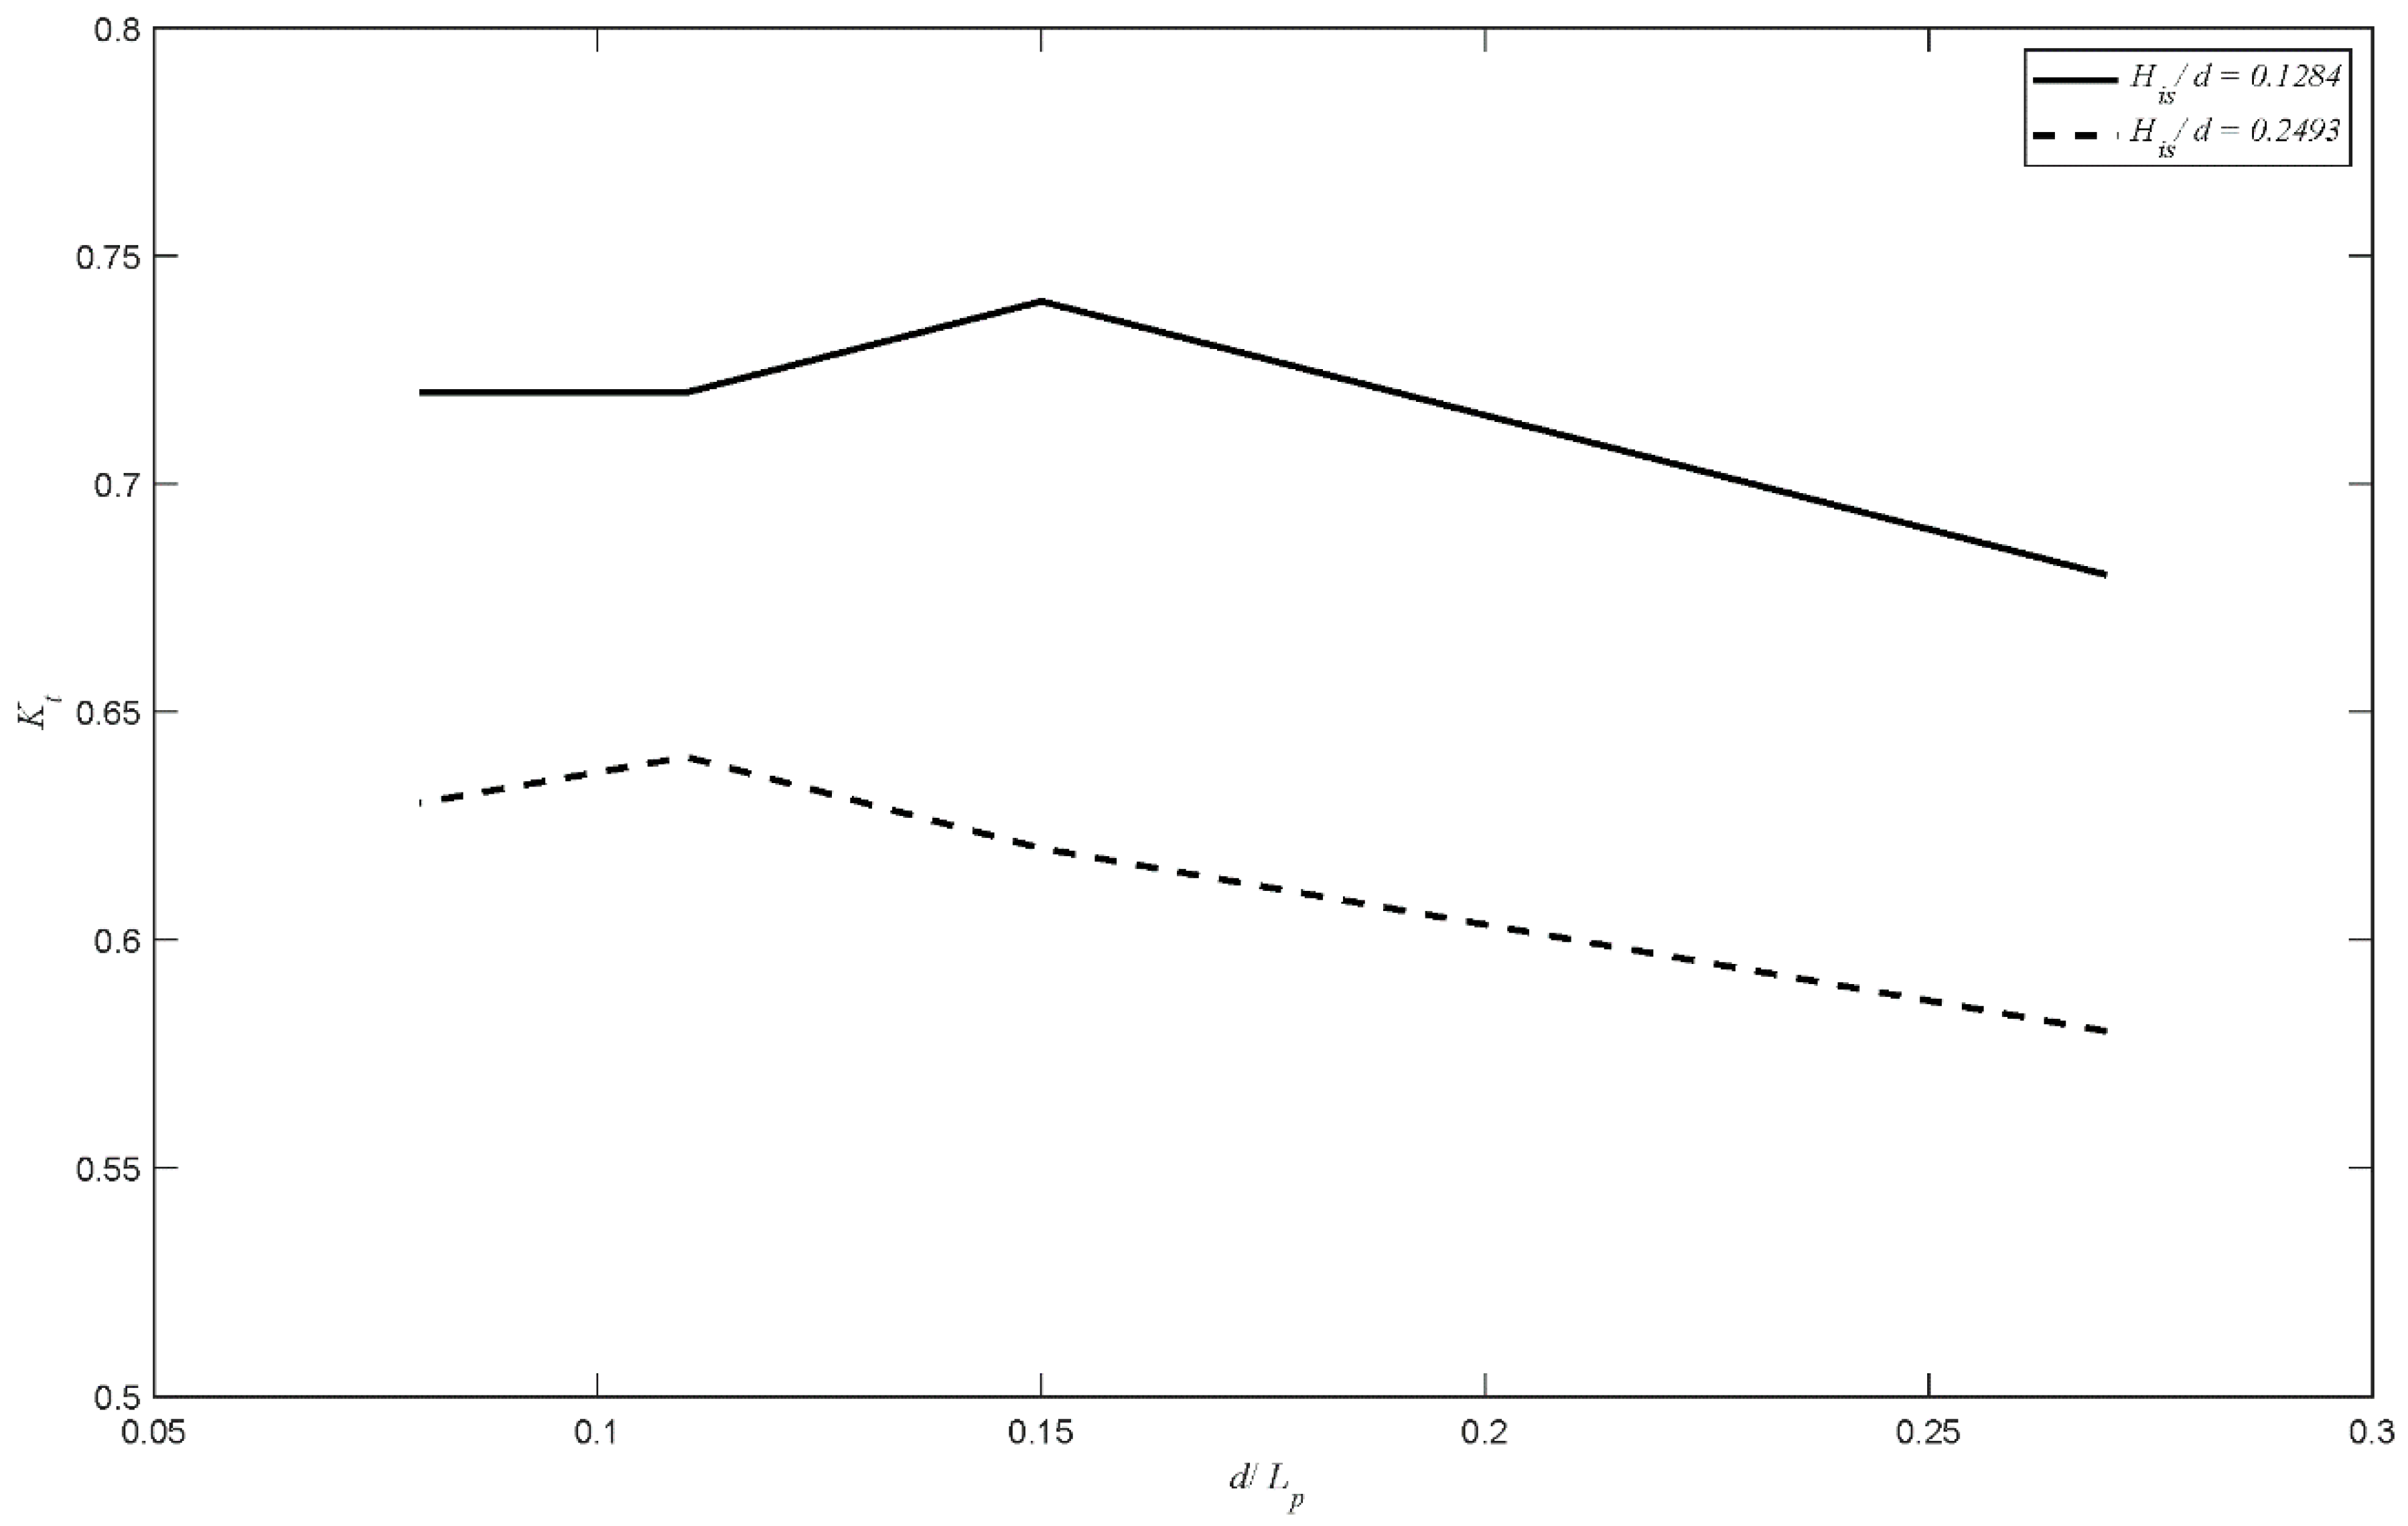
The transmission coefficient, Kt, was highest for models with P = 30%, as expected based on many examples in the literature. An example of the effect of wall porosity on the variation of Kt with d/Lp for a model with N = 1 and θ = 30 and incoming wave condition of His/d = 0.2493 is shown in Figure 3. The figure shows that as P decreases from 30% to 10%, Kt decreases. The maximum reduction in Kt is 35.38%, which occurs when the porosity decreases from 30 to 10% at d/Lp = 0.2733. On average, Kt decreases by 25.26% as the porosity decreases from 30 to 10% for the case shown in Figure 3. For similar conditions as in Figure 3, but for twin walls, the maximum reduction in Kt is 38.86%, and the average reduction is 26.28. From P = 20% to P = 10%, the average decrease in Kt is 16.5% and 14.22% for single and twin wall models, respectively. The average reduction in Kt as the wall porosity changes from P = 30% to P = 20% is 10.6% for single wall and 14.21% for twin walls.
3.2.2. Effect of Number of Walls
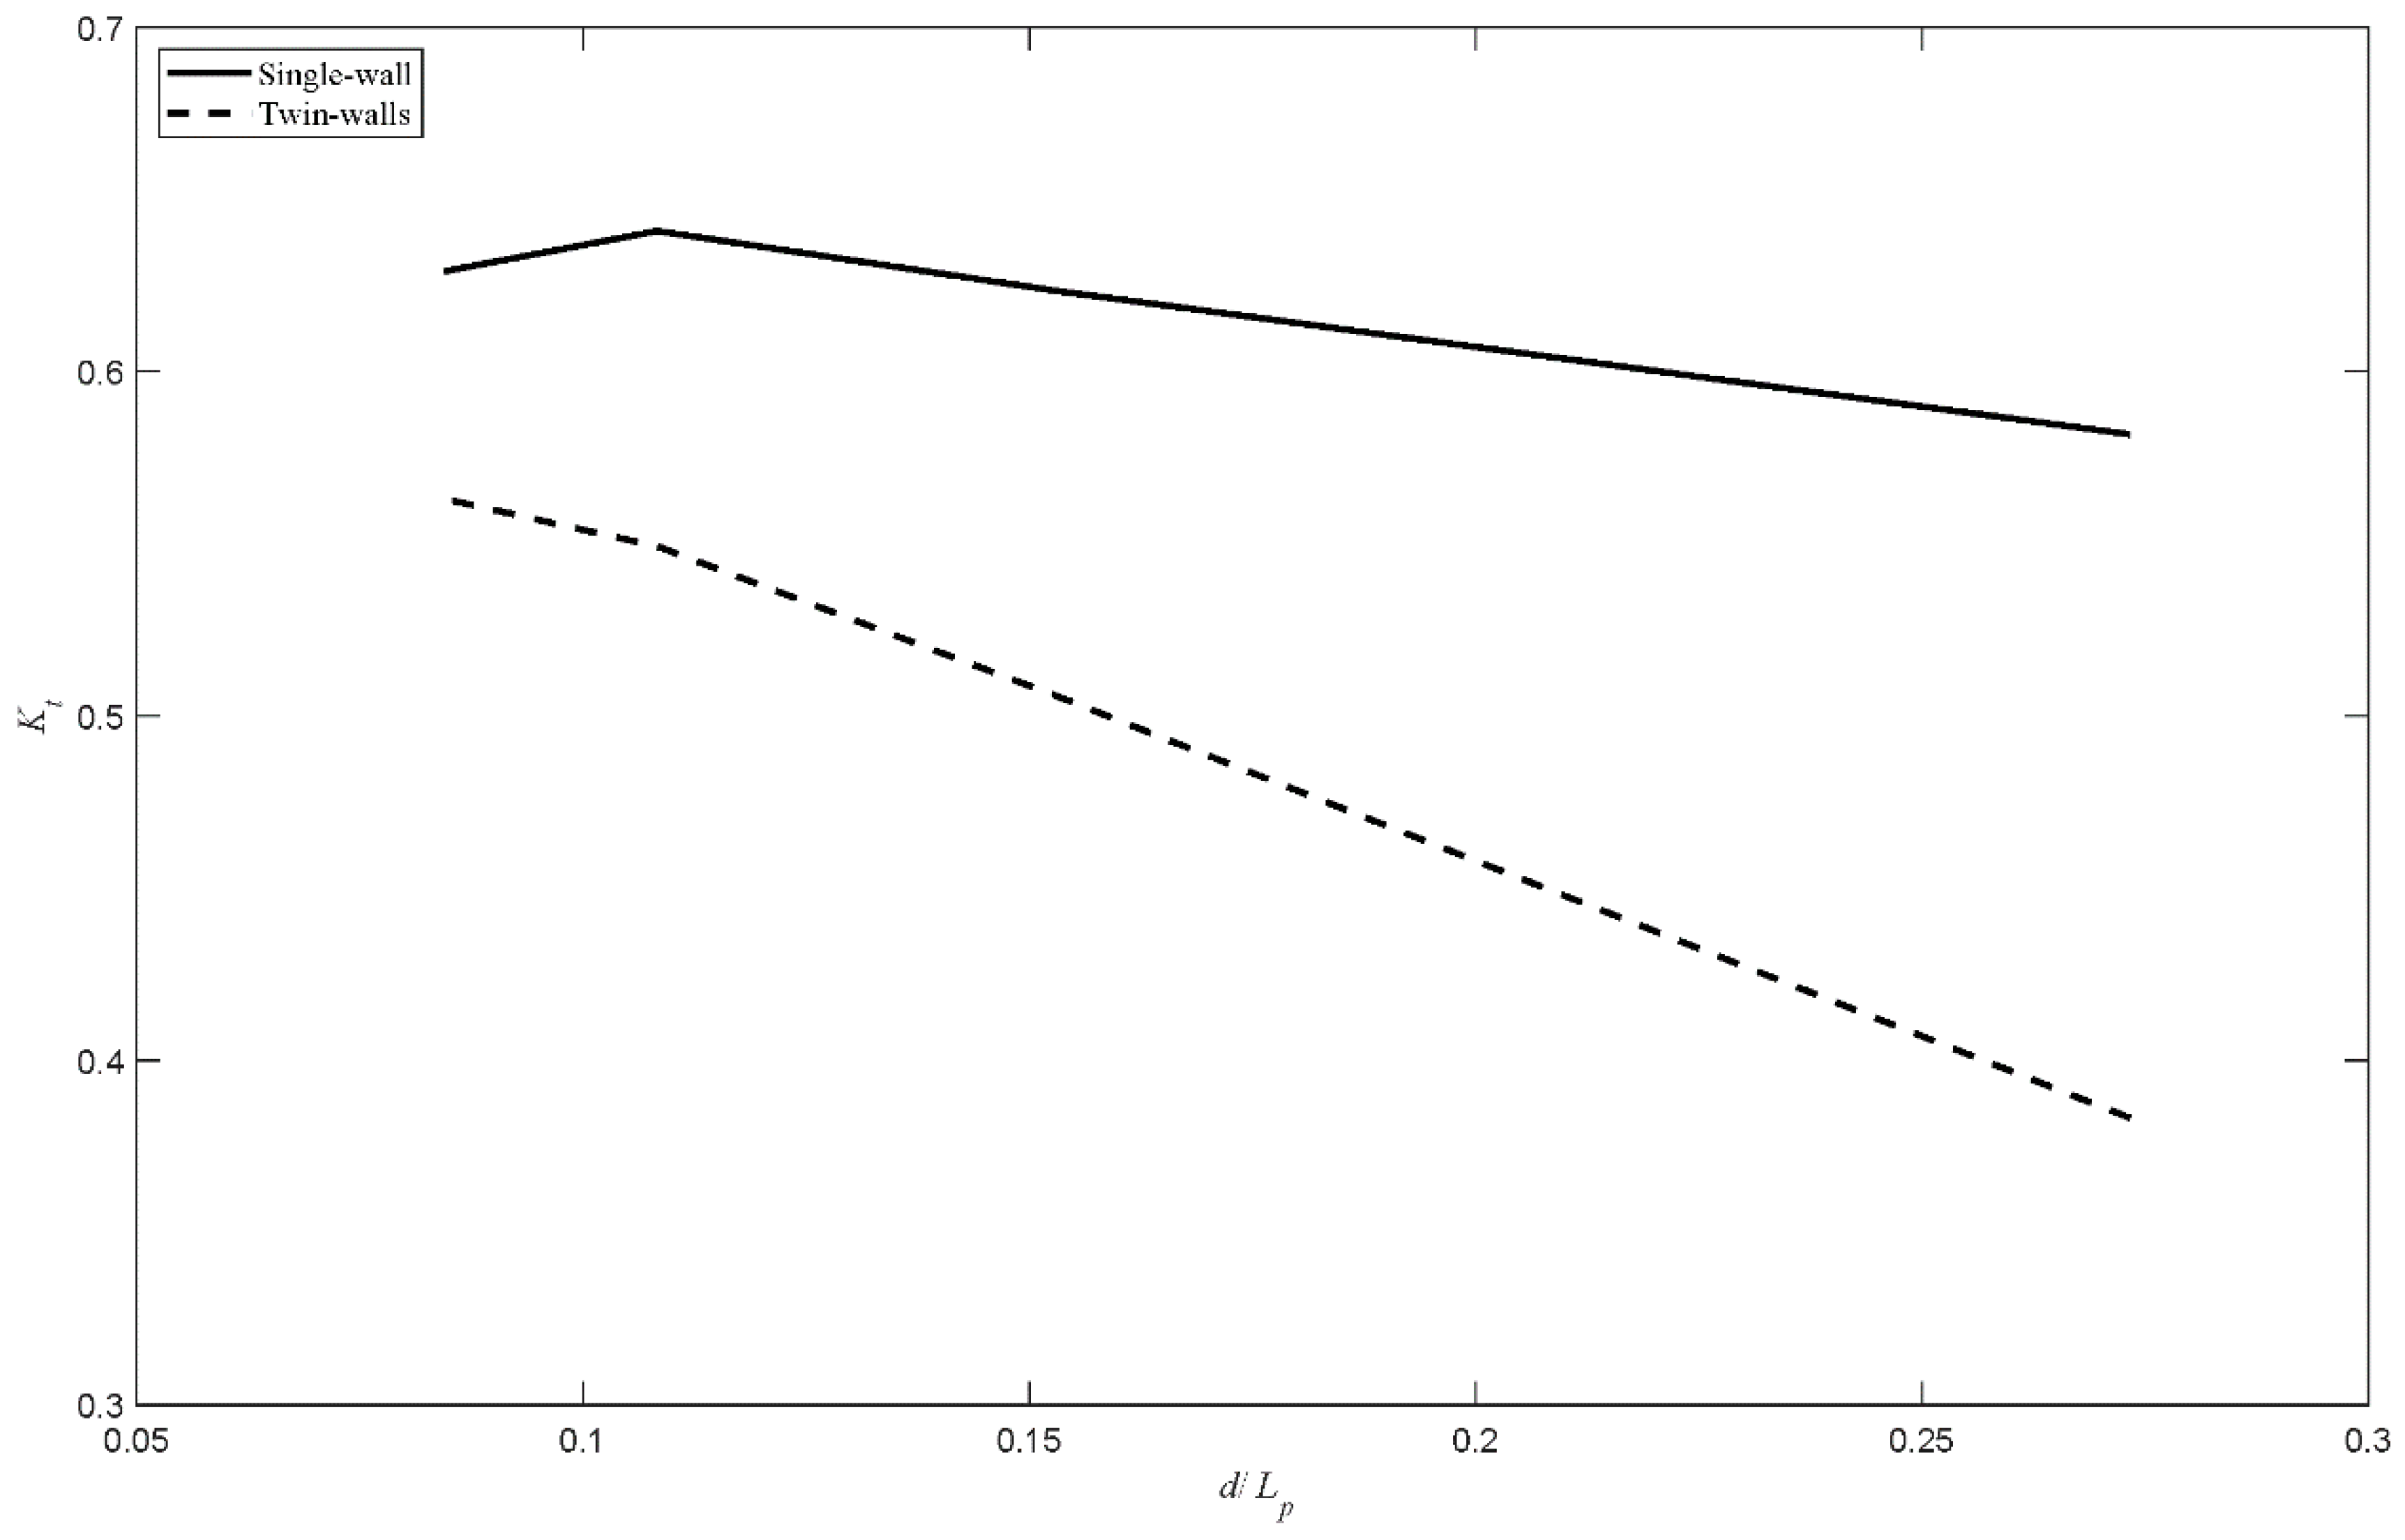
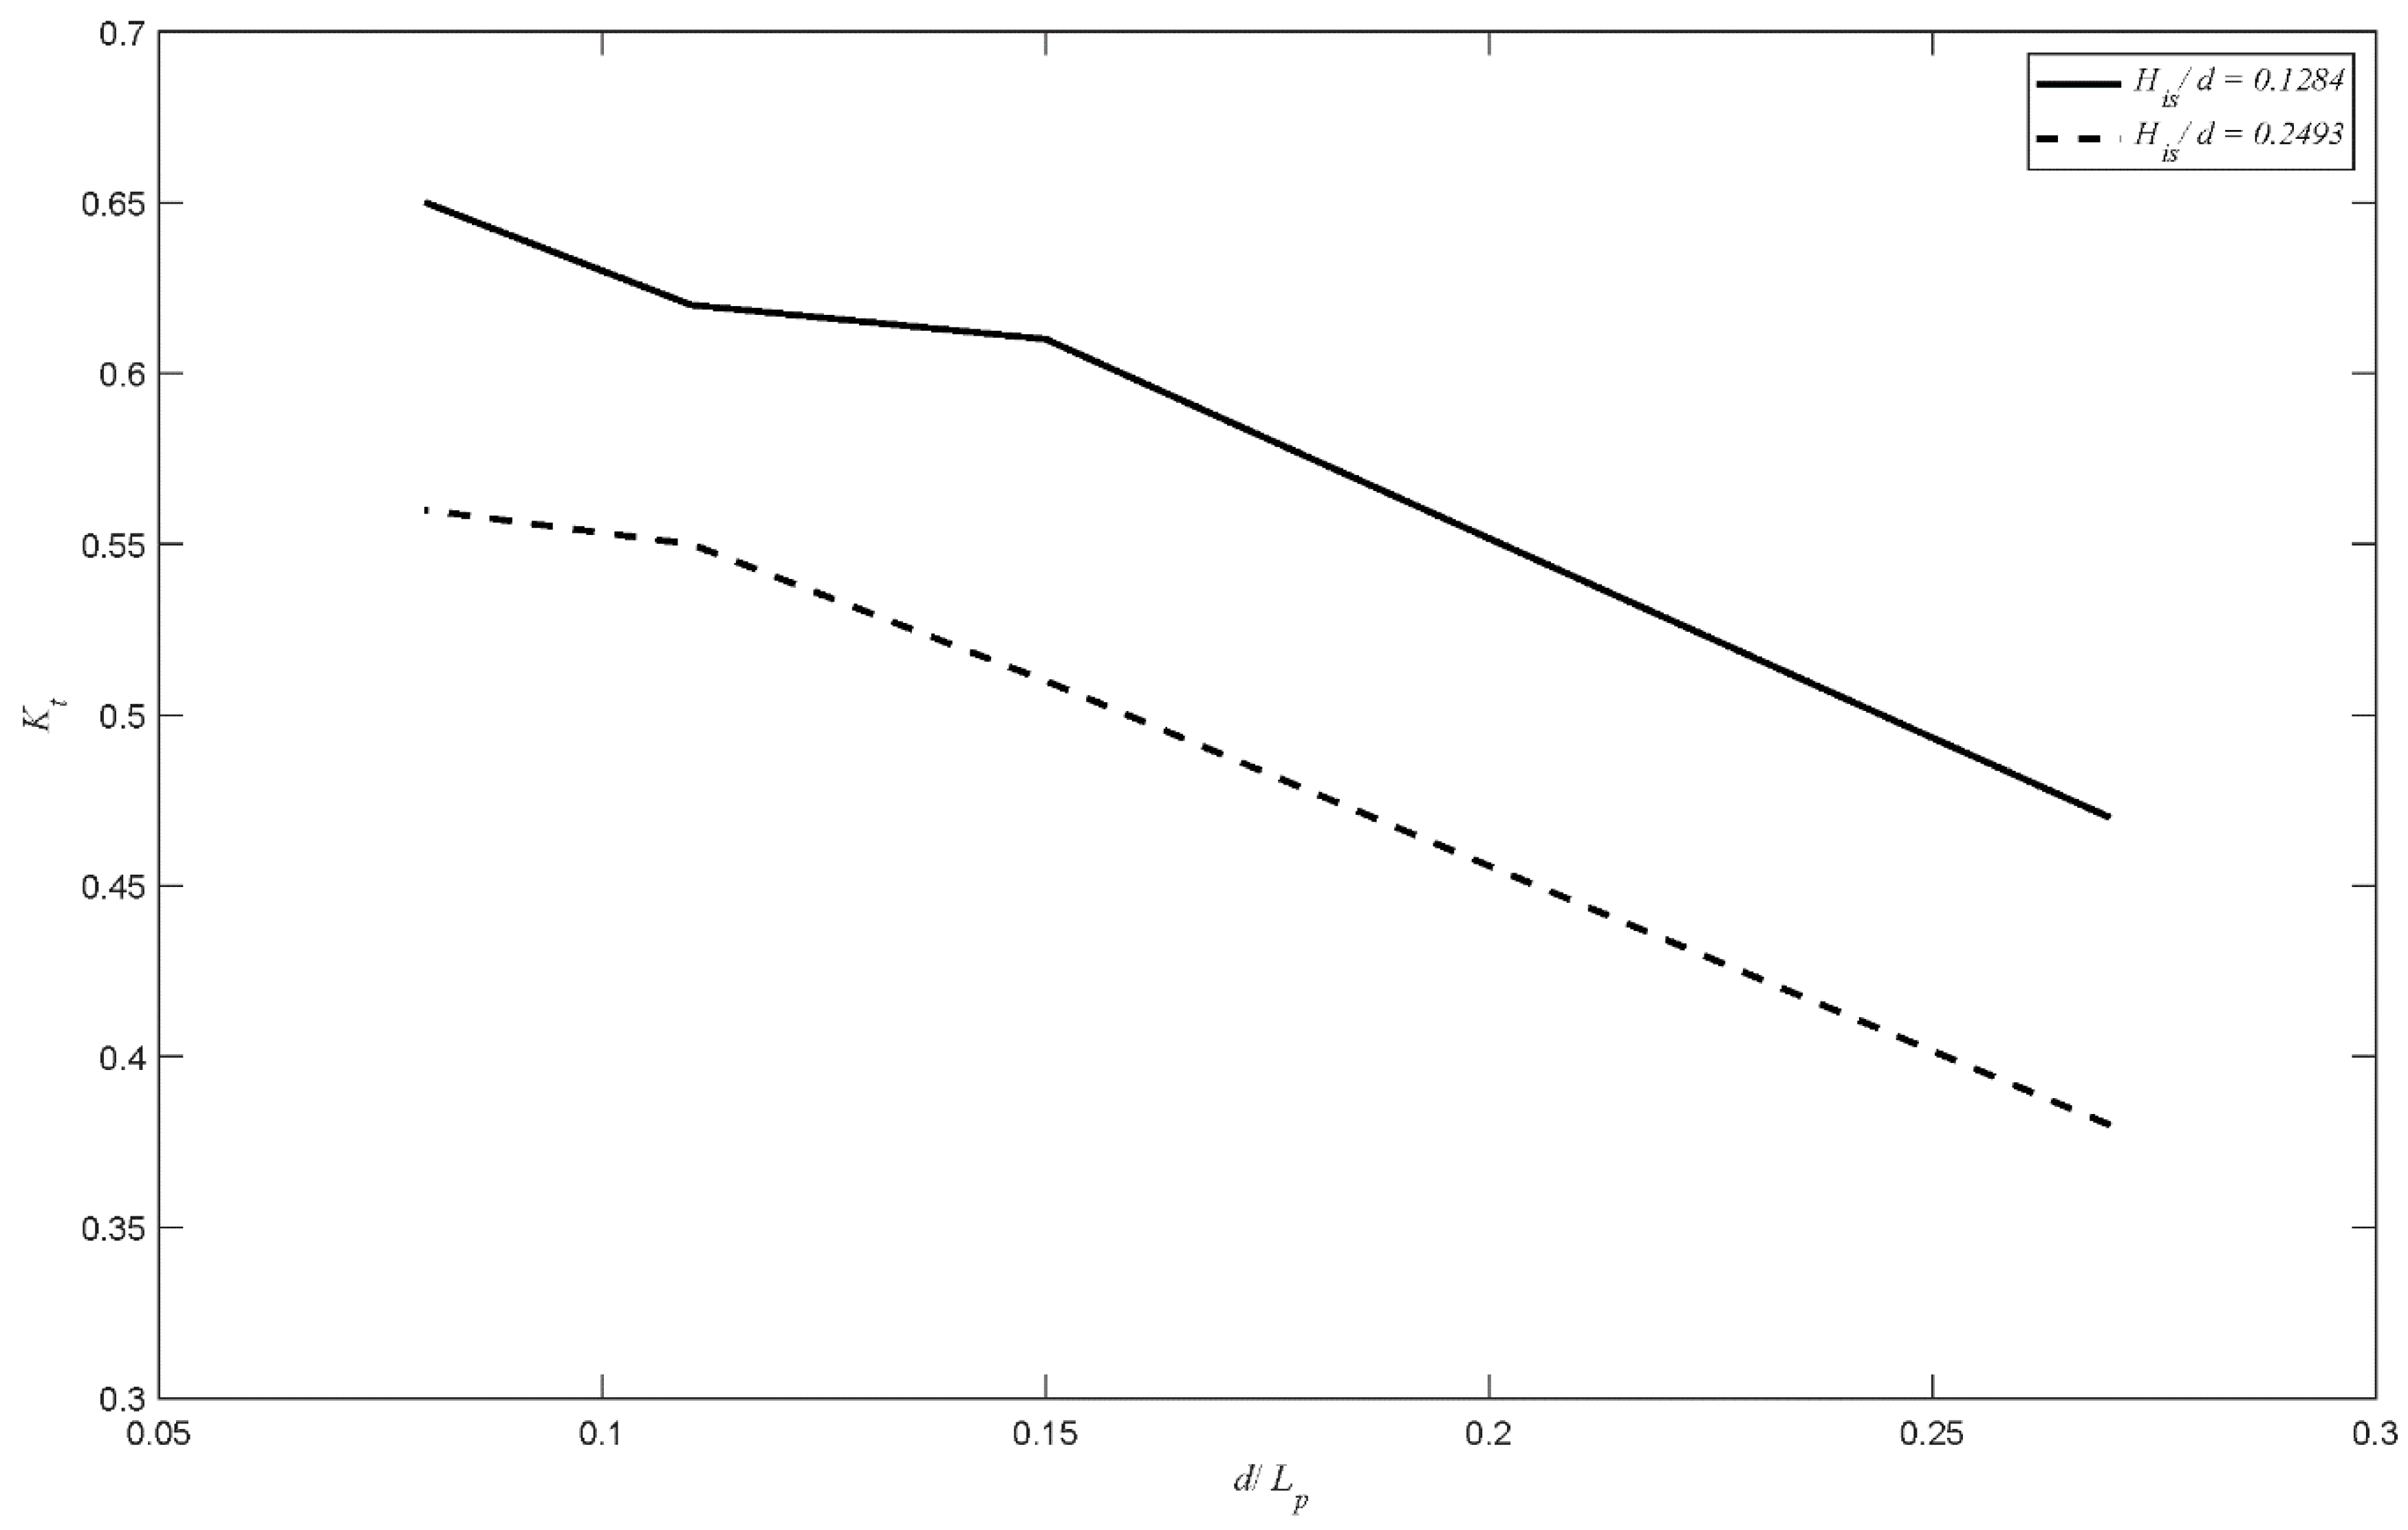
In agreement with previous literature, the addition of a second wall always resulted in a reduction in Kt, as shown in Figure 4, Figure 5, Figure 6, Figure 7 and Figure 8. The results in Figure 4 represent the conditions of P = 20%, θ = 90° and incoming wave condition of His/d = 0.2493. On average, Kt decreased by 25.85% due to the addition of a second wall for waves having His/d = 0.2493, and by 22.52% for waves having His/d = 0.1284. Twin-walls are more effective in reducing Kt as d/Lp increases than single-walls. The reason for this increased effect is that shorter waves (larger d/Lp) are more likely to interact with the wall than longer waves, which are more likely to pass through the slots of the walls.
3.2.3. Effect of Slope Angle
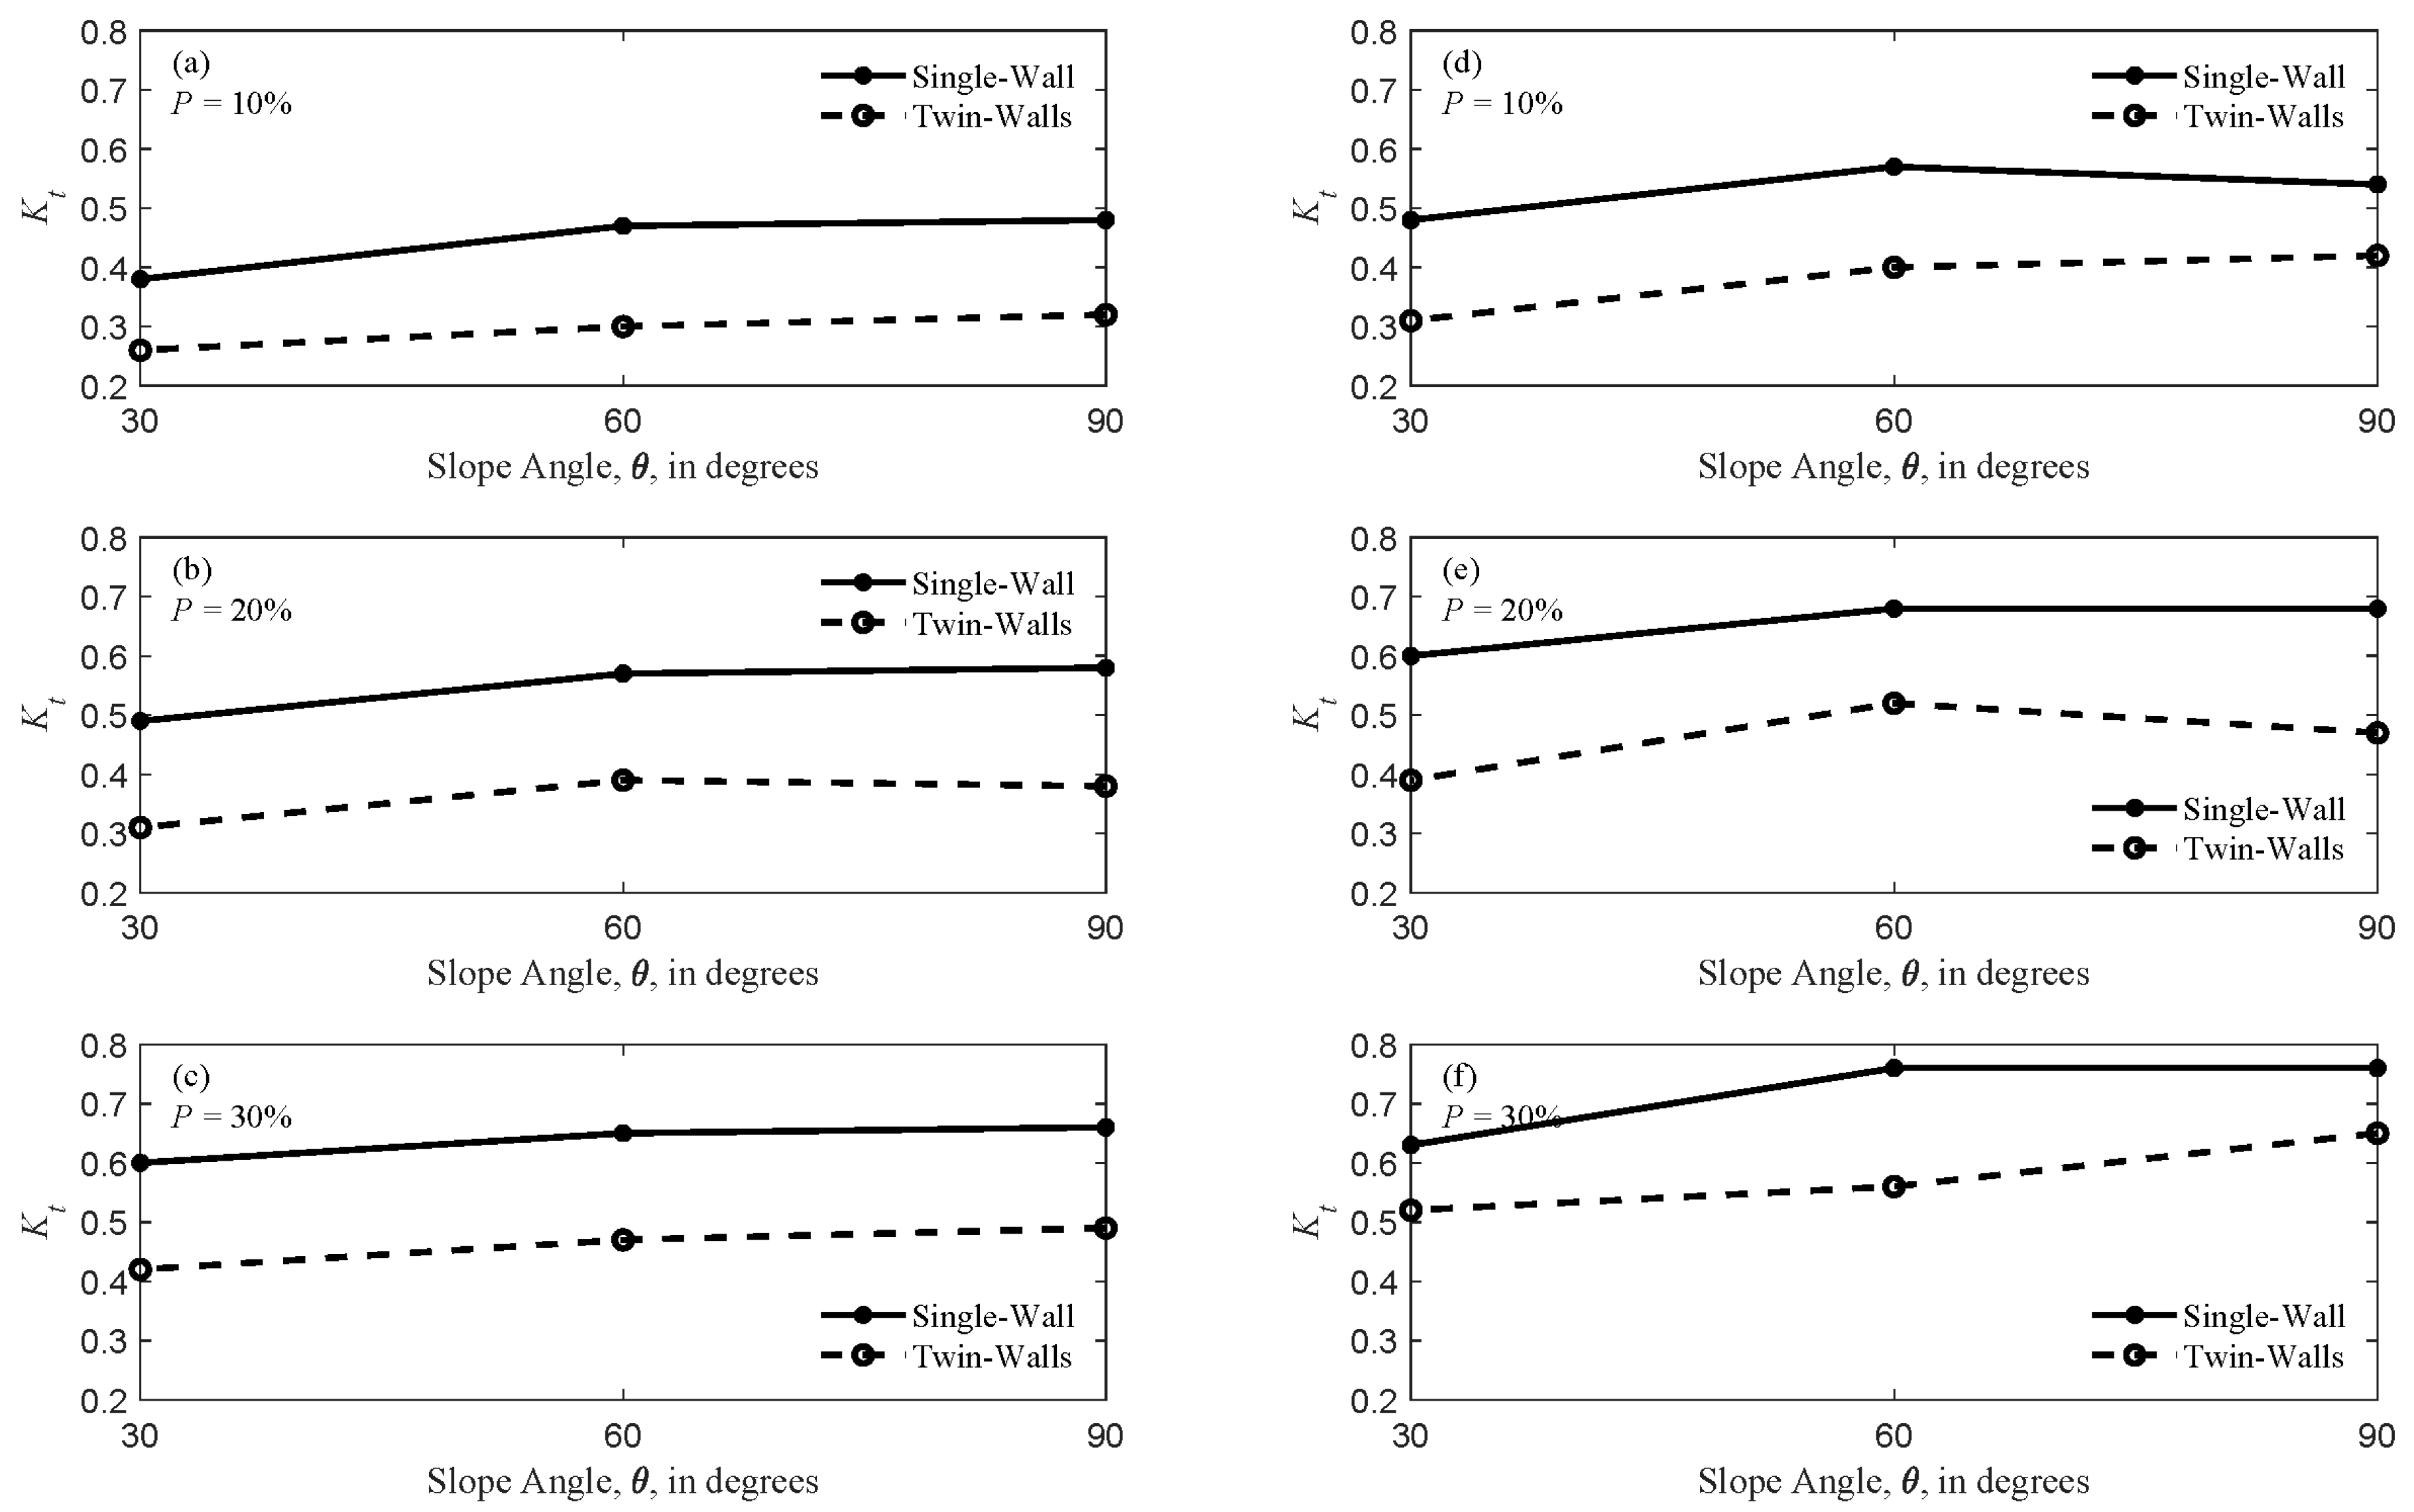
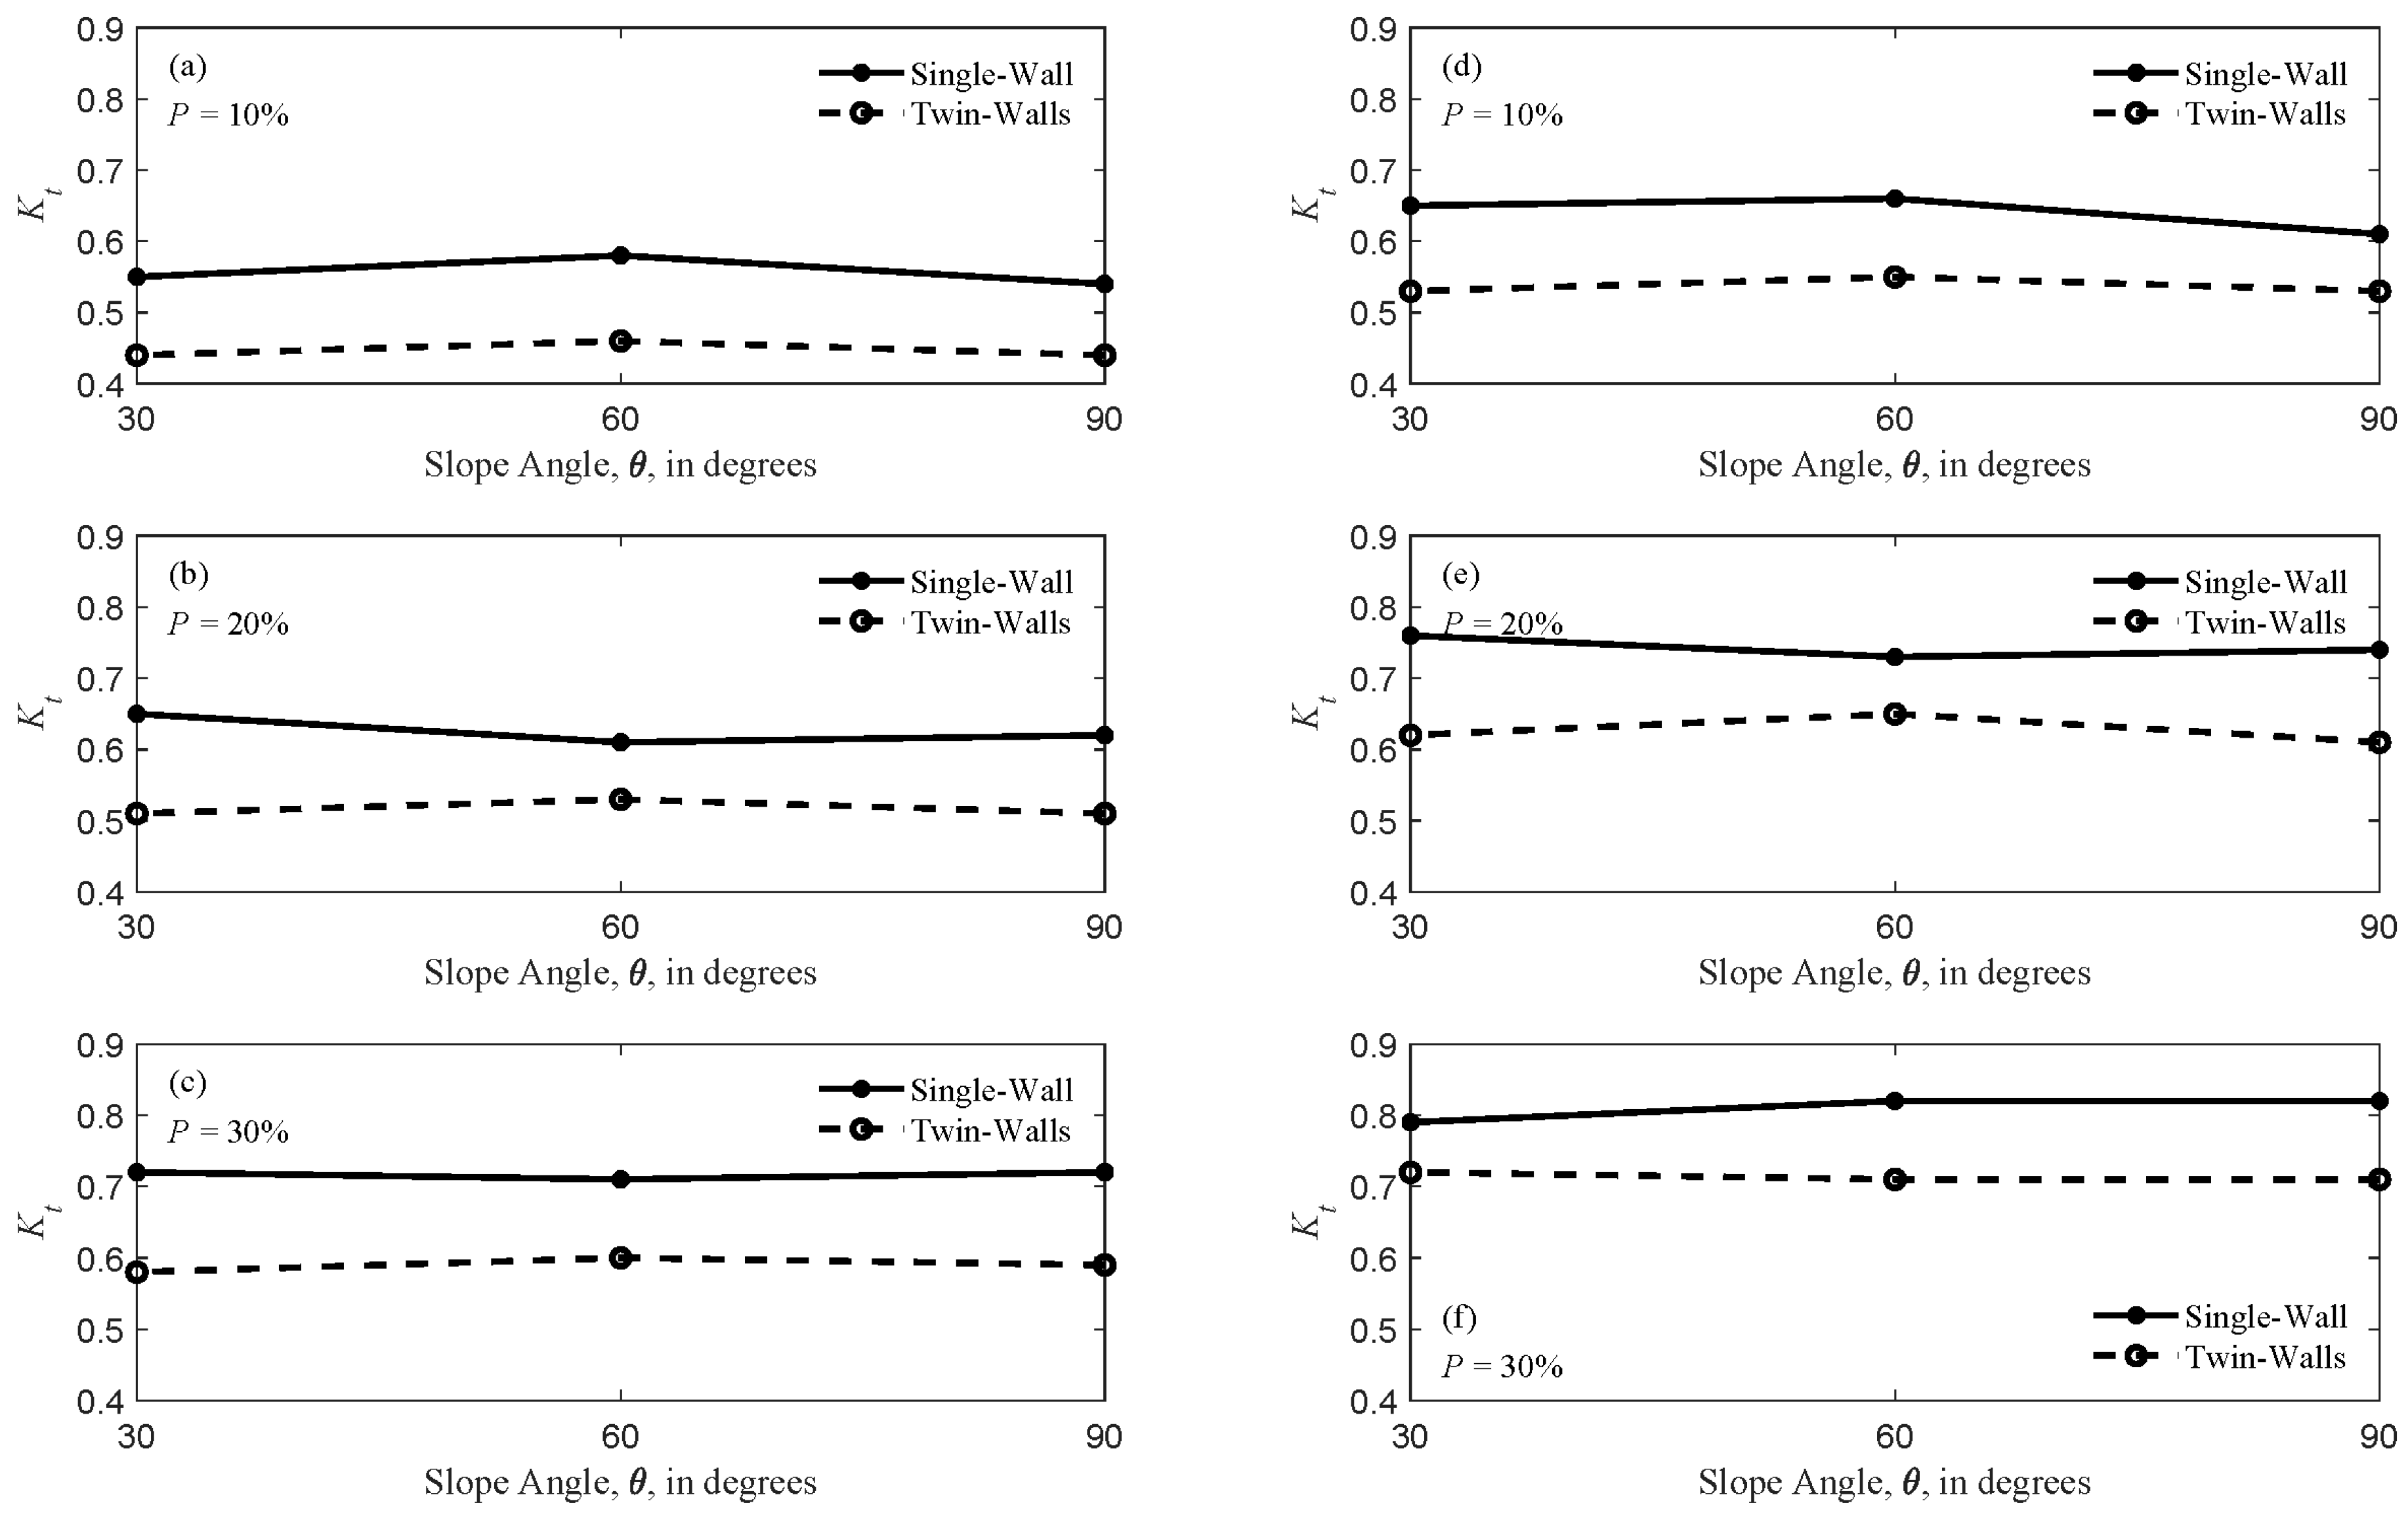
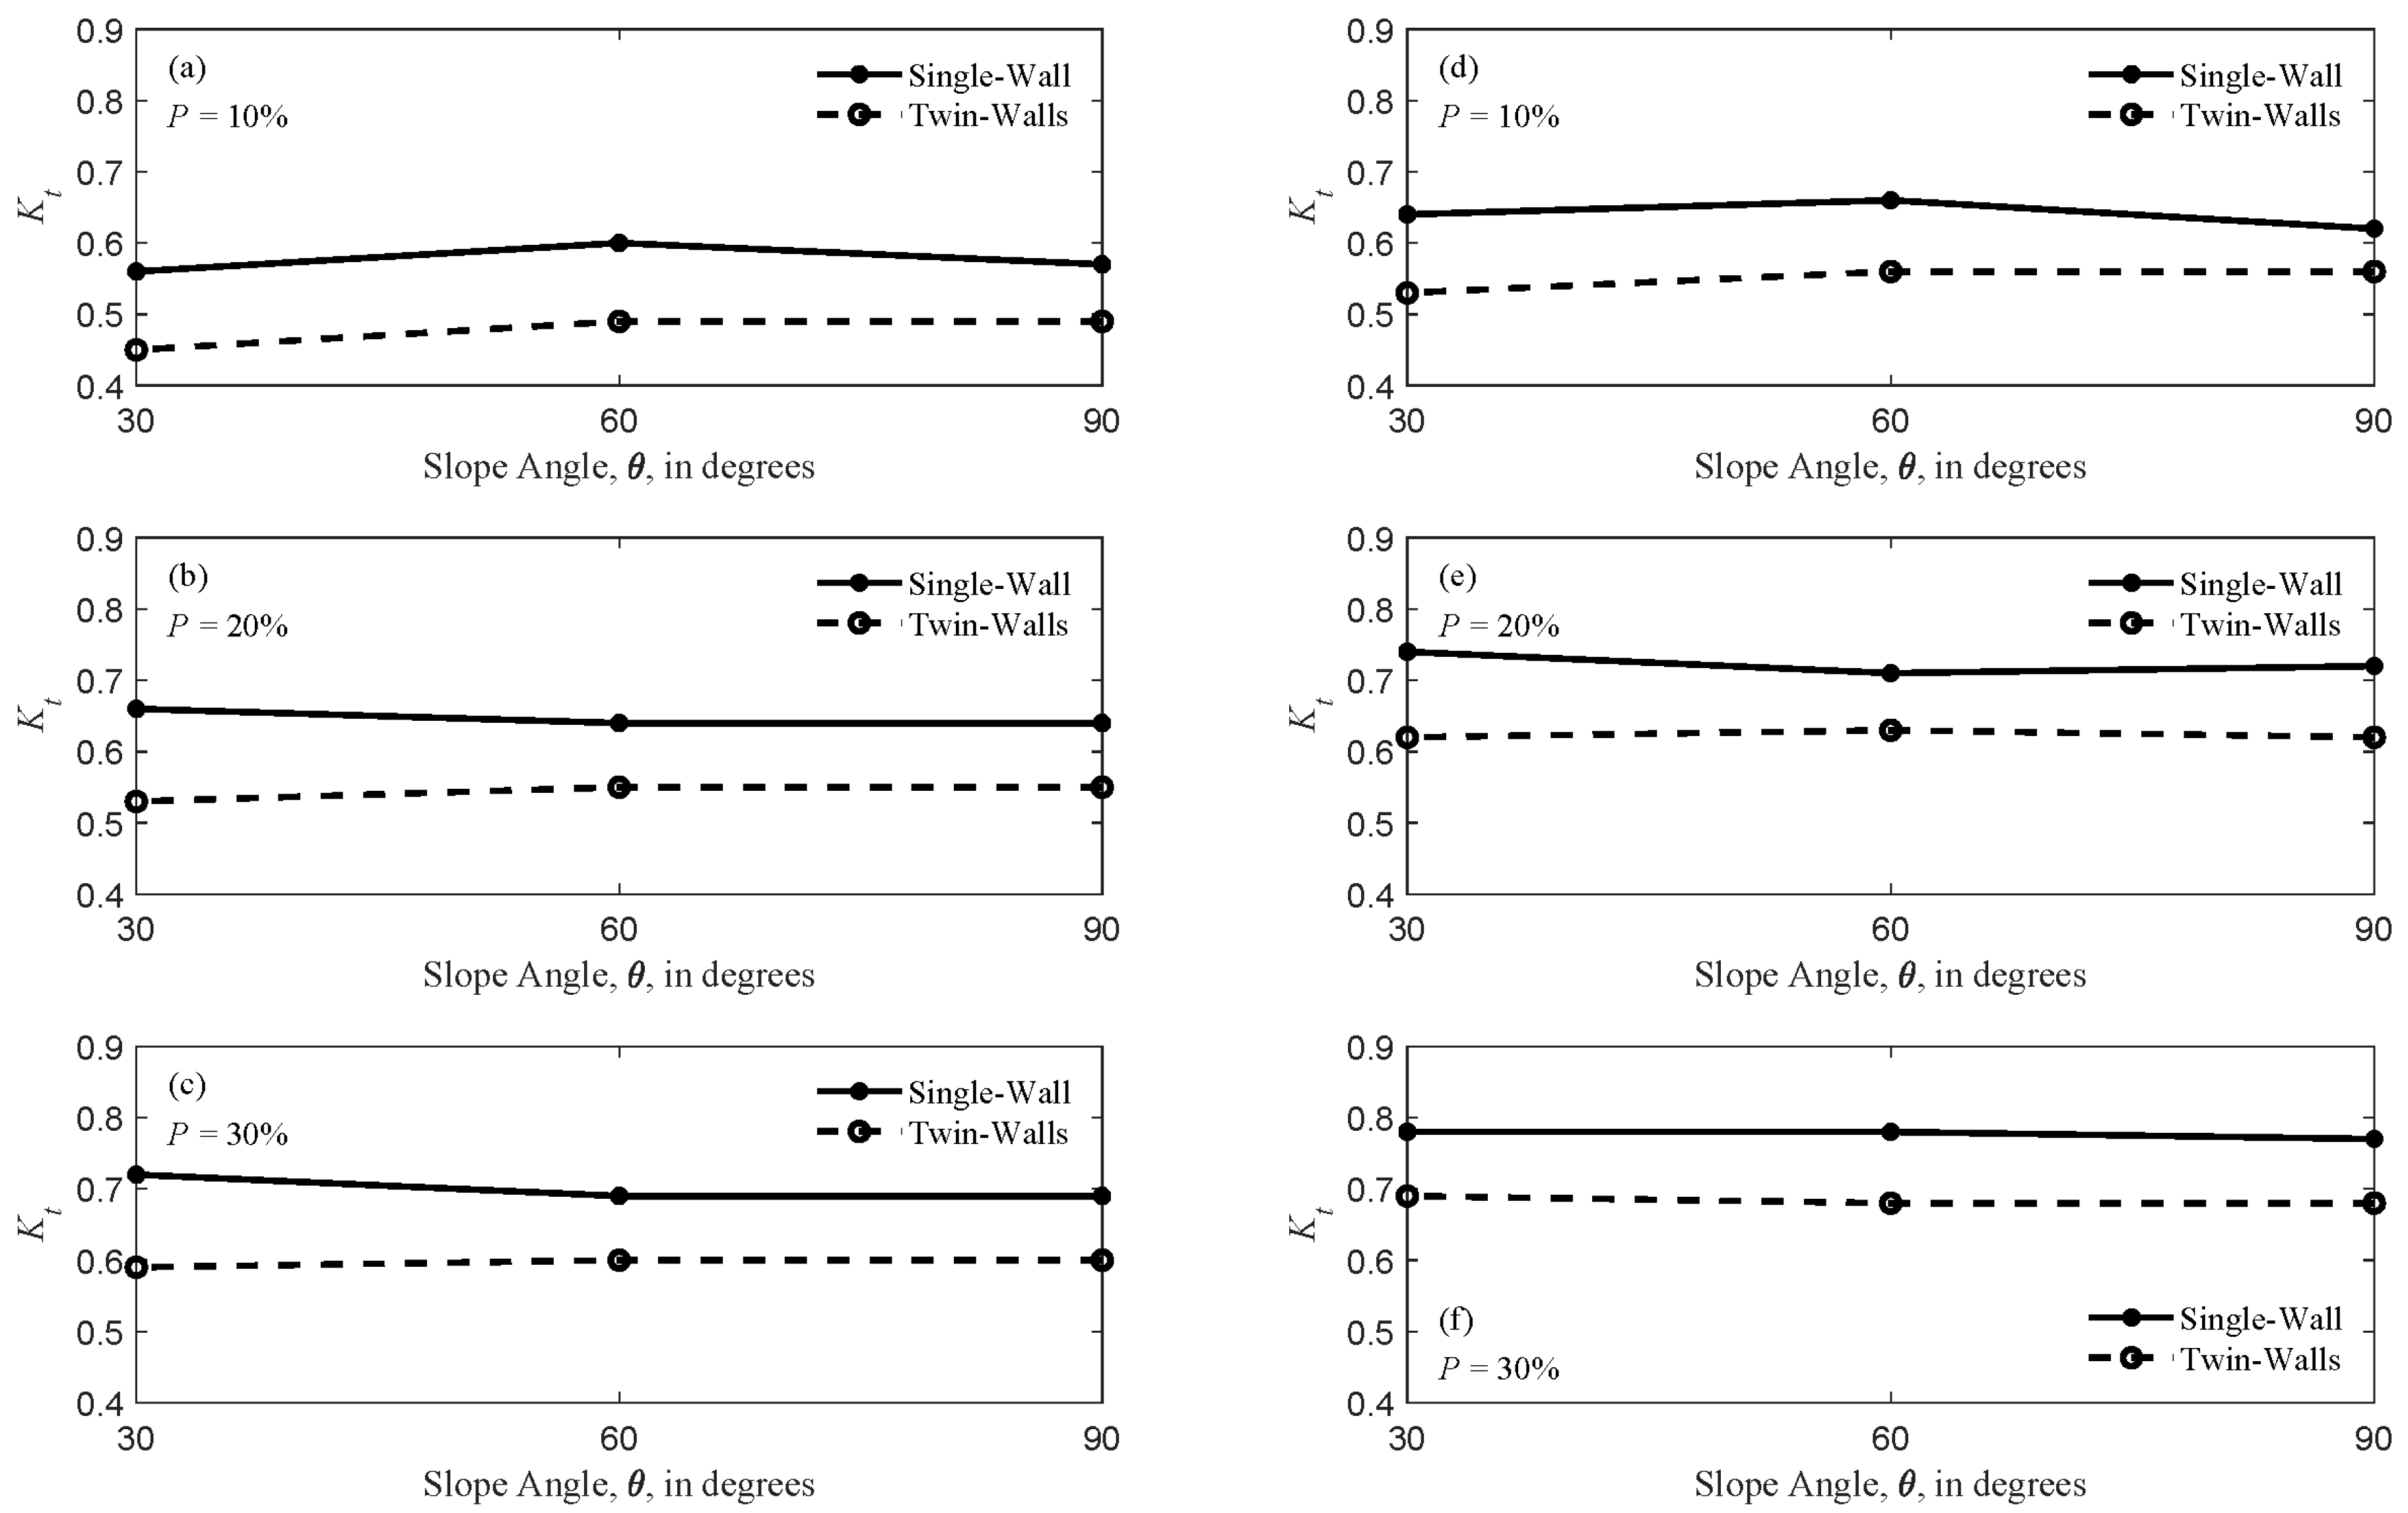
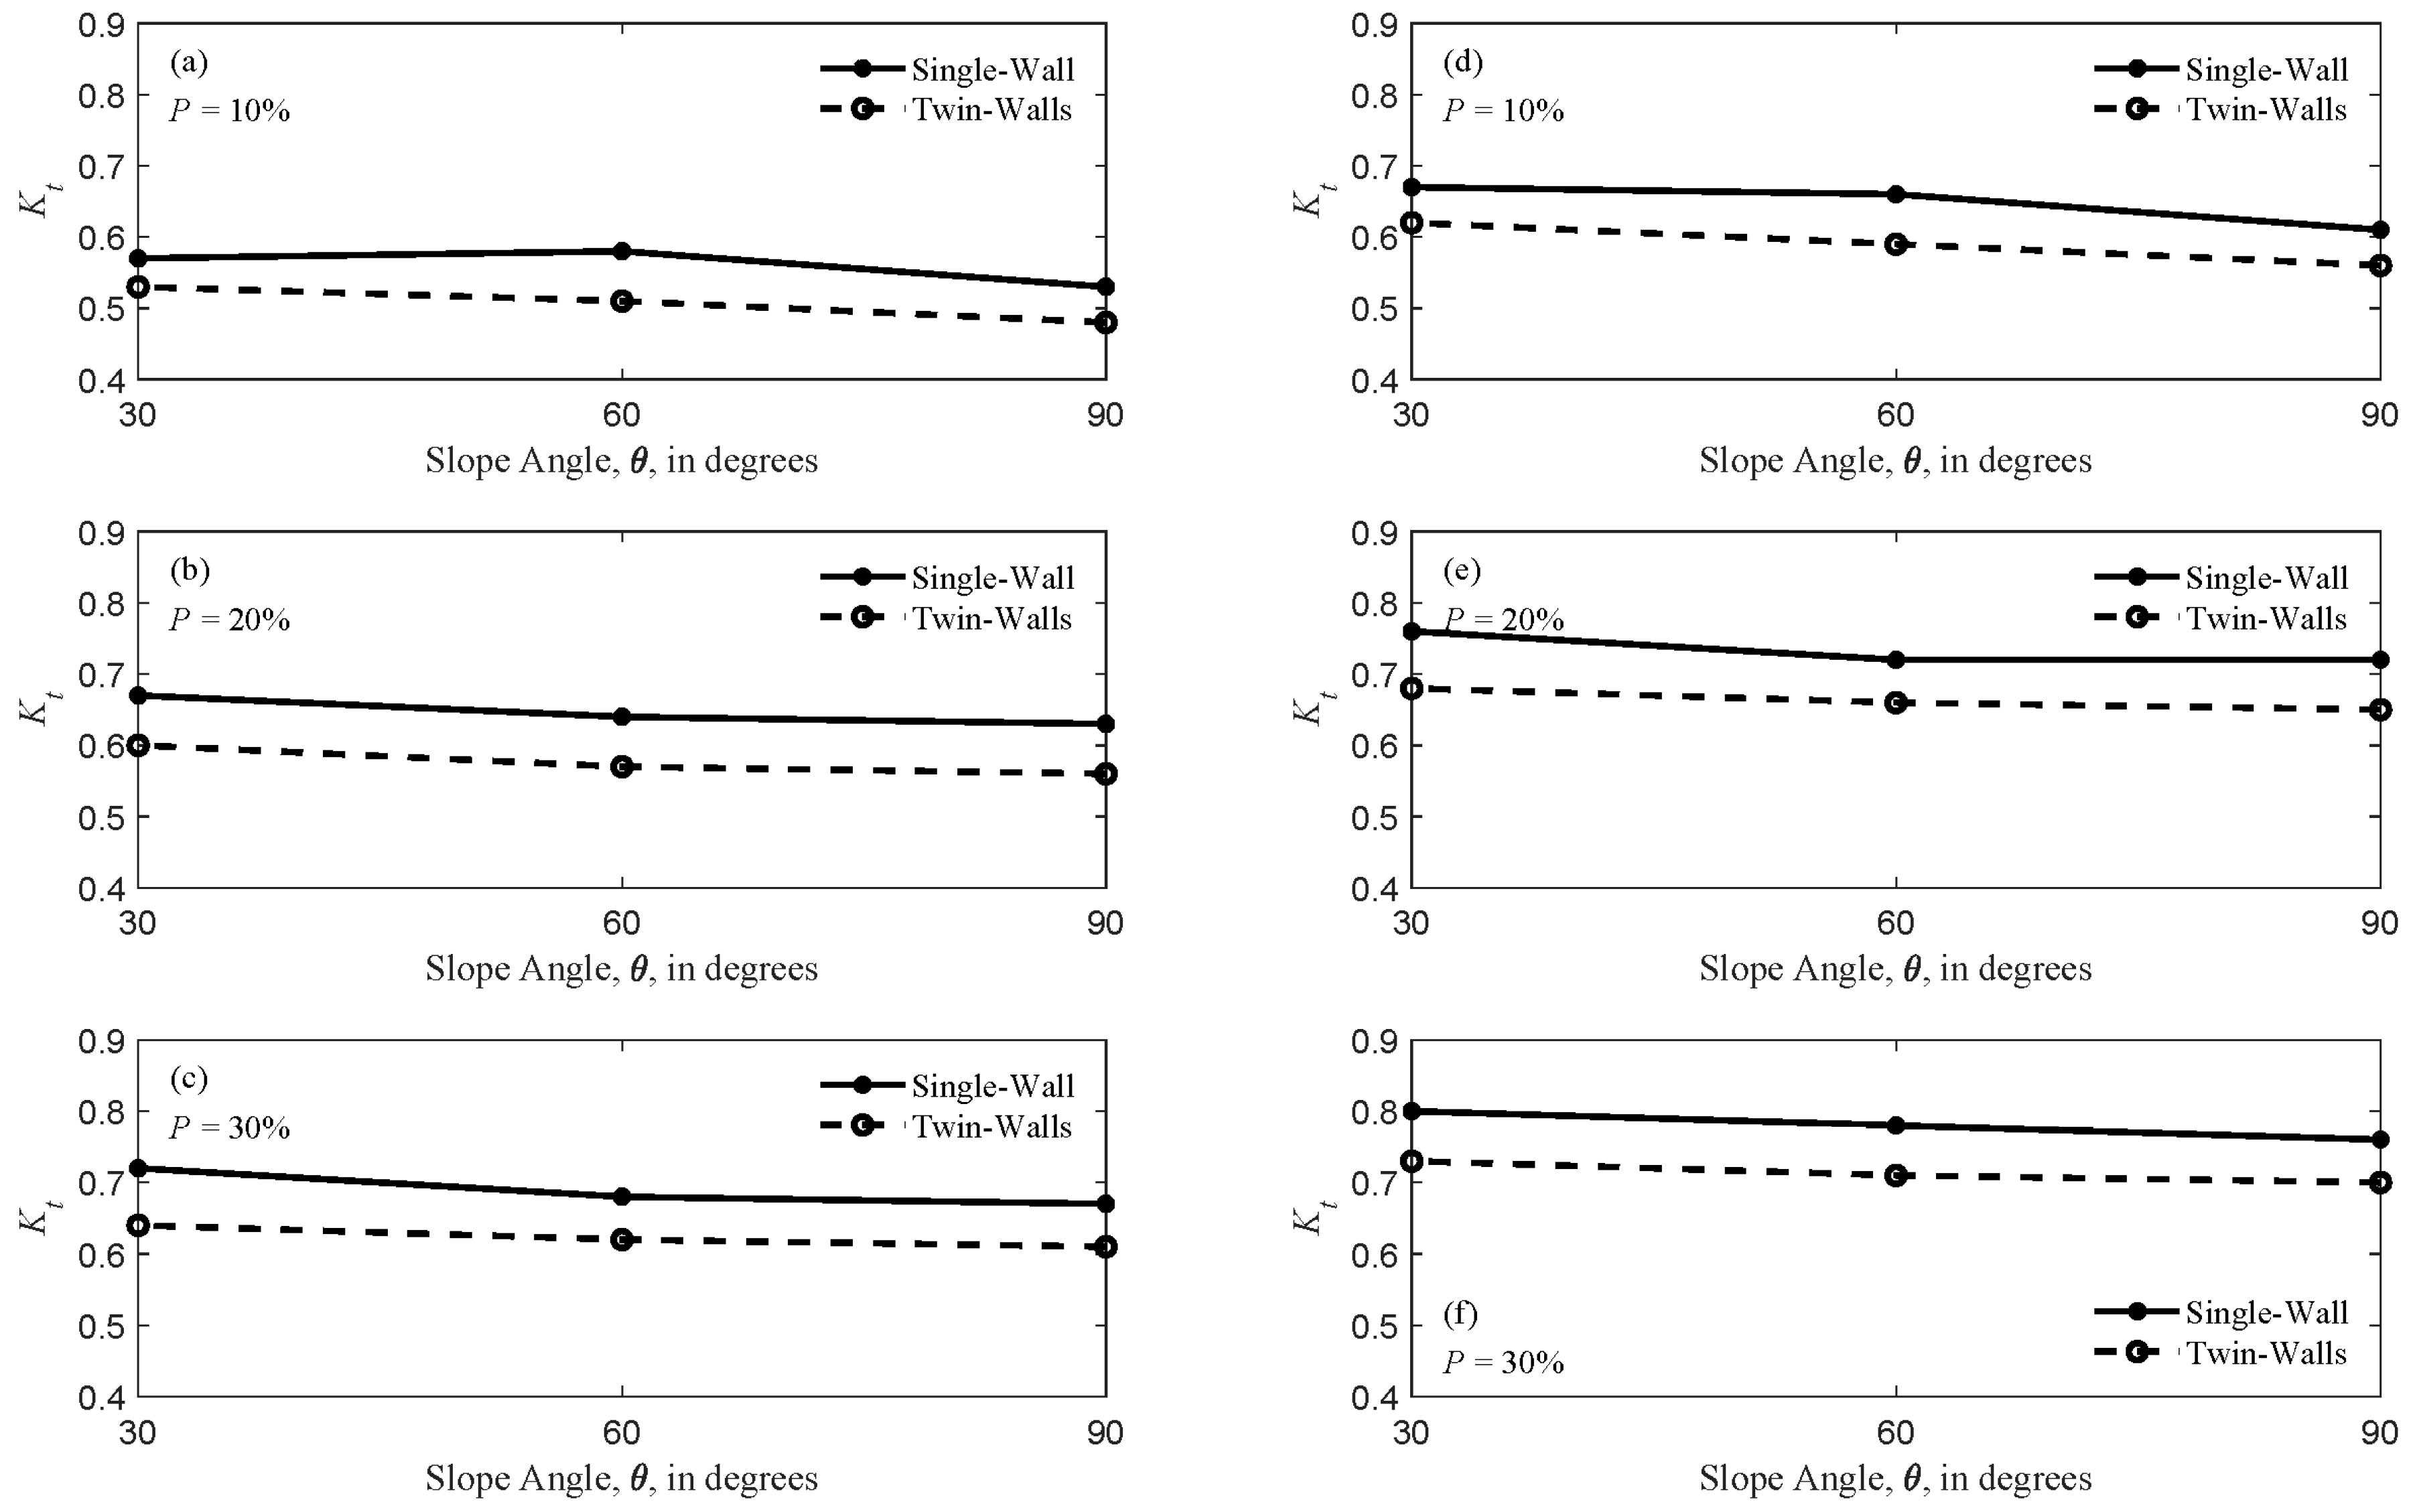
The maximum reduction in Kt as the wall slope changed was 26.20%, which occurs when the wall slope angle changed from 90° to 30° for the case of His/d = 0.1284, d/Lp = 0.2733, P = 10%, and twin walls (Figure 5d). In general, for all cases of d/Lp = 0.2733, Kt decreases as the wall slope angle decreases from 90° to 30° (Figure 5). For the case of d/Lp = 0.1529 (Figure 6), the change in Kt was minor as it does not exceed 6.56%. In seven out of 12 experiments of d/Lp = 0.1529, Kt increases slightly, remains nearly the same in four experiments, and decreases by 1.70% in one experiment, as shown in Figure 6. The maximum decrease in Kt when d/Lp = 0.1083 was 8.16% and the maximum increase was 4.35%, as shown in Figure 7. In general, the change in Kt is minor in most cases when d/Lp = 0.1083 (the average percentage of change = 0.36%). An increasing trend is observed in the case of d/Lp = 0.0844 (Figure 8). The maximum percentage of increase in Kt when d/Lp = 0.0844 was 10.71% for the case of twin-walls, P = 10%, and His/d = 0.1284 (Figure 8d). Figure 5, Figure 6, Figure 7 and Figure 8 show that changing the wall position from vertical wall to 60° sloped wall has insignificant effect on the values of Kt for the majority of the cases. The maximum changes in Kt as the wall slope changes occur in the cases of twin-walls. For the cases of single-wall and increasing Kt, the average percentages of increase are 4.21, 4.56, and 3.87% for slope angles changing from 90° to 60°, 90° to 30°, and 60° to 30°, respectively. For the case of twin walls, the average percentages of increase are 3.45, 4.11, and 3.21% for slope angles changing from 90° to 60°, 90° to 30°, and 60° to 30°, respectively. For the cases of single-wall and decreasing Kt, the average percentages of decrease are 1.38, 11.42, and 8.12% for slope angles changing from 90° to 60°, 90° to 30°, and 60° to 30°, respectively. For the case of twin walls, the average percentages of decrease are 4.37, 11.08, and 8.60% for slope angles changing from 90° to 60°, 90° to 30°, and 60° to 30°, respectively.
Table 4 and Table 5 present simple statistics for the percentages of increase and decrease in Kt as a function of θ and N.
For d/Lp larger than 0.1527, Kt for models with θ = 30°, is significantly lower than models with θ = 60° and 90°. Before the aforementioned critical d/Lp points, no single conclusion was reached regarding Kt and the varying slope angles.
3.2.4. Effect of Relative Wave Height, His/d
The analysis of Kt variation with d/Lp for the two cases of His/d showed that Kt is higher for smaller His/d (His/d = 0.1284), as shown in Figure 9 and Figure 10. Figure 9 shows the model conditions when N = 1, = 20%, and θ = 90°, and Figure 10 shows similar conditions but for N = 2. All other model conditions show similar trends.
The higher values of Kt obtained when His/d = 0.1284 are due to the wave build-up phenomenon. For cases with twin walls, the average decrease in due to increasing His/d ranged between 16.6–21.2%, while the average decrease was lower for models with single walls (between 8.83–16.3%). The highest average decrease in Kt occurred when P = 20%.
From the results, it was also concluded that the variation of Kt with His/d and d/Lp is more dependent on porosity than wall slope angle for models with single walls, while the opposite is true for cases with twin walls.
3.2.5. Effect of
As seen in Figure 5, Figure 6, Figure 7 and Figure 8, the general trend of Kt is to decreases as d/Lp increases. From d/Lp = 0.1527 to d/Lp = 0.2733 the decrease rate of Kt increases significantly (Figure 5 and Figure 6). The influence of d/Lp on Kt was similar for both cases of His/d in the case of single-wall, whereas it was more substantial for models with twin walls. For θ = 30°, however, it was noticed that for both single and twin walls decreased in a similar manner with increasing d/Lp. The impact of d/Lp on the results of models with N = 1 and θ = 90° and 60° was mild. In brief, d/Lp had the greatest influence on for models with θ = 30° followed by models with θ = 60° and θ = 90°, respectively.
3.3. Wave Reflection Coefficient, Kr
3.3.1. Effect of Porosity
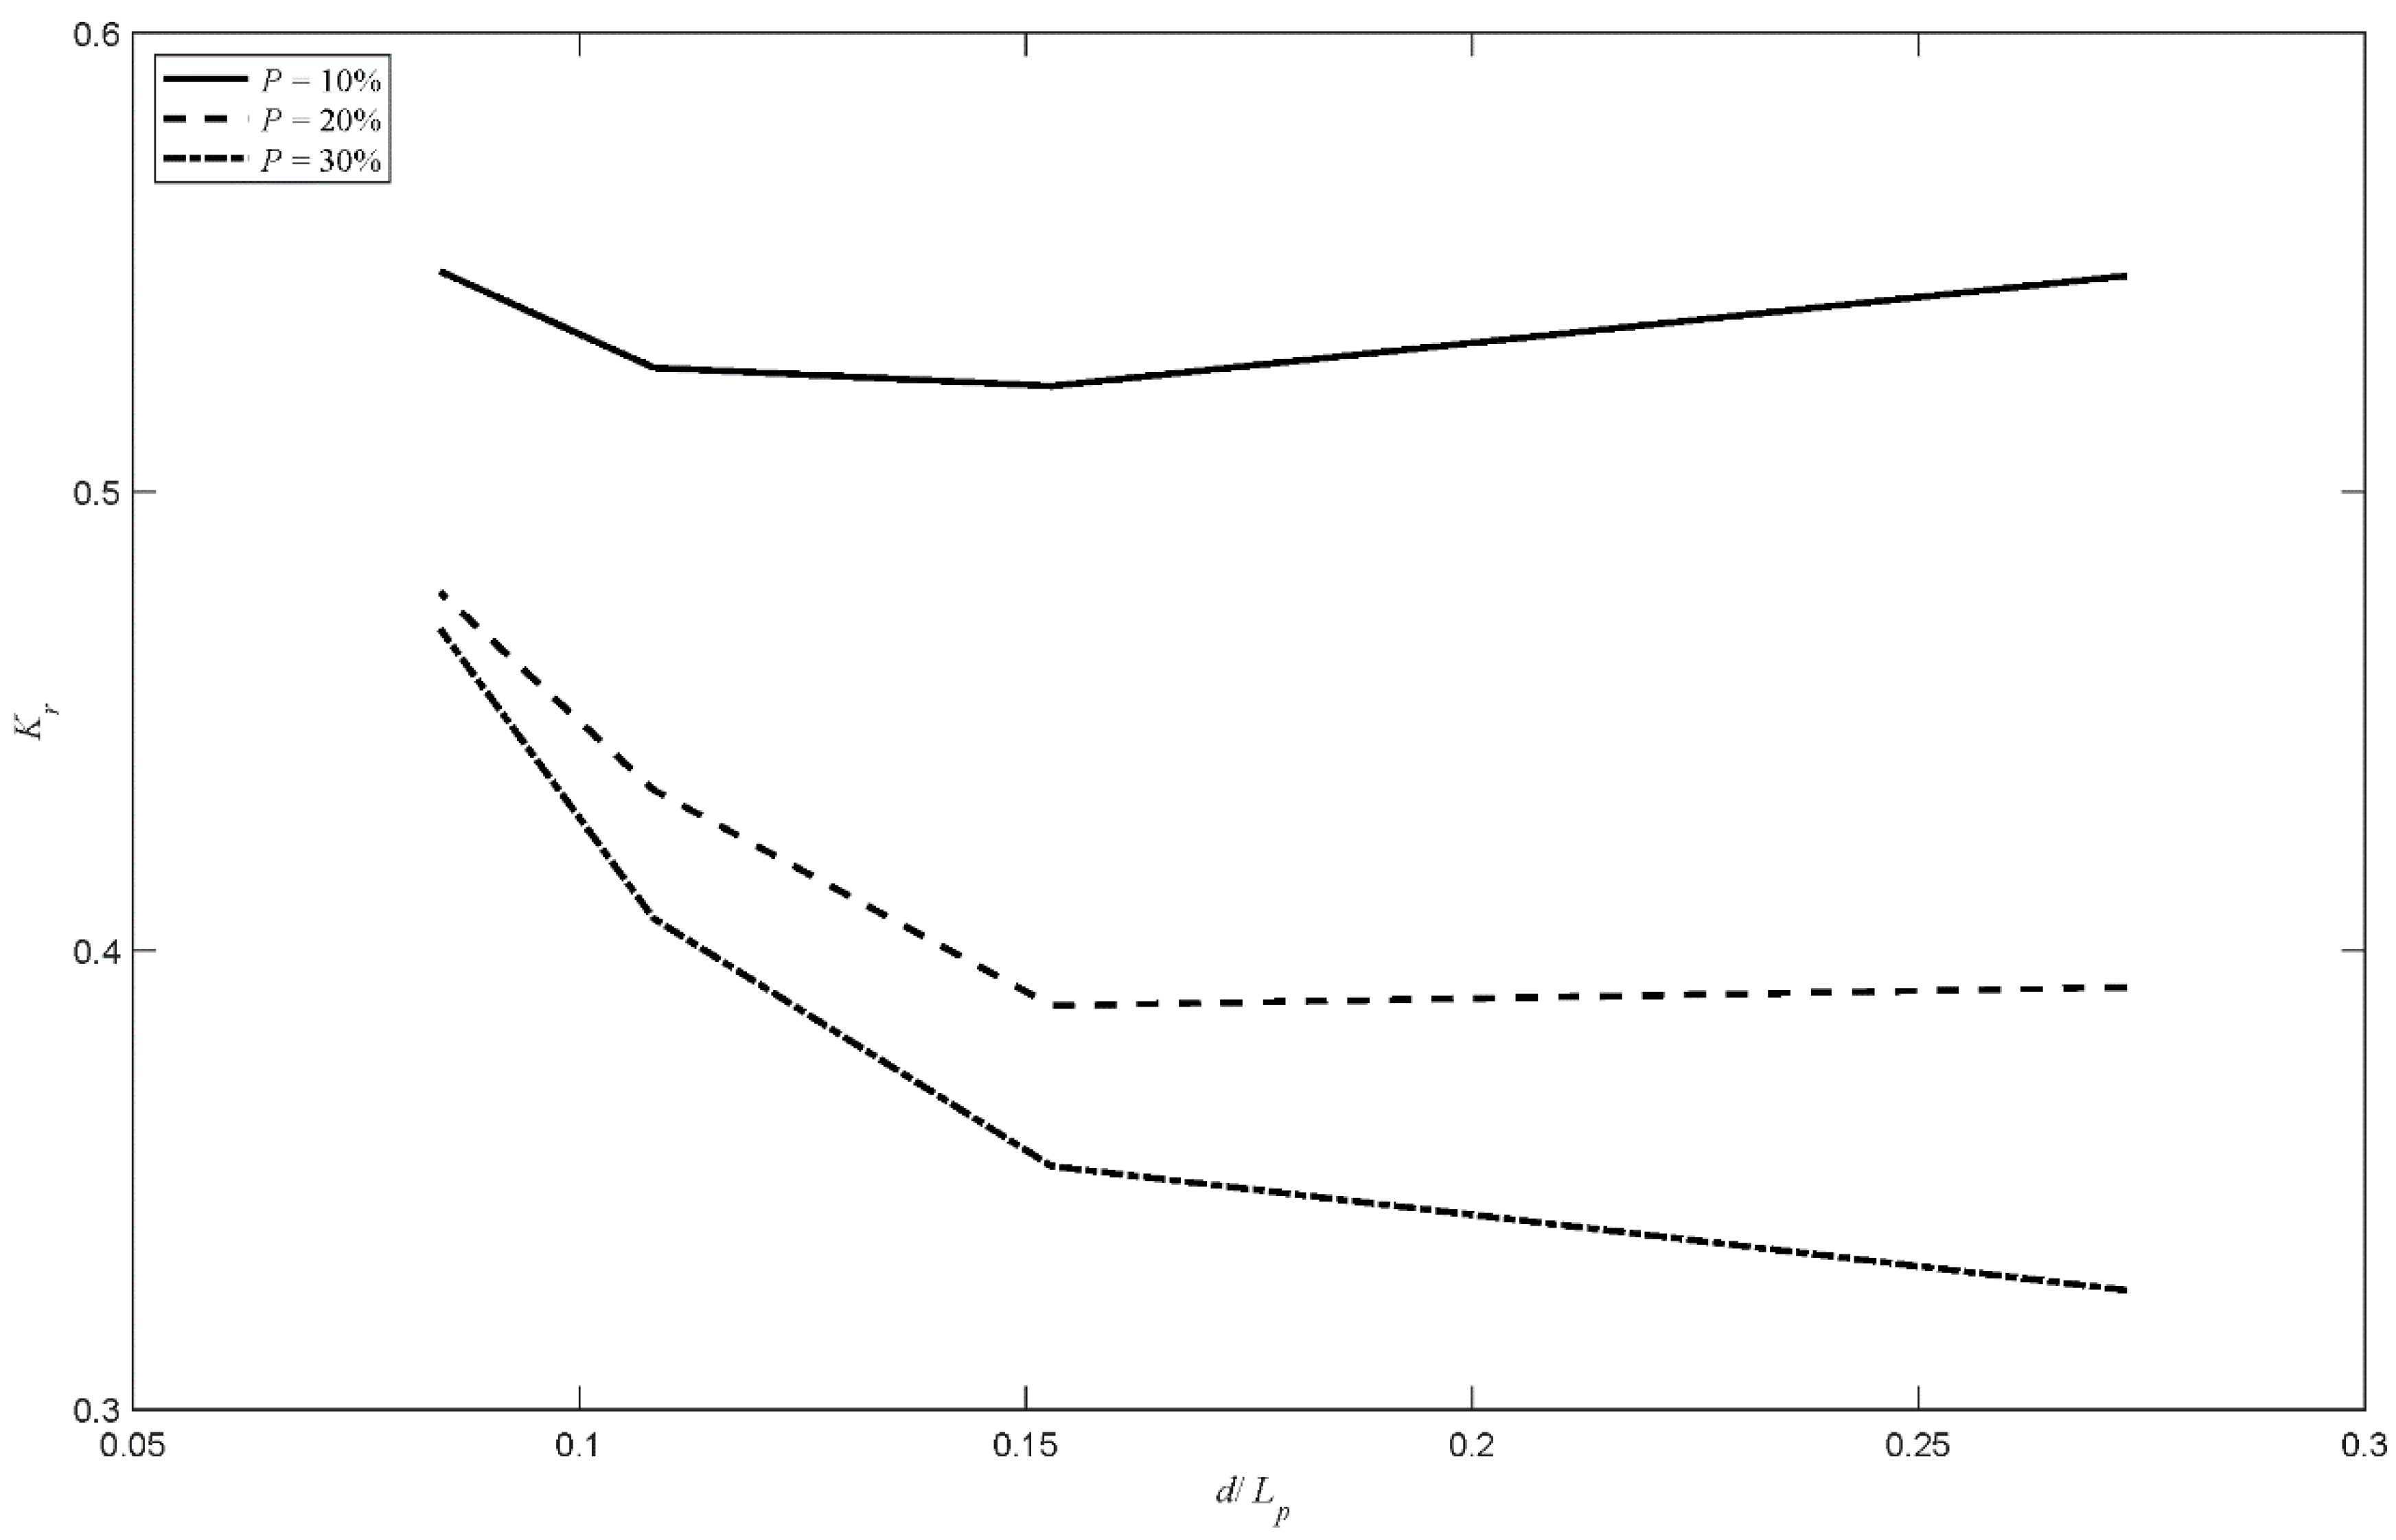
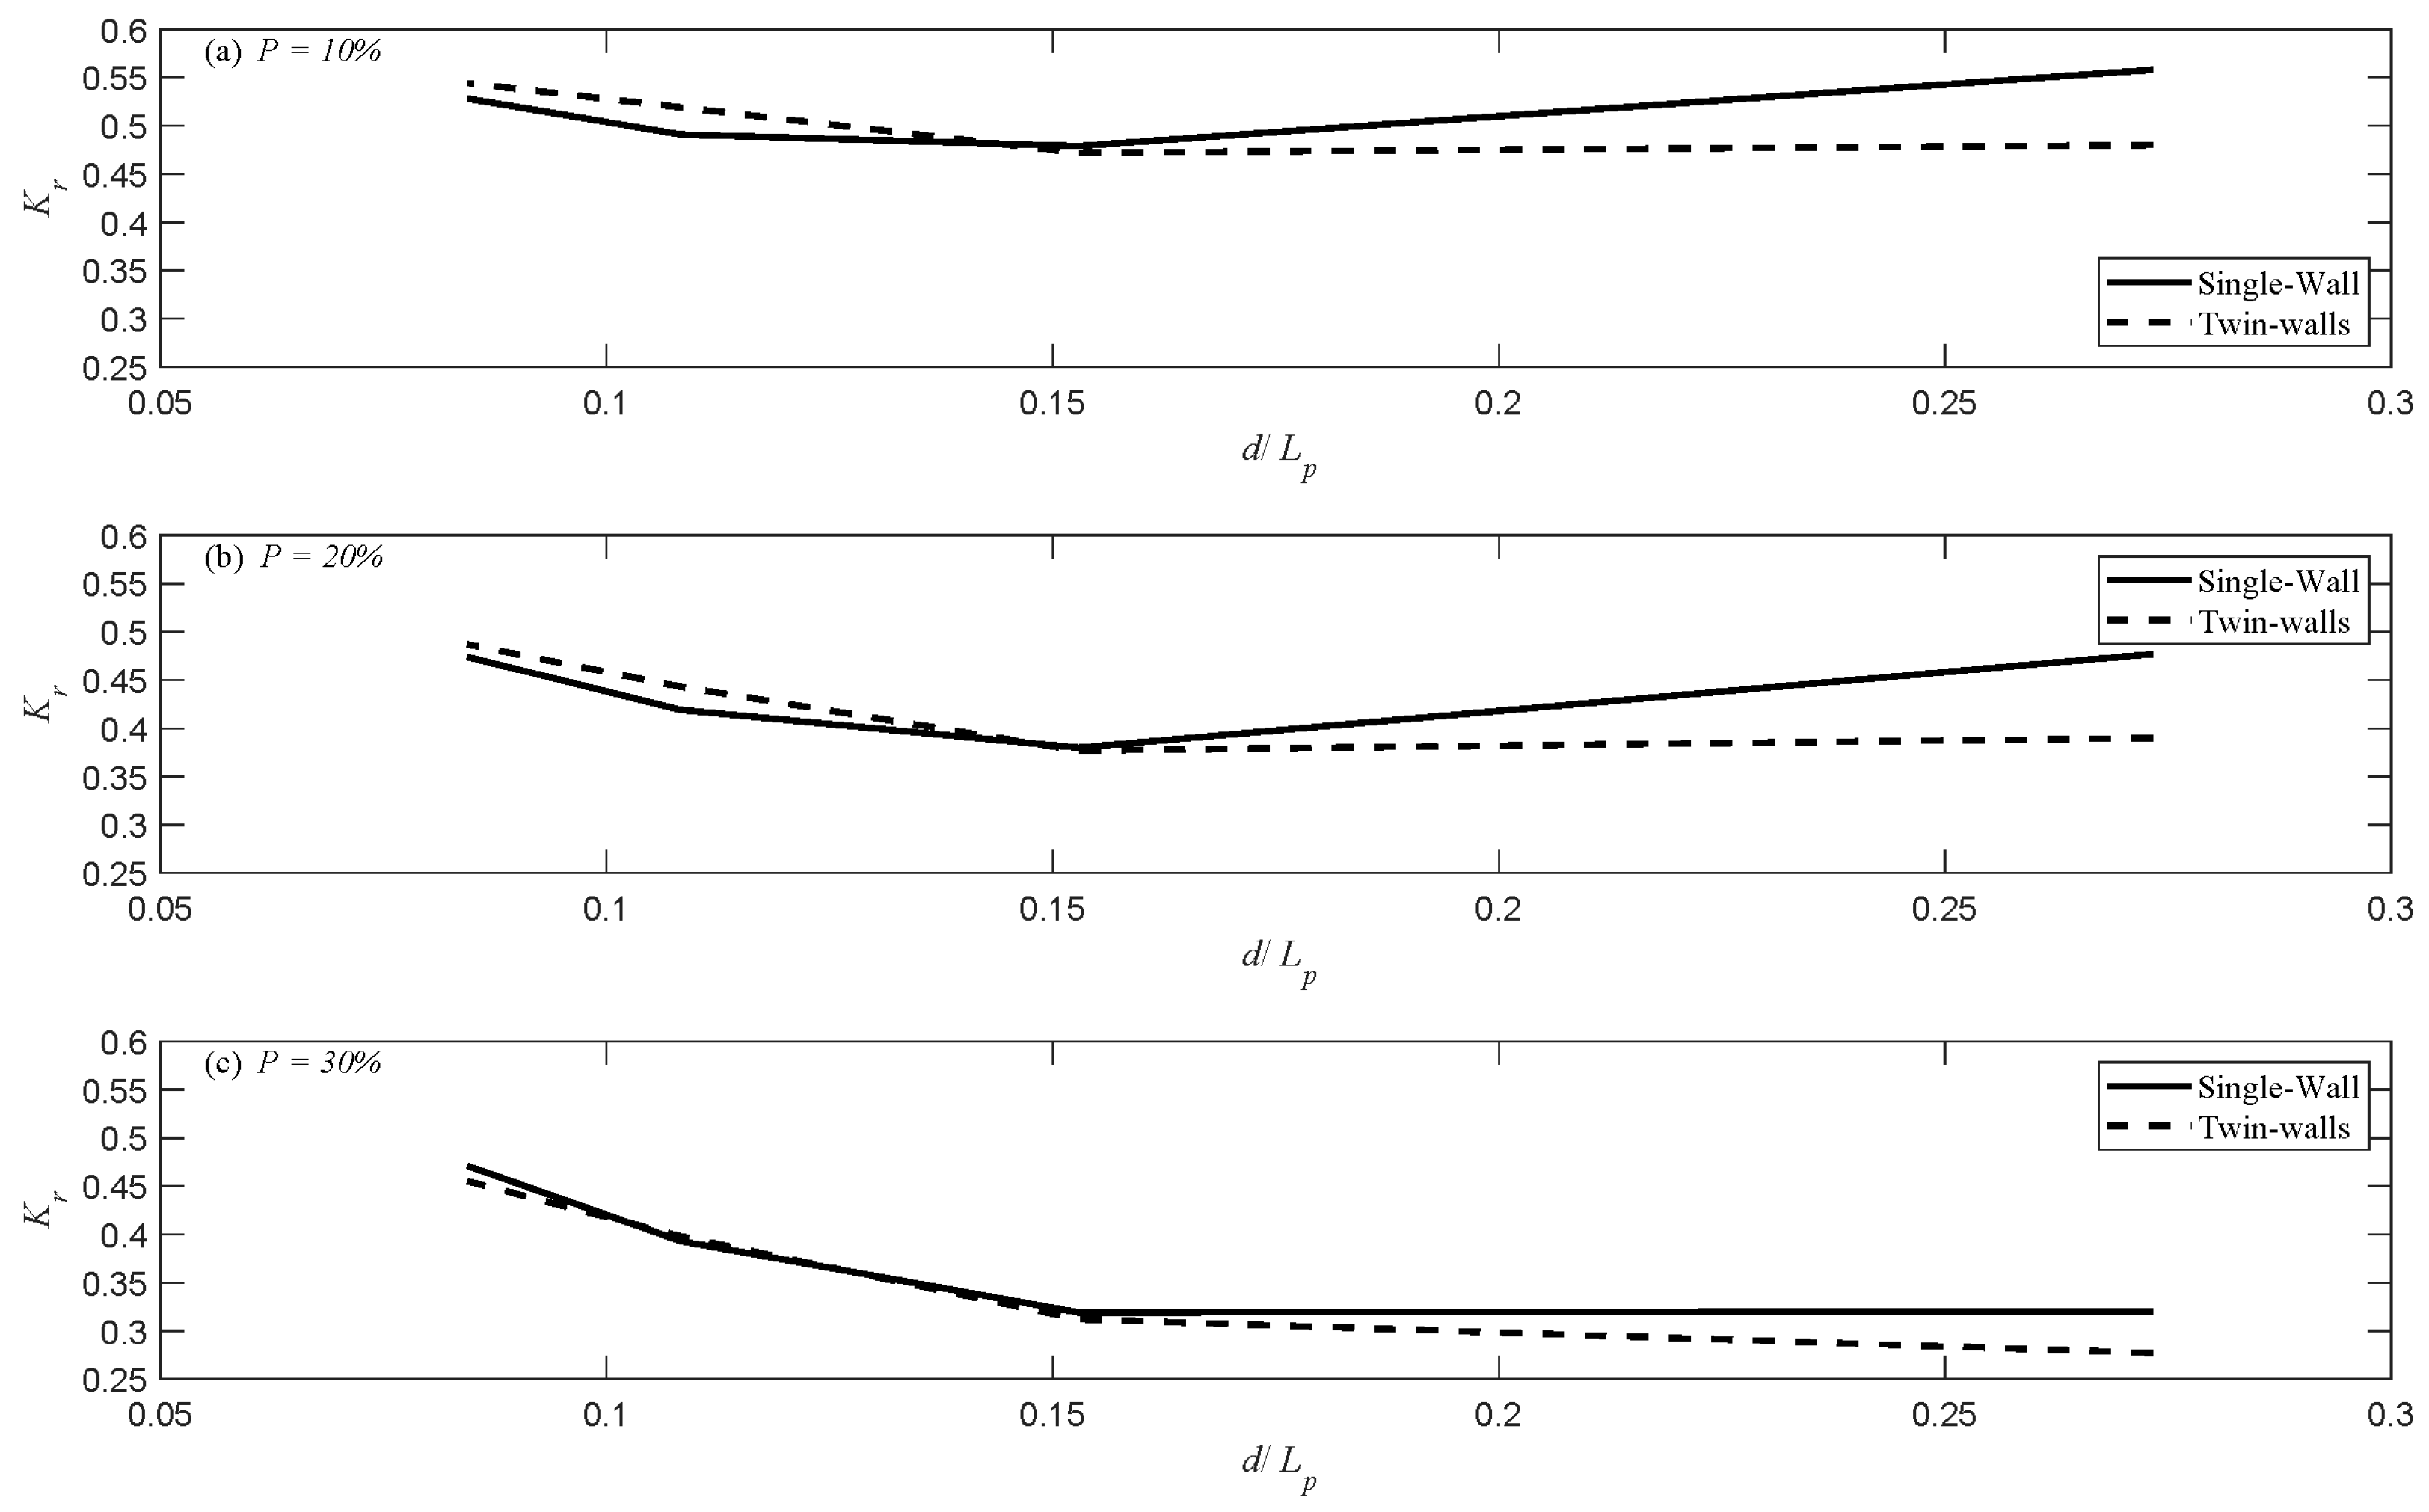
In terms of wave reflection, the results of the experiments showed that lower porosity increases the reflection coefficient. P = 10% always resulted in higher values of Kr, followed by P = 20% and P = 30%. Figure 11 shows an example (N = 1, θ = 90°, and His/d = 0.1284) of the effect of P on Kr. These results were anticipated since smaller wall porosity means greater wall area for wave reflection. The results showed a maximum increase in Kr by 40.5% for single-wall models and 47.6% for twin-wall models by decreasing P from 30% to 10%. Decreasing P from 20% to 10% resulted in a maximum increase of 27% in Kr for single-wall and twin-walls models. A maximum increase in Kr by 18.9% for single-wall models and 20% for twin-walls models observed when decreasing P from 30% to 20%. The highest average reduction in Kr due to increasing porosity, always occur when N = 2, regardless of wall slope.
3.3.2. Effect of Number of Walls
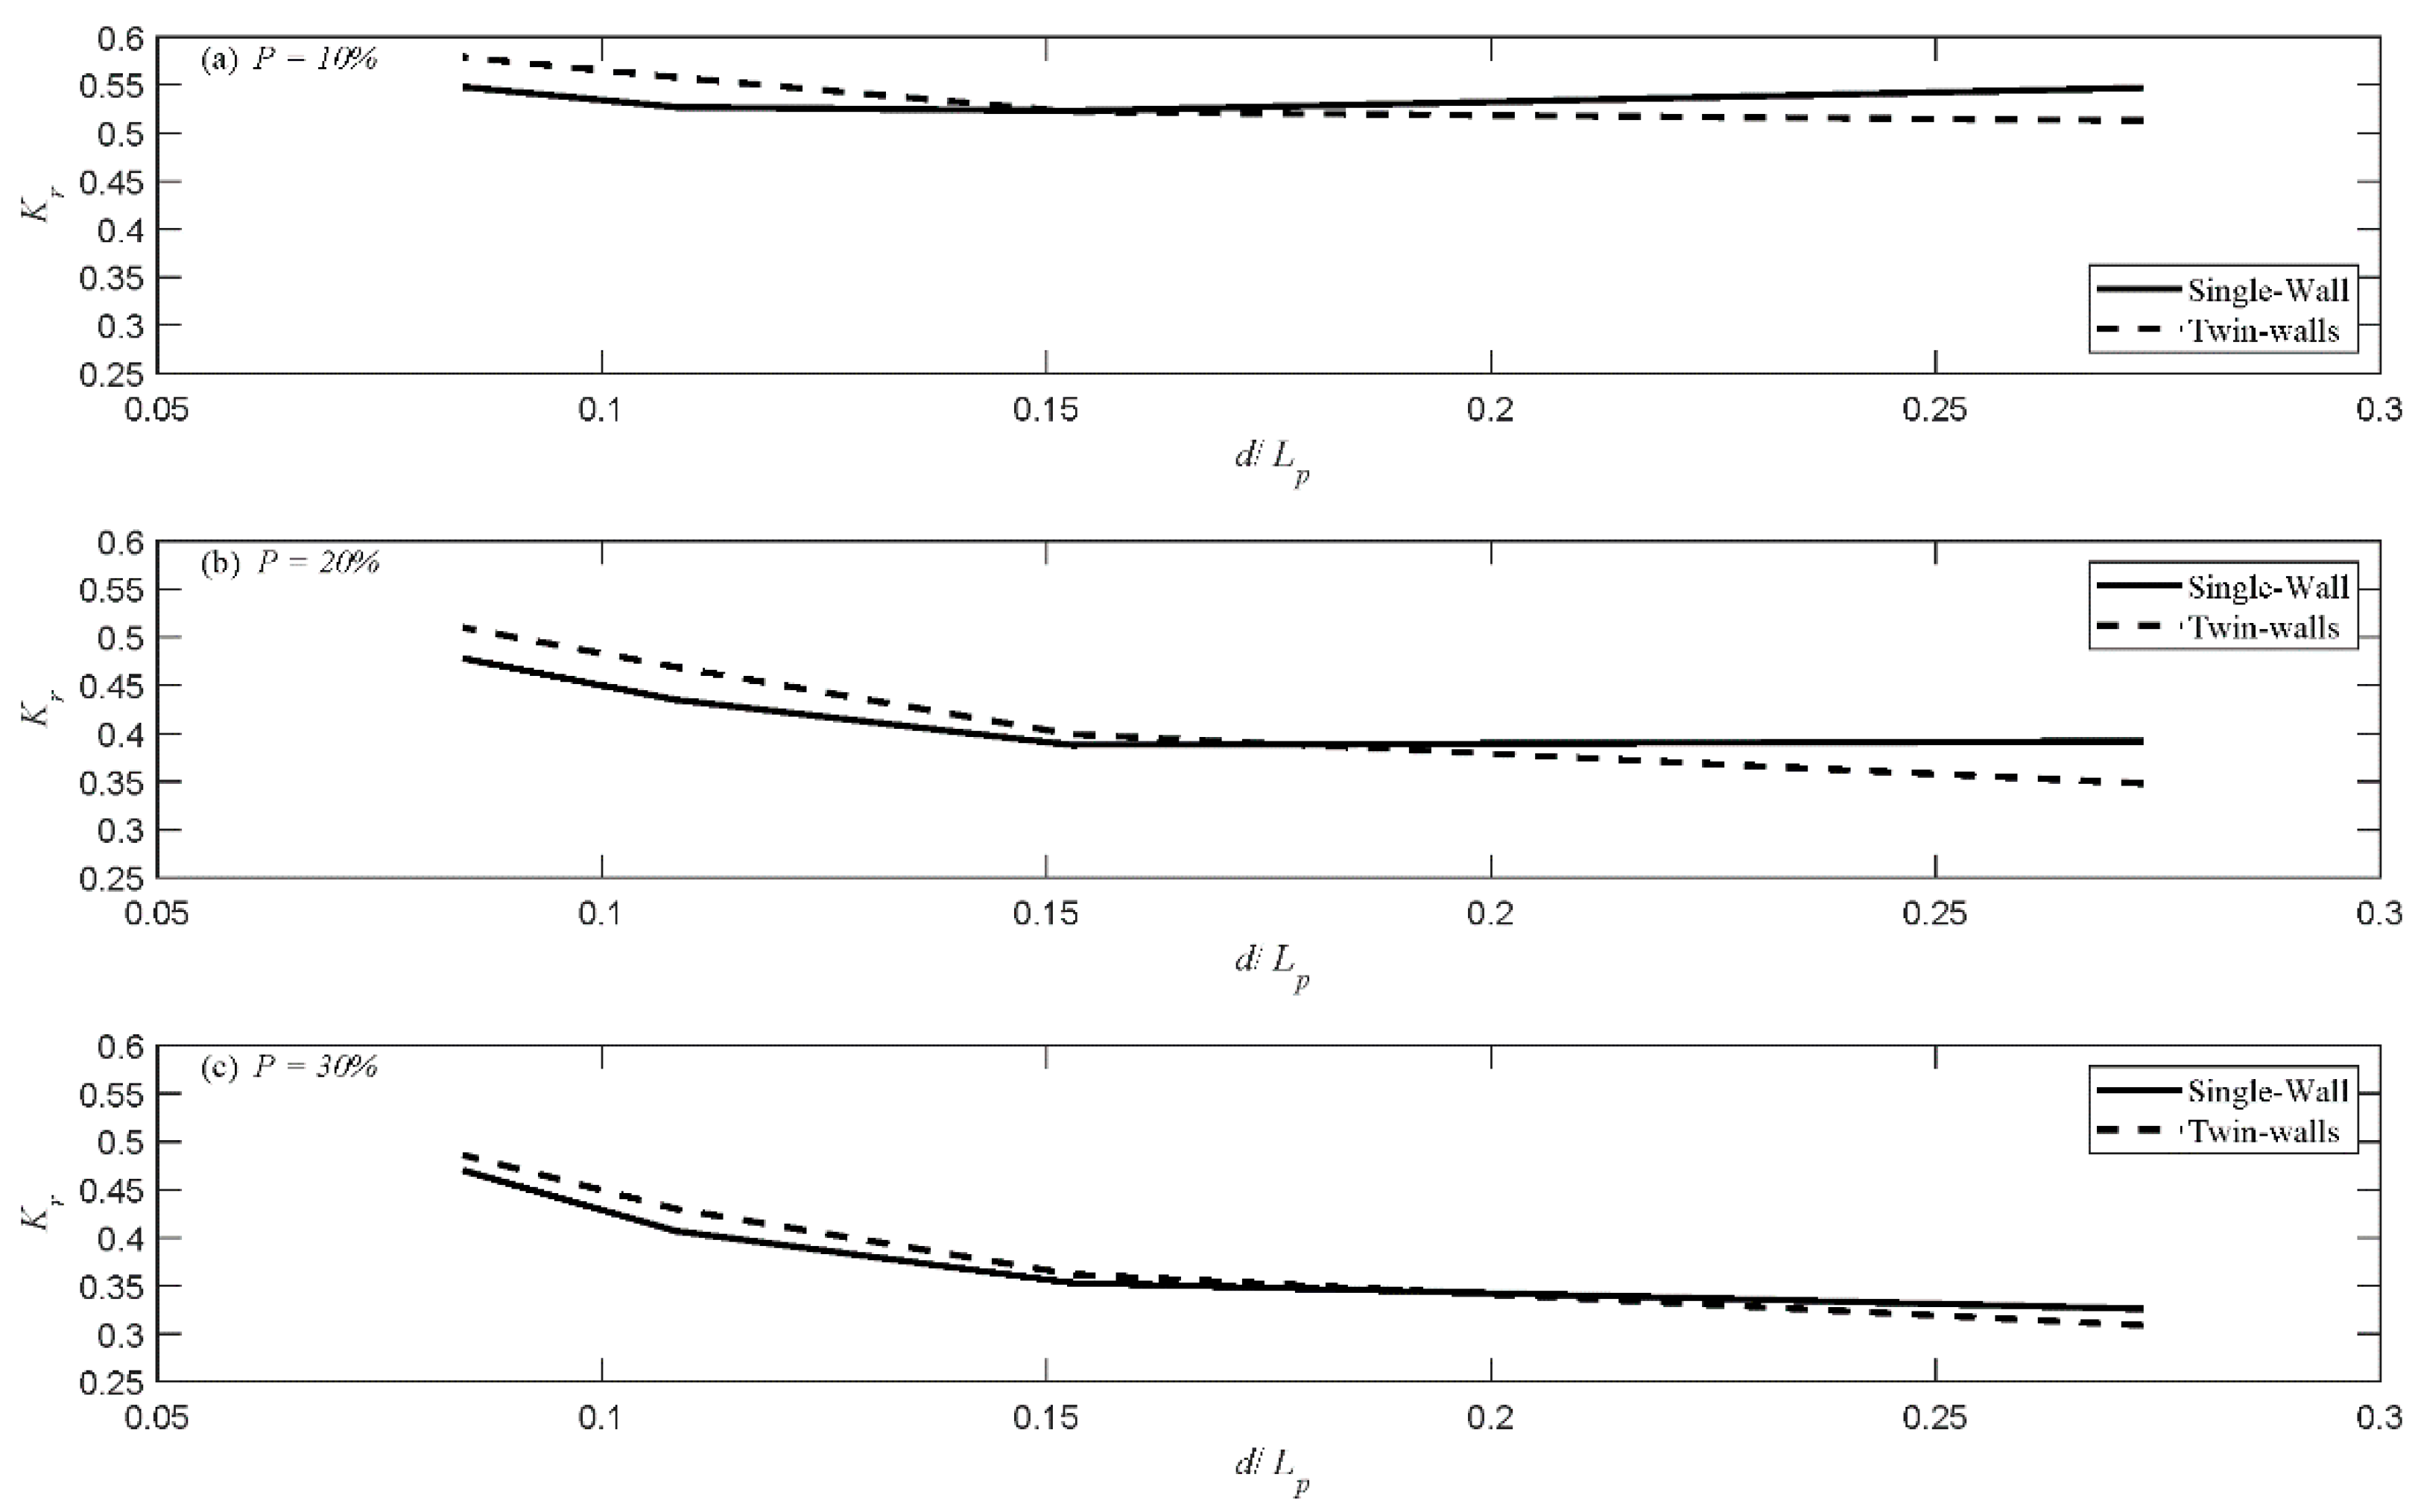
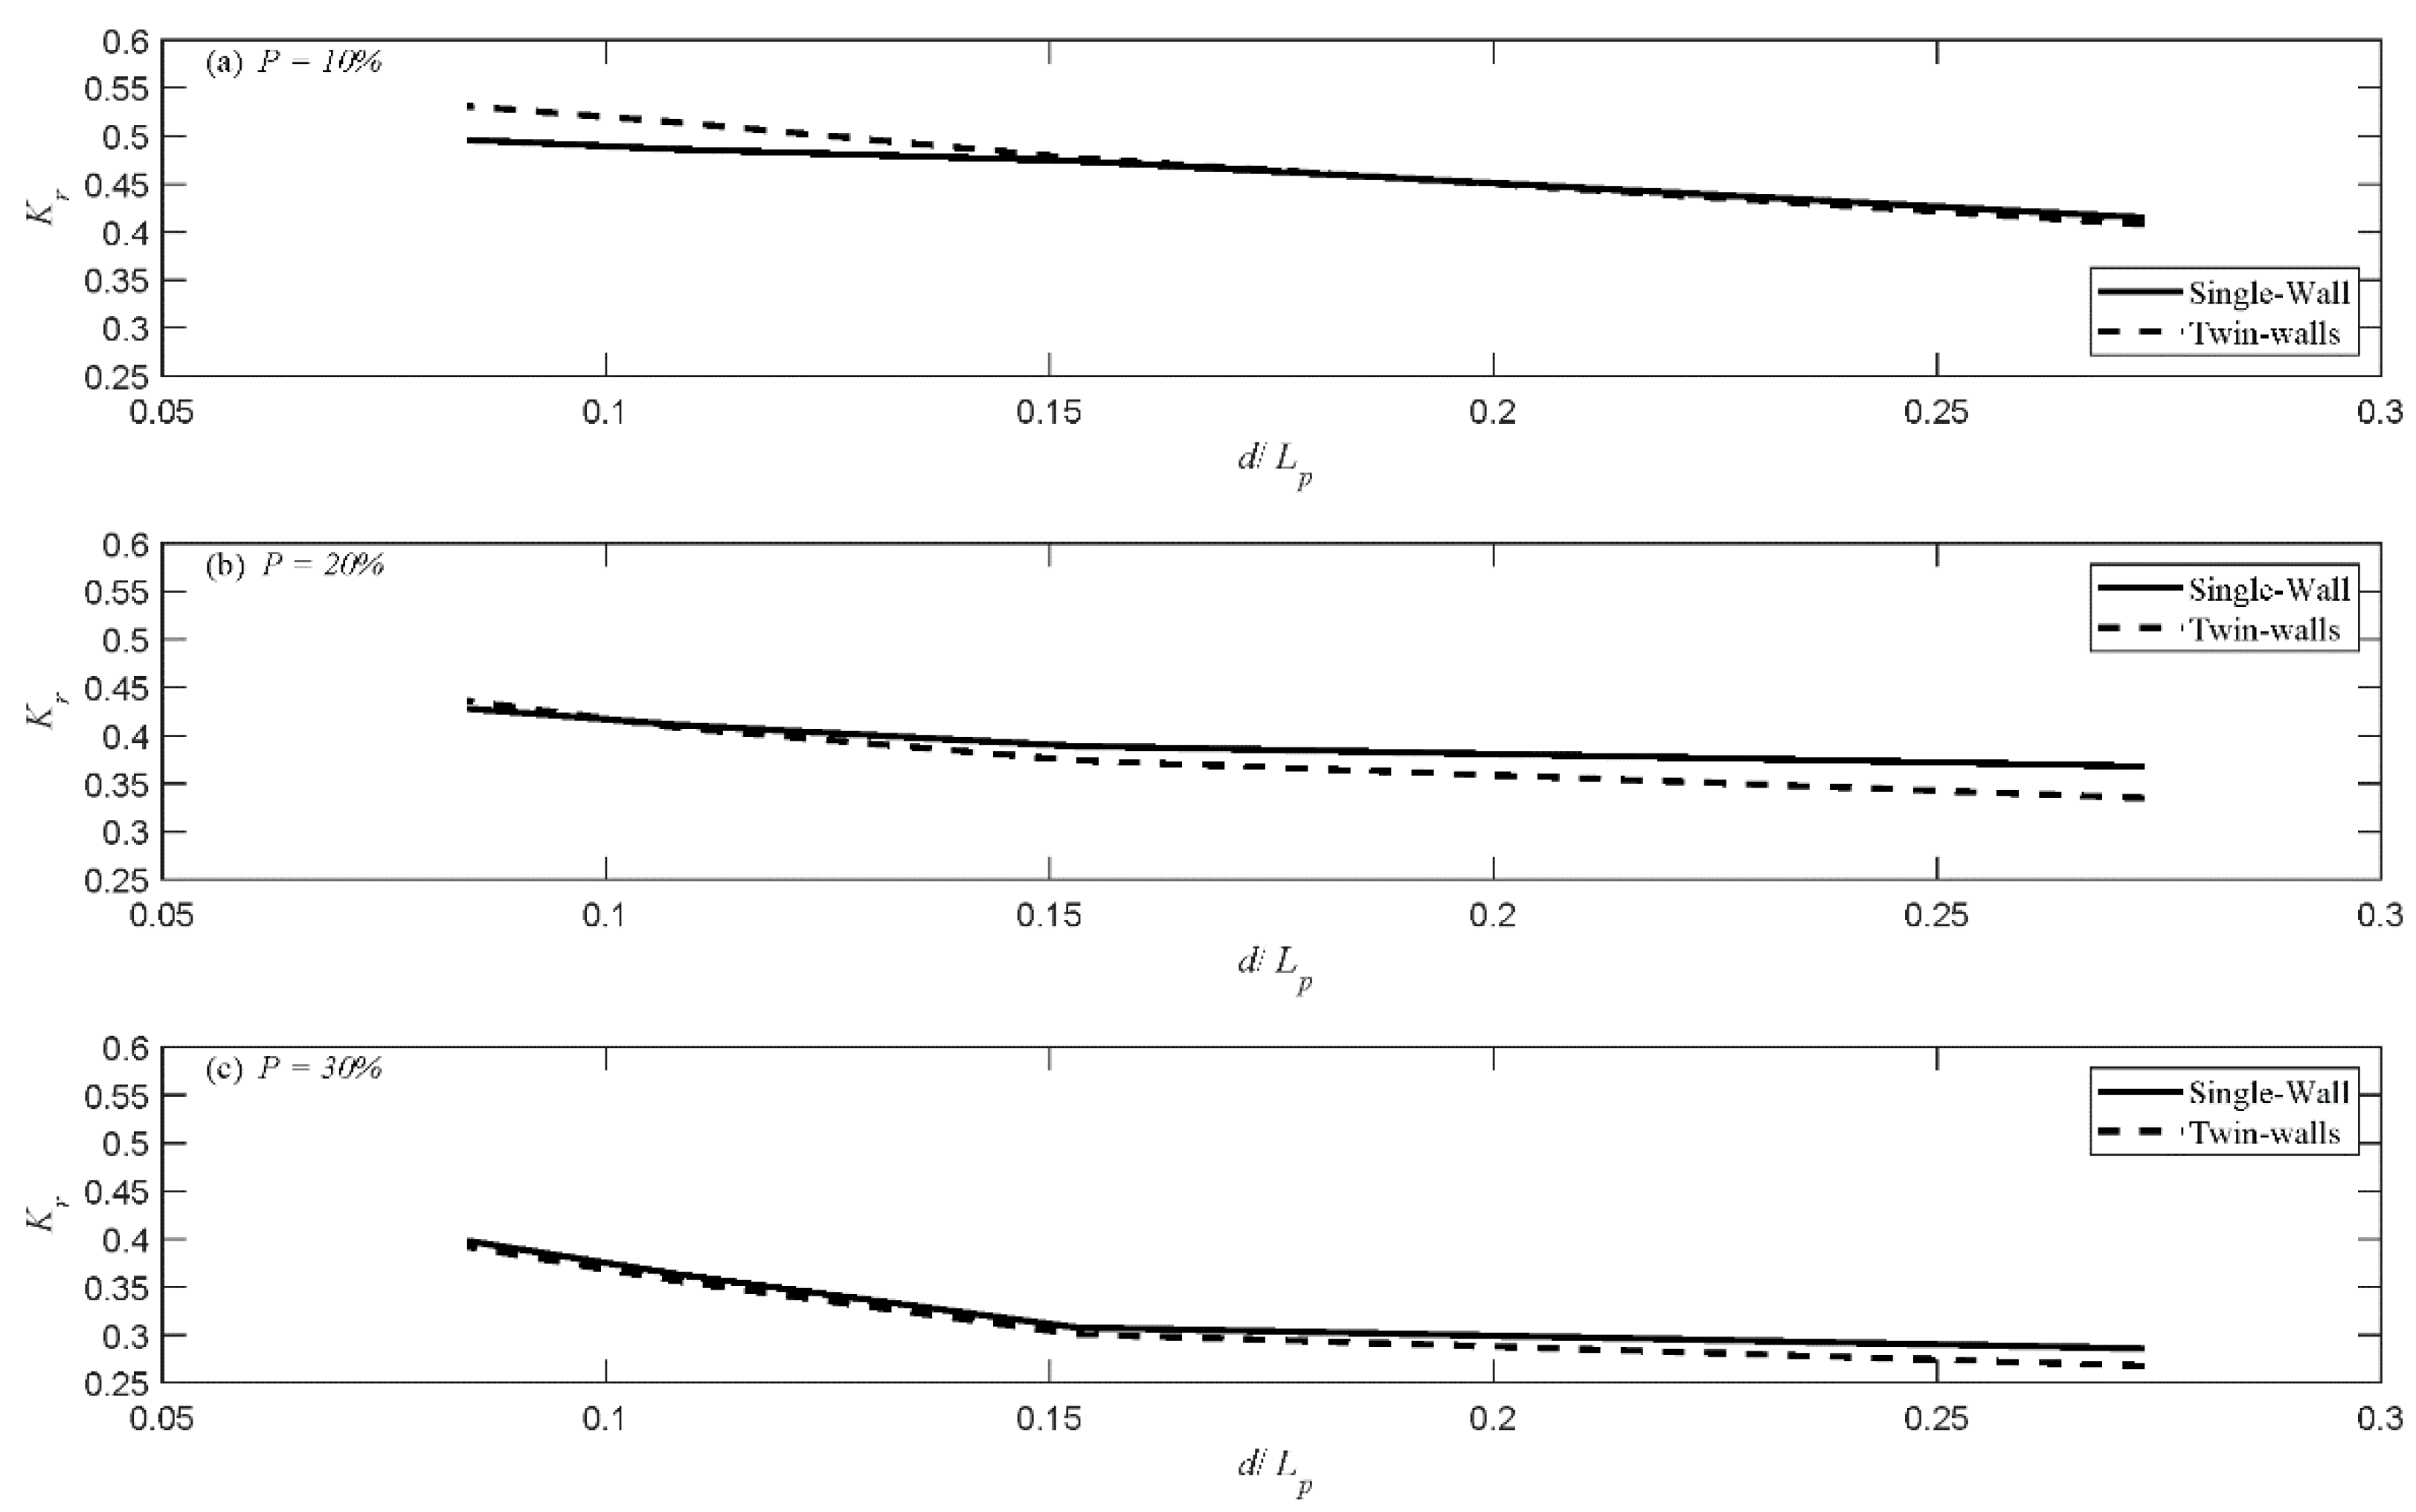
The variation of Kr with d/Lp for various structure porosities and slopes are shown in Figure 12, Figure 13 and Figure 14. The maximum reduction and increase in Kr due to the addition of a second wall are 18.24% and 7.82%, respectively (Table 6). The average decrease in due to the addition of the second wall was found to be highest for models with P = 20% and His/d = 0.1284. In six of the nine cases shown in Figure 12, Figure 13 and Figure 14, the addition of a second wall causes increase in Kr when d/Lp is less than 0.1529. Generally, there exists a range of changing points in d/Lp, where the performance of the models in terms of Kr varies. These changing points mostly occurred in the range of = 0.15–0.18. Prior to the changing point, models with twin walls resulted in higher reflection values than models with single walls, whereas the opposite was noticed after the changing point. The only exceptions to this rule were models with P = 20% and 30% and θ = 30°, where single-wall always resulted in higher Kr values. This indicates the low impact of number of walls on against .
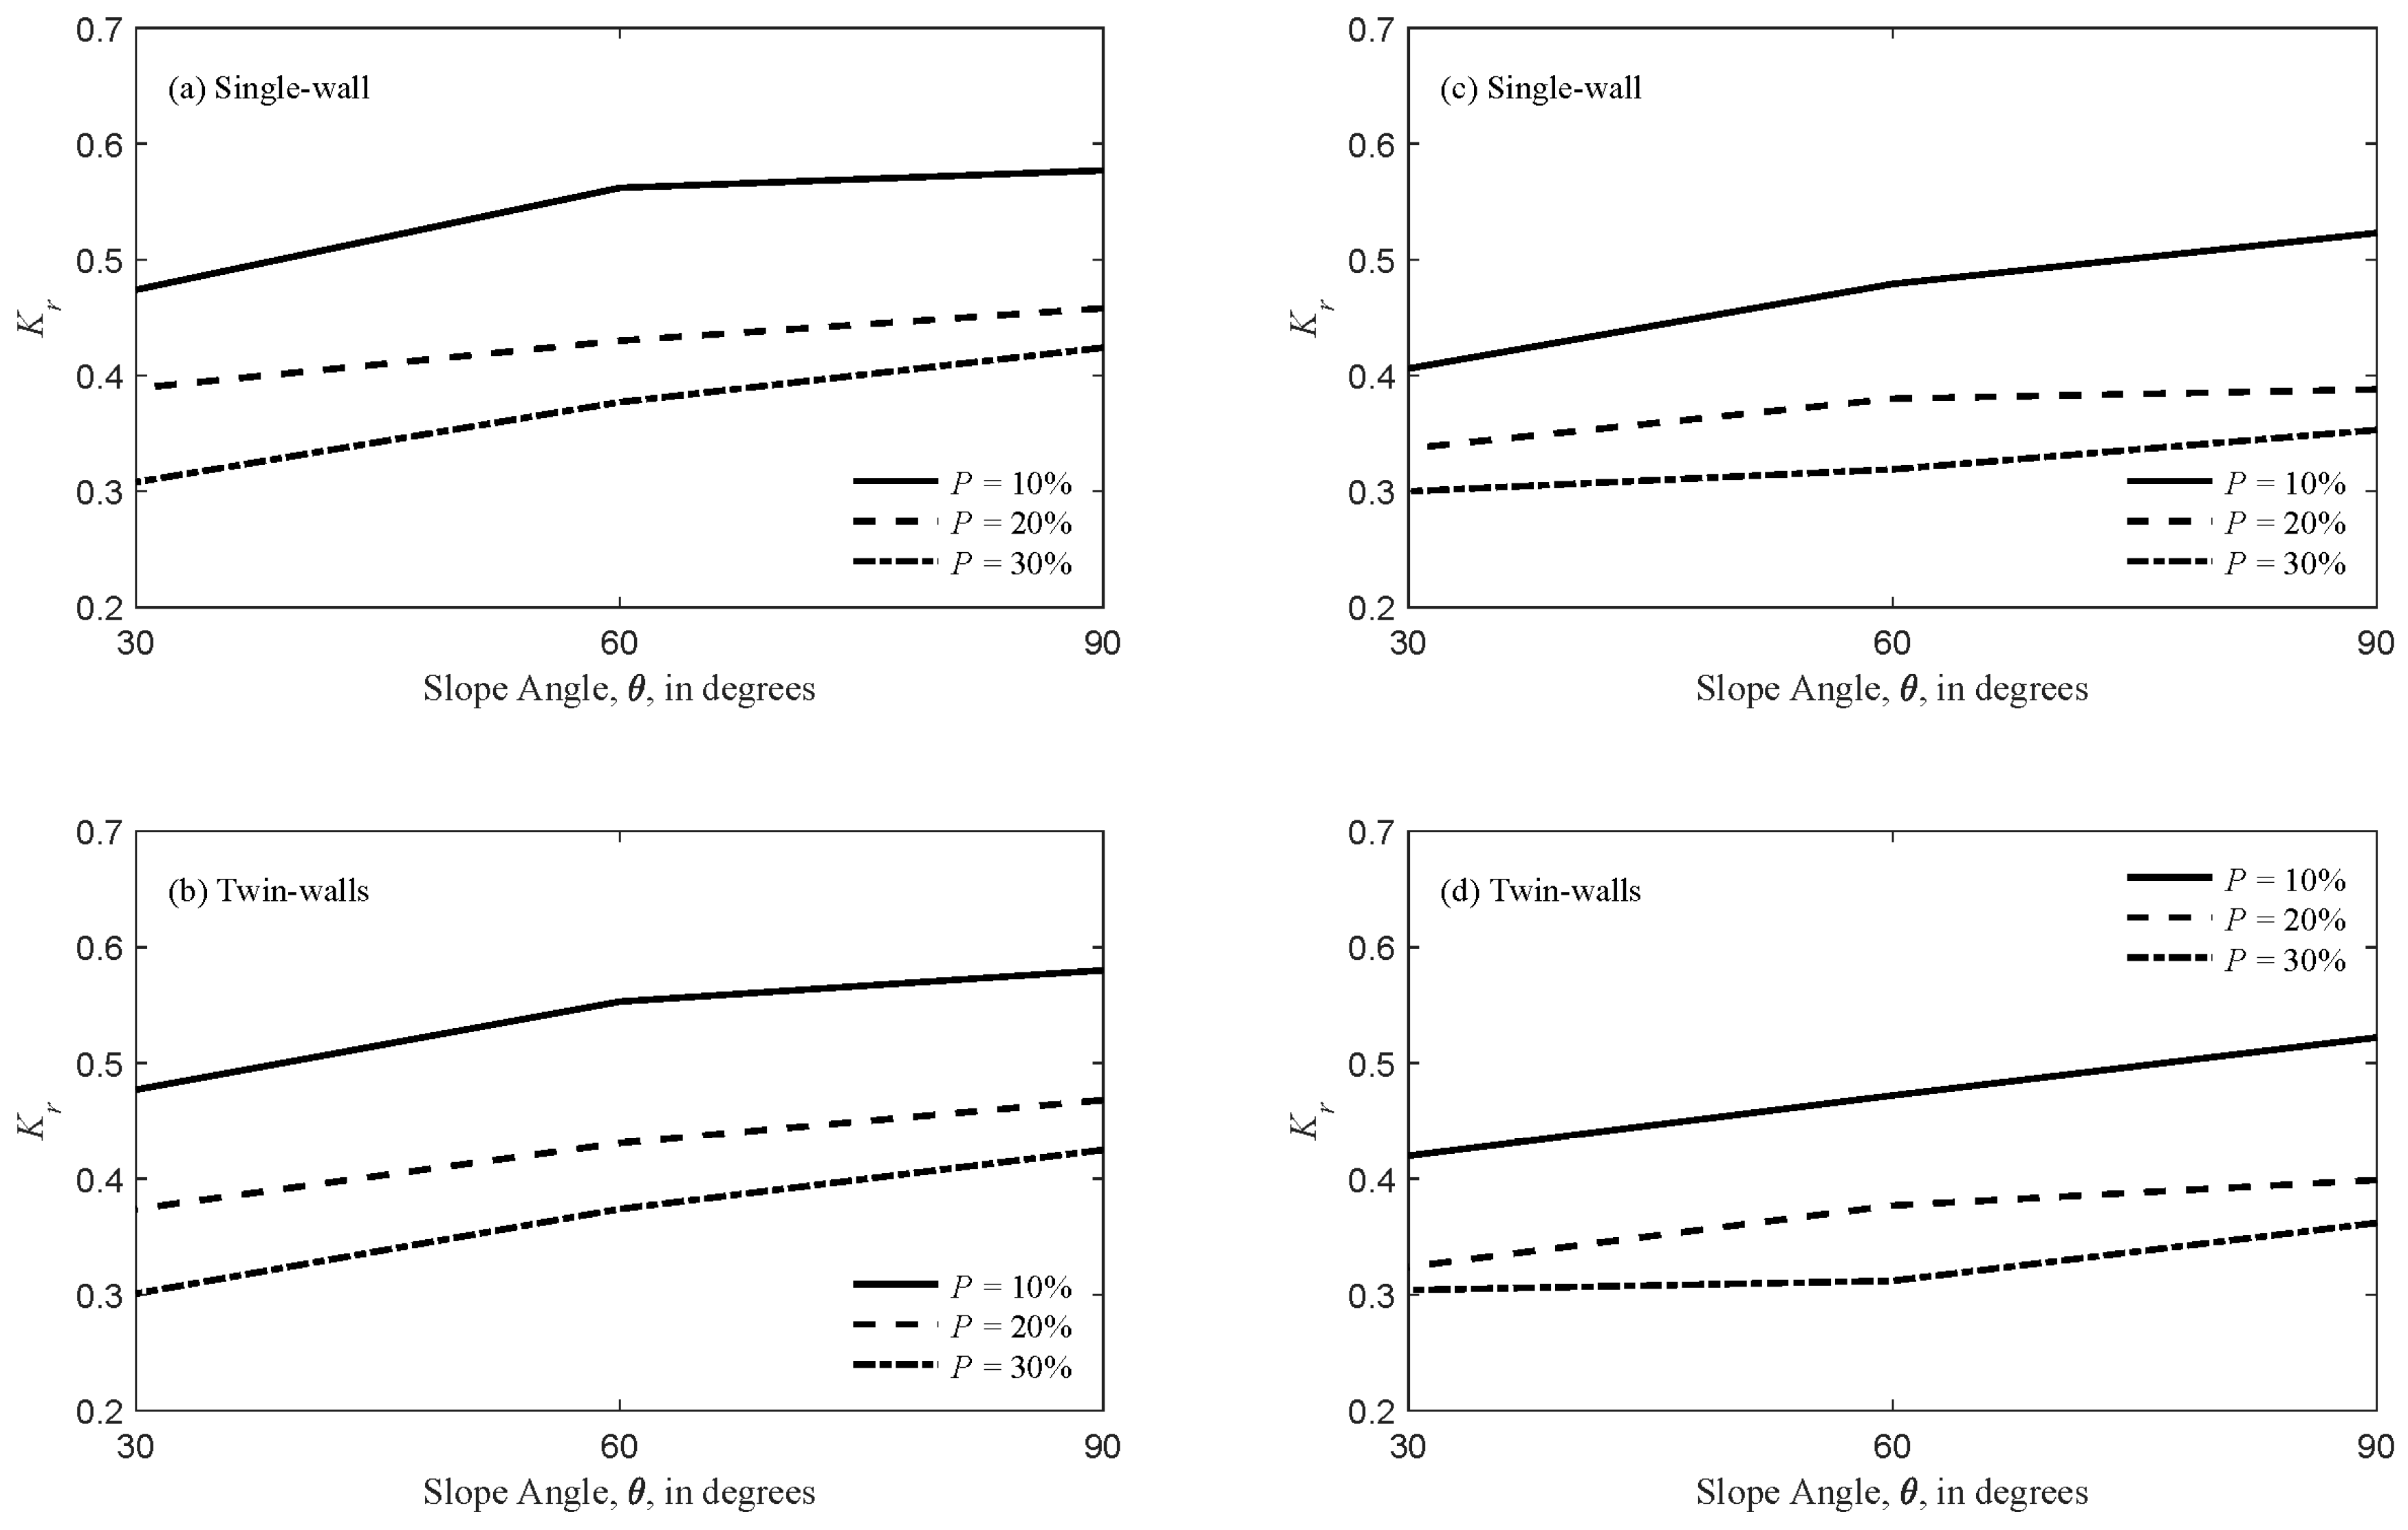
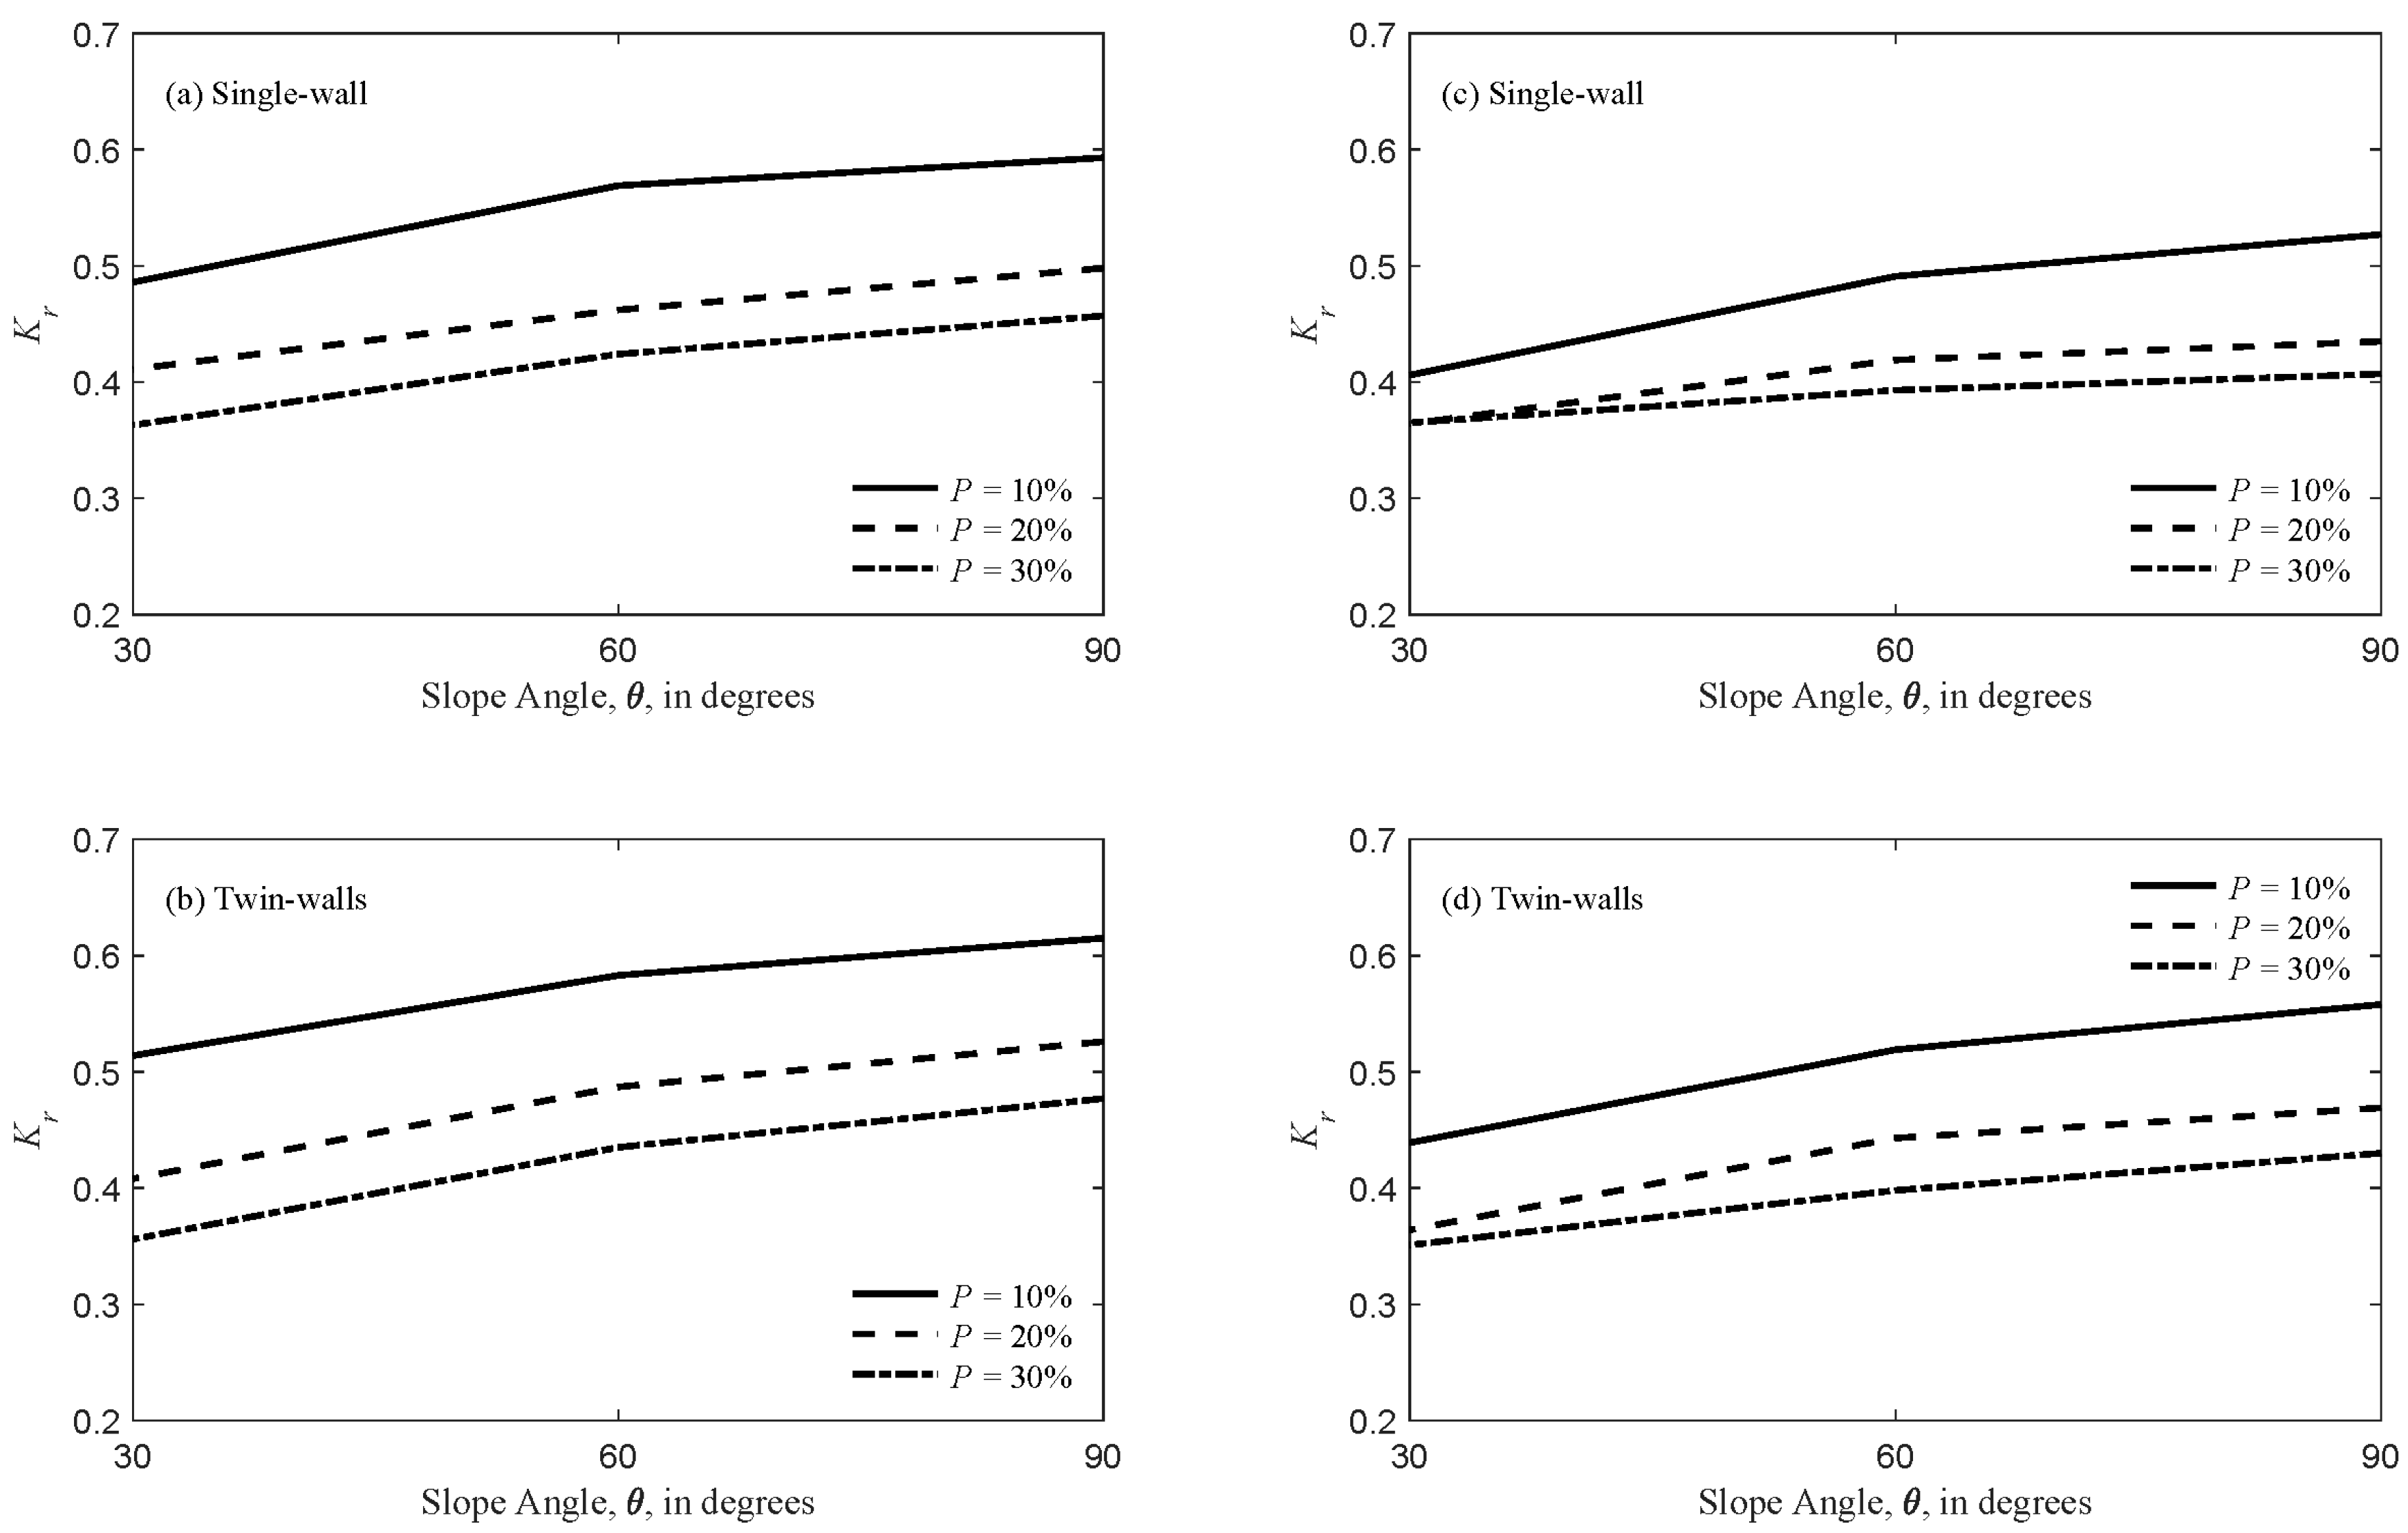
3.3.3. Effect of Slope Angle
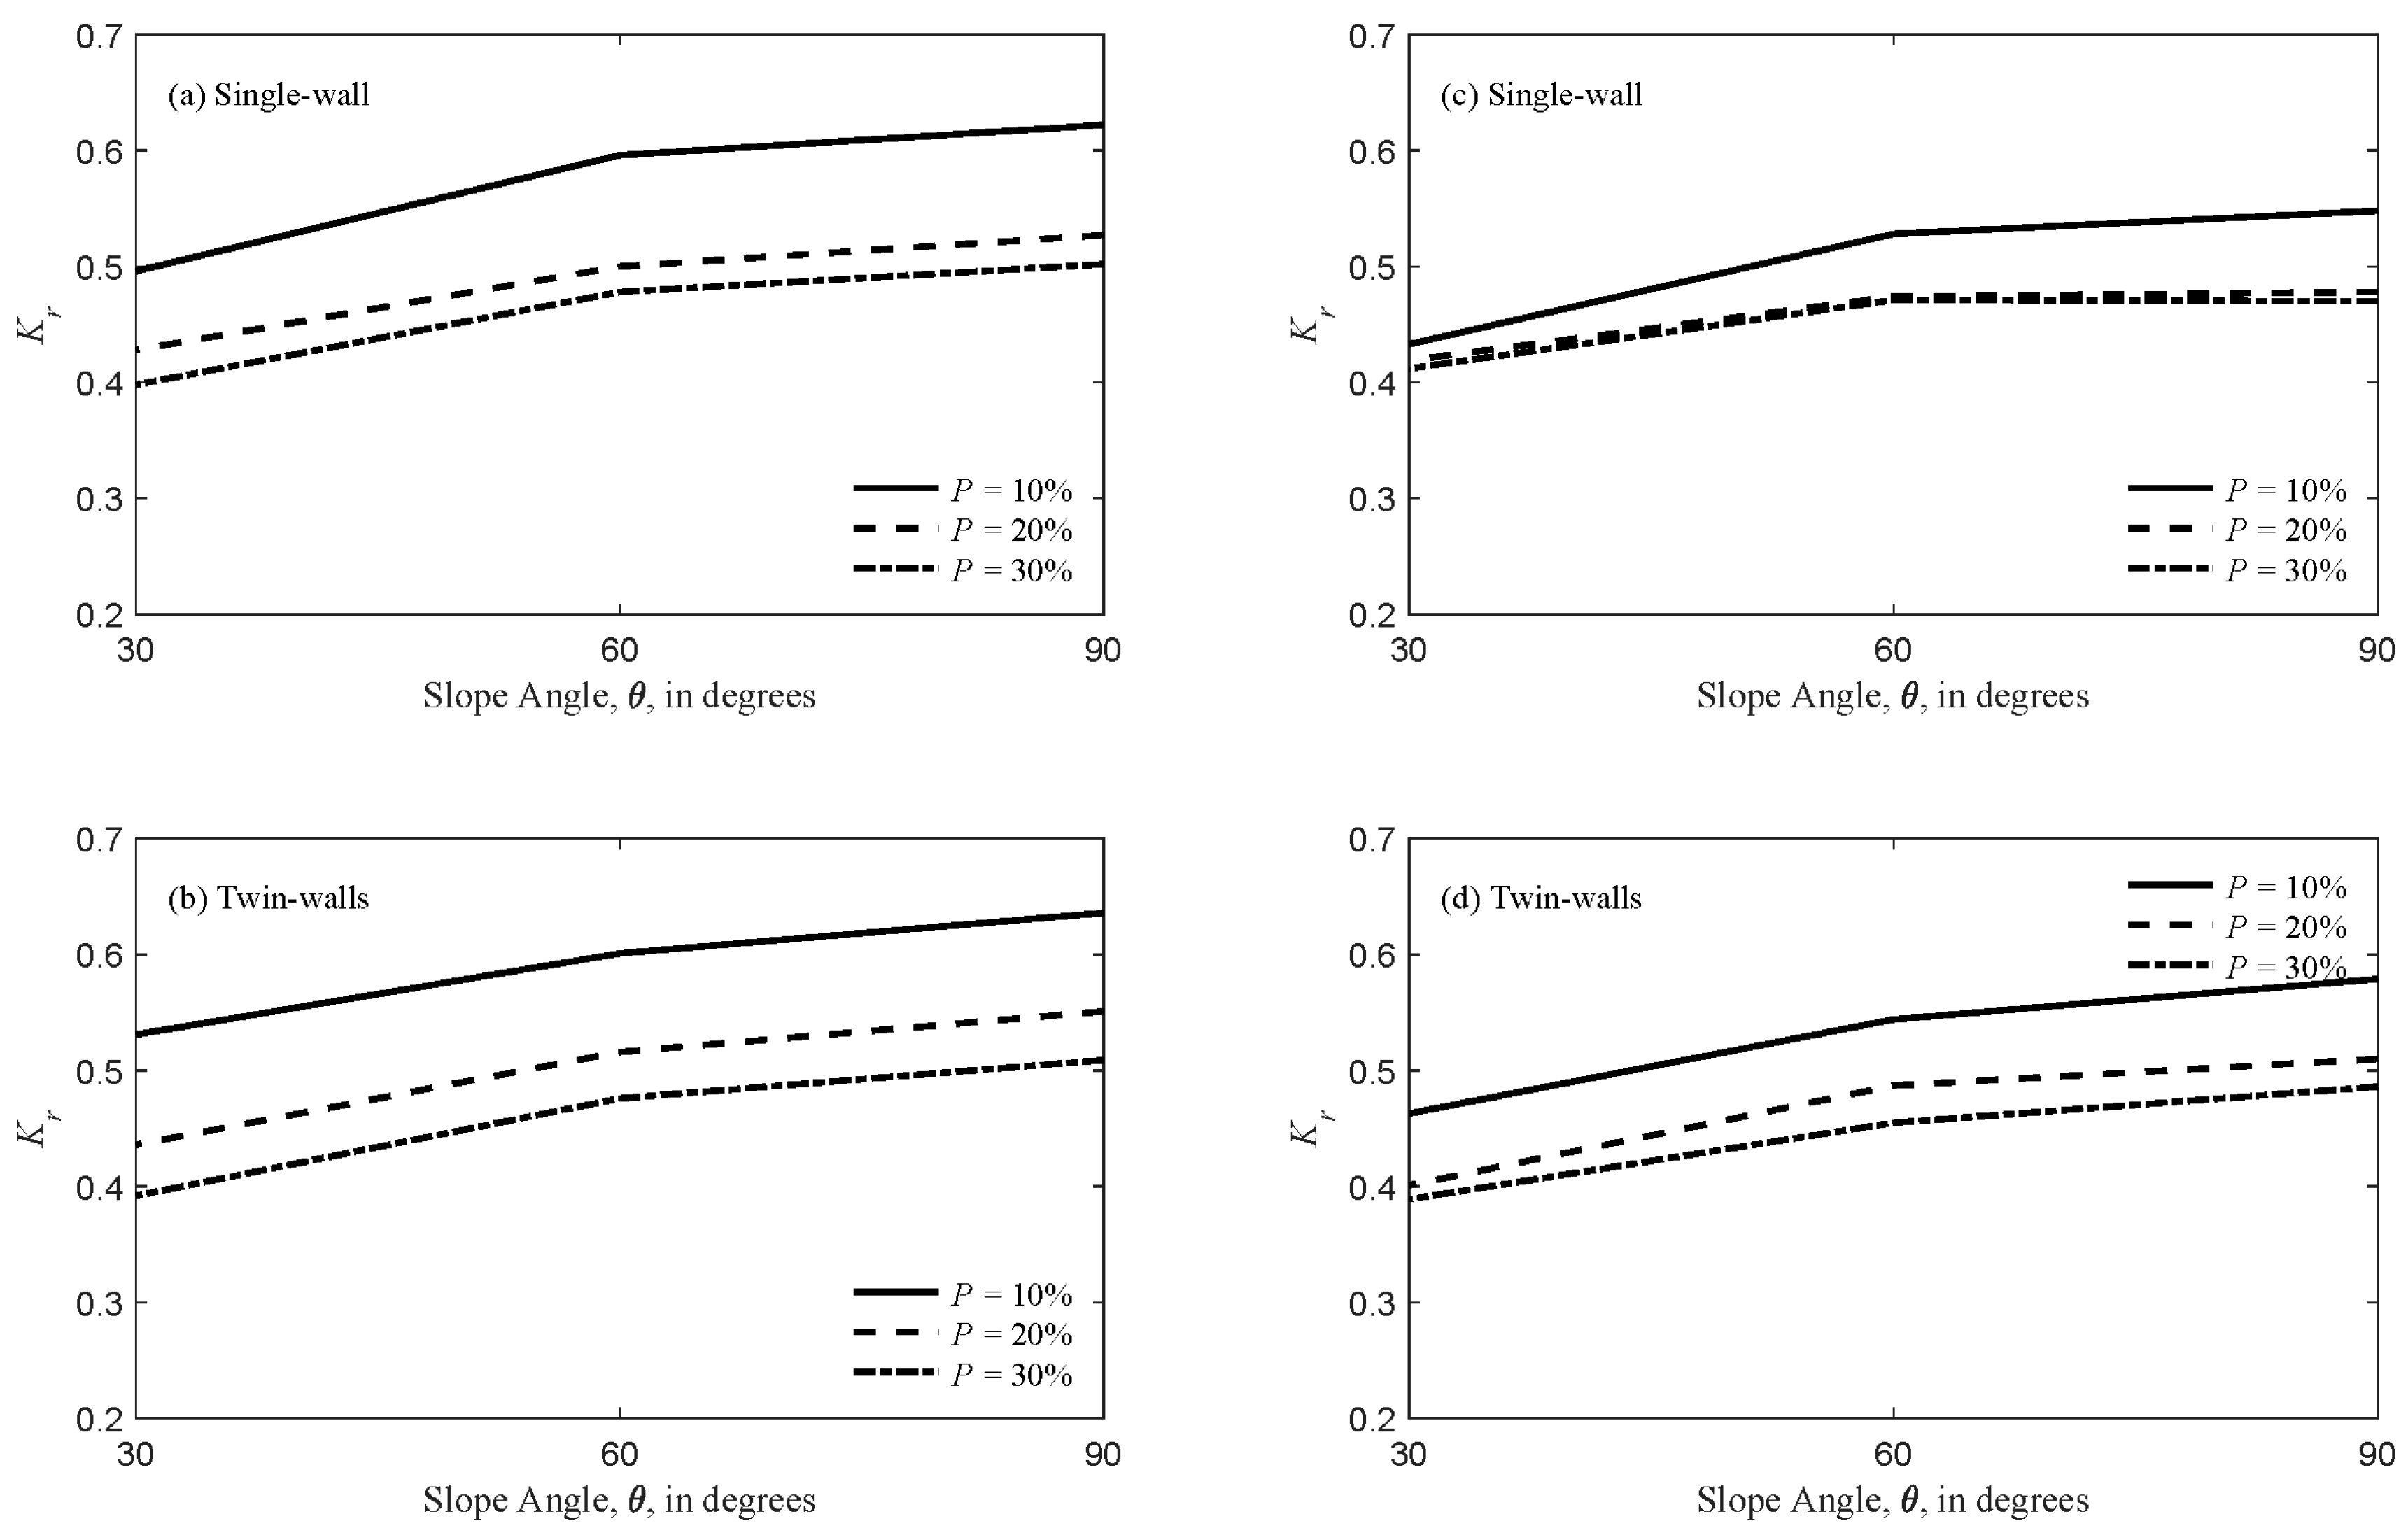
Figure 15, Figure 16, Figure 17 and Figure 18 show the effect of the wall slope on Kr of for different porosities and wall configurations. Decreasing θ from 60° to 30° for models with single-wall, reduced Kr more than three times than decreasing θ from 90° to 60° (a maximum of 24.7% reduction versus a maximum of 7.9% reduction, respectively). Similarly, lowering θ from 60° to 30° for models with twin-walls, reduced Kr by a maximum of 24.2%, while decreasing θ from 90° to 60° reduce Kr by a maximum of 10.6%.
Decreasing θ from 90° to 30° reduces Kr by a maximum of 30.83% for models with single-wall and a maximum of 29.20% for models with twin walls. In most cases, walls with θ = 90° produced the highest Kr values, and walls with θ = 30° produced the lowest Kr values. The reduction in Kr as the slope angle decreases is justified by knowing that the higher the wall slope, the lesser the interaction between the wall and the waves. However, for some models with His/d = 0.1284, d/Lp = 0.2733, and P = 20% (Figure 15c,d), Kr values for θ = 60° were higher than those for θ = 90°. For the models and wave conditions of Figure 15c,d, Kr at θ = 90° and θ = 30° were nearly the same when P = 30%.
3.3.4. Effect of His/d
In most cases, waves approaching with His/d = 0.2493 resulted in higher Kr values than waves with His/d = 0.1284 (Figure 19, Figure 20 and Figure 21), agreeing with previous studies. The highest average increase in Kr due to increasing His/d from 0.1284 to 0.2493 was 15.5%, while the lowest was 3.7%. The relationship between His/d and the other parameters, namely porosity, number of walls, and slope angle was unclear.
3.3.5. Effect of d/Lp
In general, Kr decreases as d/Lp increases (Figure 19, Figure 20 and Figure 21). As shown in the figures above, the decrease in Kr is higher when d/Lp is in the range between 0.0844–0.1529, and when P is between 20% and 30%. For d/Lp ≥ 0.1529, Kr is minimally affected by d/Lp in ten out of eighteen cases shown in Figure 19, Figure 20 and Figure 21. In two cases (Figure 19b and Figure 20b), an increase in Kr when > 0.1529 was noticed. On average, the effect of d/Lp on Kr was minimum when P = 10%.
3.4. Wave Energy Dissipation Coefficient, Kl
3.4.1. Effect of Porosity
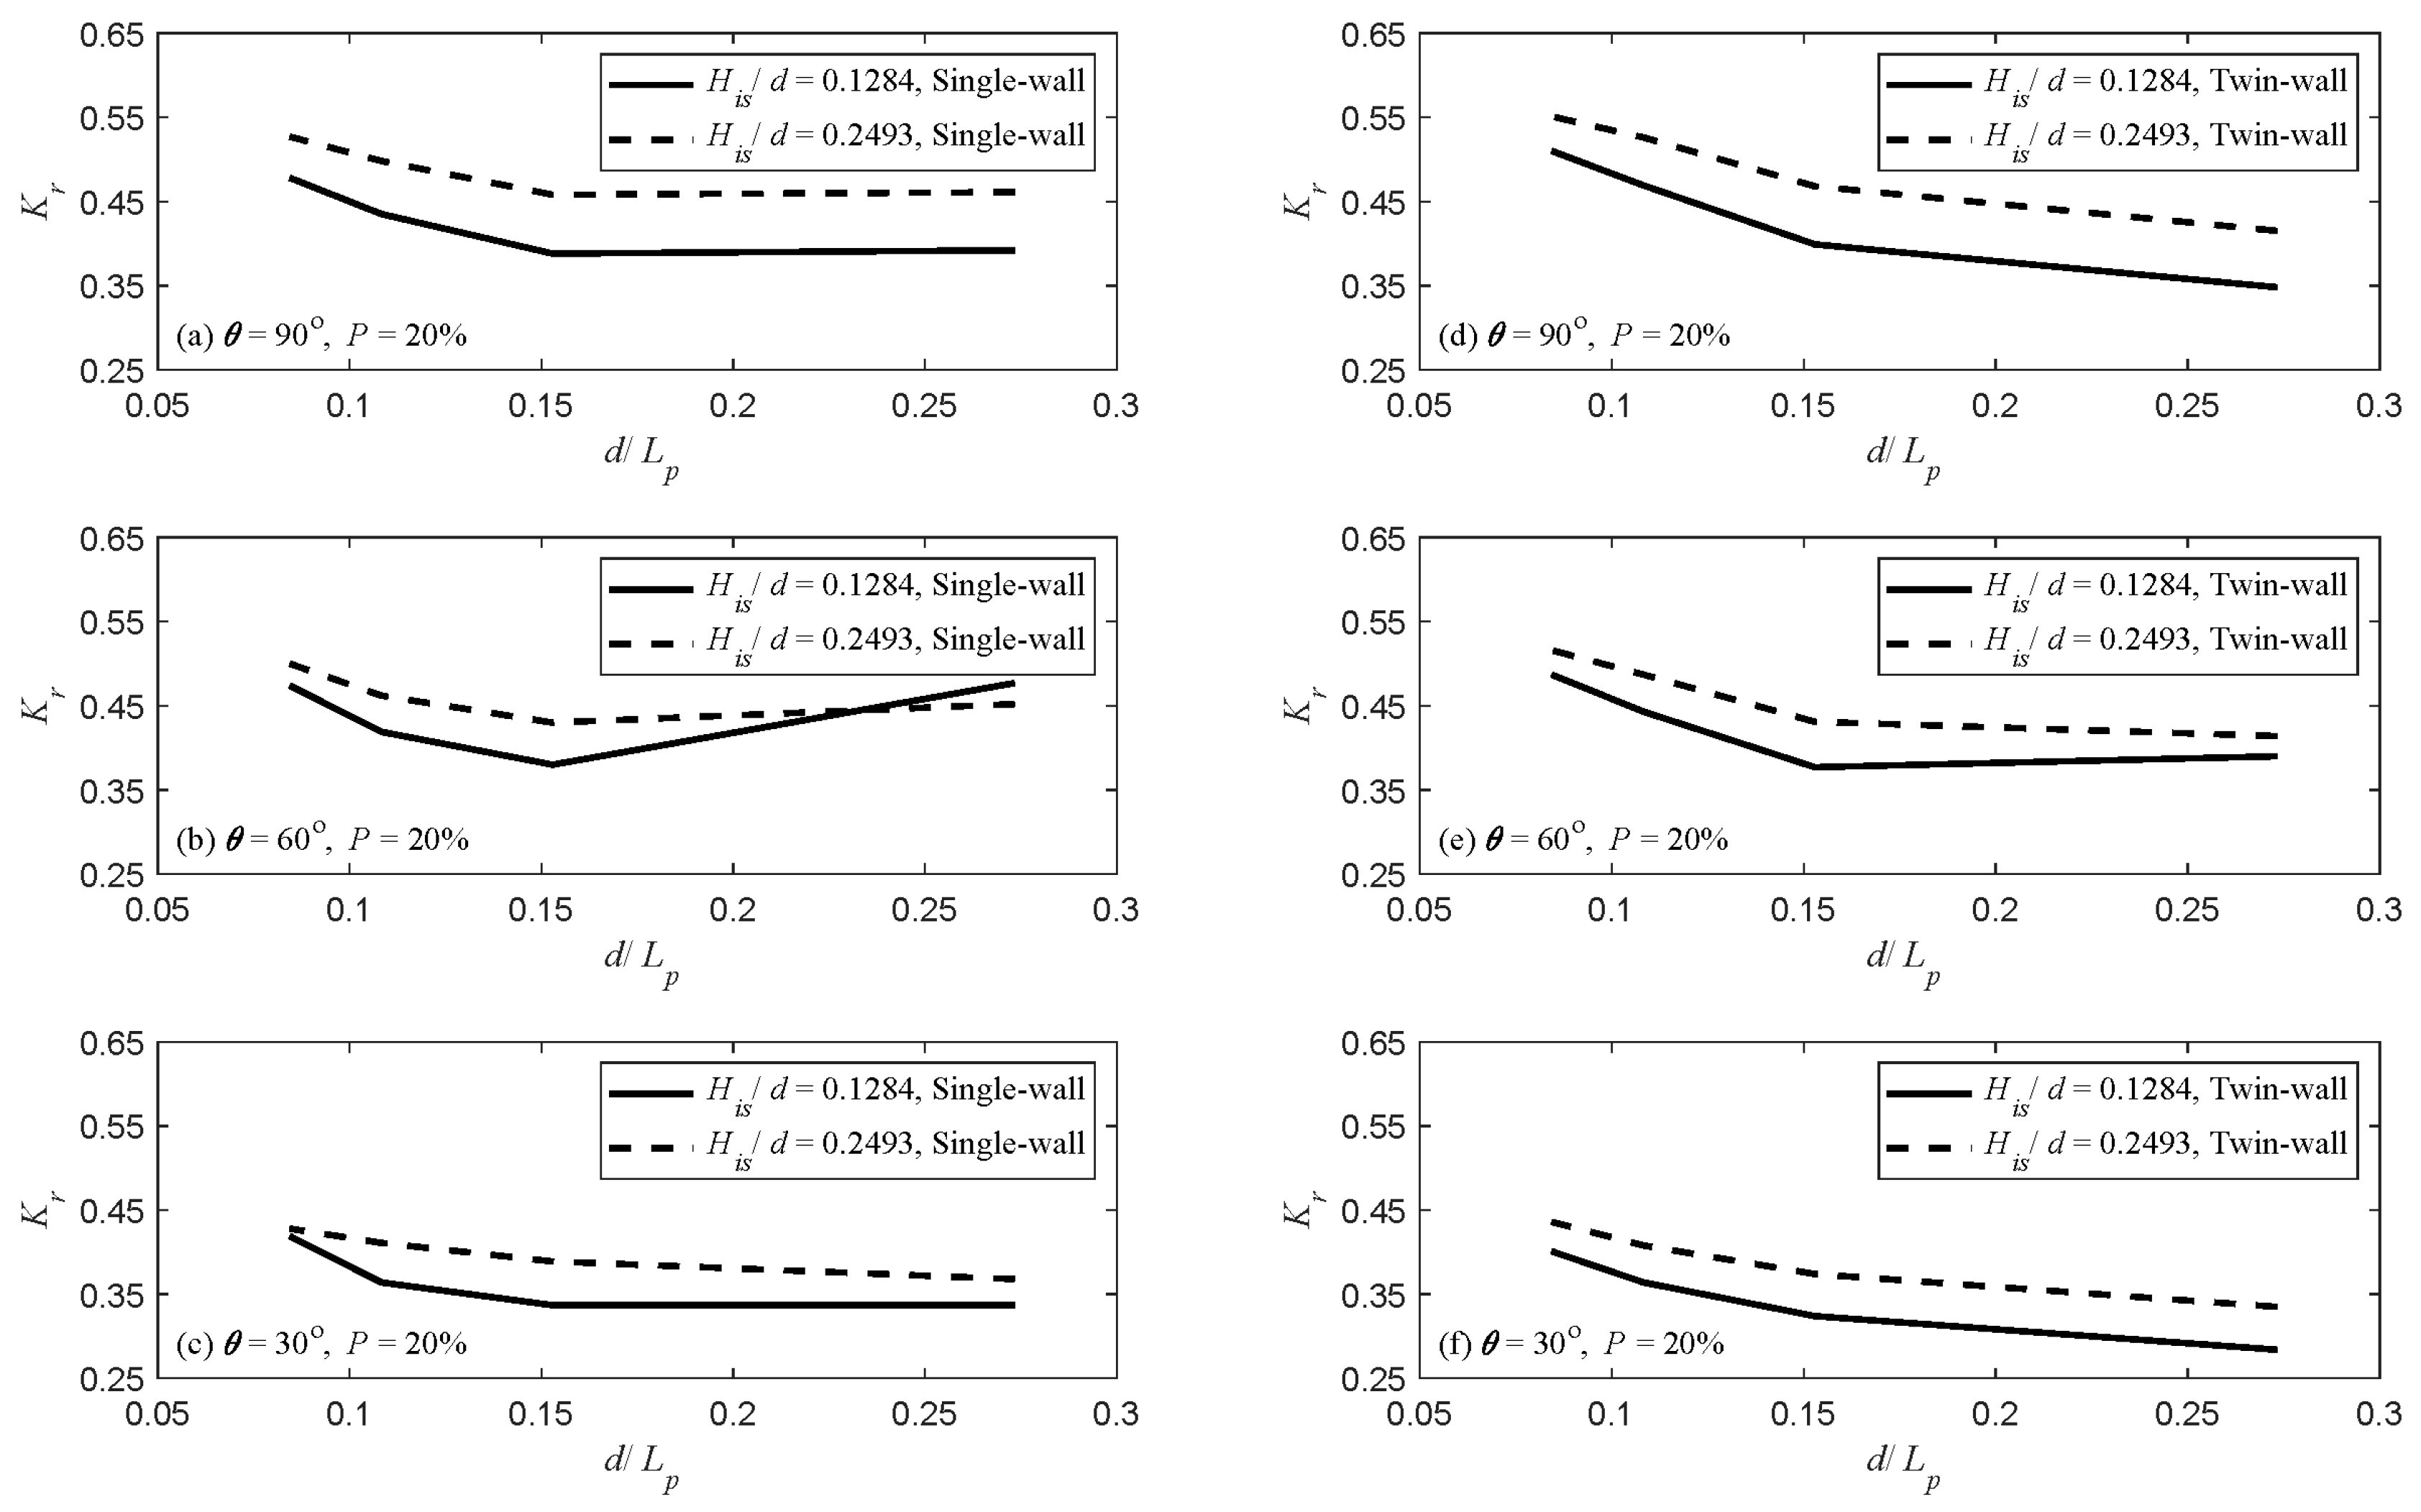
An example of the impact of P on Kl is shown in Figure 22. For waves approaching with His/d = 0.1284, models with P = 10% resulted in the highest Kl values, whereas for waves with His/d = 0.2493, the highest Kl values were obtained when P = 20%. In both cases, however, the lowest Kl values were obtained when P = 30%, as expected. The higher the wall porosity, the more wave energy goes through the wall.
Decreasing P from 30% to 10% was more effective in increasing Kl for models with single walls than models with twin walls (up to a 23.7% increase for single-wall versus 13.3% increase for twin-walls). An increase by a maximum of 15% in Kl observed for models with single walls as P decreased from 20% to 10% and from 30% to 20%. For twin-wall models, decreasing P from 20% to 10% increased Kl by less than 5%, while decreasing P from 30% to 20% reduced Kl by up to 11.4%.
3.4.2. Effect of Number of Walls
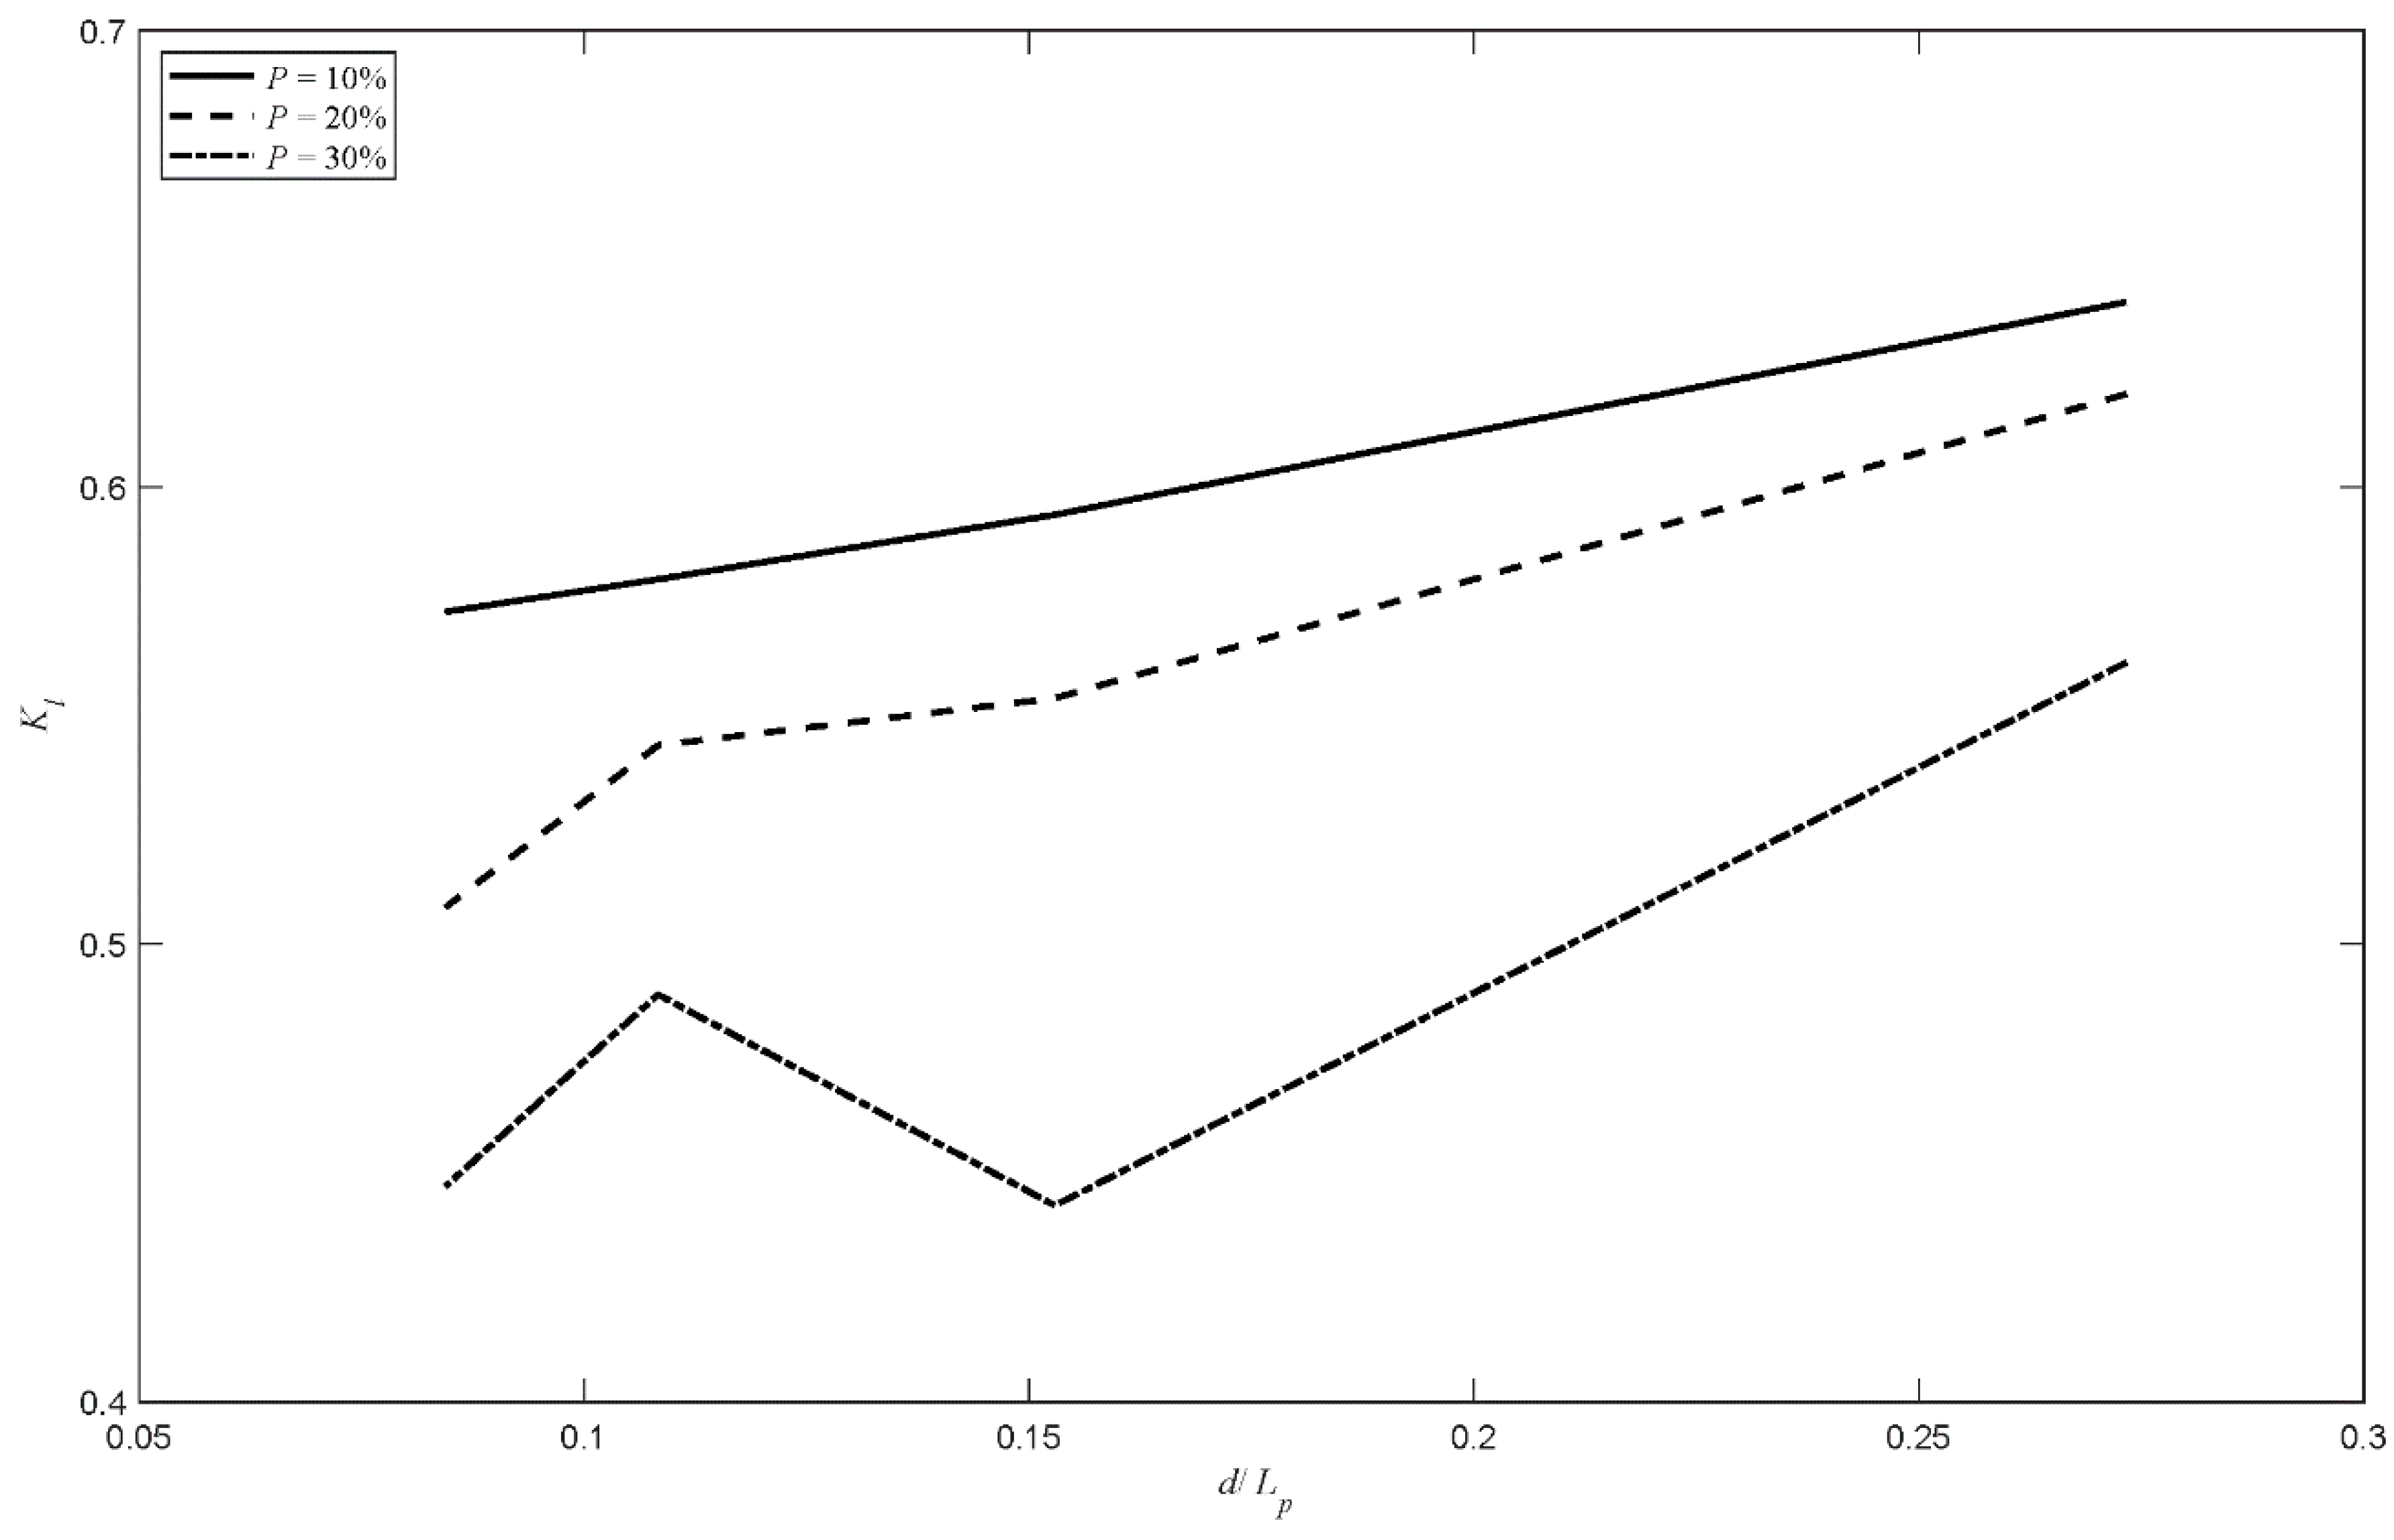
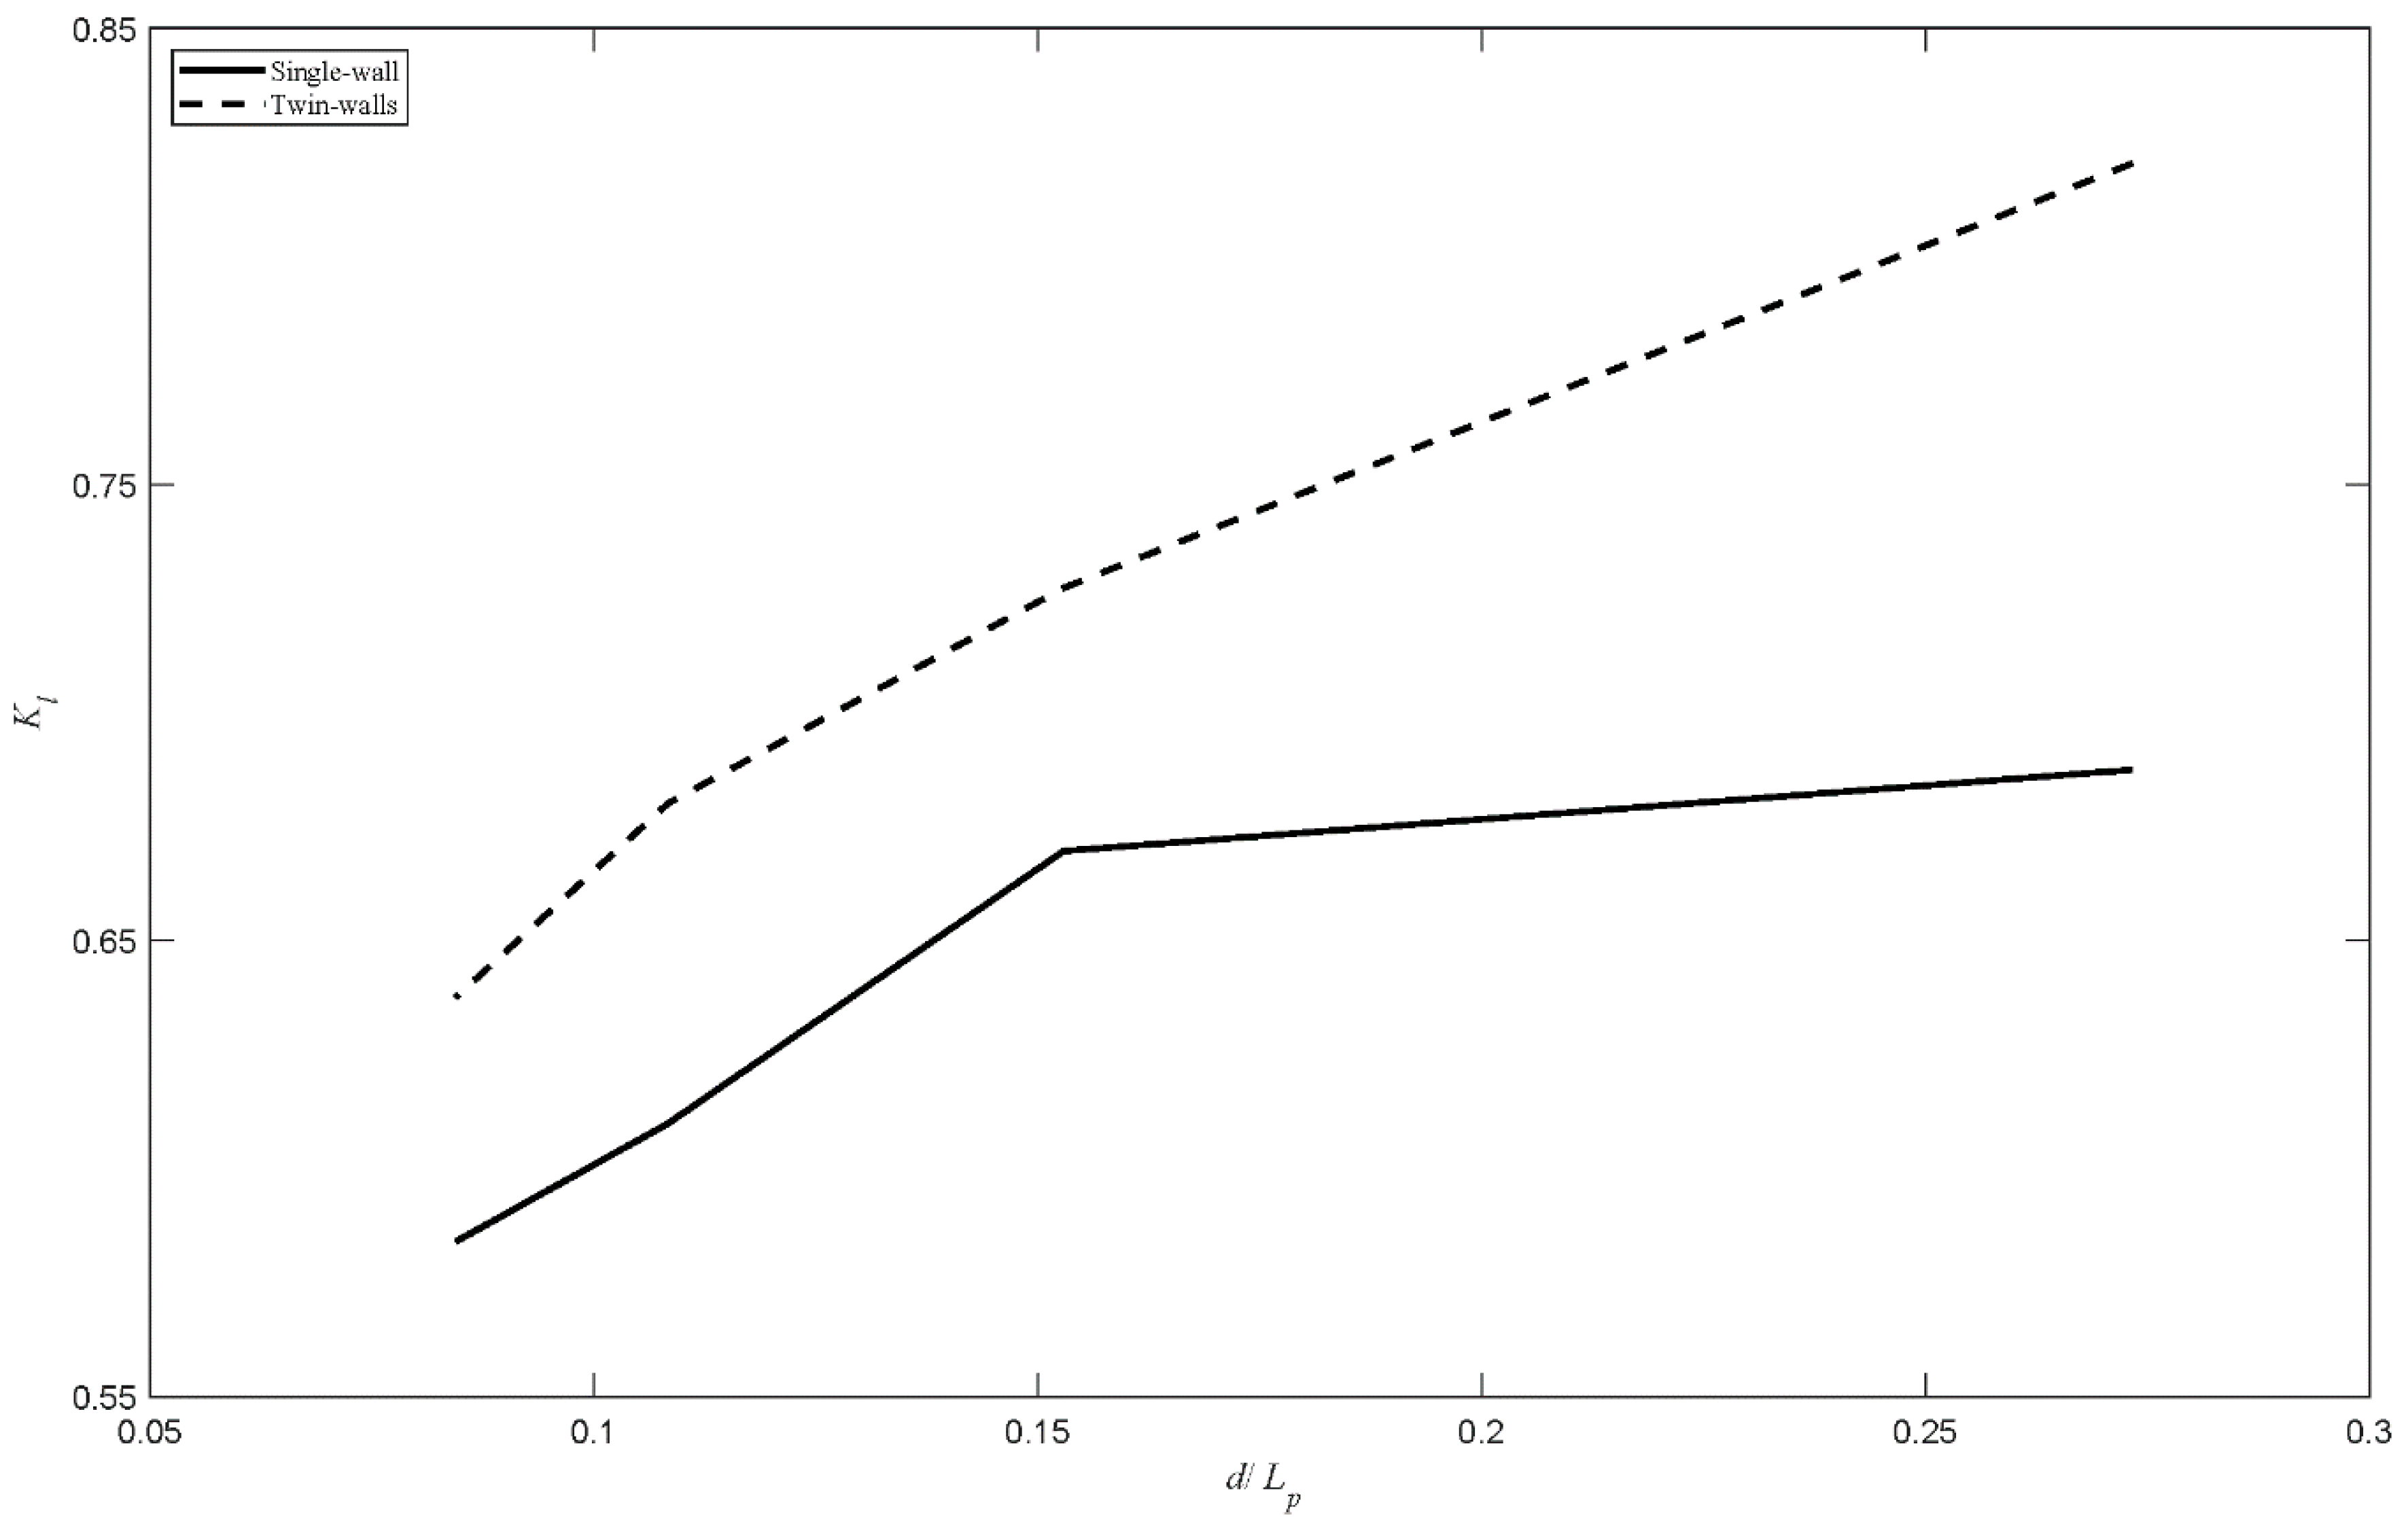
The variation of Kl with d/Lp against the number of walls for a model with P = 20% and θ = 60 under the wave condition His/d = 0.2493 is shown in Figure 23 as an example. The addition of a second wall has a more significant impact on increasing Kl for waves with His/d = 0.1284 than for waves with His/d = 0.2493, where the average increase in Kl ranged between 6.25–15.7% and 8.5–23.3%, respectively. In general, the addition of a second wall always increased Kl, as more wave energy is dissipated due to the second wall.
3.4.3. Effect of Slope Angle
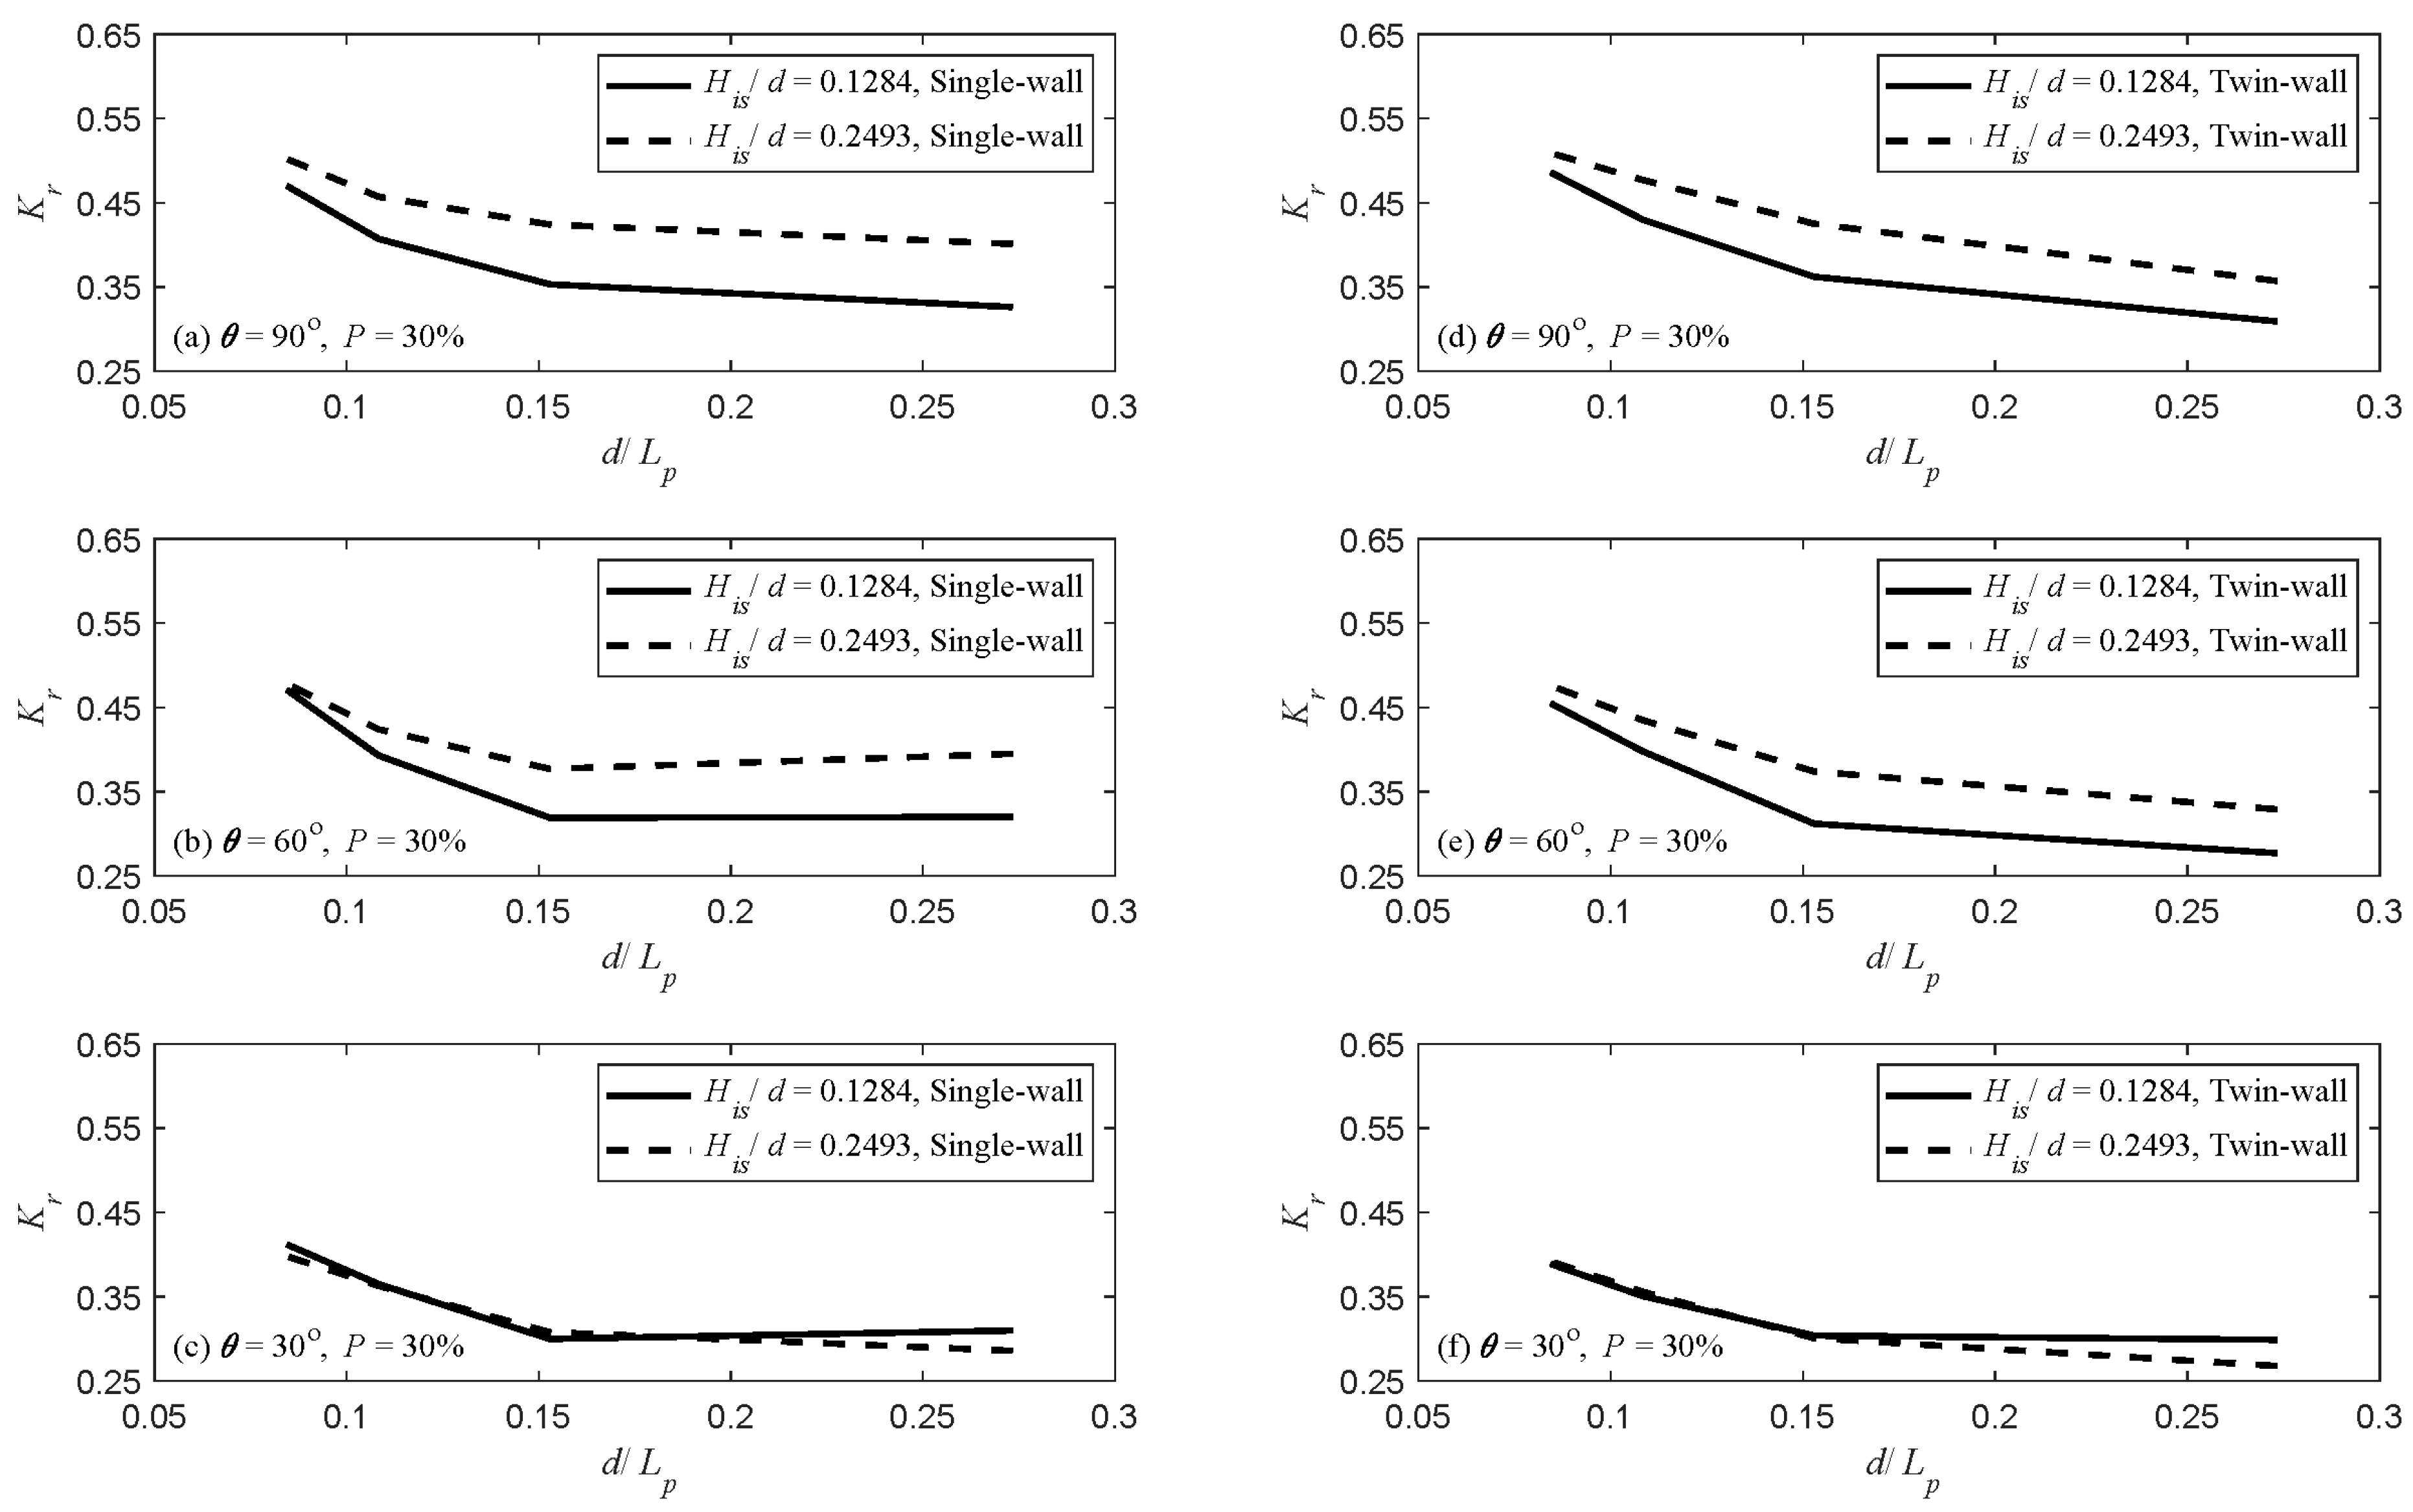
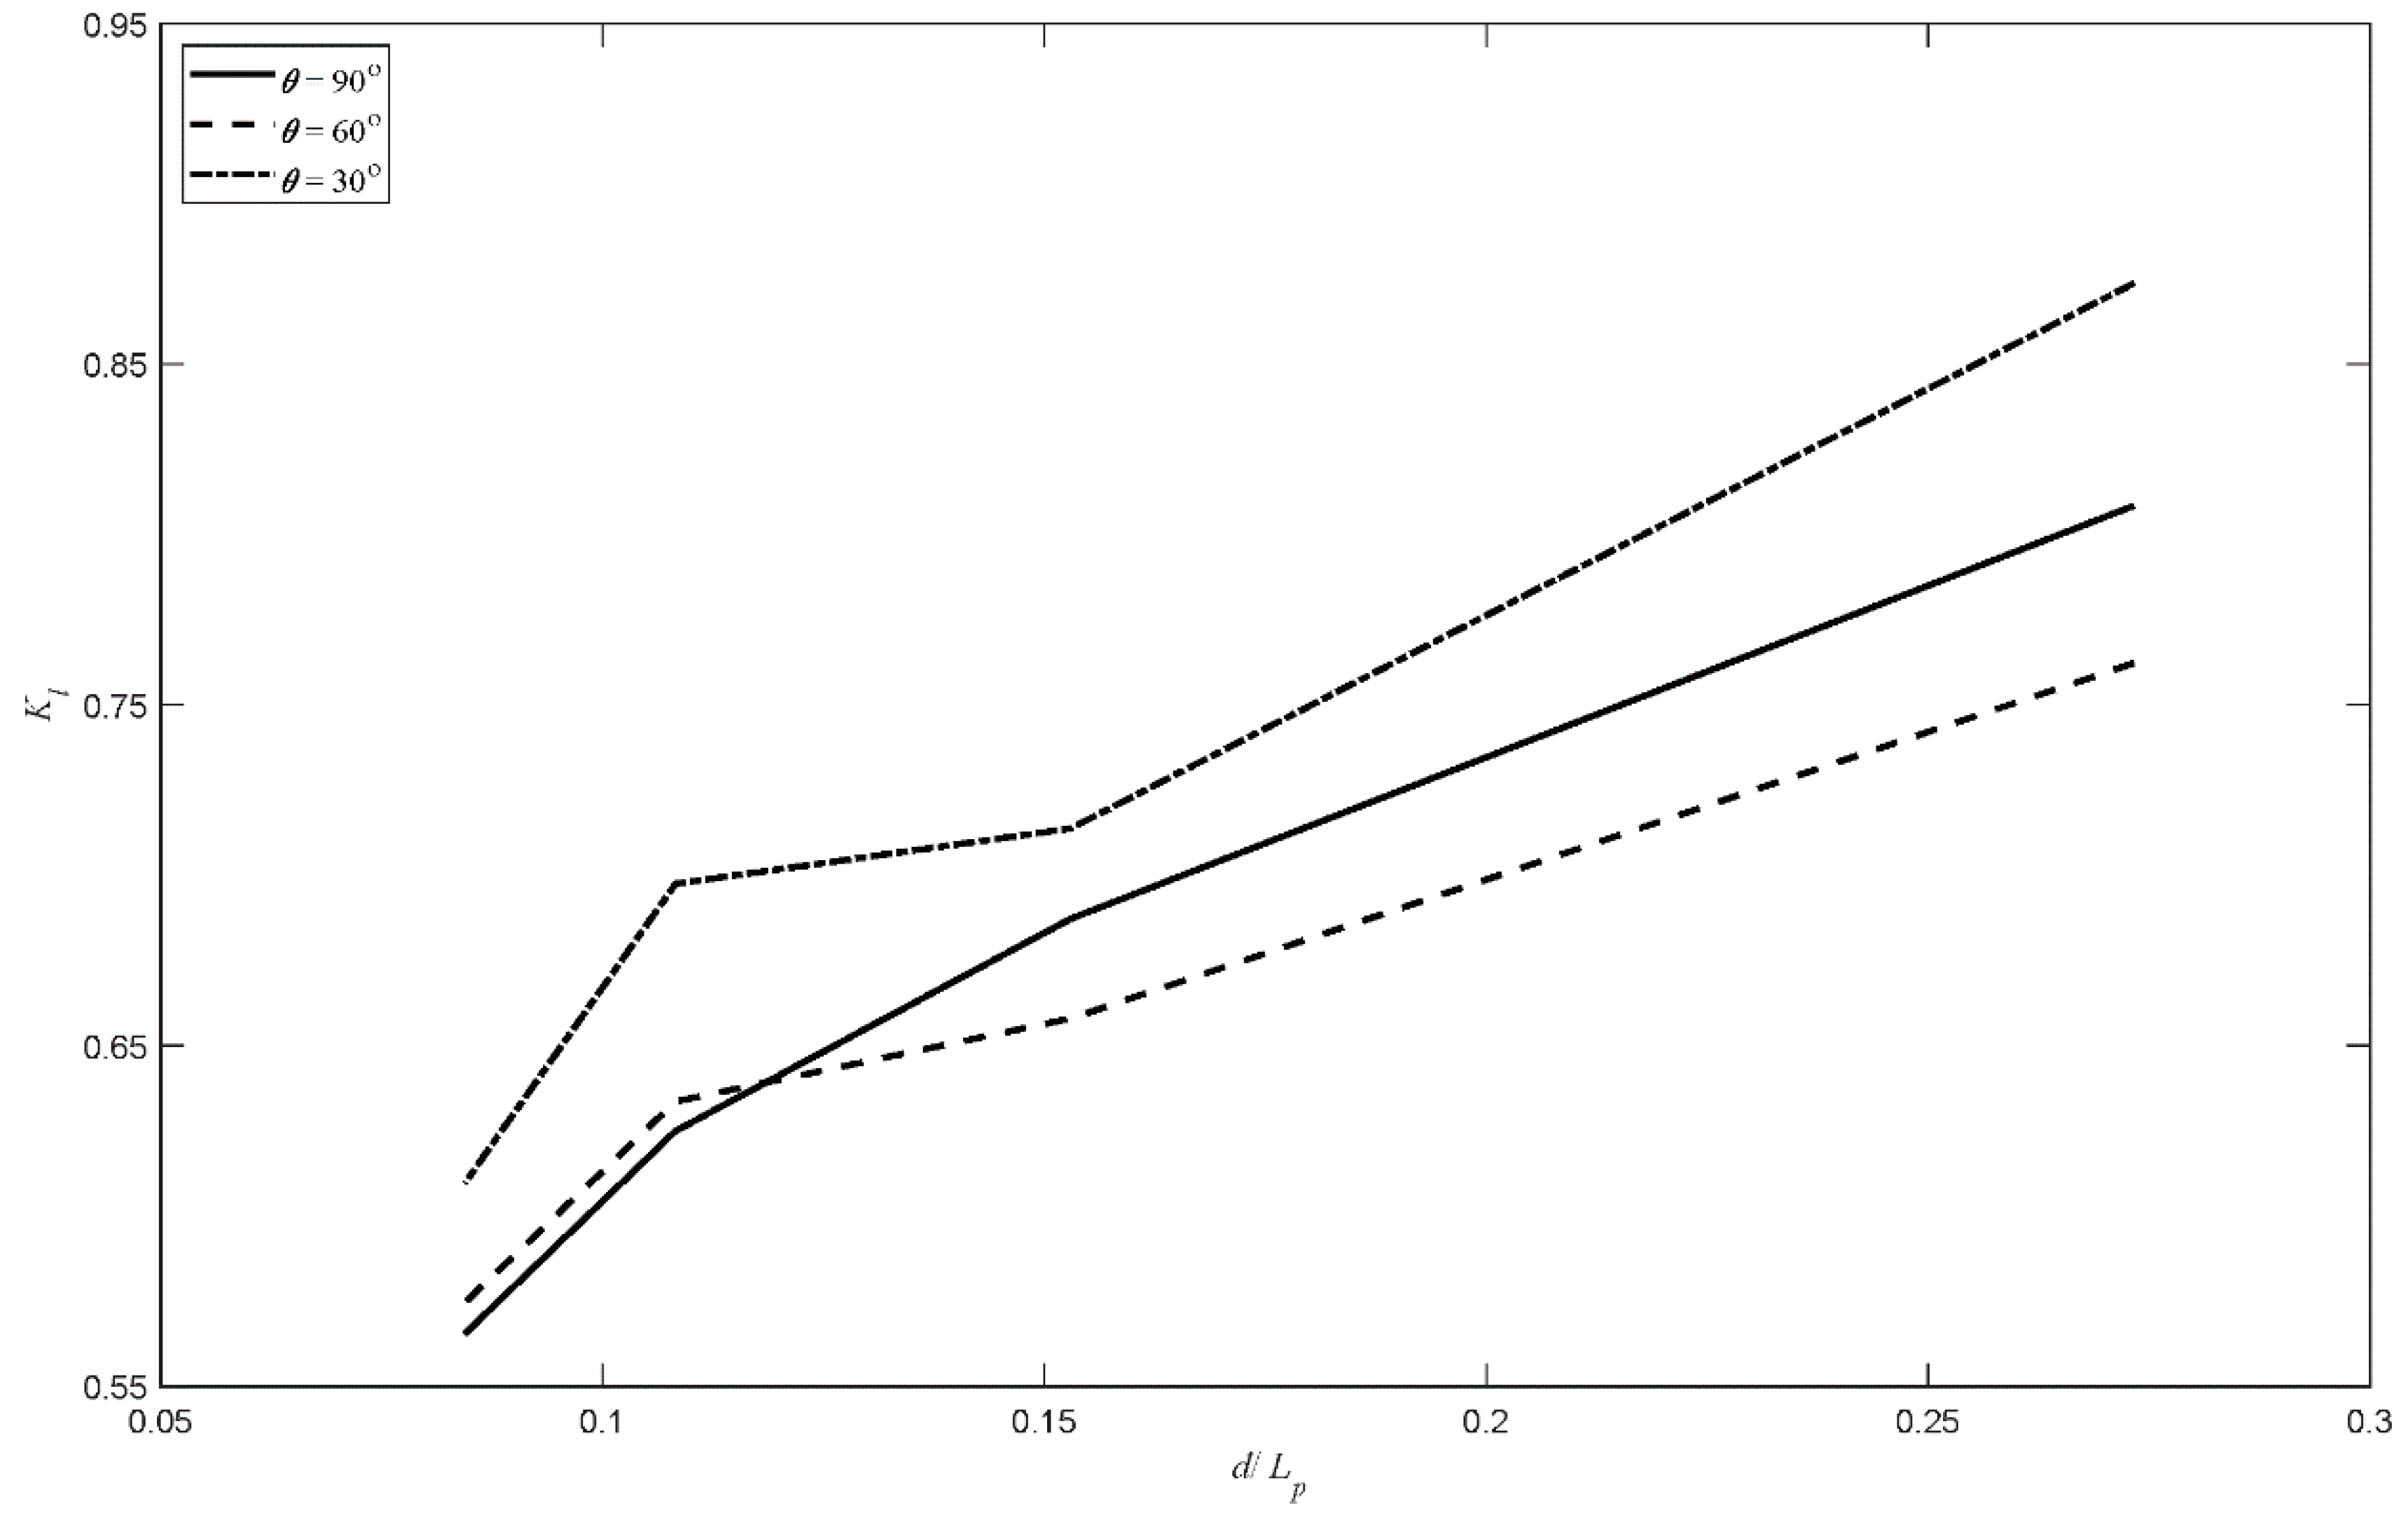
For all experiments of different θ, the highest Kl values were found when θ = 30°. The maximum Kl occurred when N = 2 and P = 20%, θ = 30°, and His/d = 0. 1284 (Figure 24).
Reducing θ from 90° to 30° increased Kl by up to 14.7% for models with single walls and by up to 11.6% for models with twin walls, while reducing θ from 60° to 30° increased Kl by up to 16.2% for models with single walls and by up to 9.2% for models with twin walls. Decreasing θ from 90° to 60°, on the other hand, reduced Kl by less than 5% for all models. Walls with θ = 90° lead to higher Kl values than walls with θ = 60° for models with N = 1 and P = 10% as well as models with P = 20% under the wave conditions of His/d = 0.1284. In all other cases, walls with θ = 60° resulted in higher values of Kl. It must be noted that, except for models with N = 1 and P = 10%, there exists a range for d/Lp between 0.844–0.22, where the variation in Kl between 60° and 90° angles oscillates. In general, reducing θ from 60° to 30° is more effective than reducing θ from 90° to 30° in increasing Kl, while for other models, such as walls with P = 20%, it is quite the contrary. As a result, it is hard to conclude this section.
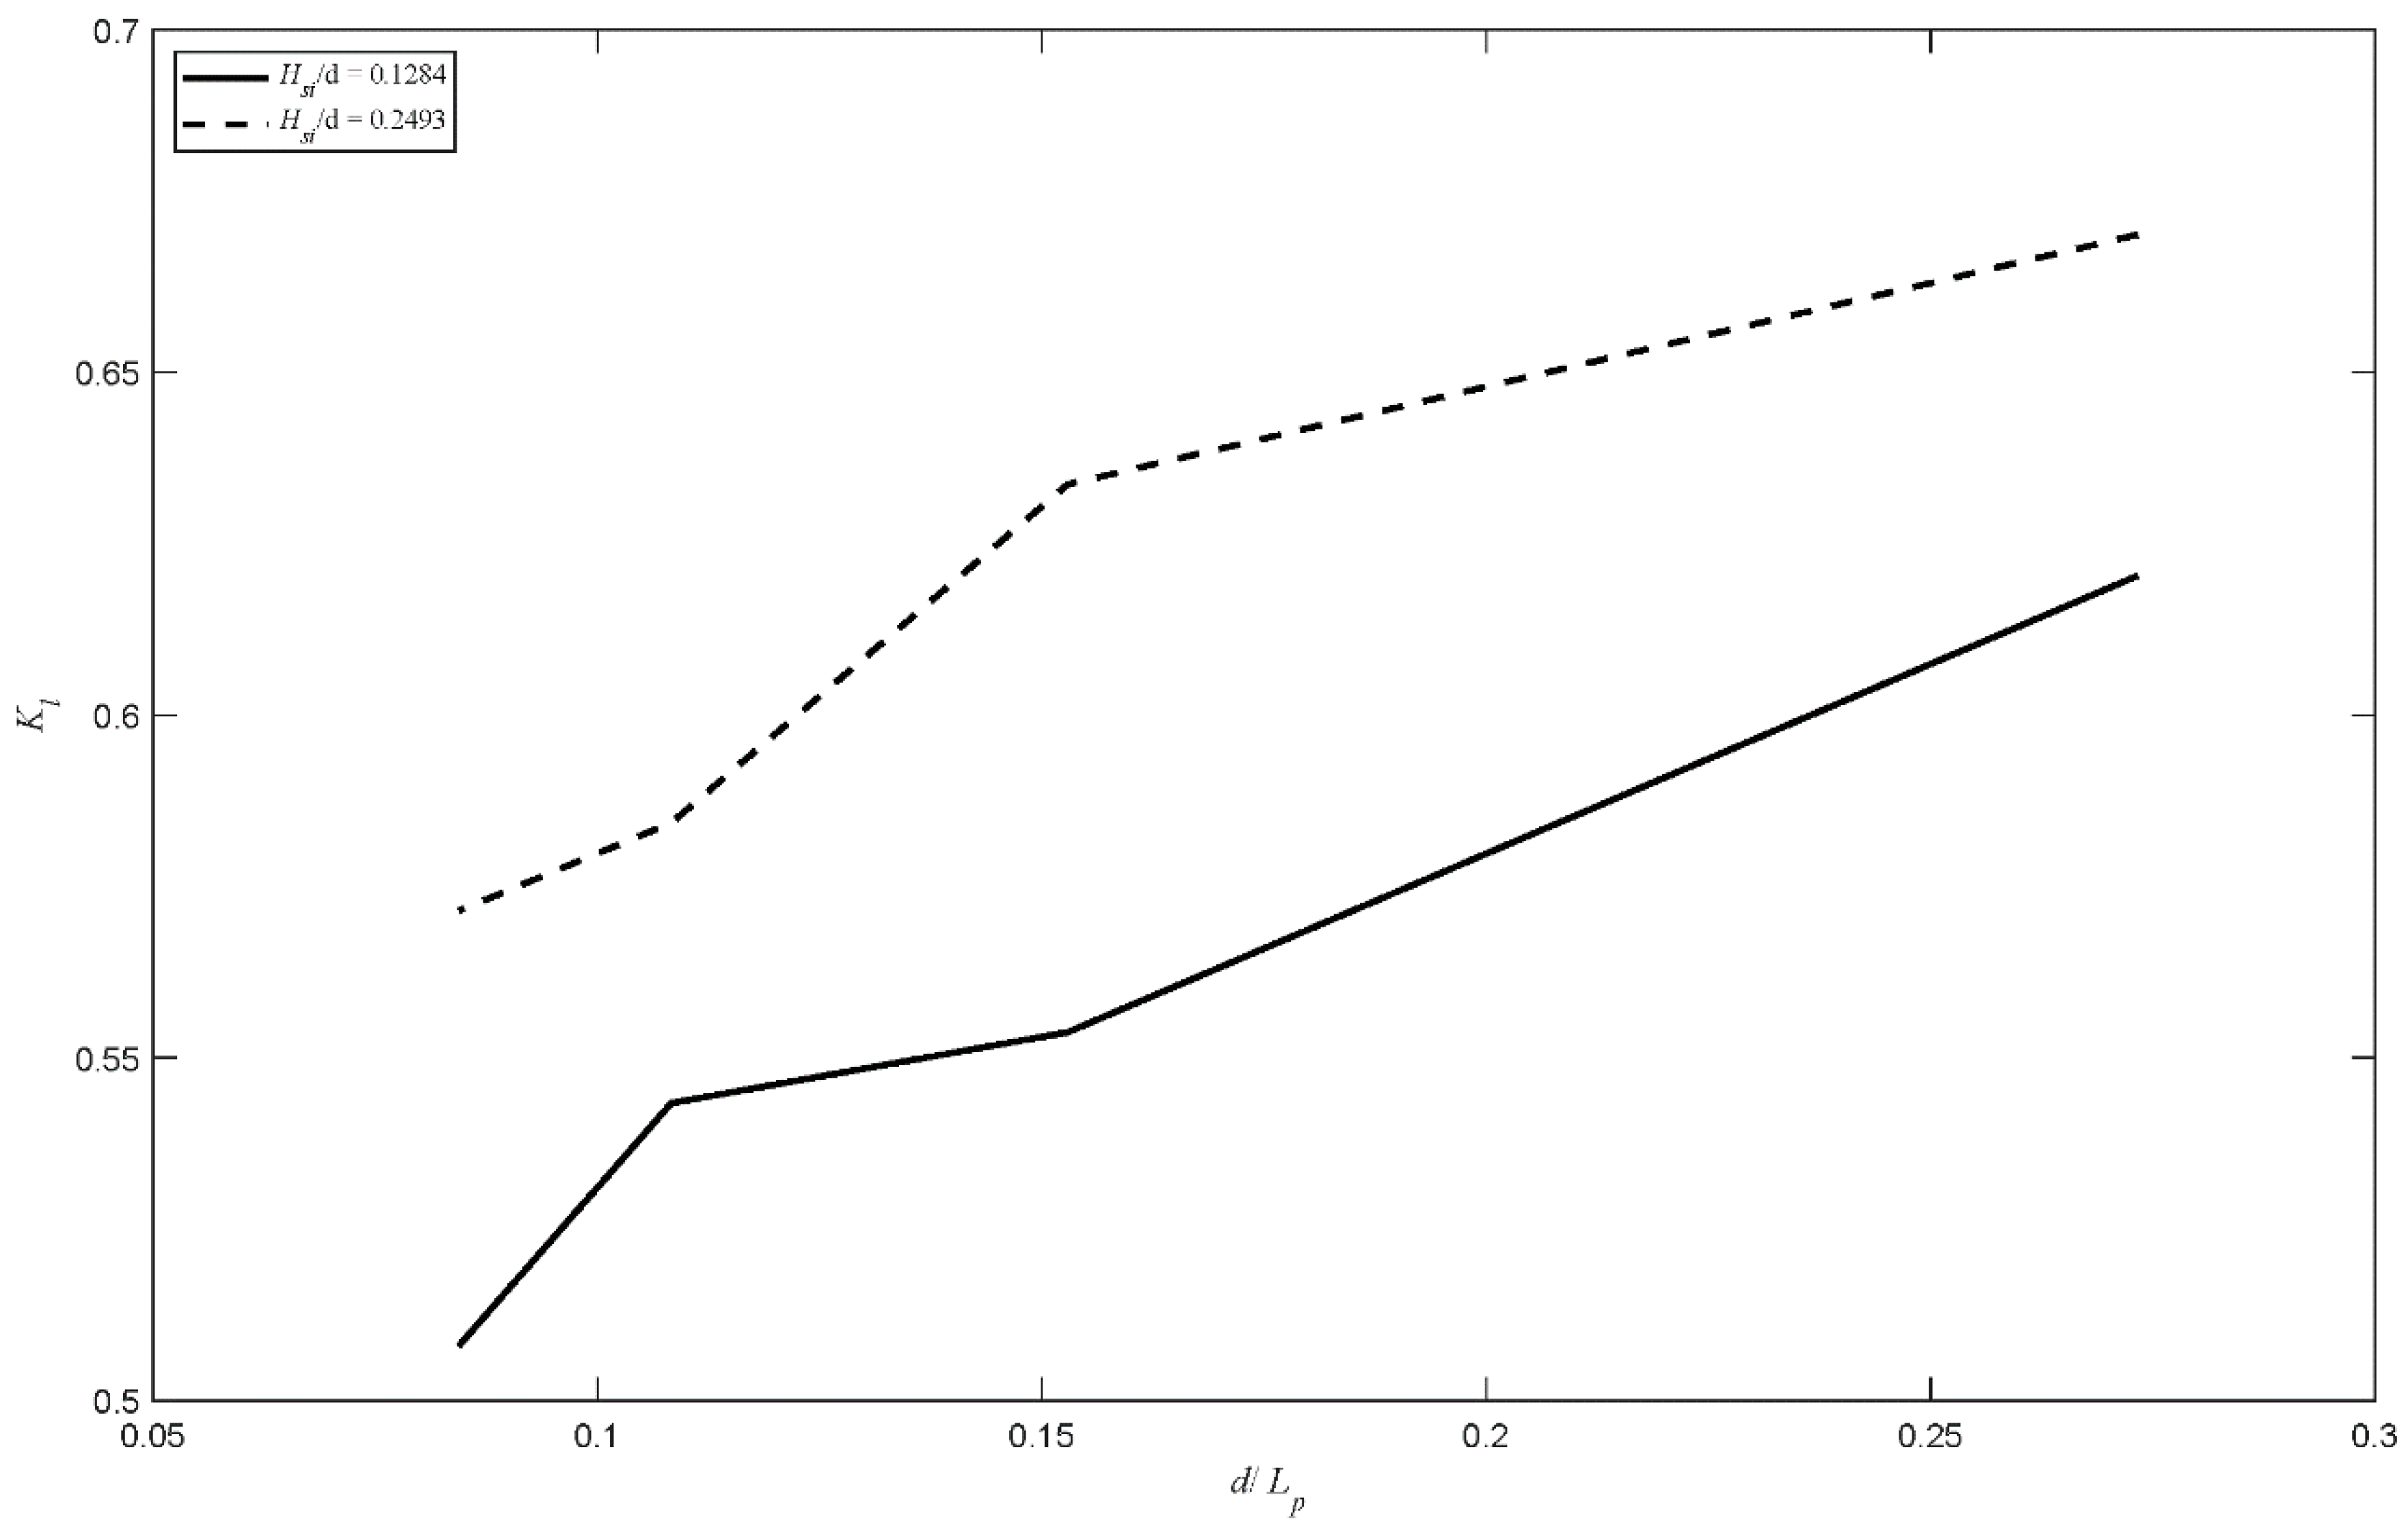
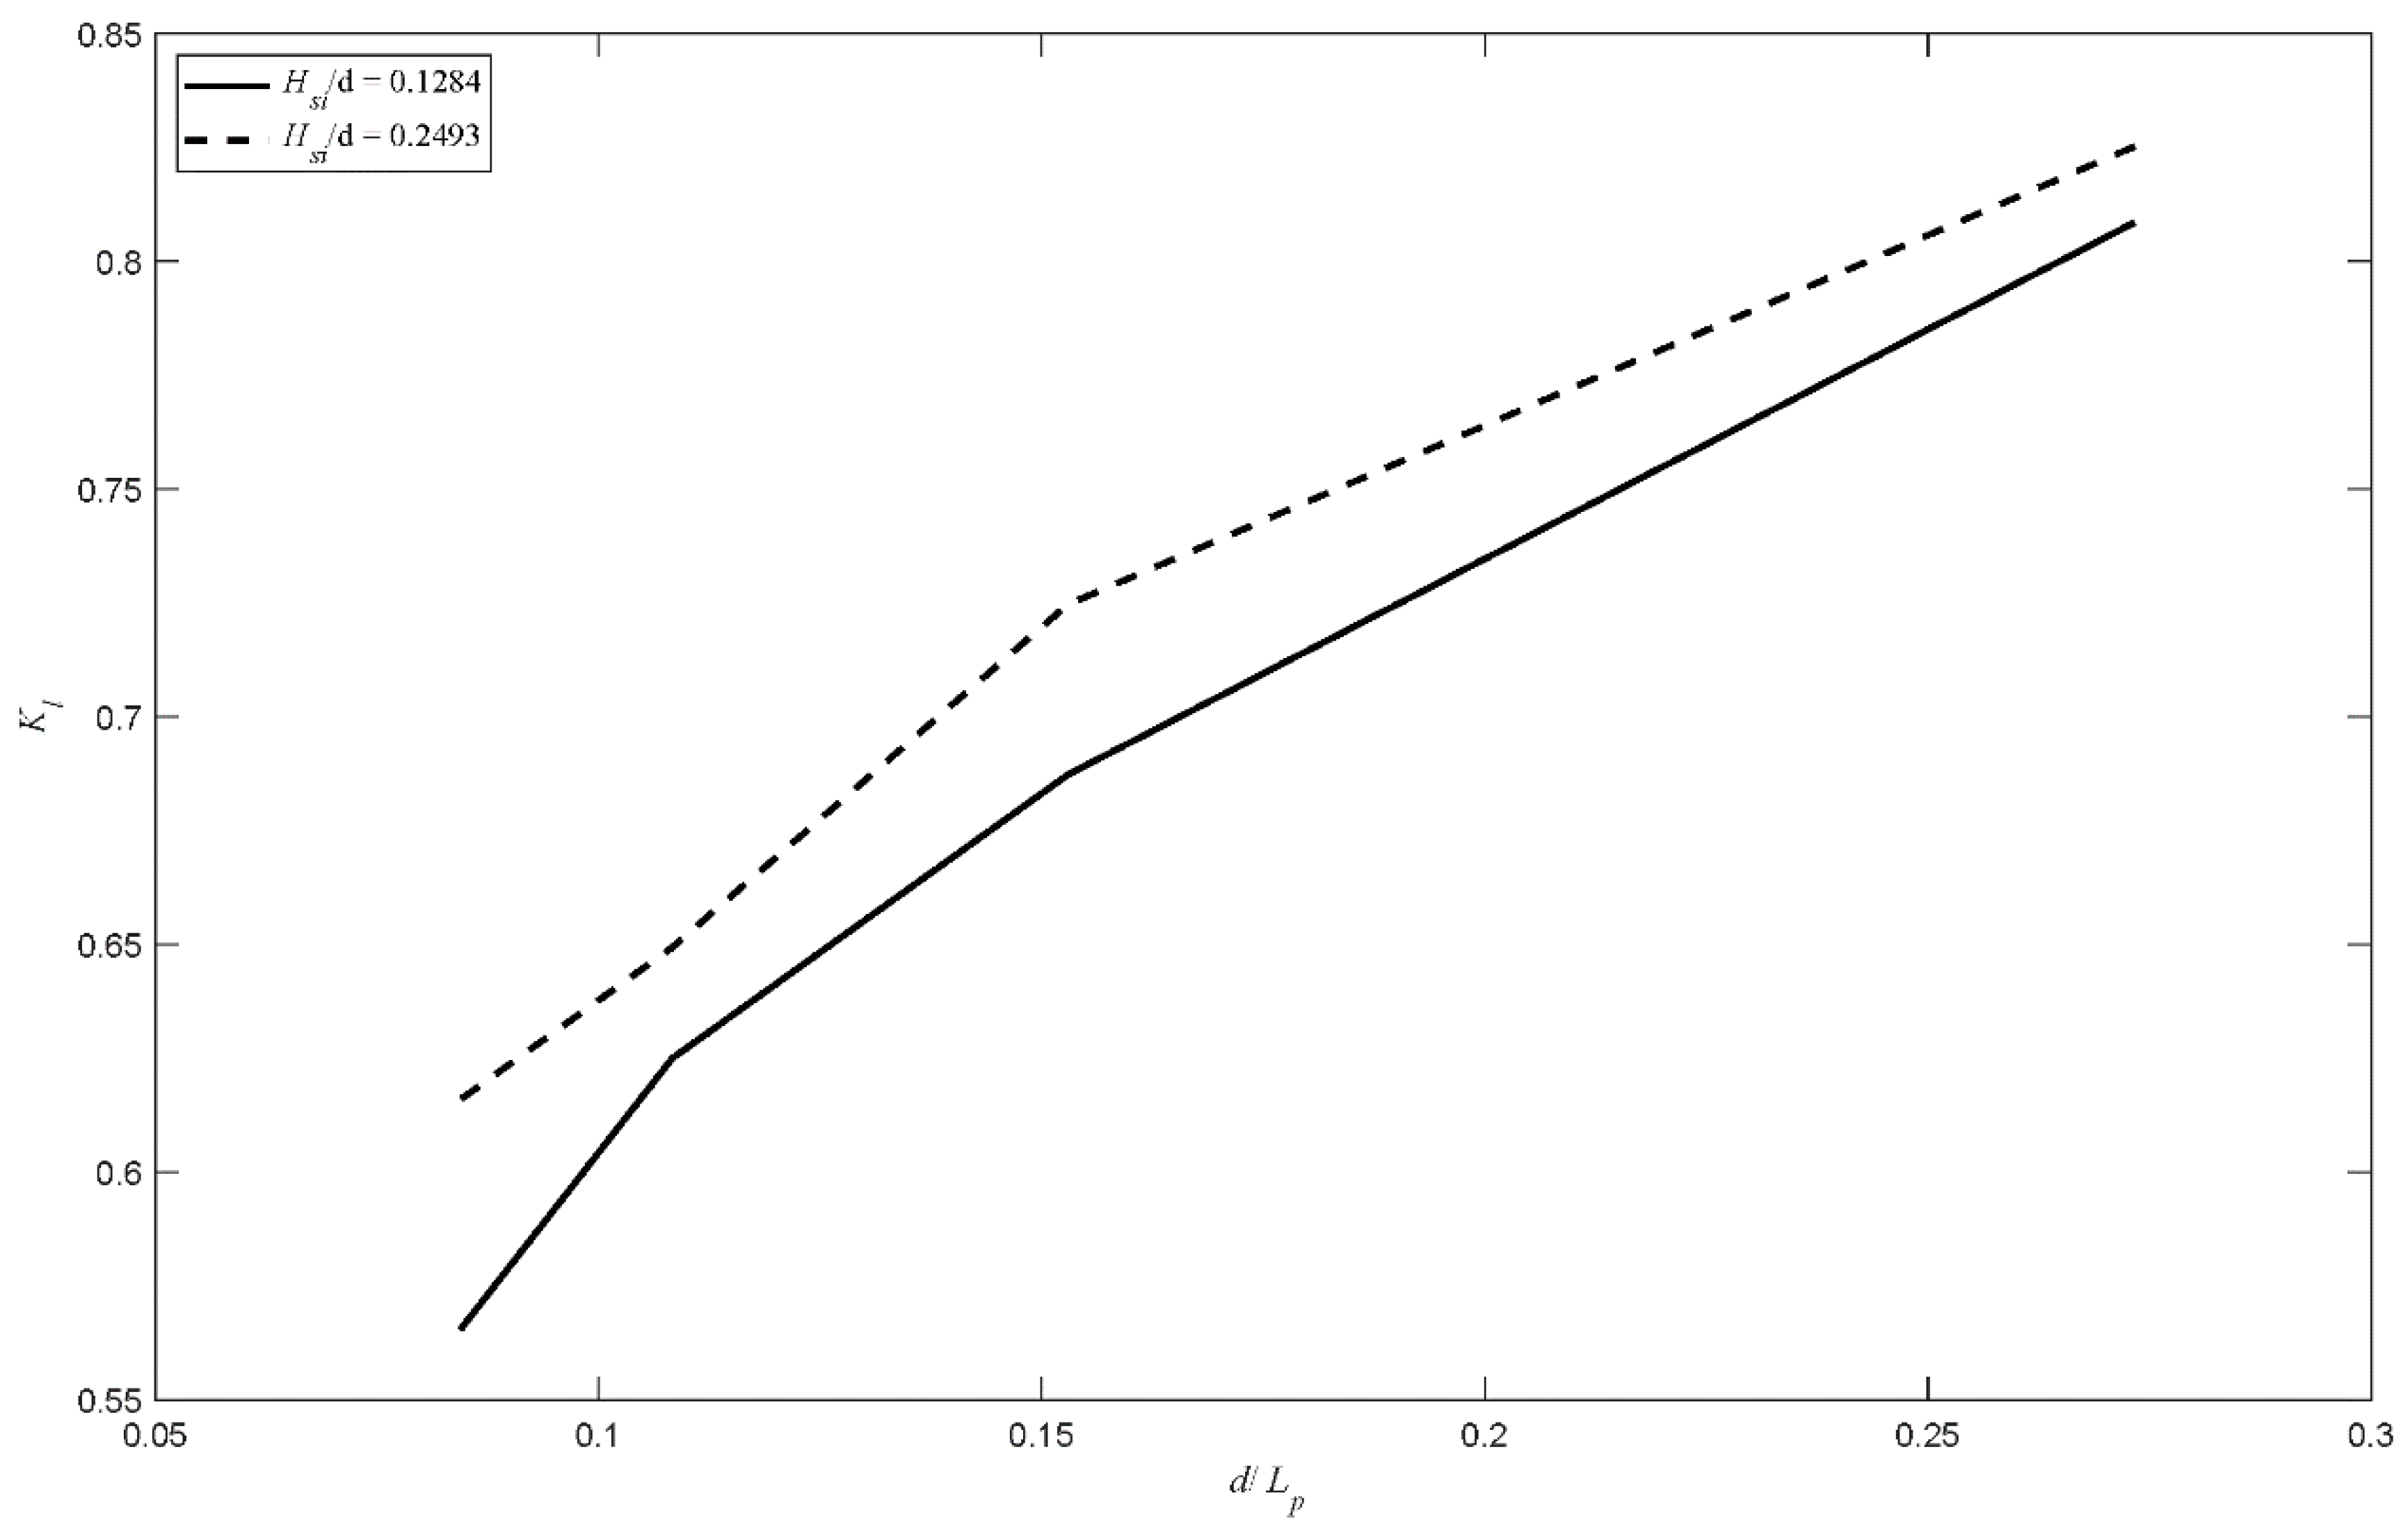
3.4.4. Effect of Relative Wave Height
Examples of the relationship between Kl and d/Lp against His/d for single and twin wall models with P = 20% is presented in Figure 25 and Figure 26, respectively. Waves with His/d = 0.2493 generally resulted in higher values of Kl, or dissipated more energy, than waves with Kl = 0.1284 (18.4% average difference versus 13% average difference). The results showed that Kl for different wall porosities was highly influenced by His/d, with models of P = 30% resulting in the highest average difference, followed by models with P = 20% and models with P = 10%. The effect of varying His/d on Kl in terms of the slope angle, however, was ambiguous.
The difference in Kl due to the variation in His/d for models with P = 10% was found to be marginal, ranging between 1.6–5.7%.
3.4.5. Effect of Relative Wave Length
In general, Kl increases with increasing d/Lp. This increase is higher for models with N = 2 and P = 30%. In most cases, the increase becomes more drastic after d/Lp = 0.1529. The effect of d/Lp on Kl for both instances of His/d was generally similar. On the other hand, the impact of d/Lp on Kl for models with N = 1, P = 10, and θ = 60° and 90° was insignificant.
4. Conclusions
The general trend noticed from the results is that there is a slight difference, in terms of Kt, between vertical structures and structures sloped at 60° in most cases. In contrast, significant differences are noticed between vertical structures and structures sloped at 30°.
Eight different types of single and twin slotted walls varying in porosity and slope angle were experimentally tested for a series of random waves. The effect of the structure parameters and wave conditions on the hydrodynamic characteristics was studied and analyzed. The reduction in Kt could reach to 35.38% as P is reduced from 30 to 10% for the single-wall cases, and to 38.86% for the twin-wall cases. On average, reducing the structure porosity from 30% to 10% reduces Kt by 25.26% and 26.28 for single and twin walls, respectively.
The effect of the wall slope on Kt was more significant when d/Lp = 0.2733 than when d/Lp = 0.1529, 0.1083, or 0.0844. For most of the investigated cases, the effect of the wall slope on Kt was negligible when d/Lp = 0.1529 and 0.1083. For the case of d/Lp = 0.0844, an increasing trend was noticed as the wall angle decreases. The values of Kt were nearly the same when changing the wall slope from 90° to 60°, and the effect of wall slope on Kt was only evident when comparing θ = 90° with θ = 30°. The effect of the wall slope was larger in the instances of twin-walls. For d/Lp larger than 0.1527, Kt, for models with θ = 30, is significantly lower than models with θ = 60° and 90°. Before the aforementioned critical d/Lp points, no single conclusion was reached regarding Kt and the varying slope angles.
Twin-walls were more effective in reducing Kt as d/Lp increases than single-walls. The reason for this increased effect is that shorter waves (larger d/Lp) are more likely to interact with the wall than longer waves, which are more likely to pass through the slots of the walls.
Regarding the wave reflection, decreasing wall porosity from 30% to 10% increases wave reflection for both single- and twin-wall models. Reducing the slope angle from 90° to 30° reduces the wave reflection by a maximum of 30.83% for models with single-wall and a maximum of 29.20% for models with twin walls. For most of the studied cases, the addition of a second wall was effective in reducing the Kr. The maximum average change in Kr due to the addition of a second wall was only 4.44%.
In the case of wave energy dissipation, decreasing wall porosity from 30% to 10% increases Kl by a maximum of 23.7% for the case of single-walls and 13.3% for the case of twin-walls. Reducing the slope angle from 90° to 30° degrees increased Kl by a maximum of 14.7% for the case of single-wall and 11.6% for the case of twin-walls. The addition of a second wall increased energy dissipation by a maximum of 23.3%.
The conclusion from the above is that reducing Kt is most achievable by adding a second wall, followed by reducing the porosity, and finally by decreasing the slope angle. To reduce Kr, however, reducing wall porosity is the most effective measure, followed by reducing the slope angle, and lastly, by adding a second wall. Increasing Kl is most achievable when decreasing the porosity, followed by the addition of a second wall, and finally by reducing the structure slope angle.
Regarding the wave parameters, increasing His/d from 0.1284 to 0.293 causes an average reduction of 21.2% in and 15.5% in , and an increase of up to 18.4% in . On the other hand, both and decreased with increasing relative wavelength, , while followed the opposite trend. In most cases, the variation of from 0.153 to 0.273 causes more variation in Kt, Kr, and Kl than the variation of from 0.844–0.152. These results show that as the waves approach deep water, the effects of wave period on transmission, reflection, and energy dissipation become increasingly more substantial.
The results of this study determine the most influential parameters on the performance of vertical and sloped slotted walls. Understanding the performance of such type of coastal protection structures under different hydrodynamic and design configurations, will enhance and optimize breakwater design and improve the design procedure and guidelines. More intensive studies to expand the range of wall parameters and wave conditions are recommended to gain a better physical understanding of the performance of such walls and to develop numerical and empirical design procedures for slotted walls that include the most influential parameters.
Author Contributions
Conceptualization, M.A.; formal analysis, N.A. and S.N.; investigation, M.A. and N.A.; methodology, M.A., N.A. and S.N.; resources, S.N.; supervision, M.A.; writing—original draft, M.A. and N.A. All authors have read and agreed to the published version of the manuscript.
Funding
This research was funded by the College of Graduate Studies, Kuwait University. Grant number is 0620-215128303.
Acknowledgments
The authors would like to thank the College of Graduate Studies, Kuwait University for their financial support, and Kuwait Institute for Scientific Research (KISR) for the use of the wave basin facilities, and the technicians of the KISR coastal laboratory for their assistance.
Conflicts of Interest
The authors declare no conflict of interest. The funders had no role in the design of the study; in the collection, analyses, or interpretation of data; in the writing of the manuscript, or in the decision to publish the results.
References
- Sawaragi, T.; Iwata, K. Wave attenuation of a vertical breakwater with two air chambers. Coast. Eng. Jpn. 1978, 21, 63–74. [Google Scholar] [CrossRef]
- Kondo, H. Analysis of breakwaters having two porous walls. Proc. Coast. Struct. 79 1979, 2, 962–977. [Google Scholar]
- Fugazza, M.; Natale, L. Hydraulic design of perforated breakwaters. J. Waterw. Port Coast Ocean Eng. 1992, 118, 1–14. [Google Scholar] [CrossRef]
- Bergmann, H.; Oumeraci, H. Performance of New Multi Chamber Systems ys. Convention al Jarlan Caisson Breakwaters; National Civil Engineering Days-Coastal Engineering: Caen, France, 2000. [Google Scholar]
- Chen, X.; Li, Y.; Sun, D. Regular waves acting on double-layered perforated caissons. In Proceedings of the Twelfth International Offshore and Polar Engineering Conference, International Society of Offshore and Polar Engineers, Kitakyushu, Japan, 26–31 May 2002. [Google Scholar]
- Li, Y.; Liu, Y.; Teng, B. Porous effect parameter of thin permeable plates. Coast. Eng. J. 2006, 48, 309–336. [Google Scholar] [CrossRef]
- Koutandos, E.V. Hydraulic performance of double slotted barriers under regular wave attack. Wseas Trans. Fluid Mech. 2010, 5, 91–103. [Google Scholar]
- Alkhalidi, M.; Neelamani, S.; Assad, A.I.A.H. Wave forces and dynamic pressures on slotted vertical wave barriers with an impermeable wall in random wave fields. Ocean Eng. 2015, 109, 1–6. [Google Scholar] [CrossRef]
- Alkhalidi, M.; Neelamani, S.; Assad, A.I.A.H. Wave pressures and forces on slotted vertical wave barriers. Ocean Eng. 2015, 108, 578–583. [Google Scholar] [CrossRef]
- Hagiwara, K. Analysis of upright structure for wave dissipation using integral equation. In Proceedings of the 19th International Conference on Coastal Engineering, Houston, TX, USA, 3–7 September 1984; pp. 2810–2826. [Google Scholar]
- Huang, Z. Wave interaction with one or two rows of closely spaced rectangular cylinders. Ocean Eng. 2007, 34, 1584–1591. [Google Scholar] [CrossRef]
- Neelamani, S.; Al-Salem, K.; Taqi, A. Experimental investigation on wave reflection characteristics of slotted vertical barriers with an impermeable back wall in random wave fields. J. Waterw. Port Coast. Ocean Eng. 2017, 143, 06017002. [Google Scholar] [CrossRef]
- Huang, N.E.; Long, S.R. An experimental study of the surface elevation probability distribution and statistics of wind-generated waves. J. Fluid Mech. 1980, 101, 179–200. [Google Scholar] [CrossRef]
- Isaacson, M.; Baldwin, J.; Premasiri, S.; Yang, G. Wave interactions with double slotted barriers. Appl. Ocean Res. 1999, 21, 81–91. [Google Scholar] [CrossRef]
- Koraim, A.S. Hydrodynamic characteristics of slotted breakwaters under regular waves. J. Mar. Sci. Technol. 2011, 16, 331–342. [Google Scholar] [CrossRef]
- Park, W.S.; Chun, I.S.; Lee, D.S. Hydraulic experiments for the reflection characteristics of perforated breakwaters. J. Korean Soc. Coast. Ocean Eng. 1993, 5, 198–203. [Google Scholar]
- Suh, K.D.; Shin, S.; Cox, D.T. Hydrodynamic characteristics of pile-supported vertical wall breakwaters. J. Waterw. Port Coast. Ocean Eng. 2006, 132, 83–96. [Google Scholar] [CrossRef] [Green Version]
- Faraci, C.; Cammaroto, B.; Cavallaro, L.; Foti, E. Wave reflection generated by caissons with internal rubble mound of variable slope. Coast. Eng. Proc. 2012, 33, 51. [Google Scholar] [CrossRef] [Green Version]
- Neelamani, S.; Sandhya, N. Wave reflection characteristics of plane, dentated and serrated seawalls. Ocean Eng. 2003, 30, 1507–1533. [Google Scholar] [CrossRef]
- Muttray, M.; Oumeraci, H. Paper no: 247 Wave transformation at sloping perforated walls. In Solving Coastal Conundrums; Institution of Civil Engineers: London, UK, 2002. [Google Scholar]
- Mallayachari, V.; Sundar, V. Reflection characteristics of permeable seawalls. Coast. Eng. 1994, 23, 135–150. [Google Scholar] [CrossRef]
- Ahmed, H. Wave Interaction with Vertical Slotted Walls as A Permeable Breakwater; University of Wuppertal: Wuppertal, Germany, 2012. [Google Scholar]
- Mansard, E.P.; Funke, E.R. The measurement of incident and reflected spectra using a least squares method. In Proceedings of the 17th International Conference on Coastal Engineering, Sydney, Australia, 23–28 March 1980; pp. 154–172. [Google Scholar]
- Goda, Y.; Suzuki, Y. Estimation of incident and reflected waves in random wave experiments. In Proceedings of the 15th International Conference on Coastal Engineering, Honolulu, HI, USA, 11–17 July 1976; pp. 828–845. [Google Scholar]
Figure 1.
Suggested model design. Conceptual design in (a) and actual model fixed in the flume in (b).
Figure 1.
Suggested model design. Conceptual design in (a) and actual model fixed in the flume in (b).

Figure 2.
Side view of the wave flume showing the locations of the wave probes.

Figure 3.
Effect of P on Kt for the case of N = 1, θ = 30, and His/d = 0.2493.

Figure 4.
Effect of N on with for P = 20%, θ = 90, and = 0.2493.

Figure 5.
Variation of Kt with θ for d/Lp = 0.2733 and different porosities and wall configurations. On the left, His/d = 0.2493 (a–c) and on the right His/d = 0.1284 (d–f).
Figure 5.
Variation of Kt with θ for d/Lp = 0.2733 and different porosities and wall configurations. On the left, His/d = 0.2493 (a–c) and on the right His/d = 0.1284 (d–f).

Figure 6.
Variation of Kt with θ for d/Lp = 0.1529 and different porosities and wall configurations. On the left, His/d = 0.2493 (a–c) and on the right His/d = 0.1284 (d–f).
Figure 6.
Variation of Kt with θ for d/Lp = 0.1529 and different porosities and wall configurations. On the left, His/d = 0.2493 (a–c) and on the right His/d = 0.1284 (d–f).

Figure 7.
Variation of Kt with θ for d/Lp = 0.1083 and different porosities and wall configurations. On the left, His/d = 0.2493 (a–c) and on the right His/d = 0.1284 (d–f).
Figure 7.
Variation of Kt with θ for d/Lp = 0.1083 and different porosities and wall configurations. On the left, His/d = 0.2493 (a–c) and on the right His/d = 0.1284 (d–f).

Figure 8.
Variation of Kt with θ for d/Lp = 0.0844 and different porosities and wall configurations. On the left, His/d = 0.2493 (a–c) and on the right His/d = 0.1284 (d–f).
Figure 8.
Variation of Kt with θ for d/Lp = 0.0844 and different porosities and wall configurations. On the left, His/d = 0.2493 (a–c) and on the right His/d = 0.1284 (d–f).

Figure 9.
Effect of His/d on the variation of with N = 1, P = 20%, and θ = 90°.

Figure 10.
Effect of His/d on the variation Kt with d/Lp, N = 2, P = 20%, and θ = 90°.

Figure 11.
Effect of P on the variation of Kr with d/Lp. N = 1, θ = 90°, and His/d = 0.1284.

Figure 12.
Effect of the number of walls on Kr. θ = 90°, and His/d = 0.1284. (a) P = 10%, (b) P = 20%, and (c) P = 30%.
Figure 12.
Effect of the number of walls on Kr. θ = 90°, and His/d = 0.1284. (a) P = 10%, (b) P = 20%, and (c) P = 30%.

Figure 13.
Effect of the number of walls on Kr. θ = 60°, and His/d = 0.1284. (a) P = 10%, (b) P = 20%, and (c) P = 30%.
Figure 13.
Effect of the number of walls on Kr. θ = 60°, and His/d = 0.1284. (a) P = 10%, (b) P = 20%, and (c) P = 30%.

Figure 14.
Effect of the number of walls on Kr. θ = 30°, and His/d = 0.2493. (a) P = 10%, (b) P = 20%, and (c) P = 30%.
Figure 14.
Effect of the number of walls on Kr. θ = 30°, and His/d = 0.2493. (a) P = 10%, (b) P = 20%, and (c) P = 30%.

Figure 15.
Variation of Kr with θ for d/Lp = 0.2733, and different porosities and wall configurations. On the left, His/d = 0.2493 (a,b) and on the right His/d = 0.1284 (c,d).
Figure 15.
Variation of Kr with θ for d/Lp = 0.2733, and different porosities and wall configurations. On the left, His/d = 0.2493 (a,b) and on the right His/d = 0.1284 (c,d).

Figure 16.
Variation of Kr with θ for d/Lp = 0.1529, and different porosities and wall configurations. On the left, His/d = 0.2493 (a,b) and on the right His/d = 0.1284 (c,d).
Figure 16.
Variation of Kr with θ for d/Lp = 0.1529, and different porosities and wall configurations. On the left, His/d = 0.2493 (a,b) and on the right His/d = 0.1284 (c,d).

Figure 17.
Variation of Kr with θ for d/Lp = 0.1083, and different porosities and wall configurations. On the left, His/d = 0.2493 (a,b) and on the right His/d = 0.1284 (c,d).
Figure 17.
Variation of Kr with θ for d/Lp = 0.1083, and different porosities and wall configurations. On the left, His/d = 0.2493 (a,b) and on the right His/d = 0.1284 (c,d).

Figure 18.
Variation of Kr with θ for d/Lp = 0.0844, and different porosities and wall configurations. On the left, His/d = 0.2493 (a,b) and on the right His/d = 0.1284 (c,d).
Figure 18.
Variation of Kr with θ for d/Lp = 0.0844, and different porosities and wall configurations. On the left, His/d = 0.2493 (a,b) and on the right His/d = 0.1284 (c,d).

Figure 19.
Effect of His/d on Kr for P = 10% and different wall slopes. Subfigures (a), (b), and (c) are for single-wall, and subfigures (d), (e), and (f) are for twin-wall.
Figure 19.
Effect of His/d on Kr for P = 10% and different wall slopes. Subfigures (a), (b), and (c) are for single-wall, and subfigures (d), (e), and (f) are for twin-wall.

Figure 20.
Effect of His/d on Kr for P = 20% and different wall slopes. Subfigures (a), (b), and (c) are for single-wall, and subfigures (d), (e), and (f) are for twin-wall.
Figure 20.
Effect of His/d on Kr for P = 20% and different wall slopes. Subfigures (a), (b), and (c) are for single-wall, and subfigures (d), (e), and (f) are for twin-wall.

Figure 21.
Effect of His/d on Kr for P = 30% and different wall slopes. Subfigures (a), (b), and (c) are for single-wall, and subfigures (d), (e), and (f) are for twin-wall.
Figure 21.
Effect of His/d on Kr for P = 30% and different wall slopes. Subfigures (a), (b), and (c) are for single-wall, and subfigures (d), (e), and (f) are for twin-wall.

Figure 22.
Effect of P on for N = 1, θ = 90°, and His/d = 0.1284.

Figure 23.
Effect of N on the variation of with . P = 20%, θ = 60°, and = 0.25.

Figure 24.
Example of the Effect of θ on the variation of for P = 20, = 2, and = 0. 1284.

Figure 25.
Effect of on the variation of with . = 1, P = 20%, and θ = 90°.

Figure 26.
Effect of on the variation of with . N = 2, P = 20%, and θ = 90°.


Table 1.
Range of wall parameters tested.
| Wall Parameter | Notation | Range Tested |
|---|---|---|
| Porosity | P | 10%, 20%, and 30% |
| Number of walls | N | 1 and 2 |
| Slope angle | θ | 30, 60, and 90 |
Table 2.
Range of dimensionless input parameters.
| Parameter | Description | Range |
|---|---|---|
| His/d | Relative wave height | 0.1284–0.2493 |
| d/Lp | Relative wave period | 0.0844–0.2733 |
| His/Lp | Wave steepness | 0.0106–0.0683 |
Table 3.
Highest and lowest resultant hydrodynamic coefficients.
| Coefficient | Highest Value | Corresponding Model | Lowest Value | Corresponding Model |
|---|---|---|---|---|
| Kt | 0.824 | N = 1, P = 30%, θ = 90 | 0.314 | N = 2, P = 10%, θ = 30 |
| Kr | 0.636 | N = 2, P = 10%, θ = 90 | 0.268 | N = 2, P = 30%, θ = 30 |
| Kl | 0.889 | N = 2, P = 20%, θ = 30 | 0.418 | N = 1, P = 30%, θ = 60 |
Table 4.
Simple statistics of the percentage of increase in Kt as a function of wall slope angle and number of walls.
Table 4.
Simple statistics of the percentage of increase in Kt as a function of wall slope angle and number of walls.
| θ Change: | 90–60 | 90–30 | 60–30 | 90–60 | 90–30 | 60–30 |
|---|---|---|---|---|---|---|
| Statistical Parameter | Single Wall | Twin Walls | ||||
| Mean | 4.21 | 4.56 | 3.87 | 3.45 | 4.11 | 3.21 |
| Standard Deviation | 3.47 | 2.73 | 1.69 | 2.50 | 3.58 | 1.39 |
| Minimum | 0.24 | 0.64 | 1.25 | 0.41 | 0.52 | 1.30 |
| Maximum | 10.16 | 10.39 | 6.78 | 8.84 | 10.44 | 4.89 |
Table 5.
Simple statistics of the percentage of decrease in Kt as a function of wall slope angle and number of walls.
Table 5.
Simple statistics of the percentage of decrease in Kt as a function of wall slope angle and number of walls.
| θ Change: | 90–60 | 90–30 | 60–30 | 90–60 | 90–30 | 60–30 |
|---|---|---|---|---|---|---|
| Statistical Parameter | Single Wall | Twin Walls | ||||
| Mean | 1.37 | 11.42 | 8.12 | 4.37 | 11.08 | 8.60 |
| Standard Deviation | 1.17 | 6.63 | 6.31 | 5.03 | 8.96 | 7.37 |
| Minimum | 0.03 | 0.41 | 0.03 | 0.21 | 0.40 | 0.98 |
| Maximum | 2.92 | 20.22 | 17.82 | 14.18 | 24.79 | 23.58 |
Table 6.
The maximum percentage of decrease and increase, and the average percentage of change in Kr due to addition of a second wall.
Table 6.
The maximum percentage of decrease and increase, and the average percentage of change in Kr due to addition of a second wall.
| S | P% | His/d | Maximum% of Kr Decrease | Maximum% of Kr Increase | Average% of Kr Change |
|---|---|---|---|---|---|
| 90° | 10 | 0.1284 | 5.88 | 6.22 | −1.28 |
| 60° | 10 | 0.1284 | 5.70 | 13.98 | 1.68 |
| 30° | 10 | 0.2493 | 7.06 | 1.69 | −2.94 |
| 90° | 20 | 0.1284 | 7.82 | 11.22 | −1.53 |
| 60° | 20 | 0.1284 | 5.73 | 18.24 | 2.64 |
| 30° | 20 | 0.2493 | 1.87 | 8.97 | 2.92 |
| 90° | 30 | 0.1284 | 5.65 | 5.21 | −1.60 |
| 60° | 30 | 0.1284 | 1.27 | 13.44 | 4.44 |
| 30° | 30 | 0.2493 | - | 6.29 | 3.00 |
The minus sign in the last column of Table 6 indicates an increase in Kr.
© 2020 by the authors. Licensee MDPI, Basel, Switzerland. This article is an open access article distributed under the terms and conditions of the Creative Commons Attribution (CC BY) license (http://creativecommons.org/licenses/by/4.0/).
Share and Cite
MDPI and ACS Style
Alkhalidi, M.; Alanjari, N.; Neelamani, S. Wave Interaction with Single and Twin Vertical and Sloped Slotted Walls. J. Mar. Sci. Eng. 2020, 8, 589. https://doi.org/10.3390/jmse8080589
AMA Style
Alkhalidi M, Alanjari N, Neelamani S. Wave Interaction with Single and Twin Vertical and Sloped Slotted Walls. Journal of Marine Science and Engineering. 2020; 8(8):589. https://doi.org/10.3390/jmse8080589
Chicago/Turabian StyleAlkhalidi, Mohamad, Noor Alanjari, and S. Neelamani. 2020. "Wave Interaction with Single and Twin Vertical and Sloped Slotted Walls" Journal of Marine Science and Engineering 8, no. 8: 589. https://doi.org/10.3390/jmse8080589
Note that from the first issue of 2016, this journal uses article numbers instead of page numbers. See further details here.