Comparison of Liquefied Petroleum Gas Cookstoves and Wood Cooking Fires on PM2.5 Trends in Brick Workers’ Homes in Nepal

 ,
, 
Abstract
:1. Introduction
2. Materials and Methods
2.1. Study Design
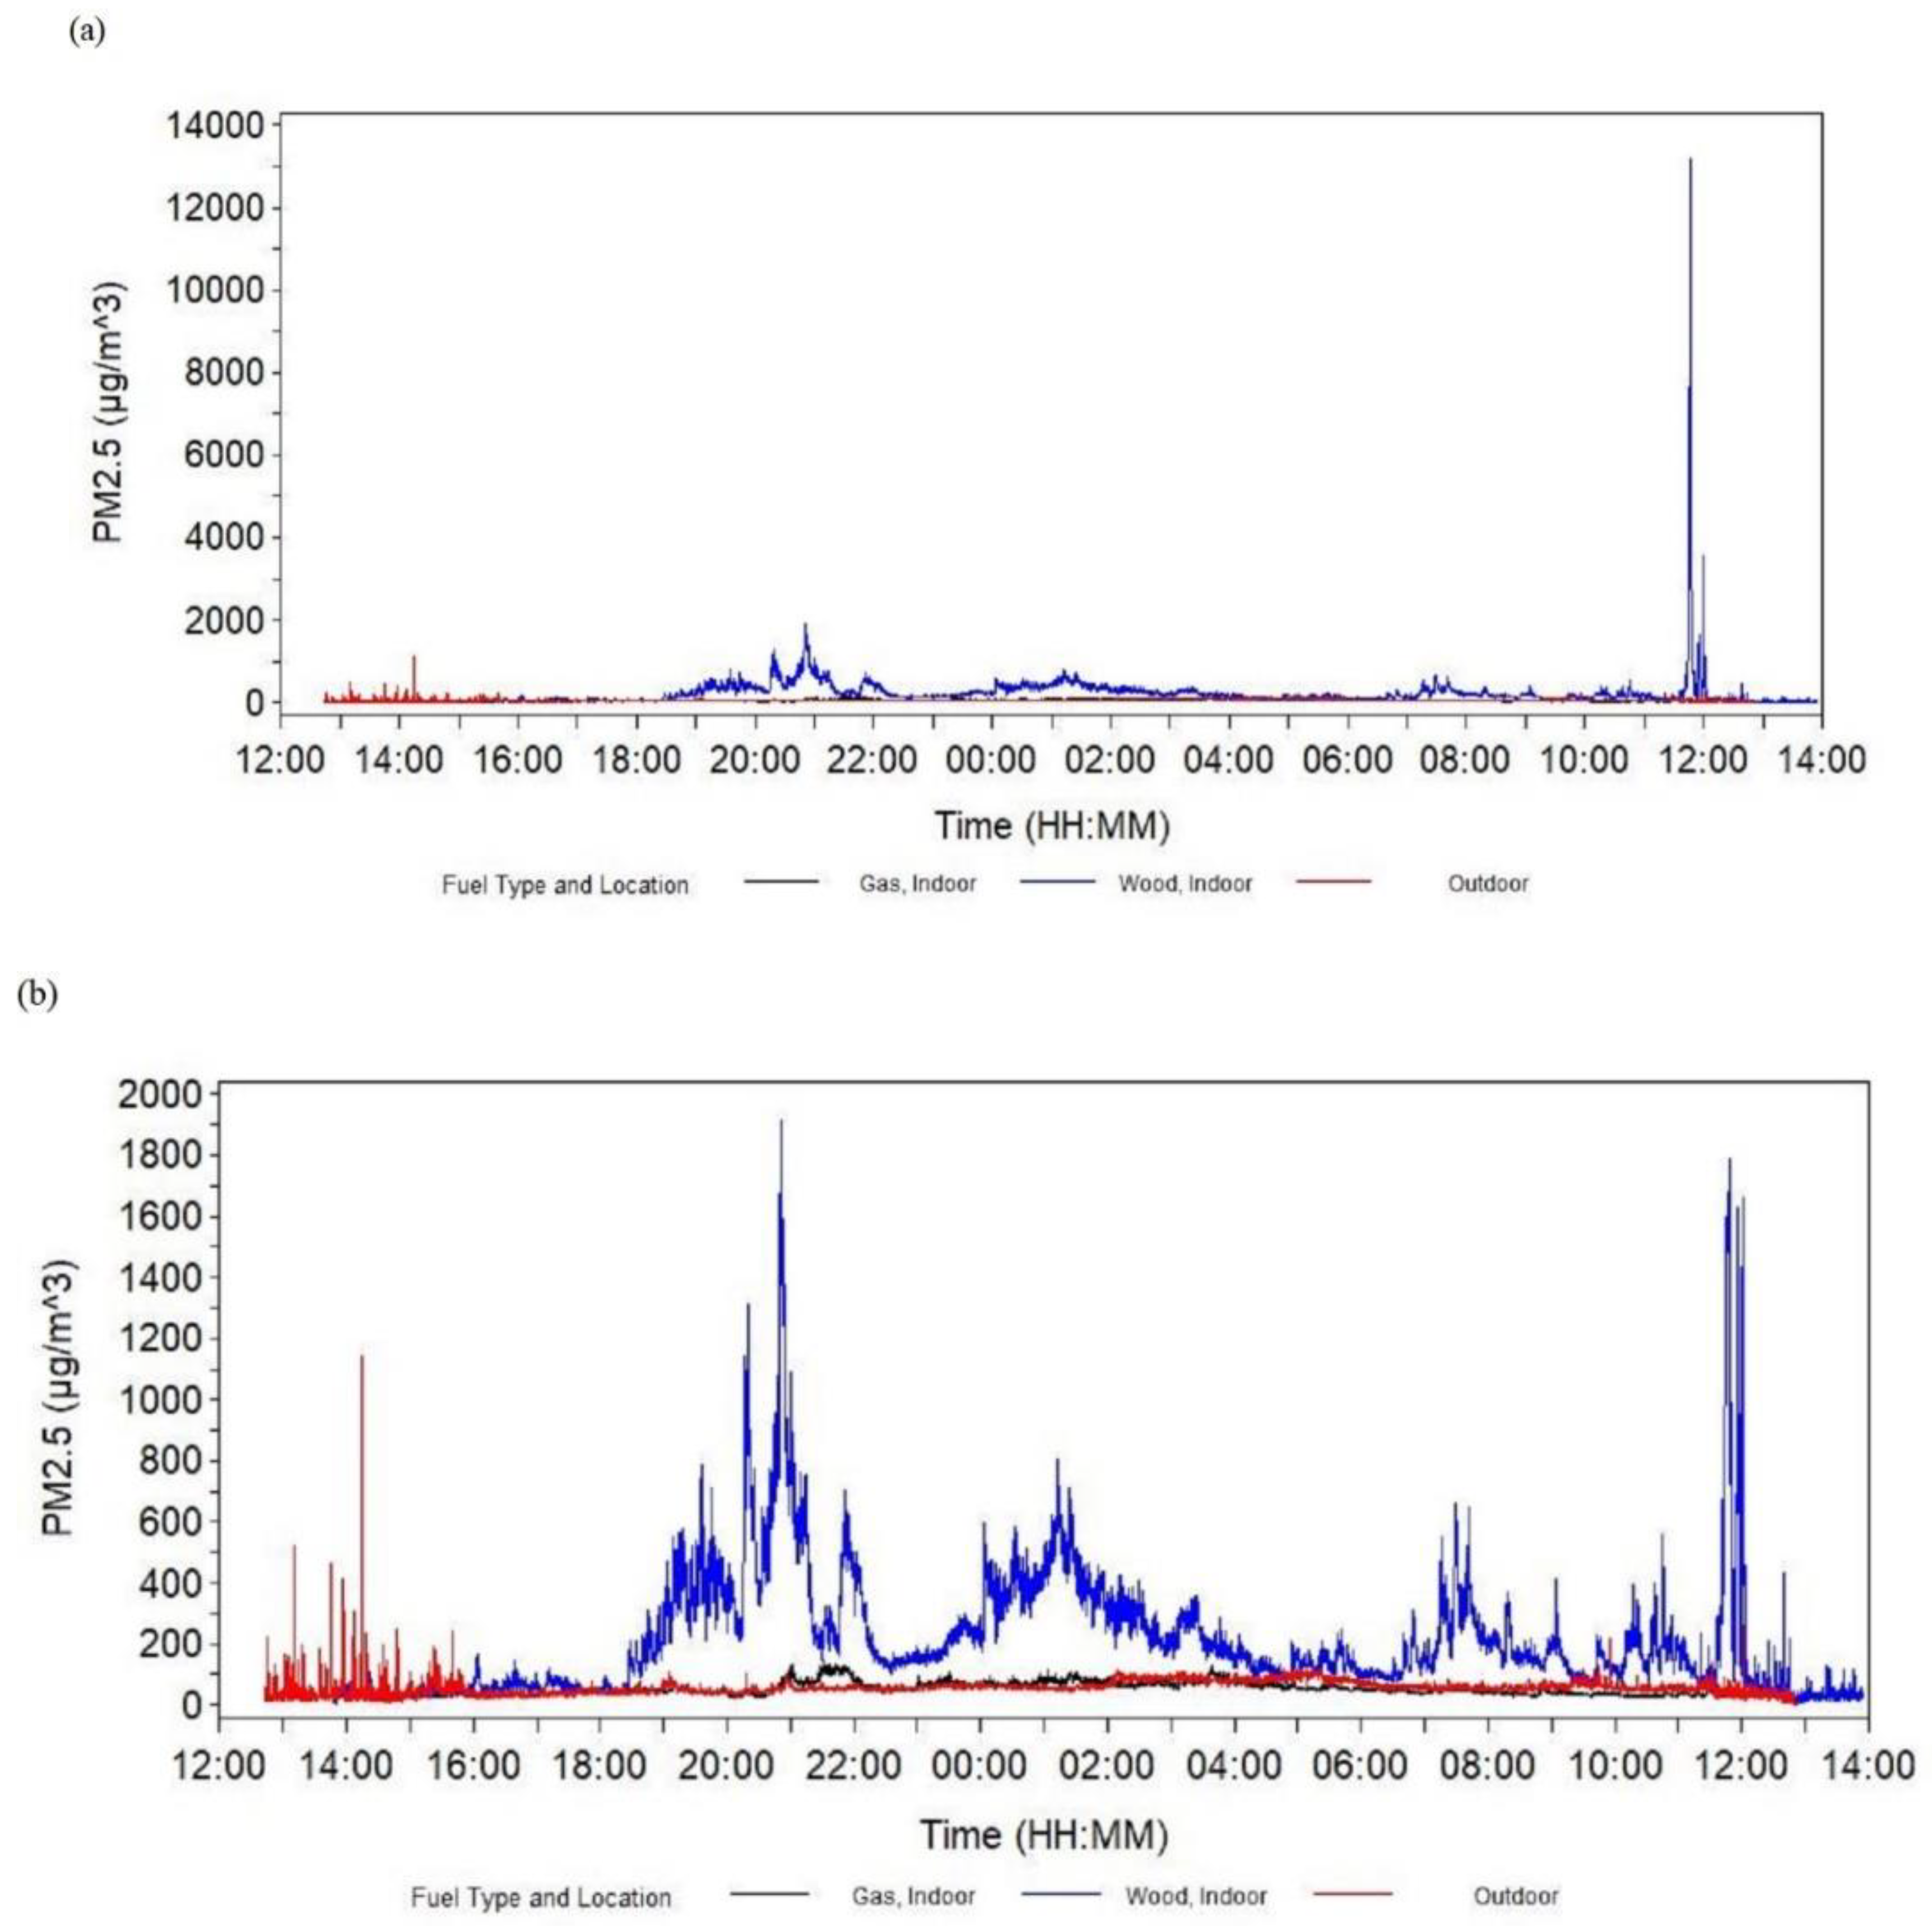
2.2. Indoor PM2.5 Measurement
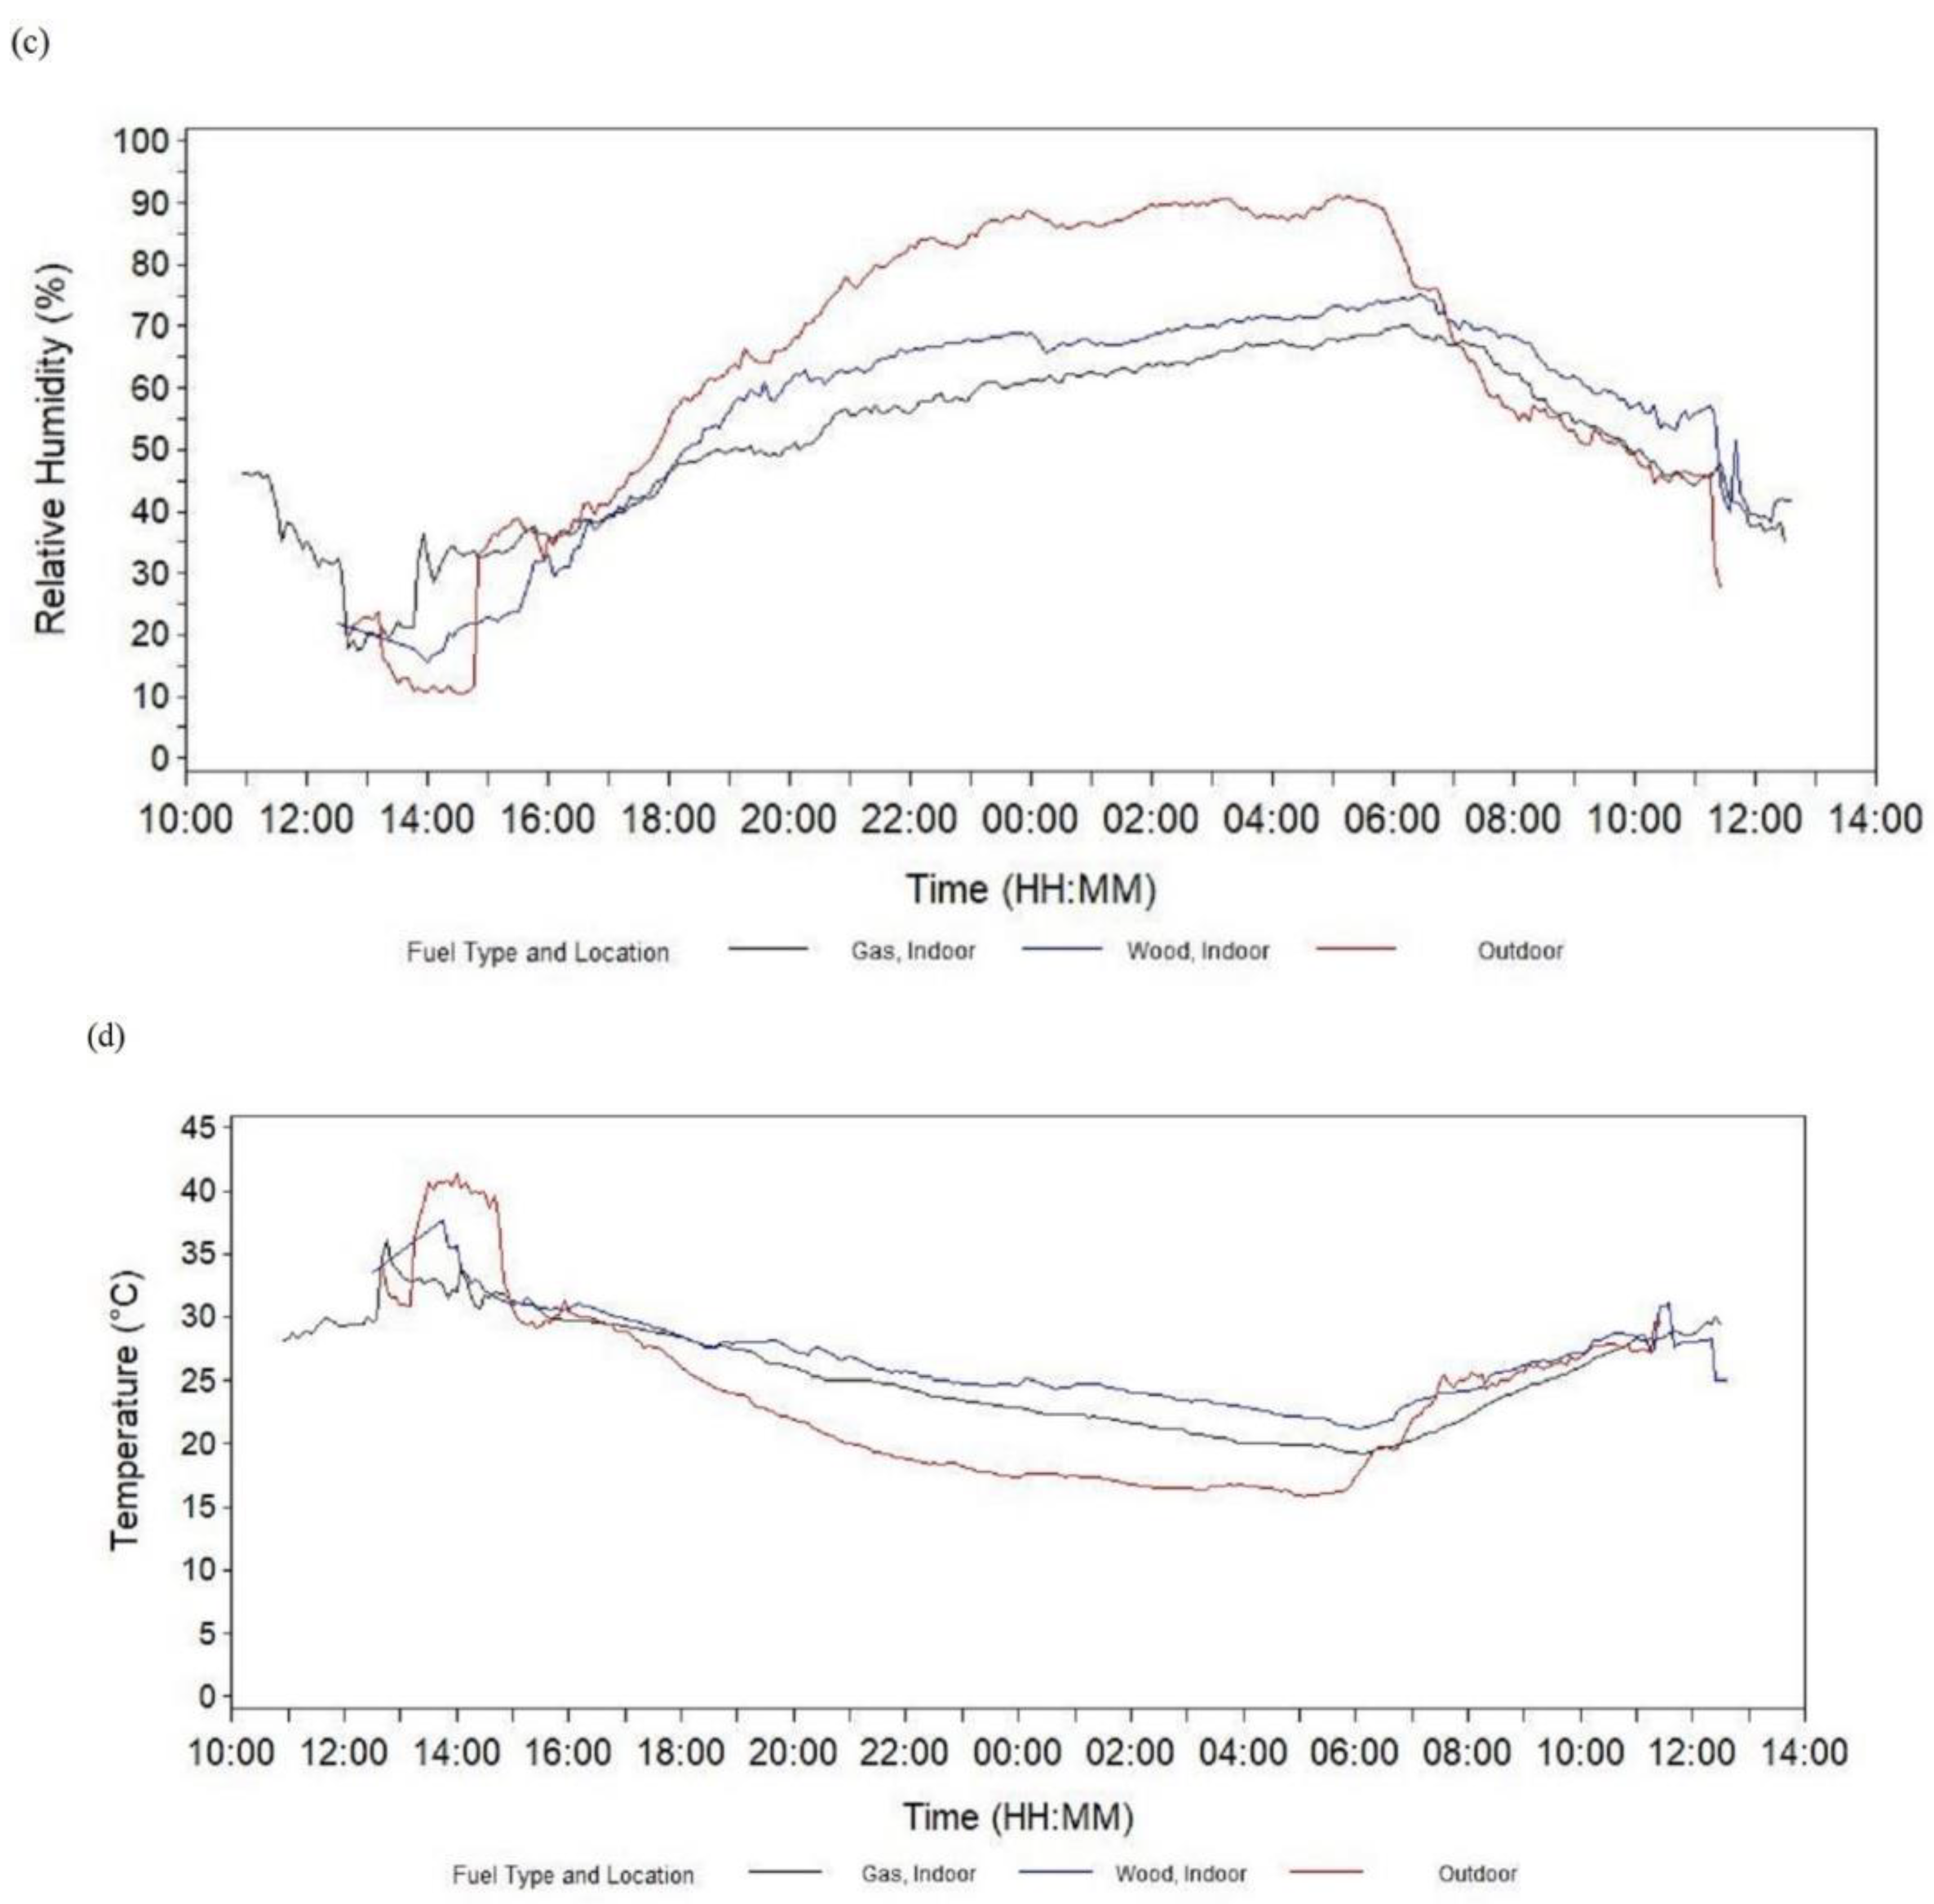
2.3. Indoor Temperature and RH Measurement
2.4. Outdoor PM2.5, Temperature, and RH Measurement
2.5. Housing Questionnaire
2.6. Statistical Analyses
3. Results
4. Discussion
Limitations
5. Conclusions
Author Contributions
Funding
Acknowledgments
Conflicts of Interest
References
- World Health Organization: Household Air Pollution and Health. Fact Sheet. Available online: http://www.who.int/en/news-room/fact-sheets/detail/household-air-pollution-and-health (accessed on 10 June 2020).
- Ezzati, M.; Kammen, D.M. Household Energy, Indoor Air Pollution and Health in Devleoping Countries: Knowledge Base for Effective Interventions. Annu. Rev. Energy Environ. 2002, 27, 233–270. [Google Scholar] [CrossRef] [Green Version]
- Zhang, J.; Smith, K.R. Indoor Air Pollution: A Global Health Concern. Br. Med. Bull. 2003, 68, 209–225. [Google Scholar] [CrossRef] [Green Version]
- Naeher, L.P.; Brauer, M.; Lipsett, M.; Zelikoff, J.T.; Simpson, C.D.; Koenig, J.Q.; Smith, K.R. Woodsmoke Health Effects: A Review. Inhal. Toxicol. 2007, 19, 67–106. [Google Scholar] [CrossRef]
- Fullerton, D.G.; Bruce, N.; Gordon, S.B. Indoor Air Pollution from Biomass Fuel Smoke is a Major Health Concern in the Developing World. Trans. R. Soc. Trop. Med. Hyg. 2008, 102, 843–851. [Google Scholar] [CrossRef] [PubMed] [Green Version]
- Zhang, J.J.; Smith, K.R. Household Air Pollution from Coal and Biomass Fuels in China: Measurements, Health Impacts, and Interventions. Environ. Health Perspect. 2007, 115, 848–855. [Google Scholar] [CrossRef]
- Kim, K.H.; Jahan, S.A.; Kabir, E. A Review of Diseases Associated with Household Air Pollution Due to the Use of Biomass Fuels. J. Hazard. Mater. 2011, 192, 425–431. [Google Scholar] [CrossRef]
- Gill, J. Improved Stoves in Developing Countries—A Critique. Energy Policy 1987, 15, 135–144. [Google Scholar] [CrossRef]
- Barnes, D.F. What Makes People Cook with Improved Biomass Stoves? A Comparative International Review of Stove Programs; World Bank: Washington, DC, USA, 1994; pp. 13–19. [Google Scholar]
- Clark, M.L.; Peel, J.L.; Balakrishnan, K.; Breysse, P.N.; Chillrud, S.N.; Naeher, L.P.; Rodes, C.E.; Vette, A.F.; Balbus, J.M. Health and Household Air Pollution from Solid Fuel Use: The Need for Improved Exposure Assessment. Environ. Health Perspect. 2013, 121, 1120–1128. [Google Scholar] [CrossRef]
- Baldwin, S.; Geller, H.; Dutt, G.; Ravindranath, N.H. Improved Woodbunning Cookstoves: Signs of Success. Ambio 1985, 14, 280–287. [Google Scholar]
- Gyawali, K.; Sharma, S.; Sharma, R.K. A Rapid Assessment of Children in the Brick Industry; World Education: Kathmandu, Nepal, 2012; Available online: http://3vvxza37b4sa2ci1ug2o2qwg-wpengine.netdna-ssl.com/wp-content/uploads/2014/02/nbnp-ra-brick-industry.pdf (accessed on 12 June 2020).
- Larmar, S.; O’Leary, P.; Chui, C.; Benfer, K.; Zug, S.; Jordan, L.P. Hazardous Child Labor in Nepal: The Case of Brick Kilns. Child Abus. Negl. 2017, 72, 312–325. [Google Scholar] [CrossRef]
- MinErgy. A Roadmap for Efficient Brick Production in Nepal. 2012. Available online: http://www.repic.ch/files/6113/7544/1756/SB_AGHH_Minergy_Road_Map.pdf (accessed on 12 June 2020).
- GEFONT. Nepal: Labour under the Chimney. A Study on the Brick Kilns of Nepal; GEFONT: Kathmandu, Nepal, 2007; p. 14. Available online: https://www.gefont.org/assets/upload/downloads/brick_klin_report_2008.pdf (accessed on 12 June 2020).
- Haack, B.N.; Khatiwada, G. Rice and Bricks: Environmental Issues and Mapping of the Unusual Crop Rotation Pattern in the Kathmandu Valley, Nepal. Environ. Manag. 2007, 39, 774–782. [Google Scholar] [CrossRef] [PubMed]
- ENPHO. A Study on Status of Brick Industry in the Kathmandu Valley; Environmental and Public Health Organization: Kathmandu, Nepal, 2001. [Google Scholar]
- Raut, A.K. Brick Kilns in Kathmandu Valley: Current Status, Environmental Impacts and Future Options. Himal. J. Sci. 2003, 1, 59–61. [Google Scholar] [CrossRef] [Green Version]
- Sanjel, S.; Khanal, S.N.; Thygerson, S.M.; Carter, W.S.; Johnston, J.D.; Joshi, S.K. Respiratory Symptoms and Illnesses Related to the Concentration of Airborne Particulate MATTER among Brick Kiln Workers in Kathmandu Valley, Nepal. Ann. Occup. Environ. Med. 2017, 29. [Google Scholar] [CrossRef] [Green Version]
- Sanjel, S.; Khanal, S.N.; Thygerson, S.M.; Carter, W.; Johnston, J.D.; Joshi, S.K. Exposure to Respirable Silica among Clay Brick Workers in Kathmandu Valley, Nepal. Arch. Environ. Occup. Health 2017, 73, 347–350. [Google Scholar] [CrossRef]
- Myers, J.E.; Lewis, P.; Hofmeyr, W. Respiratory health of brickworkers in Cape Town, South Africa. Background, Aims and Dust Exposure Determinations. Scand. J. Work Environ. Health 1989, 15, 180–187. [Google Scholar] [CrossRef] [PubMed]
- Wiecek, E.; Gościcki, J.; Indulski, J.; Stroszejn-Mrowca, G. Dust and Occupational Diseases in Brickyards. Med. Pr. 1983, 34, 35–45. [Google Scholar] [PubMed]
- Love, R.G.; Waclawski, E.R.; Maclaren, W.M.; Wetherill, G.Z.; Groat, S.K.; Porteous, R.H.; Soutar, C.A. Risks of Respiratory Disease in the Heavy Clay Industry. Occup. Environ. Med. 1999, 56, 124–133. [Google Scholar] [CrossRef] [Green Version]
- Thygerson, S.M.; Beard, J.D.; House, M.J.; Smith, R.L.; Burbidge, H.C.; Andrus, K.N.; Weber, F.X.; Chartier, R.; Johnston, J.D. Air-Quality Assessment of On-Site Brick-Kiln Worker Housing in Bhaktapur, Nepal: Chemical Speciation of Indoor and Outdoor PM 2.5 Pollution. Int. J. Environ. Res. Public Health. 2019, 16, 4114. [Google Scholar] [CrossRef] [Green Version]
- World Health Organization. WHO Indoor Air Quality Guidelines: Household Fuel Combustion; World Health Organization: Geneva, Switzerland, 2014; Available online: https://www.who.int/airpollution/guidelines/household-fuel-combustion/IAQ_HHFC_guidelines.pdf (accessed on 12 June 2020).
- Code of Federal Regulations Title 45, Part 46.102. Protection of Human Subjects; Definitions for Purposes of this Policy. Available online: https://www.ecfr.gov/cgi-bin/retrieveECFR?gp=&SID=83cd09e1c0f5c6937cd9d7513160fc3f&pitd=20180719&n=pt45.1.46&r=PART&ty=HTML#se45.1.46_1102 (accessed on 12 June 2020).
- Waldron, P.F. Principles and instrumentation for calibrating air sampling equipment. In The Occupational Environment–Its Evaluation and Control; DiNardi, R., Ed.; AIHA Press: Fairfax, VA, USA, 1997; pp. 155–175. [Google Scholar]
- Rodes, C.E. Standard Operating Procedure MicroPEM v 3.2A [Gates Foundation Version] Aerosol Exposure SOP M-300: Setup, Preparation, Calibration, Deployment, Data Processing and Servicing; RTI International: Research Triangle Park, NC, USA, 2013; pp. 1–46. [Google Scholar]
- Singh, A.; Tuladhar, B.; Bajracharya, K.; Pillarisetti, A. Assessment of Effectiveness of Improved Cook Stoves in Reducing Indoor Air Pollution and Improving Health in Nepal. Energy Sustain. Dev. 2012, 16, 406–414. [Google Scholar] [CrossRef]
- Gurung, A.; Bell, M.L. The State of Scientific Evidence on Air Pollution and Human Health in Nepal. Environ. Res. 2013, 124, 54–64. [Google Scholar] [CrossRef]
- Shrestha, I.L.; Shrestha, S.L. Indoor Air Pollution from Biomass Fuels and Respiratory Health of the Exposed Population in Nepalese Households. Int. J. Occup. Environ. Health 2005, 11, 150–160. [Google Scholar] [CrossRef] [PubMed]
- Sanjel, S.; Thygerson, S.M.; Khanal, S.N.; Joshi, S.K. Environmental and Occupational Pollutants and their Effects on Health among Brick Kiln Workers. Open J. Saf. Sci. Technol. 2016, 6, 81–98. [Google Scholar] [CrossRef] [Green Version]
- Saud, B.; Paudel, G. The Threat of Ambient Air Pollution in Kathmandu, Nepal. J. Environ. Public Health 2018, 2018. [Google Scholar] [CrossRef] [Green Version]
- Shakya, K.M.; Rupakheti, M.; Shahi, A.; Maskey, R.; Pradhan, B.; Panday, A.; Puppala, S.P.; Lawrence, M.; Peltier, R.E. Near-Road Sampling of PM2.5, BC, and Fine-Particle Chemical Components in Kathmandu Valley, Nepal. Atmos. Chem. Phys. 2017, 17. [Google Scholar] [CrossRef] [Green Version]
- Aryal, R.K.; Lee, B.K.; Karki, R.; Gurung, A.; Baral, B.; Byeon, S.H. Dynamics of PM2.5 Concentrations in Kathmandu Valley, Nepal. J. Hazard. Mater. 2009, 168. [Google Scholar] [CrossRef]
- Bhandari, R.; Pandit, S. Electricity as a Cooking Means in Nepal—A Modelling Tool Approach. Sustainability 2018, 10, 2841. [Google Scholar] [CrossRef] [Green Version]
- Malla, S. Household Energy Consumption Patterns and its Environmental Implications: Assessment of Energy Access and Poverty in Nepal. Energy Policy 2013, 61, 990–1002. [Google Scholar] [CrossRef]
- Parajuli, R.; Østergaard, P.A.; Dalgaard, T.; Pokharel, G.R. Energy Consumption Projection of Nepal: An Economic Approach. Renew. Energy 2014, 63, 432–444. [Google Scholar] [CrossRef]
- Medina, P.; Berrueta, V.; Cinco, L.; Ruiz-Garcia, V.; Edwards, R.; Olaya, B.; Schilmann, A.; Masera, O. Understanding Household Energy Transitions: From Evaluating singLe Cookstoves to “Clean Stacking” Alternatives. Atmosphere 2019, 10, 693. [Google Scholar] [CrossRef] [Green Version]
- Perez-Warnisher, M.T.; de Miguel, M.D.P.C.; Seijo, L.M. Tobacco Use Worldwide: Legislative Efforts to Curb Consumption. Ann. Glob. Health 2019, 85, 9. [Google Scholar] [CrossRef] [Green Version]
- Shrestha, N.; Mehata, S.; Pradhan, P.M.S.; Joshi, D.; Mishra, S.R. A nationally Representative Study on Socio-Demographic and Geographic Correlates, and Trends in Tobacco Use in Nepal. Sci. Rep. 2019, 9, 2682. [Google Scholar] [CrossRef] [PubMed] [Green Version]
- Bhatta, D.N.; Crosbie, E.; Bialous, S.A.; Glantz, S. Defending Comprehensive Tobacco Control Policy Implementation in Nepal from Tobacco Industry Interference (2011–2018). Nicotine Tob. Res. 2020. [Google Scholar] [CrossRef] [PubMed]
- Chang, C.P.; Siwakoti, B.; Sapkota, A.; Gautam, D.K.; Lee, Y.C.A.; Monroe, M.; Hashibe, M. Tobacco Smoking, Chewing Habits, Alcohol Drinking and the Risk of Head and Neck Cancer in Nepal. Int. J. Cancer 2019, 147, 866–875. [Google Scholar] [CrossRef]
- van den Brand, F.A.; Nagelhout, G.E.; Winkens, B.; Chavannes, N.H.; van Schayck, O.C. Effect of a Workplace-Based Group Training Programme Combined with Financial Incentives on Smoking Cessation: A Cluster-Randomised Controlled Trial. Lancet Public Health 2018, 3, e536–e544. [Google Scholar] [CrossRef] [Green Version]
- Cahill, K.; Lancaster, T. Workplace Interventions for Smoking Cessation. Cochrane Database Syst. Rev. 2014, 2. [Google Scholar] [CrossRef]
- Arlian, L.G.; Veselic, M.M. Reevaluation of the Humidity Requirements of the House Dust Mite Dermatophagoides farinae (Acari: Pyroglyphidae). J. Med. Entomol. 1981, 18, 351–352. [Google Scholar] [CrossRef]
- Arlian, L.G.; Platts-Mills, T.A.E. The Biology of Dust Mites and the Remediation of Mite Allergens in Allergic Disease. J. Allergy Clin. Immunol. 2001, 107, S406–S413. [Google Scholar] [CrossRef] [PubMed]
- Sporik, R.; Holgate, S.T.; Plattsmills, T.A.E.; Cogswell, J.J. Exposure to House-Dust Mite Allergen (Der-P-I) and the Development of Asthma in Childhood—A Prospective Study. N. Engl. J. Med. 1990, 323, 502–507. [Google Scholar] [CrossRef]
- Portnoy, J.; Miller, J.D.; Williams, P.B.; Chew, G.L.; Miller, J.D.; Zaitoun, F.; Phipatanakul, W.; Kennedy, K.; Barnes, C.; Grimes, C.; et al. Environmental Assessment and Exposure Control of Dust Mites: A Practice Parameter. Ann. Allergy Asthma Immunol. 2013, 111, 465–507. [Google Scholar] [CrossRef] [Green Version]
- Lodge, C.J.; Lowe, A.J.; Gurrin, L.C.; Hill, D.J.; Hosking, C.S.; Khalafzai, R.U.; Hopper, J.L.; Matheson, M.C.; Abramson, M.J.; Allen, K.J.; et al. House Dust Mite Sensitization in Toddlers Predicts Current Wheeze at Age 12 Years. J. Allergy Clin. Immunol. 2011, 128, 782–788. [Google Scholar] [CrossRef]


| Characteristic | Homes, n (%) | Missing, n | Mean | SD | Min | Q1 | Median | Q3 | Max |
|---|---|---|---|---|---|---|---|---|---|
| Total | 19 (100) | ||||||||
| Home area, m2 | 11.30 | 5.63 | 5.41 | 8.03 | 10.25 | 11.60 | 31.40 | ||
| Number of people in home | 3.42 | 1.43 | 1.00 | 2.00 | 4.00 | 4.00 | 7.00 | ||
| Occupant density, number of people/100 m2 | 33.25 | 15.69 | 9.55 | 24.91 | 29.70 | 39.03 | 73.96 | ||
| Number of children in home | |||||||||
| 0-1 | 10 (53) | ||||||||
| 2-3 | 9 (47) | ||||||||
| Smokers in home | 2 | ||||||||
| No | 8 (47) | ||||||||
| Yes | 9 (53) | ||||||||
| Number of smokers in home | 2 | 0.76 | 1.03 | 0.00 | 0.00 | 1.00 | 1.00 | 4.00 | |
| Fuel type | 1 | ||||||||
| Gas | 12 (67) | ||||||||
| Wood | 6 (33) |
| Variable | Samples, n | Missing, n | Mean | SD | Min | Q1 | Median | Q3 | Max |
|---|---|---|---|---|---|---|---|---|---|
| PM2.5, μg/m3 | 20 | 3 | 272.13 | 389.54 | 19.37 | 58.73 | 118.46 | 278.49 | 1384.44 |
| Relative humidity, % | 23 | 57.87 | 6.37 | 46.52 | 52.66 | 58.39 | 60.47 | 73.70 | |
| Temperature, °C | 23 | 24.58 | 1.66 | 20.66 | 23.72 | 24.88 | 25.89 | 26.87 |
| Characteristic | PM2.5, μg/m3 | Relative Humidity, % | Temperature, °C | ||||||
|---|---|---|---|---|---|---|---|---|---|
| GM b | 95% CI b | p-Value b | Mean c | 95% CI c | p-Value c | Mean c | 95% CI c | p-Value c | |
| Home area, m2 | 0.97 d | 0.87, 1.08 d | 0.54 | 0.01 e | −0.37, 0.40 e | 0.95 | −0.03 e | −0.13, 0.07 e | 0.58 |
| Number of people in home | 0.88 d | 0.58, 1.35 d | 0.54 | −1.04 e | −2.47, 0.39 e | 0.14 | 0.01 e | −0.39, 0.41 e | 0.96 |
| Occupant density, number of people/100 m2 | 1.01 d | 0.97, 1.05 d | 0.48 | −0.04 e | −0.18, 0.10 e | 0.54 | 0.02 e | −0.02, 0.05 e | 0.30 |
| Number of children in home | |||||||||
| 0–1 | 160.57 | 70.82, 364.06 | 57.13 | 54.40, 59.87 | 25.26 | 24.50, 26.02 | |||
| 2–3 | 150.18 | 56.46, 399.50 | 0.91 | 54.21 | 51.32, 57.10 | 0.14 | 24.93 | 24.13, 25.73 | 0.54 |
| Smokers in home | |||||||||
| No | 61.65 | 36.05, 105.43 | 54.16 | 50.86, 57.45 | 24.58 | 23.82, 25.34 | |||
| Yes | 301.35 | 176.20, 515.37 | 0.0005 | 56.91 | 53.80, 60.02 | 0.21 | 25.63 | 24.91, 26.35 | 0.05 |
| Number of smokers in home | 1.74 d | 1.08, 2.81d | 0.03 | 1.19 e | −1.10, 3.48 e | 0.29 | 0.55 e | 0.04, 1.06 e | 0.04 |
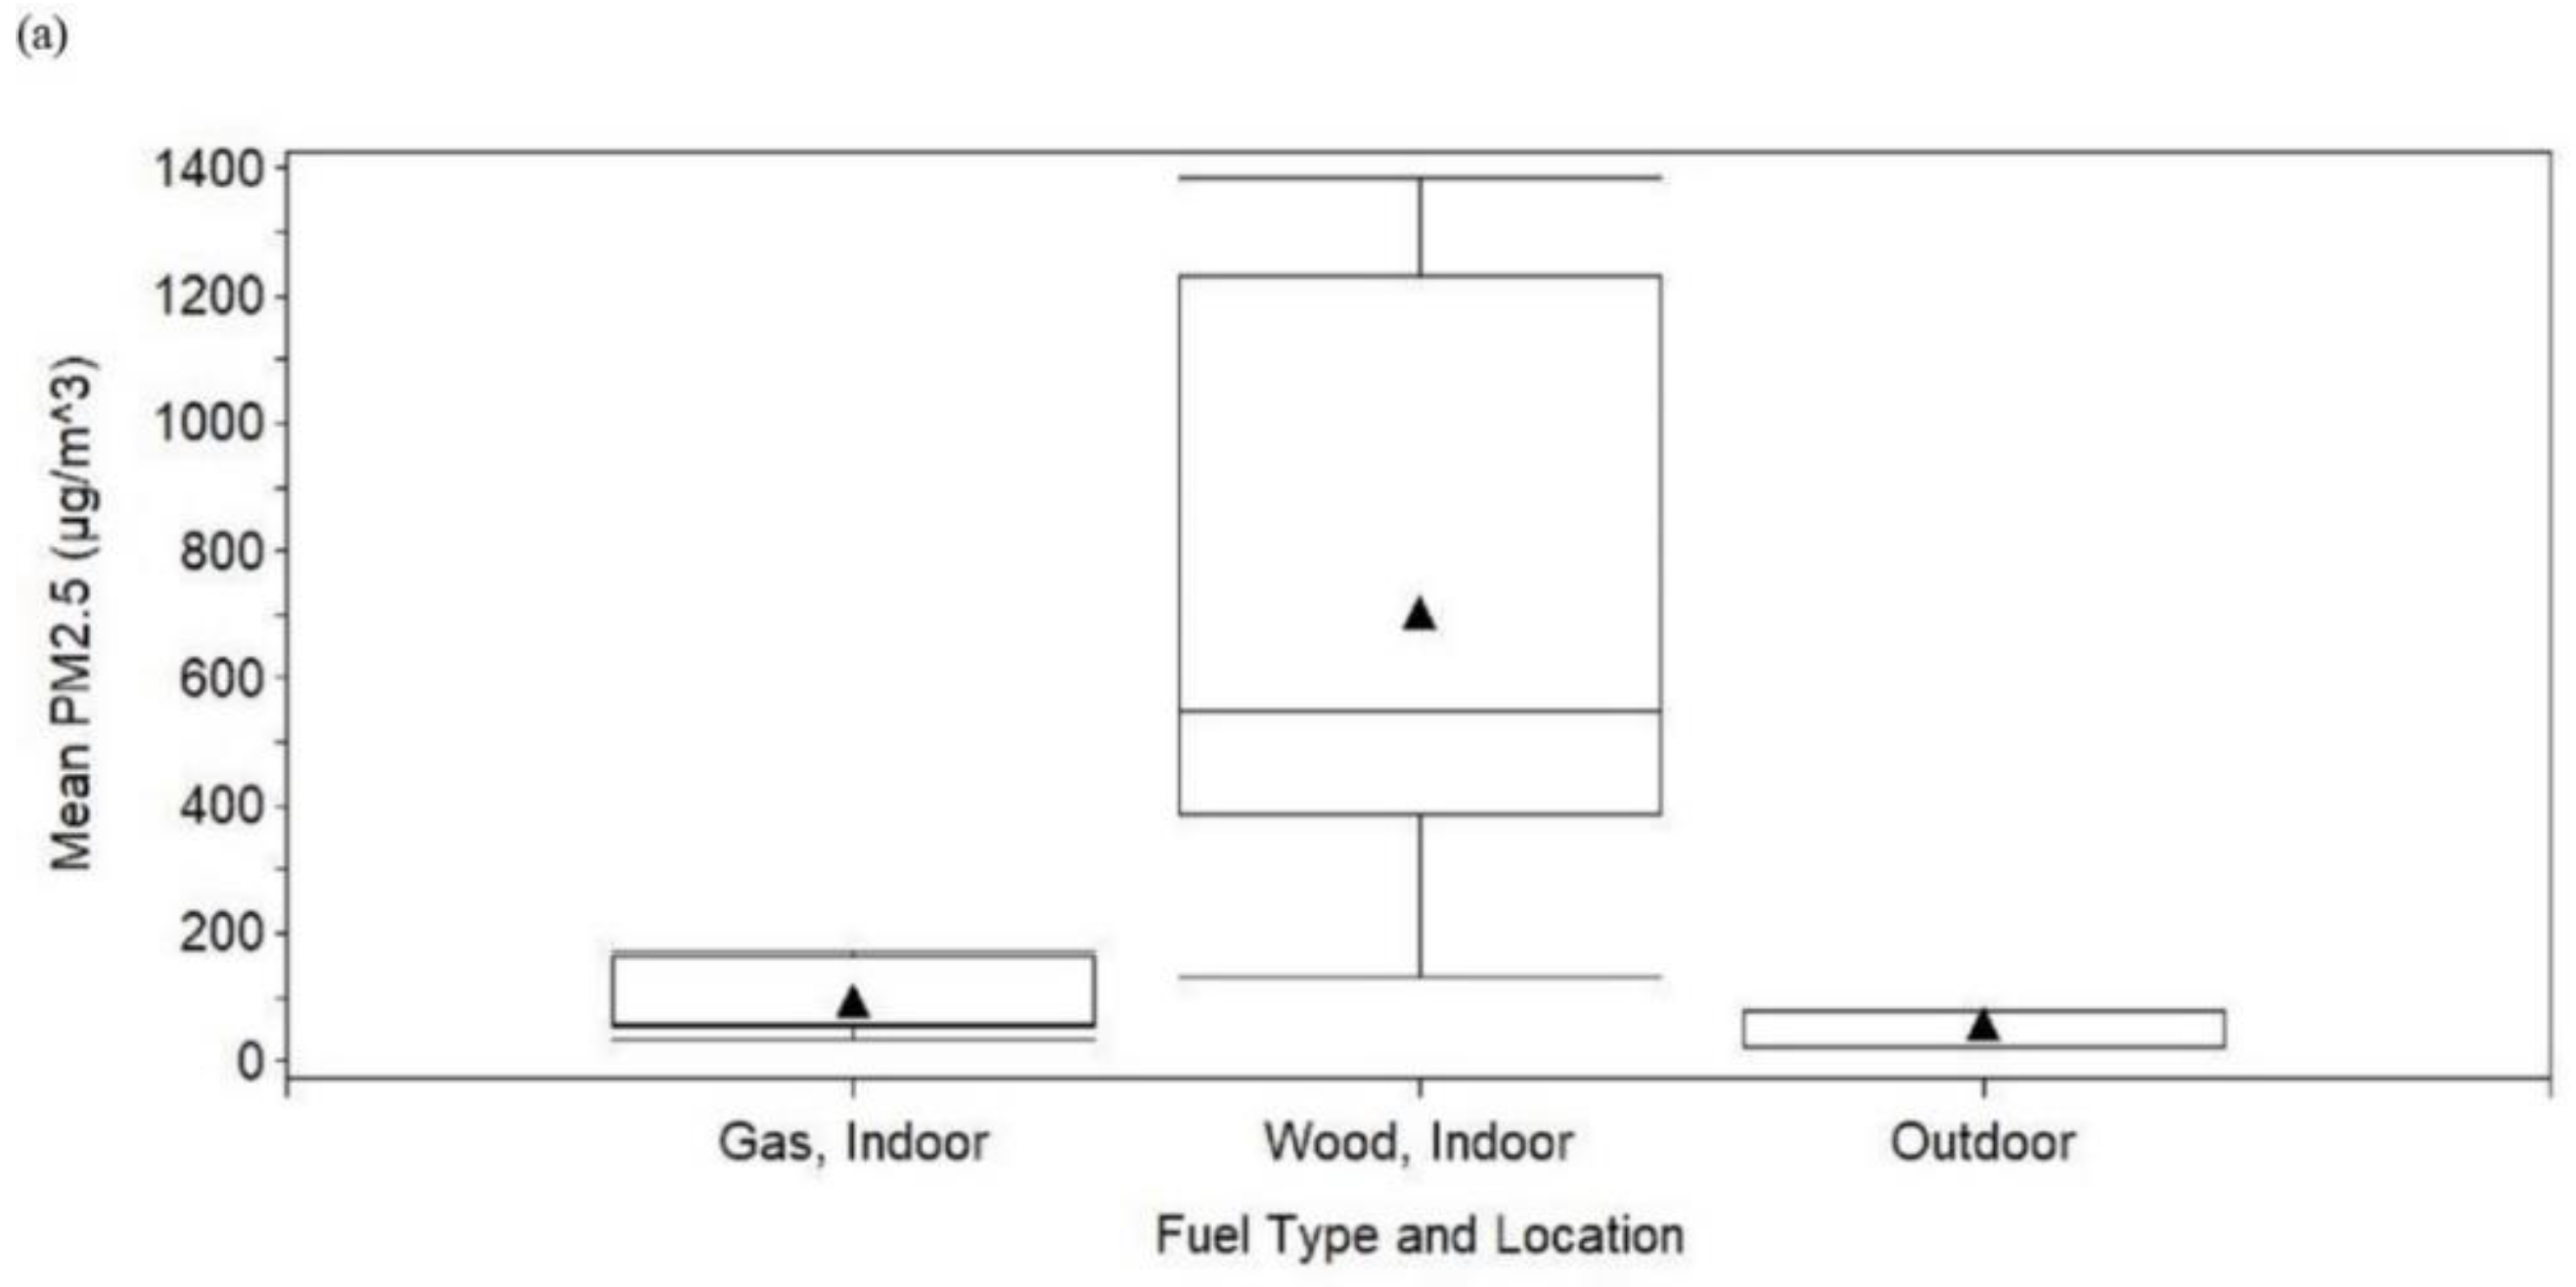
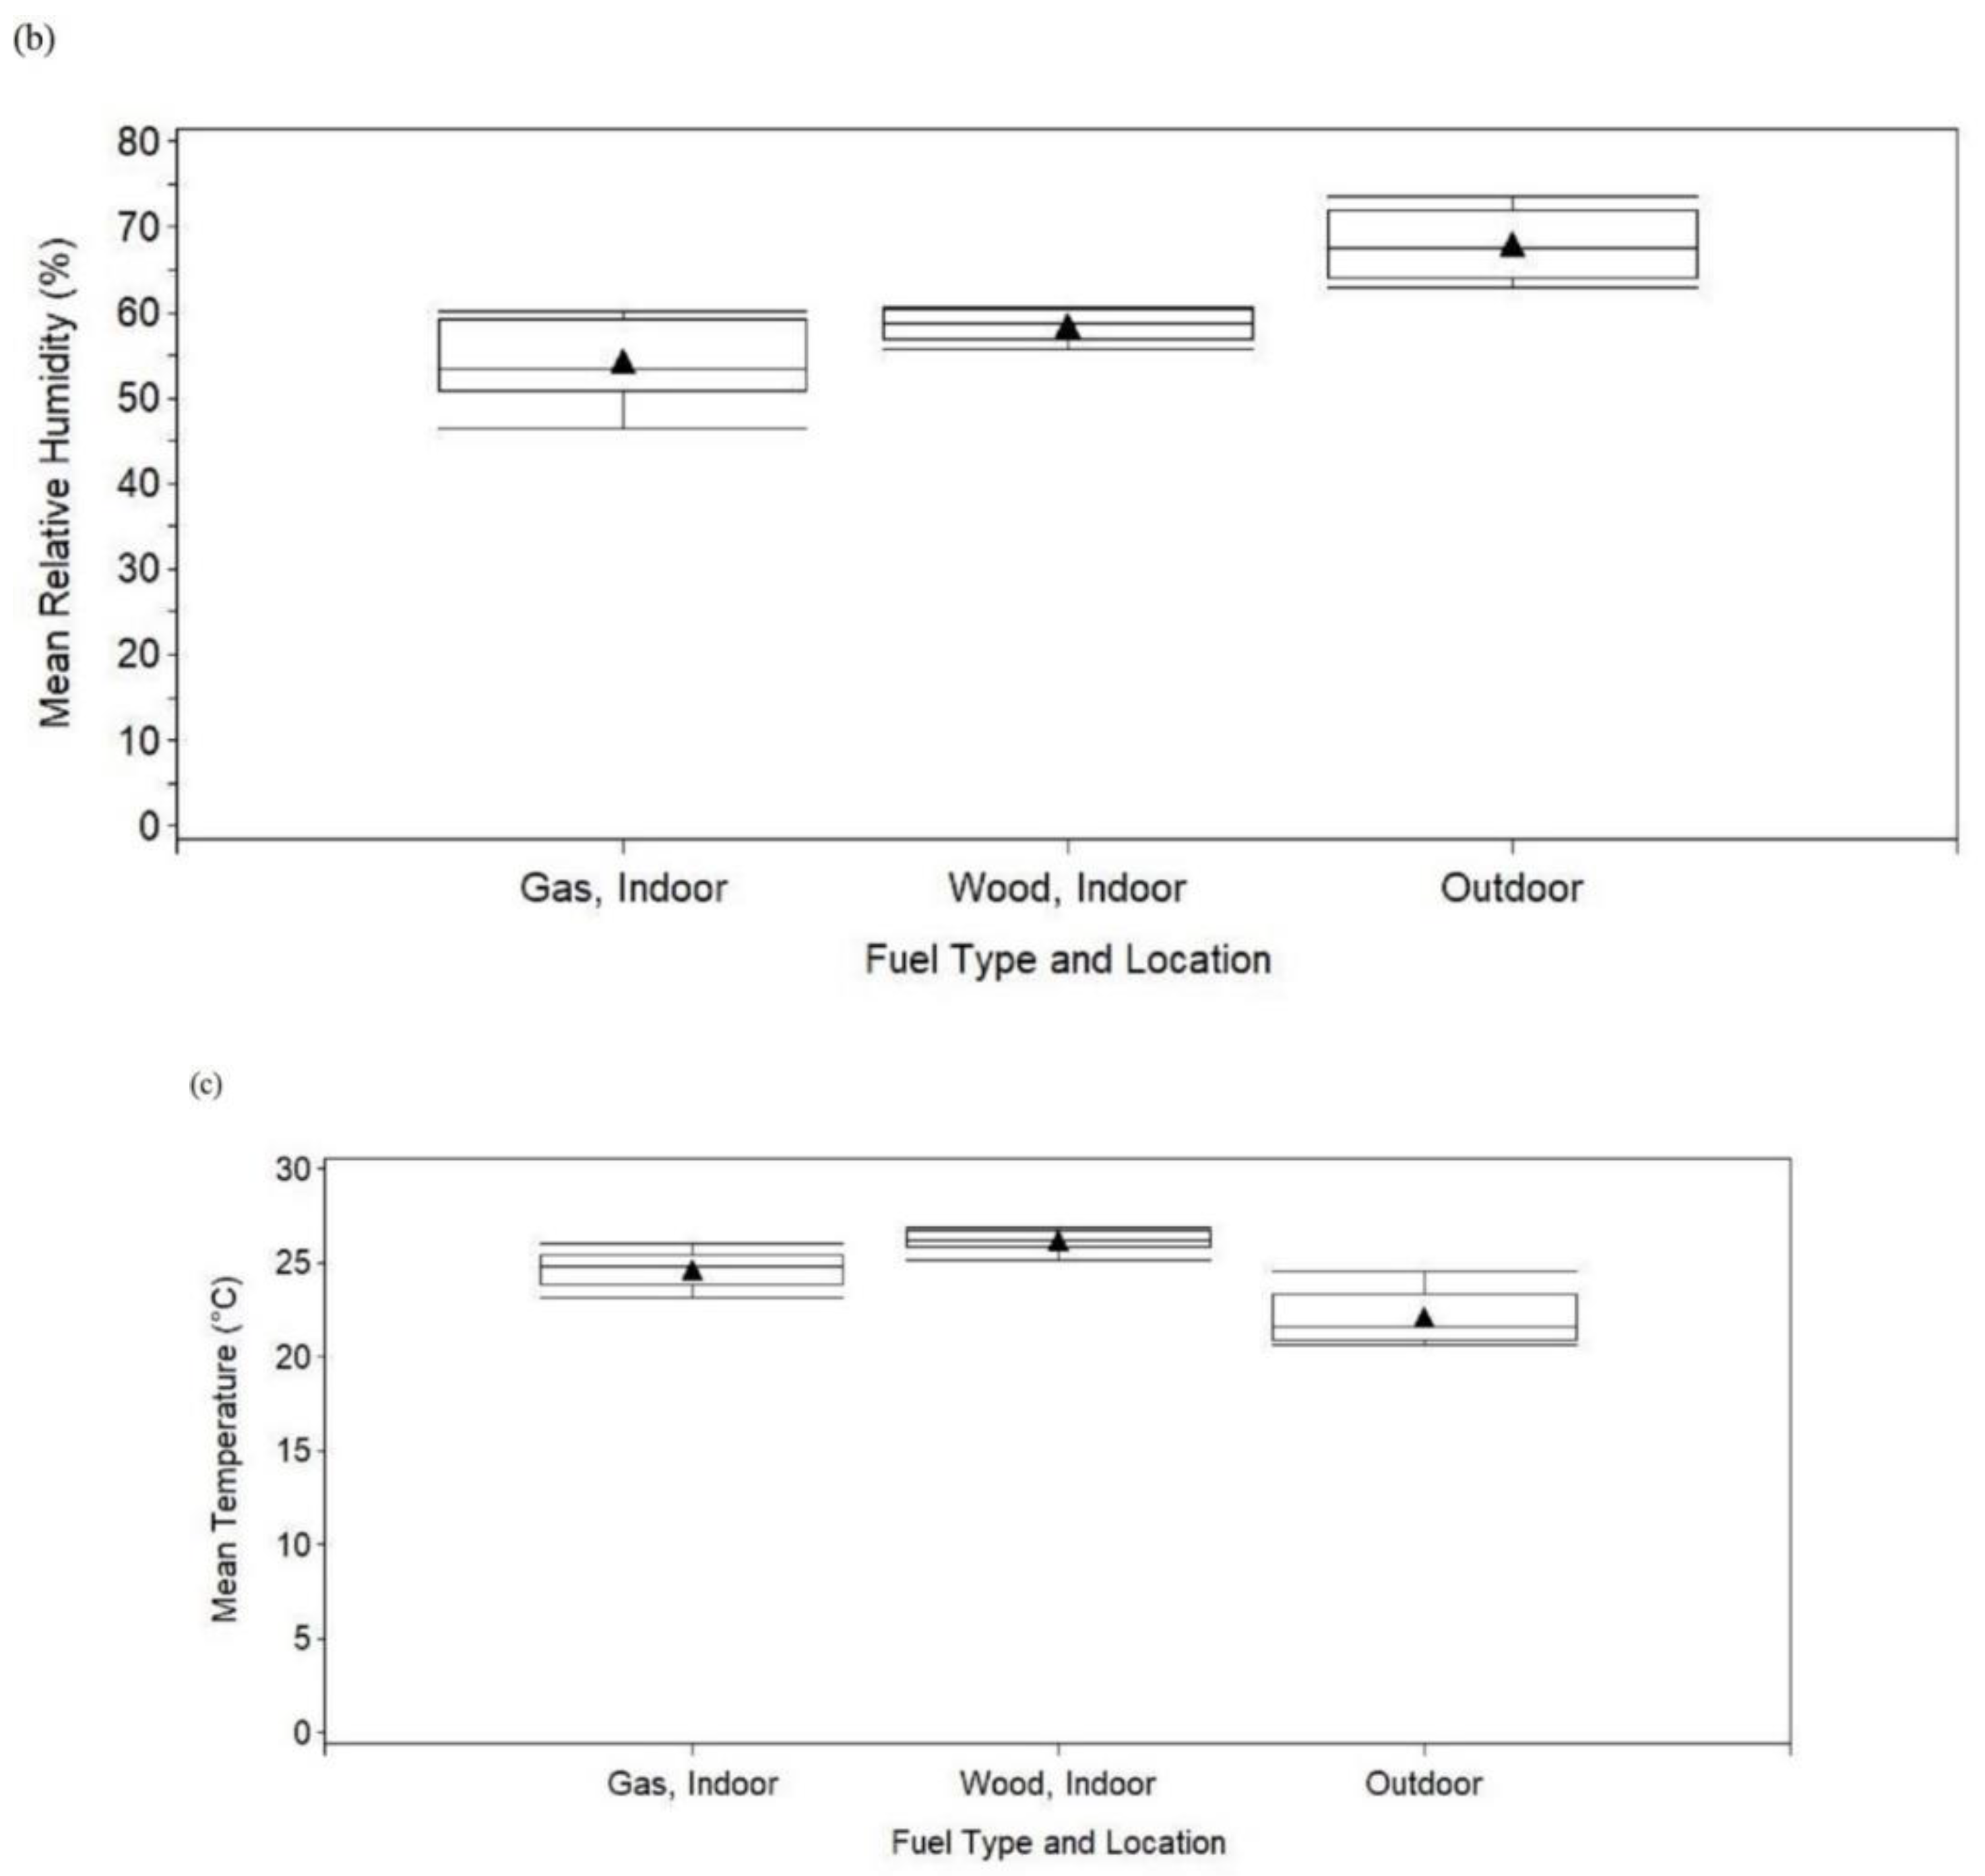
| Fuel type and location | |||||||||
| Gas, indoor | 79.32 | 49.82, 126.28 | 54.40 | 51.88, 56.92 | 24.67 | 24.04, 25.29 | |||
| Wood, indoor | 541.14 | 288.31, 1015.68 | 58.51 | 54.94, 62.07 | 26.20 | 25.32, 27.08 | |||
| Outdoor | 48.38 | 19.86, 117.87 | <0.0001 f | 67.97 | 63.60, 72.33 | <0.0001 g | 22.11 | 21.04, 23.19 | <0.0001 h |
© 2020 by the authors. Licensee MDPI, Basel, Switzerland. This article is an open access article distributed under the terms and conditions of the Creative Commons Attribution (CC BY) license (http://creativecommons.org/licenses/by/4.0/).
Share and Cite
Johnston, J.D.; Hawks, M.E.; Johnston, H.B.; Johnson, L.A.; Beard, J.D. Comparison of Liquefied Petroleum Gas Cookstoves and Wood Cooking Fires on PM2.5 Trends in Brick Workers’ Homes in Nepal. Int. J. Environ. Res. Public Health 2020, 17, 5681. https://doi.org/10.3390/ijerph17165681
Johnston JD, Hawks ME, Johnston HB, Johnson LA, Beard JD. Comparison of Liquefied Petroleum Gas Cookstoves and Wood Cooking Fires on PM2.5 Trends in Brick Workers’ Homes in Nepal. International Journal of Environmental Research and Public Health. 2020; 17(16):5681. https://doi.org/10.3390/ijerph17165681
Chicago/Turabian StyleJohnston, James D., Megan E. Hawks, Haley B. Johnston, Laurel A. Johnson, and John D. Beard. 2020. "Comparison of Liquefied Petroleum Gas Cookstoves and Wood Cooking Fires on PM2.5 Trends in Brick Workers’ Homes in Nepal" International Journal of Environmental Research and Public Health 17, no. 16: 5681. https://doi.org/10.3390/ijerph17165681