 Douglas Mariani Zeffa1,2,3*
 Vânia Moda-Cirino1Isabella Arruda Medeiros1,2,3
 Gustavo Henrique Freiria3José dos Santos Neto1
 Suzana Tiemi Ivamoto-Suzuki3
 Jéssica Delfini1,3
 Carlos Alberto Scapim2
 Leandro Simões Azeredo Gonçalves2,3*
- 1Área de Genética e Melhoramento Vegetal, Instituto de Desenvolvimento Rural do Paraná, Londrina, Brazil
- 2Departamento de Agronomia, Universidade Estadual de Maringá, Maringá, Brazil
- 3Laboratório de Ecofisiologia e Biotecnologia Agrícola, Departamento de Agronomia, Universidade Estadual de Londrina, Londrina, Brazil
Common bean (Phaseolus vulgaris L.) is one of the most important crops worldwide and is considered an essential source of proteins, fibers, and minerals in the daily diet of several countries. Nitrogen (N) is considered the most important nutrient for common bean crop. On the other hand, the reduction of chemical fertilizers is a global challenge, and the development of cultivars with more N use efficiency (NUsE) is considered one of the main strategies to reduce the amount of N fertilizers. Genetic progress of NUsE has been reported in several crops; however, there was still no quantity in common bean. In this study, our goal was to analyze the genetic progress of seed yield (SY) and NUsE-related traits of 40 carioca common bean cultivars release from 1970 to 2017 in eight environments under low (zero) or high N (40 kg ha−1) in top-dressing. Genetic progress, principal component analysis, correlations among traits, and cultivar stability were analyzed using Bayesian approaches. The lowest values of the deviance information criterion (DIC) for the full model tested indicated the presence of the genotype × N × environment interaction for all evaluated traits. Nitrogen utilization efficiency (NUtE) and nitrogen uptake efficiency (NUpE) were the traits that most contributed to discriminate cultivars. The genetic progress of SY under high N (0.53% year−1, 95% HPD = 0.39; 0.65% year−1) was similar to that obtained in low N conditions (0.48% year−1, 95% HPD = 0.31; 0.64% year−1). These results indicate that modern cultivars do not demand more N fertilizers to be more productive. In addition, we observed a high genetic variability for NUsE-related traits, but there was no genetic progress for these variables. SY showed negative correlation with seed protein content (Prot) in both N conditions, and there was no reduction in Prot in modern cultivars. Both modern and old cultivars showed adaptability and stability under contrasting N conditions. Our study contributed to improve our knowledge about the genetic progress of common bean breeding program in Brazil in the last 47 years, and our data will help researchers to face the challenge of increase NUsE and Prot in the next few years.
Introduction
Common bean (Phaseolus vulgaris L.) is considered the main legume species for human consumption and represents an essential source of proteins, carbohydrates, fibers, and trace minerals in several countries worldwide (Myers and Kmiecik, 2017). Brazil is one of the main world producers and consumers of common beans. In 2019, it produced about 2,360 tons of seeds in an area of 1,619 ha (CONAB, 2020a). Common bean is a basic food used daily in the Brazilian diet with a consumption of 17 kg person−1 year−1 (Ribeiro et al., 2020). To meet this demand, common beans are grown throughout the all year under different cultivation systems and with different technological levels (Heinemann et al., 2016). In general, Brazilian consumers prefer the Mesoamerican carioca (cream seed coat with brown stripes) and black beans, which represent around 70 and 15% of total common bean production, respectively (Pereira et al., 2019).
Although Brazilian common bean production has grown in recent decades, the cultivated area has decreased considerably since 1990 (Supplementary Figure 1). This increase in Brazilian production is mainly due to the use of chemical fertilizers, the adoption of new production technologies, and the release of more productive cultivars (Tsutsumi et al., 2015). According to the Ministry of Agriculture, Livestock, and Food Supply (MAPA, 2020), more than 350 bean cultivars are registered in Brazil, developed mainly by public research institutes, such as the Brazilian Agricultural Research Corporation (Embrapa) (Lopes et al., 2012), Instituto de Desenvolvimento Rural do Paraná–IAPAR–EMATER (IDR-Paraná) (Moda-Cirino et al., 2012), and Instituto Agronômico de Campinas (IAC) (Carbonell et al., 2012).
Common bean plants can fix atmospheric nitrogen (N2) interacting symbiotically with Rhizobium genus bacteria (Appelbaum, 2018). This symbiotic process (biological nitrogen fixation—BNF) is responsible for around 40% and chemical fertilizer for 60% of the total nitrogen (N) demand for this crop (Argaw et al., 2015; Dwivedi et al., 2015). N is the most important macronutrient influencing common bean yield (Barros et al., 2018). Therefore, the development of cultivars that have greater N use efficiency (NUsE) is considered one of the main strategies to reduce the amount of chemical fertilizers in sustainable farming systems (Mueller et al., 2019).
NUsE can be divided into two components (Moll et al., 1982): (i) N utilization efficiency (NUtE) which is the capacity of the plant to convert N into seed biomass; and (ii) N uptake efficiency (NUpE) which means the capacity of the plant to absorb N from the soil. In legume crops, NUpE is based on the N acquisition from the soil and efficiency of the BNF process (Diacono et al., 2019). Several studies have already described the importance of BNF for common beans; however, studies related to NUsE components are still scarce (Farid et al., 2017; Kamfwa et al., 2019).
Information on the quantification of genetic progress for any crop is important for plant breeders, allowing them to design future breeding program strategies (Stahl et al., 2017; de Faria et al., 2018). In Brazil, genetic progress studies related to common bean seed yield have been extensively reported (Chiorato et al., 2010; de Faria et al., 2013; Barili et al., 2016), but there is no study combining information on the genetic progress of seed yield and NUsE under N contrasting conditions. In addition, a negative correlation between seed yield and protein content (Prot) may have caused its decrease over the years as reported in wheat (Laidig et al., 2017). In the face of this challenge, the question arises whether or not breeding is directing NUsE and Prot improvement.
Bayesian methods have been increasingly used in plant breeding studies (da Silva et al., 2020; Nascimento et al., 2020). The fundamental idea of the Bayesian approach is to describe all uncertainty and variation using probability distributions. Bayesian analysis offers the ability to utilize data containing unbalanced structures, select and study complex models, obtain more precise credibility intervals, and incorporate a priori information (Aczel et al., 2020). In this way, our main goal was to quantify the genetic progress of seed yield and NUsE-related traits in Brazilian carioca common bean cultivars using Bayesian approaches. Our hypothesis was that modern cultivars are more responsive and have improved NUsE when compared to cultivars released in the past since breeding programs are evaluating and selecting superior genotypes under N top-dressing.
Material and Methods
Plant Material
Forty Brazilian carioca common bean cultivars released from 1970 to 2017 and registered in the National Register of Cultivars of the Brazilian Ministry of Agriculture, Livestock, and Food Supply (RNC-MAPA) were evaluated (Table 1). These cultivars represent a large part of the genetic variability that exists between carioca common bean cultivars grown during the approximately 50 years of history of carioca common bean breeding in Brazil. Seed samples were obtained from the Gene Bank of the Instituto de Desenvolvimento Rural do Paraná (IDR-Paraná), Londrina, Brazil, and subsequently multiplied in order to standardize seed germination. Information about the genealogy of the cultivars is available in Supplementary Table 1.
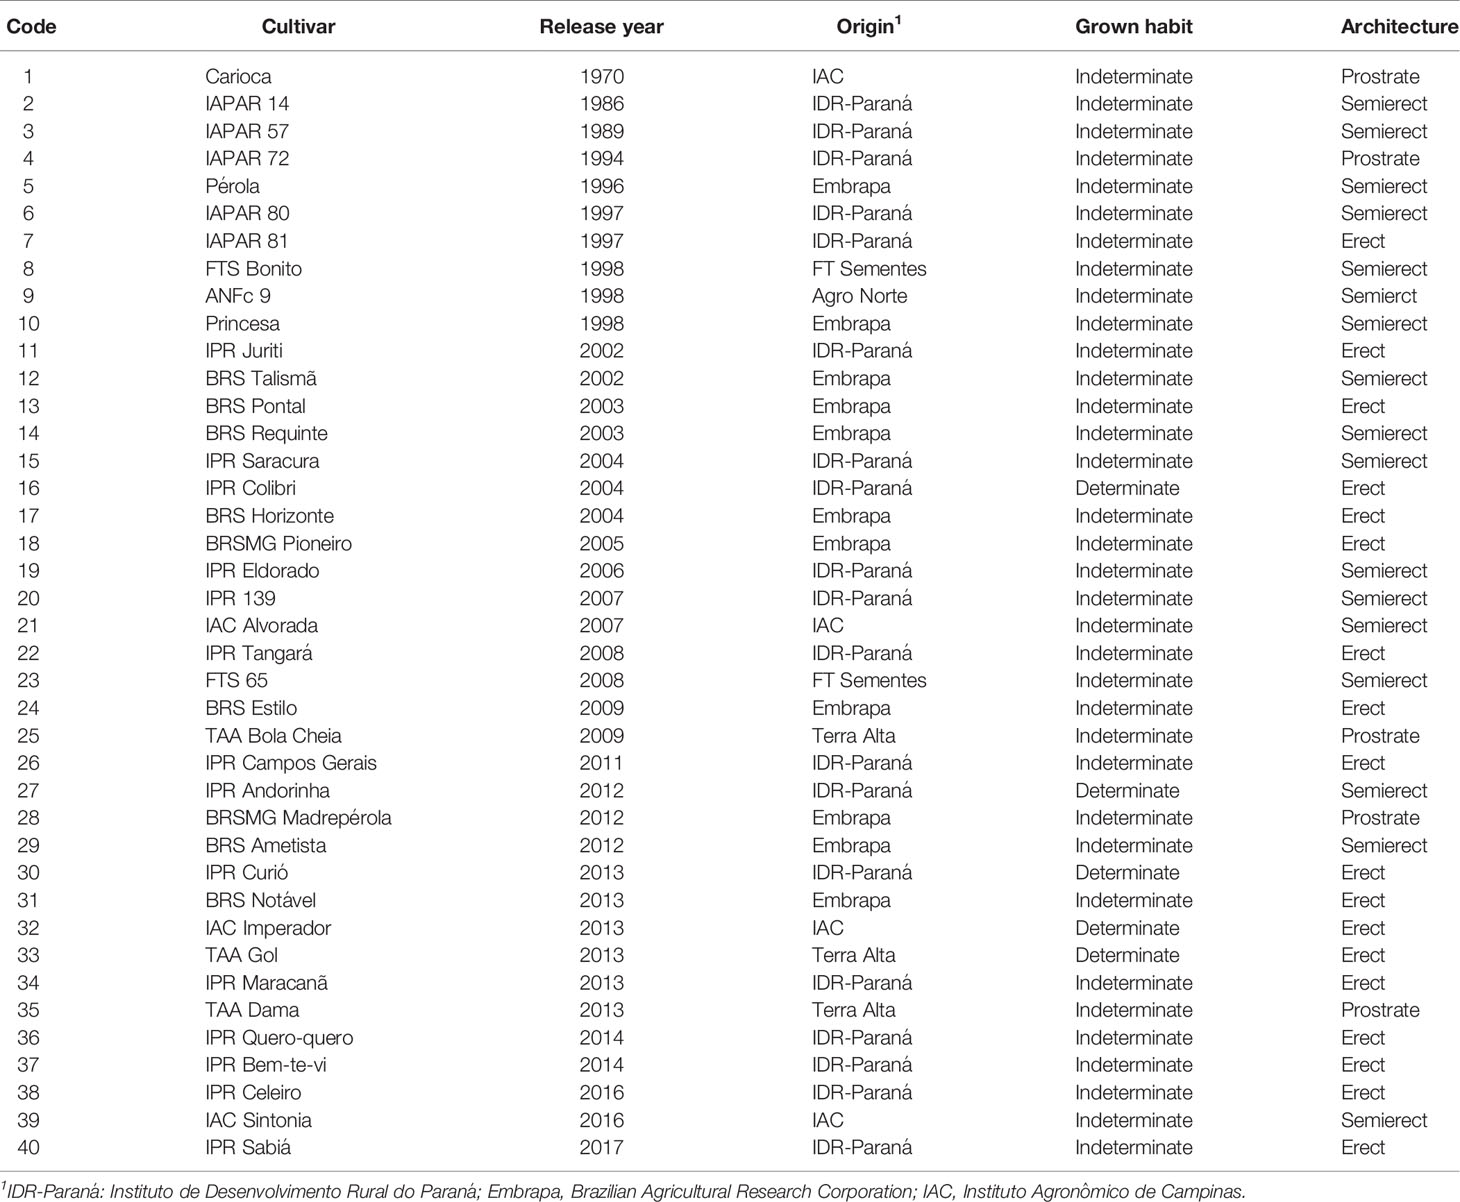
Table 1 Characteristics of all 40 carioca common bean cultivars analyzed in this study.
Experimental Design
Cultivars were evaluated at the Experimental Stations of IDR-Paraná in Londrina and Ponta Grossa during the rainy season of 2017 and in Santa Tereza do Oeste and Ponta Grossa in the dry season of 2018. Soil physical–chemical analyses and other characteristics related to the assessment sites are shown in Table 2. The experiments were arranged in a randomized complete block design with four replications. Sowing was carried out mechanically, and the experimental plots consisted of four 4-m rows, spaced 0.5 m apart, with 15 seeds per linear meter. Two levels of N top-dressing were used in each environment, totaling eight independent experiments. Experiments under high N were fertilized with 40 kg N ha−1 (urea form) at V3 stage development, while the experiments under low N did not receive N top-dressing. In all experiments, the crops were fertilized at sowing with 300 kg ha−1 of NPK (04–30–10).
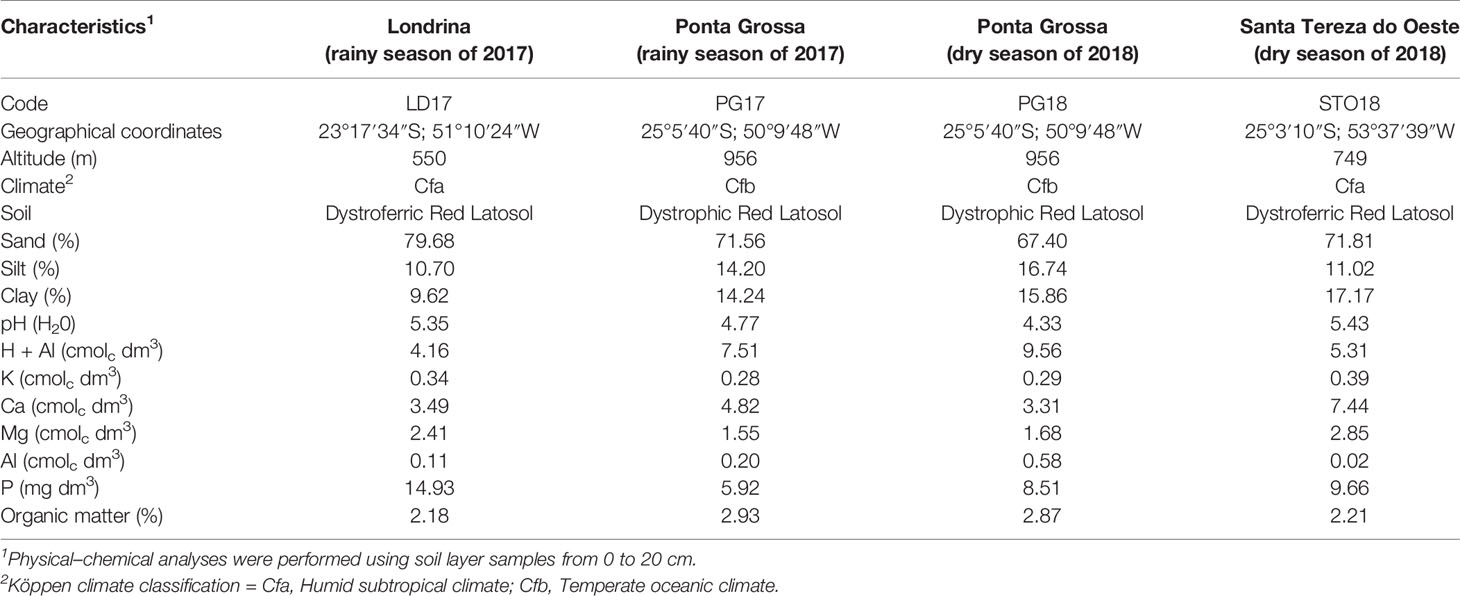
Table 2 Location, codes, climate, and soil characterization of four environments evaluated in this study.
Agronomic Trait Analysis
Five uniform and representative plants were collected at physiological maturation (R9 development stage) from each experimental plot. Seeds and aerial part (stems, leaves, and pod shells) were dried in an oven at 70°C for 72 h to determine later the seeds and shoot dry biomass. These samples were also crushed separately using a Willey MA340 type knife mill (Marconi Laboratory Equipment, Piracicaba, Brazil) to determine seed and shoot N content by the Kjeldahl method (Horwitz, 1975) using a Tecnal TE-0371 digester (Tecnal Scientific Equipment, Piracicaba, Brazil). Seed protein content (Prot, %) was determined by multiplying the percentage of N in the seeds by the factor 6.25 (Horwitz, 1975), while harvest index (HI) was defined by the ratio of shoot dry biomass and total dry biomass (seeds and shoot dry biomass).
Seed yield (SY, kg ha−1 with moisture of 13%) was obtained after manual removal and mechanical threshing of plants from the two central rows of each plot. NUsE components were determined according to Moll et al. (1982). NUpE (mg per g of N absorbed in each plot) was calculated by the ratio between plant total N content and total N fertilizer applied at sowing and top-dressing. NUtE (g of seeds produced per mg N absorbed) was calculated using the ratio between seed dry biomass and plant total N content, while NUsE (in g of seeds produced per g of N applied in each plot) was determined by the product between NUpE and NUtE. The traits Prot, HI, NUsE, NUtE, and NUpE were evaluated only in Londrina and Ponta Grossa during the rainy season of 2017 under high and low N conditions, while the SY was determined in all experiments.
Fitting Models
The traits were evaluated by comparing the following models: (i) Full model: considering triple interaction among genotype (G) × nitrogen (N) × environment (E); (ii) Reduced model 1: considering double interaction between G × N; (iii) Reduced model 2: considering double interaction between G × E; and (iv) Null model: considering interaction absence among factors G, N, and E. The Full model follows the mathematical model below:
Where: µ is the overall mean, gi is the random effect of genotype i, bj/k/m is the random effect of block j within environment k and within N fertilization m, ek is the fixed effect of environment k, nm is the fixed effect of N fertilization m, geik is the random effect of interaction between genotype × environment, gnim is the random effect of interaction between genotype × N fertilization, enkm is the fixed effect of interaction between environment × N fertilization, genikm is the random effect of interaction among genotype × environment × N fertilization, and ϵijkn ~ N(0, σ²) is the random effect of error associated with each experimental plot.
The marginal a posteriori distributions were performed considering non-informative a priori distributions for all model parameters using R software (https://www.r-project.org/) through the ‘MCMCglmm’ (Hadfield, 2010) package. A total of 1,000,000 values were generated by MCMC (Monte Carlo Markov Chain) process, assuming a burn-in period and thinning interval of 500,000 and five iterations, respectively. The MCMC convergence was verified using the Heidelberger and Welch (1983) criterion through the ‘coda’ package (Plummer et al., 2006).
The models tested were compared by deviance information criterion (DIC) as proposed by Spiegelhalter et al. (2002): where is a point estimate of the deviance obtained by replacing the parameters with their a posterior means estimates in the likelihood function, and pD is the effective number of parameters in the model. Models with smaller DIC should be preferred to models with higher DIC. However, differences (D) between DIC values of models a and b are given by D = | DICa – DICb |, and thus, if D < 5, there is no significant difference among the compared models; if 5 ≤ D ≤ 10, the difference is significant; and if D > 10, the difference is highly significant.
Correlations and Principal Component Analysis
Correlations and principal component analysis (PCA) were performed using ‘BayesianFirstAid’ (Bååth, 2014) and ‘bPCA’ (Smyčka and Keil, 2020) packages, respectively. In both analyses, the median scores were reported with their respective 95% highest posterior density (HPD) intervals. Correlation estimates were considered significant when the HPD intervals did not overlap zero. The marginal a posteriori distributions were performed considering non-informative a priori distributions for all model parameters. A total of 100,000 values were generated by MCMC (Monte Carlo Markov Chain) process, assuming a burn-in period and thinning interval of 10,000 and 10 iterations, respectively. The MCMC convergence was verified using the Heidelberger and Welch (1983) criterion through the ‘coda’ package (Plummer et al., 2006).
Genetic Progress
Genetic progress was calculated for each trait evaluated in both N conditions using the following simple linear regression model:
Where: β0 is the intercept or linear coefficient, β1 is the slope or angular coefficient to adjust the data of variable yi as a function of Xi (year of cultivar release), and ϵi are errors normally distributed with mean zero and variance σ², that is ϵi ~ N(0, σ²). The parameter σ² represents a variability in which the results differ from their predictions based on the model. This model can also be described as yi ~ Normal (β0 + β1Xi + σ²). The difference between genetic progresses (Δβ1) at high and low N fertilization was considered significant when there was no overlap between their HPD intervals.
The marginal a posteriori distributions were performed considering non-informative a priori distributions for all model parameters using the ‘MCMCglmm’ (Hadfield, 2010) package. A total of 100,000 values were generated by MCMC (Monte Carlo Markov Chain) process, assuming a burn-in period and thinning interval of 100,000 and 10 iterations, respectively. The MCMC convergence was verified using the Heidelberger and Welch (1983) criterion through the ‘coda’ package (Plummer et al., 2006).
Adaptability and Stability Analyses
Bayesian additive main effects and multiplicative interaction (BAMMI) method was used to study cultivar stability following the model below:
Where: 1n is the vector of the order n × 1, µ is the overall mean, X1 is the matrix of genotypes of order n × g, τ is the effect vector g × 1 for genotypes, X2 and δ are the matrices for environments of the order n × a and the effect vector a × 1 for environment, respectively. λk is the singular value for the kth principal component, t is the number of multiplicative terms [t ≤ min (g, a) − 1), αk and γk are the singular vectors of k for genotypes and environment, respectively; and ϵ is the vector n of error effect. Vector ϵ has a multivariate normal distribution with zero mean and variance–covariance matrix Thus, the vector y also has a multivariate normal distribution.
For the BAMMI model, the estimation of the parameters of the above equation model assumes that the conditional distribution of y, given that µ, τ, δ, λ, α, γ, and is a multivariate normal distribution:
Where: In is the identity matrix of order n. The a priori distributions used for the parameters were the same as those presented by Crossa et al. (2011). Subscripted symbols μ and σ2 denote mean and variance of the a priori distribution of whatever parameter is shown as subscript:
with the restrictions λk > 0 and λk–1 ≥ λk;
σk ~ spherical uniform distribution on the corrected subspace;
γk ~ spherical uniform distribution on the corrected subspace; and
Where: N denotes the normal distribution, N+ is the positive normal distribution, and Inv − Scaled − χ2 is the inverse χ2 distribution. In this study, the a priori distributions were non-informative. The value zero was used as prior distribution for the mean in all genotypic and environmental effects and high values for the variances, resulting in: µµ = 0, µτ = 1g × 0, µδ = 1a × 0 and µλk = 0, and for the variances ,, e = 1 × 10¹⁵.
The a posteriori distribution was estimated by:
A total of 1,000,000 values were generated by MCMC (Monte Carlo Markov Chain) process, assuming a burn-in period and thinning interval of 100,000 and five iterations, respectively. The MCMC convergence was verified using the Heidelberger and Welch (1983) criterion through the ‘coda’ package (Plummer et al., 2006). The BAMMI method was carried out using R script developed by Crossa et al. (2011).
Results
Fitted Models and Influence of Nitrogen Fertilization
DIC results showed a positive evidence of a triple interaction among genotype, environment, and N levels (G × E × N) for all evaluated traits since the full model presented lower DIC values (Table 3). However, for trait HI, the DIC values difference among full, reduced 1, and reduced 2 models was less than five, indicating that there is no difference among all models tested.
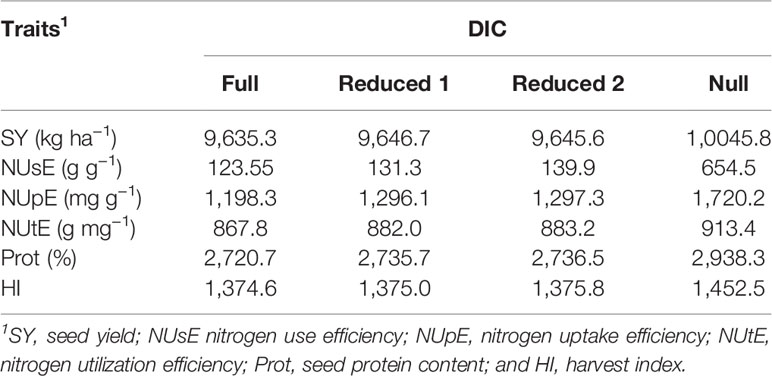
Table 3 Deviance information criterion (DIC) for full model [considering interactions among genotype (G) × nitrogen (N) × environment (E)], reduced model 1 (G × N), reduced model 2 (G × E), and null model (considering only additive effects among G, N, and E).
The overall mean for all evaluated traits and their respective HPD intervals are shown in Table 4. In general, there was a reduction of SY under low N conditions. However, there was an increase in NUsE and NUpE under low N when compared to high N conditions. There were no differences evident between high and low N conditions for the NUtE, Prot, and HI traits since there was an overlap of the HPD intervals in both N conditions. The performance of cultivars is presented in Supplementary Tables 2–4.
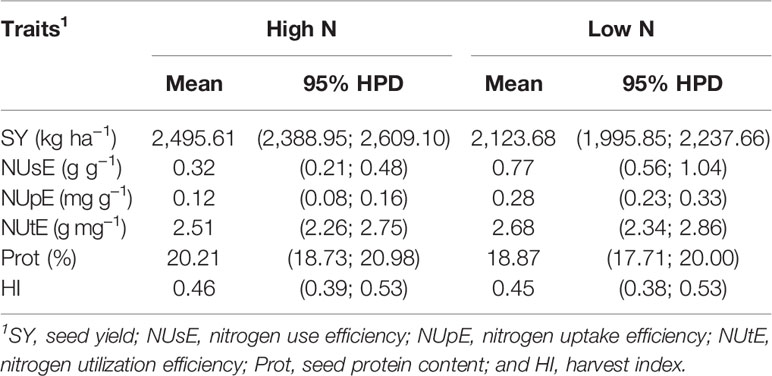
Table 4 Overall means and their respective 95% highest posterior density (HPD) intervals of six traits under low and high N conditions.
Correlation and Principal Component Analysis
Correlation coefficients (r) and their respective HPD intervals among traits evaluated are shown in Table 5. In general, there was a moderate agreement between the correlations of high and low N conditions. SY, HI, and NUtE showed a positive correlation in both N levels. On the other hand, SY, HI, and NUtE showed a negative correlation with Prot, which correlated positively with NUsE (r = 0.47, 95% HPD = 0.36; 0.58), and NUpE (r = 0.54, 95% HPD = 0.46; 0.62) under low N. NUsE showed a positive correlation with NUpE under low (r = 0.98, 95% HPD = 0.97; 0.99) and high N (r = 0.87, 95% HPD = 0.84; 0.90) conditions. In addition, we observed a positive and negative correlations between NUsE and NUtE under high (r = 0.23, 95% HPD = 0.12; 0.34) and low N (r = −0.33, 95% HPD = −0.44; −0.22) levels, respectively.
Table 5 Correlation coefficients and their respective 95% highest posterior density (HPD) intervals among the traits seed yield (SY), nitrogen use efficiency (NUsE), nitrogen uptake efficiency (NUpE), nitrogen utilization efficiency (NUtE), seed protein content (Prot), and harvest index (HI) under high N (top diagonal) and low N (bottom diagonal).
PCA graphics are shown in Figure 1. The first two principal components (Comp.1 and Comp.2) explained 76.1% (95% HPD = 60.1; 83.2%) and 14.3% (95% HPD = 6.1; 20.2%) of the total variation observed under high N condition. Under low N, Comp.1 and Comp.2 explained 74.2% (95% HPD = 57.4; 82.1%) and 15.2% (95% HPD = 8.0; 23.4%) of the total variation detected, respectively (Supplementary Figure 2). NUsE, NUpE, and SY were the traits that most contributed to discriminate cultivars under high and low N since they showed the highest absolute values for their eigenvectors in Comp.1 and Comp.2 (Supplementary Figure 3). The projection of NUtE and SY vectors showed the same direction in both N conditions. However, their vectors were projected in the opposite direction in relation to Prot, indicating a negative correlation of NUtE and SY to Prot. The IAC Alvorada cultivar was projected more distantly among all cultivars evaluated for both N conditions, probably because this cultivar showed the highest NUpE and NUsE means under high and low N conditions, respectively.
Figure 1 Principal component analysis (PCA) and the respective 95% highest posterior density (HPD) intervals of 40 carioca common bean cultivars under high (A) and low N (B) conditions evaluated for traits seed yield (SY), nitrogen use efficiency (NUsE), nitrogen uptake efficiency (NUpE), nitrogen utilization efficiency (NUtE), seed protein content (Prot), and harvest index (HI). A list of cultivars is presented in Table 1.
Genetic Progress
Genetic progress estimates for the traits evaluated under high and low N are shown in Table 6. The significance of the linear regression model was observed only for SY in both N conditions since the estimates of the β1 parameter and their respective HPD intervals did not overlap the value of zero. Under high N, genetic progress estimate was 13.1 kg ha−1 (95% HPD = 9.3; 17.0 kg ha−1) or 0.53% year−1 (95% HPD = 0.39; 0.65%). Under low N condition there was a progress of 10.2 kg ha−1 (95% HPD = 6.1; 14.5 kg ha−1) or 0.48% year−1 (95% HPD = 0.31; 0.64%). There was no difference between the a posteriori slope estimates (Δβ1), indicating that the genetic progress of SY was the same in both N conditions.
Table 6 Genetic progress estimates and their respective 95% highest posterior density (HPD) intervals for traits seed yield (SY), nitrogen use efficiency (NUsE), nitrogen uptake efficiency (NUpE), nitrogen utilization efficiency (NUtE), seed protein content (Prot), and harvest index (HI).
Adaptability and Stability
The a posteriori means of genotypic (τ) and environmental (δ) effects and their respective HPD intervals are shown in Tables 7 and 8, respectively. Overall mean (µ) of SY from 40 carioca common bean cultivars evaluated in eight contrasting N conditions was 2,155.71 kg ha−1 (95% HPD = 2141.99; 2169.54 kg ha−1). Twenty-one cultivars showed a posteriori positive means with HPD intervals that did not overlap the zero value (Table 7). Among these cultivars, the ones that stood out the most were: IPR Sabiá (376.61 kg ha−1; 95% HPD = 363.95; 389.91 kg ha−1), IPR Quero-quero (319.24 kg ha−1, 95% HPD = 306.23; 332.79 kg ha−1), IPR Bem-te-vi (288.76 kg ha−1; 95% HPD = 275.63; 302.05 kg ha−1), IAC Sintonia (274.92 kg ha−1; 95% HPD = 261.39; 287.95 kg ha−1), IPR Campos Gerais (235.44 kg ha−1; 95% HPD = 222.72; 24.06 kg ha−1), and BRS Notável (214.96 kg ha−1; 95% HPD = 201.86; 228.57 kg ha−1). It is worthwhile to mention that not all environments under high N conditions were considered as favorable environments since they did not show a posteriori positive means (Table 8).
Table 7 A posteriori mean of Bayesian additive main effects and multiplicative interaction (BAMMI) for seed yield (kg ha−1) of 40 carioca common bean cultivars in eight environments for the overall mean (µ) and genotypic effects (τi) with their respective 95% highest posterior density (HPD).
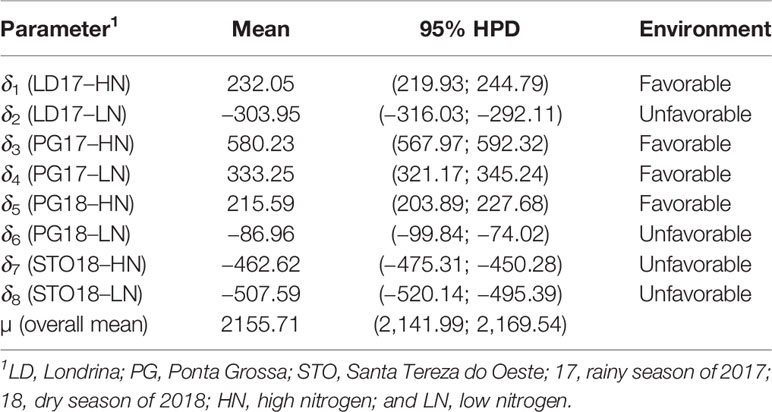
Table 8 A posteriori mean of Bayesian additive main effects and multiplicative interaction (BAMMI) for seed yield (kg ha−1) of 40 carioca common bean cultivars in eight environments for general average (µ) and environment effect (δj) with their respective 95% highest posterior density (HPD).
Genotypic and environmental scores with their respective HPD intervals for the first two principal components (Comp.1 and Comp.2) are shown in Figure 2. Comp.1 and Comp.2 explained 43.33 and 21.47% of G × E interaction, respectively. The HPD intervals overlapping in the central point indicate the presence of genotypic or environmental stability. In addition, HPD intervals overlapping among genotypes or environments indicate similar responses among them. The genotypic scores showed that 25 cultivars have high stability since their HPD intervals overlapped with zero values on both axes (Figure 2A). The environmental scores allowed us to observe that PG17–LN was the environment which contributed more to G × E interaction since HPD interval did not overlap zero on the axis of Comp.1 (Figure 2B).
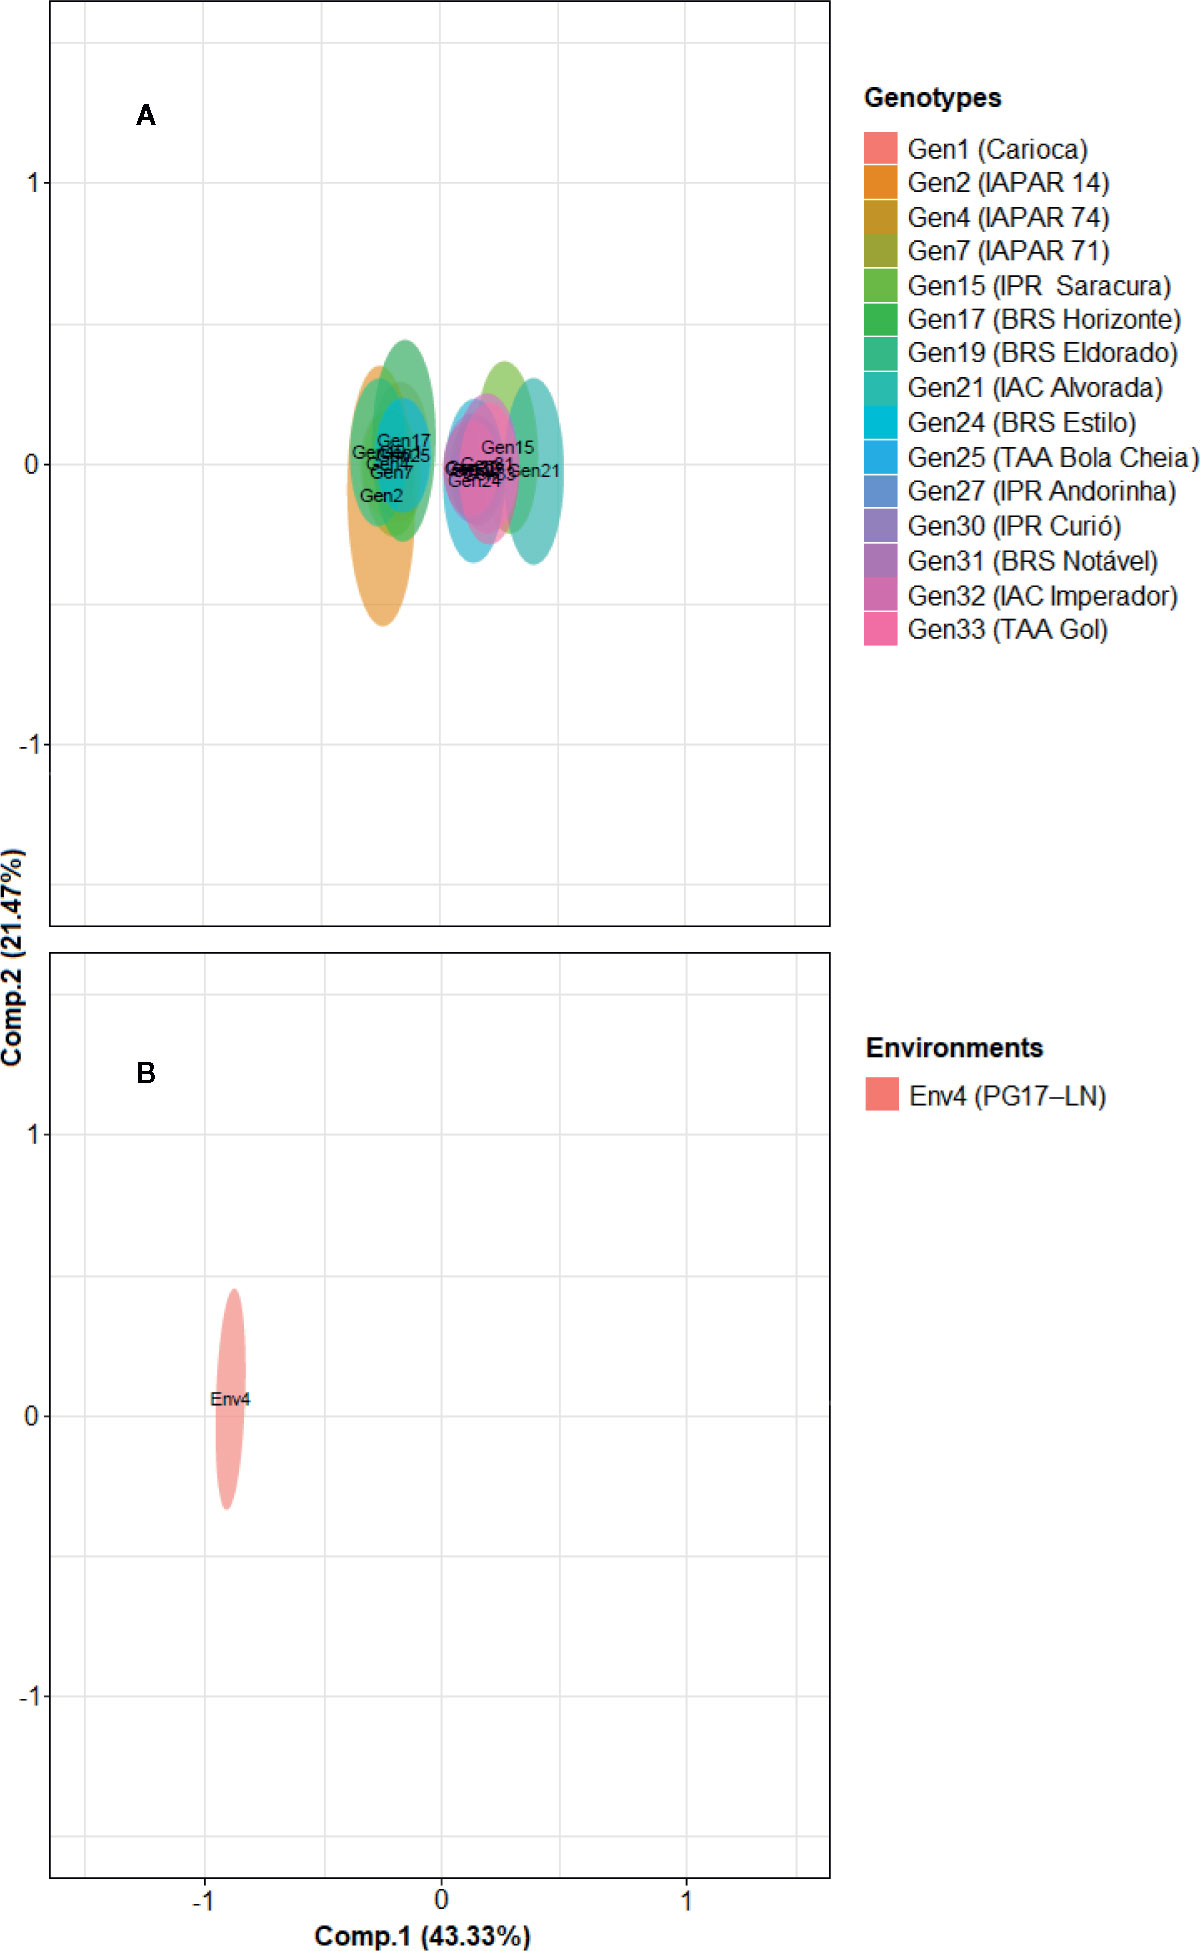
Figure 2 Genotype (A) and environment (B) scores with their respective 95% highest posterior density (HPD) intervals of 40 carioca common bean cultivars evaluated in eight contrasting environments. Cultivars and environment not plotted on the graphs showed HPD intervals overlapping with zero value in both principal components (Comp.1 and Comp.2).
Comp.1 and Comp.2 coordinates allowed us to infer about the genotype specific adaptation to certain environments (Figure 2). Considering only genotypes and environments with significant contribution to G × E interaction, seven cultivars (Carioca, IAPAR 14, IAPAR 72, IAPAR 81, BRS Horizonte, IPR Eldorado, and TAA Bola Cheia) showed specific adaptation to environment PG17–LN. The cultivars that showed to be more adapted and stable were: IPR Sabiá, IPR Quero-quero, IPR Bem-te-vi, IAC Sintonia, and IPR Campos Gerais. These cultivars presented high SY mean values and high behavior predictability for different environmental conditions.
The environmental correlations of SY between high and low N conditions are shown in Figure 3. In general, correlation estimates were positive and significant in all evaluated environments since their HPD intervals did not overlap the zero. Moderate correlation estimates were observed in PG18 (r = 0.50, 95% HPD = 0.37; 0.62), while weak correlations were observed in STO18 (r = 0.39, 95% HPD = 0.23; 0.53), LD2017 (r = 0.33, 95% HPD = 0.18; 0.46), and PG2017 (r = 0.29, 95% HPD = 0.15; 0.43).
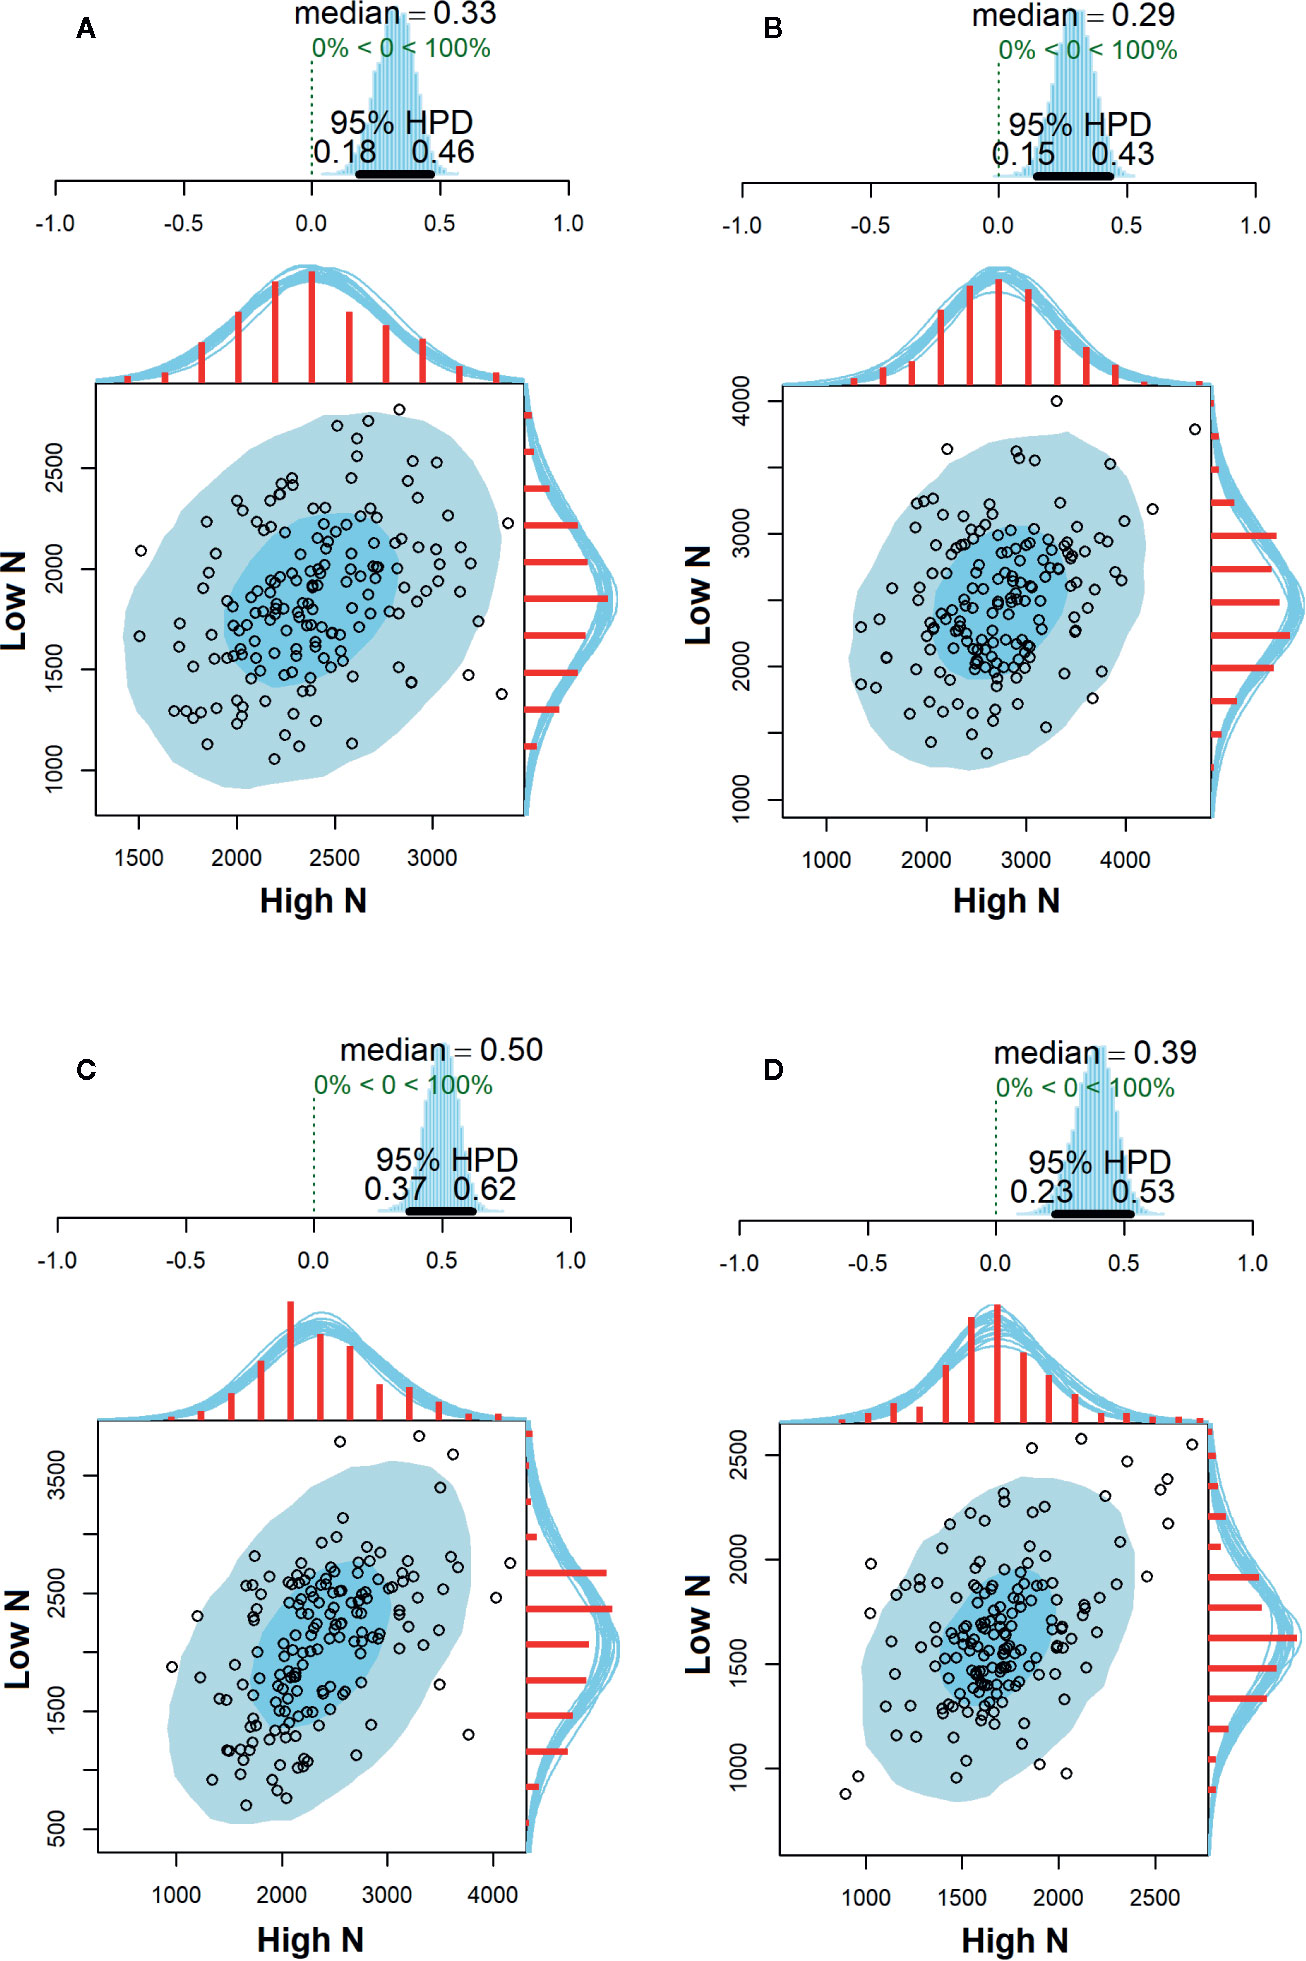
Figure 3 Correlation estimates of seed yield (kg ha−1) with their respective 95% highest posterior density (HPD) intervals between high and low N conditions evaluated in Londrina—2017 (A), Ponta Grossa—2017 (B), Ponta Grossa—2018 (C), and Santa Tereza do Oeste—2018 (D).
Discussion
Our study was the first to quantify the genetic progress of carioca common beans in Brazil over the past 47 years under N contrasting conditions. In Brazil, these studies have mainly focused on the impact of breeding programs on plant architecture and yield components. For example, Barili et al. (2016) reported a change in modern cultivar architecture since there was a substitution of prostrate cultivars by erect growth habit. This change allowed mechanical harvesting with reduced losses, lower incidence of disease, and improved grain quality. In addition, the increase in common bean production has also been associated with genetic progress in the number of pods per plant (5.6% year−1), seeds per plant (4.5% year−1), mass of seeds (2.08% year−1), and tolerance to lodging (2.0% year−1) (de Faria et al., 2013; Barili et al., 2016). In common bean, there are still no studies quantifying the genetic progress for NUsE. On the other hand, an increase in NUsE has been reported in several other crops (Laidig et al., 2017; Stahl et al., 2017; Mueller et al., 2019).
Interaction Between Factors and Influence of Nitrogen Fertilization
The best adjustment of the full model for all agronomic traits evaluated indicated that cultivars have a differential behavior based on the combination of N fertilization levels and environments in which the cultivars were submitted. The interaction between genotypes and environments is frequently observed in common bean breeding programs in Brazil (Barili et al., 2016; Pereira et al., 2018) and worldwide (Bruno et al., 2017; Caproni et al., 2018).
SY increased under high N top-dressing (17.51%), corroborating a previous study that reported N as the macro-element that most influences SY in common bean crop (Barros et al., 2018). Similar results were also observed for 16 Brazilian carioca common bean cultivars which observed an increase of approximately 21.71% in plants under high N condition (Leal et al., 2019).
The majority of the NUsE and NUpE evaluated in carioca common bean cultivars in this study were higher under low N compared to the high N condition. Studies have already been reported that plants improve their NUsE under low N availability, especially because under high N conditions this element can be lost by leaching, denitrification, and volatilization processes (Shibata et al., 2017).
Several studies also reported the influence of environmental factors on Prot in common beans (Pereira et al., 2017; Fidelis et al., 2019). A study using 40 common bean genotypes (carioca and black types) observed 18.33 and 19.36% of Prot in common beans cultivated in low and high N condition, respectively, where 17 genotypes did not show an increase in Prot in the presence of N top-dressing (Fidelis et al., 2019). In the present study, although the overall mean of Prot was not significantly altered by N top-dressing, seven cultivars (BRS Requinte, BRS Horizonte, IAC Alvorada, FTS 65, IPR Campos Gerais, BRS Notável, and IPR Quero-quero) showed an increase in Prot under the high N condition.
We did not observe significant differences for HI values between both N conditions. However, some studies observed an increase of HI through N top-dressing fertilization (Fageria and Baligar, 2005; Fageria et al., 2014). HI is a measure of biomass partitioning, which indicates the fraction of total above-ground biomass allocated in the seeds and is considered to be one of the most determinant traits of common bean tolerance to several abiotic stresses (Assefa et al., 2015; Amanuel et al., 2018). In general, the genotypes that are more tolerant to abiotic stresses have a higher HI value, that is, a greater ability to partition photo-assimilates from vegetative organs to seeds (Assefa et al., 2015). In common bean, HI values have varied between 0.3 and 0.6, being considered a complex trait and strongly influenced by environment (Pinto Júnior et al., 2018). According to Beebe et al. (2008), the increase in HI is a key strategy in the improvement of beans, mainly under abiotic stress conditions.
Agronomic Traits Correlations
NUtE was the only component of NUsE to present a positive correlation with SY in both N conditions, indicating that this trait is the main component of NUsE in common bean crop, especially when the breeding program aims to increase SY. Several metabolic and physiological mechanisms are associated with NUtE in plants, including greater photosynthetic efficiency per unit of N, improved partition of carbohydrates, storage, and N remobilization through senescent tissues (Han et al., 2015). NUtE increase is often associated to the stay-green character since genotypes with this characteristic maintain leaves photosynthetically active for a longer period (Zhang et al., 2020). HI has also been associated with NUtE since its increase contributes to a more efficient production of seed biomass by total biomass accumulated in plants (Han et al., 2015). In this study, we also observed a positive correlation between HI and NUtE in both N conditions.
We observed a negative correlation between NUtE and NUpE under low N condition, similar to what has been previously described in maize (Gallais and Hirel, 2004). These authors reported that NUtE is related to protein degradation in senescent leaves, and they assumed that the use of N occurs mainly when absorption is reduced or interrupted during stresses and/or natural senescence. In addition, the genetic variability of NUsE is a function of the existing variability of NUpE in high N condition, while in low availability it is a function of NUtE. Our results partially corroborated this study since we observed a genetic variability in NUpE with a greater contribution of NUsE in both N conditions.
The observed negative correlations between SY and Prot may be related to altered patterns of carbon and N metabolism, and this result is corroborated by different studies carried out in common bean (Razvi et al., 2018) and other crops, such as, oilseed rape (Stahl et al., 2017) and wheat (Thorwarth et al., 2019). Several studies investigated the genetic basis of this negative correlation and showed that pleiotropic effects, environmental conditions, and management techniques can influence the relationship between these variables (Rozbicki et al., 2015; Thorwarth et al., 2019). Another study reported genetic correlations between Prot and SY (rg = 0.51; p < 0.01) similar to those obtained in the present study using 140 common bean recombinant inbred lines (RIL) under contrasting N condition (Farid et al., 2017).
Genetic Progress
Our genetic progress related to SY was similar under low (0.48%, 95% HPD = 0.31; 0.64%) and high N (0.53%, 95% HPD = 0.39; 0.65%), indicating that modern cultivars do not demand more N fertilization to be more productive than cultivars released earlier. Around ten years are needed to develop a new common bean cultivar (Moreira et al., 2010). As the number of selected lines is reduced, the range of environments in which they are tested is wider. Among all these trials, moderate N stresses surely occur unintentionally. Thus, the selection process may already mix high and low N environments explaining in part the similar genetic progress observed in the present study under both N conditions.
Genetic progress estimates for SY using Brazilian carioca and black common beans cultivars have already been reported (Chiorato et al., 2010; de Faria et al., 2013; Barili et al., 2016), but not under low N condition. For example, de Faria et al. (2013) assessing lines and cultivars representative of 22 years of the Embrapa breeding program reported progress of 0.72% year−1 (17.3 kg ha−1). In the IAC bean breeding program, genetic progress was 1.07% year–1 (13.17 kg ha–1) between 1989 and 1996. Differences between germplasm, environments, methodologies, and statistical methods are the main reasons for the differences observed among studies (de Faria et al., 2018).
We did not detect a significant difference in Prot content among modern and old cultivars. Our hypothesis is that selection on Prot may only result in the elimination of low Prot lines and not in increasing Prot, likewise reported in wheat (Cormier et al., 2013) and oilseed rape (Stahl et al., 2017) crops. Common bean breeding program objectives were clearly to increase SY, and the concern and interest in biofortification is recent. Since there is a negative correlation between SY and Prot, an alternative could be to improve protein composition to increase the levels of essential amino acids (mainly methionine, cysteine, and tryptophan) and/or decrease protein digestibility inhibitors (Rezende et al., 2017).
Although there is wide genetic variability observed for NUsE, NUtE, and NUpE in this study, no genetic progress was detected for these traits. Possibly the common bean breeding programs are not focusing in the improvement of NUsE since common beans are able to fix N2 by symbiosis. However, NUsE genetic progress and their components have been reported in other crops that do not have this N2 fixation ability, such as, wheat (Laidig et al., 2017), maize (Mueller et al., 2019), and oilseed rape (Stahl et al., 2017). In addition, the evaluation and selection for NUsE is considered an extremely expensive process and may not be implemented in breeding programs soon. High-throughput phenotyping methods are currently being developed (Neilson et al., 2015; Kefauver et al., 2017) and can become an important tool in the improvement of NUtE and/or NUpE in addition to molecular selection on genes or quantitative trait loci (QTL) (Cormier et al., 2013).
In our study, the genetic progress of HI was absent and indicated that superior genotypes selection was not performed focusing on this agronomic trait. However, the genetic progress of HI has been historically reported in several other crops (Cormier et al., 2013; Mueller et al., 2019; Todeschini et al., 2019). In a meta-analysis including eleven different crops, the authors reported a positive relationship between SY and HI in cereal (maize, wheat, barley, and oat), oilseed (soybean, canola, and flax), and pulse crops (pea, chickpea, and lentil), with the exception of potato crops only (Fan et al., 2017). The same authors affirmed that this positive linear relationship indicates that SY improvement was achieved in part through HI, and that plant breeders should focus greater attention on this agronomic trait to develop new cultivars.
Adaptability and Stability
The development of genotypes with environment adaptive plasticity, good stability, and high SY mean is one way to mitigate G × E interaction effects (Resende et al., 2019). Statistical methods to study adaptability and stability have been developed and widely used by plant breeding programs (Nascimento et al., 2020). The BAMMI method stands out for its power to explain G × E interaction compared to other methods (Teodoro et al., 2019). Another advantage of the BAMMI model is the presence of HPD intervals for genotypic and environment scores (Oliveira et al., 2015). These credibility intervals lead to greater precision to infer genotypic and environment stability by eliminating subjective mean scores in relation to the proximity to the central point of the biplot (coordinates 0 and 0).
In the present study, the large number of cultivars considered stable is due to the selection for stability in several environment conditions by their respective breeding programs. In addition, there was no relationship between stability and release year since both modern and old cultivars showed high stability. The modern cultivars IPR Sabiá, IPR Quero-quero, IPR Bem-te-vi, IAC Sintonia, and IPR Campos Gerais were the most adapted and stable in the present study. These results confirm that common bean breeding programs are developing cultivars that combine SY and stability for different environmental conditions.
We observed that not all environments under high N condition were considered favorable environments by BAMMI. In addition, the positive correlations between high and low N for all environments explain the similar genetic progress among them for SY. These results indicated that even though common bean breeding programs have made selection under N fertilization, modern cultivars do not require high N levels to achieve their genetic potential. Similar results were already reported in maize (Haegele et al., 2013) and wheat (Cormier et al., 2013).
Conclusion
Our study is the first to quantify the genetic progress for SY and NUsE-related traits in Brazilian carioca common bean cultivars launched from 1970 to 2017 under N contrasting conditions. Among the traits evaluated, there was genetic progress only for SY under high and low N in top-dressing. The similar genetic progress in both N conditions rejected our hypothesis that modern cultivars are more N-dependent to reach their productive potential. Our results indicate that the challenges for common bean breeders for the coming years will be to improve the NUsE of new cultivars in order to reduce the dependence on N fertilizers as well as to increase the levels and/or quality of Prot in the seeds.
Data Availability Statement
The raw data supporting the conclusions of this article will be made available by the authors, without undue reservation.
Author Contribuitions
DZ, IM, VM-C, and LG conceived and designed the experiments. DZ, IM, and JD conducted the experiments and collected the data. DZ and GF performed the statistical analyses. DZ wrote the original draft. S-IS, VM-C, JN, GF, CS, and LG read and edited the manuscript. All authors contributed to the article and approved the submitted version.
Conflict of Interest
The authors declare that the research was conducted in the absence of any commercial or financial relationships that could be construed as a potential conflict of interest.
Acknowledgments
The authors thank Adair Moraes, Paulo Cezar Lopes, and Carlos Frederico de Oliveira for excellent technical conductance of field experiments. Furthermore, we would like to thank Rosinei Aparecida de Souza for valuable help with nitrogen analysis.
Supplementary Material
The Supplementary Material for this article can be found online at: https://www.frontiersin.org/articles/10.3389/fpls.2020.01168/full#supplementary-material
References
Aczel, B., Hoekstra, R., Gelman, A., Wagenmakers, E.-J., Klugkist, I. G., Rouder, J. N., et al. (2020). Discussion points for Bayesian inference. Nat. Hum. Behav. 4, 561–563. doi: 10.1038/s41562-019-0807-z
Amanuel, A., Amisalu, N., Merkeb, G. (2018). Growth and yield of common bean (Phaseolus vulgaris L.) cultivars as influenced by rates of phosphorus at Jimma, Southwest Ethiopia. J. Agric. Biotech. Sustain. Dev. 10, 104–115. doi: 10.5897/JABSD2018.0312
Appelbaum, E. (2018). “The Rhizobium/Bradyrhizobium-legume symbiosis,” in Molecular Biology of Symbiotic Nitrogen Fixation (Cambridge, United States: CRC Press), 131–158.
Argaw, A., Mekonnen, E., Muleta, D. (2015). Agronomic efficiency of N of common bean (Phaseolus vulgaris L.) in some representative soils of Eastern Ethiopia. Cogent Food Agric. 1, 1074790. doi: 10.1080/23311932.2015.1074790
Assefa, T., Wu, J., Beebe, S. E., Rao, I. M., Marcomin, D., Claude, R. J. (2015). Improving adaptation to drought stress in small red common bean: phenotypic differences and predicted genotypic effects on grain yield, yield components and harvest index. Euphytica 203, 477–489. doi: 10.1007/s10681-014-1242-x
Bååth, R. (2014). Bayesian first aid: A package that implements Bayesian alternatives to the classical*. test functions in R. Proc. UseR 2014, 2.
Barili, L. D., do Vale, N. M., de Souza Carneiro, J. E., e Silva, F. F., da Silva, F. L. (2016). Five decades of black common bean genetic breeding in Brazil. Pesquisa Agropecuária Trop. 46, 259–266. doi: 10.1590/1983-40632016v4641371
Barros, R. L. N., de Oliveira, L. B., Magalhães, W. B., Médici, L. O., Pimentel, C. (2018). Interaction of biological nitrogen fixation with sowing nitrogen fertilization on common bean in the two seasons of cultivation in Brazil. J. Plant Nutr. 41, 774–781. doi: 10.1080/01904167.2018.1426016
Beebe, S., Rao, I., Polonía, J., Grajales, M., Cajiao, C. (2008). Improved harvest index in drought resistant common beans and possible effects on combining ability. Annu. Report-bean Improv. Coop. 51, 8.
Bruno, A., Clare, M. M., Stanley, N. T., Paul, G., Maxwell, M. G., Patrick, R., et al. (2017). Variety × environment × management interaction of diseases and yield in selected common bean varieties. Agron. J. 109, 2450–2462. doi: 10.2134/agronj2016.11.0681
Caproni, L., Raggi, L., Tissi, C., Howlett, S., Torricelli, R., Negri, V. (2018). Multi-environment evaluation and genetic characterisation of common bean breeding lines for organic farming systems. Sustainability 10:777. doi: 10.3390/su10030777
Carbonell, S. A. M., Guerreiro Filho, O., Siqueira, W. J. (2012). Contributions of the Instituto Agronômico (IAC) for plant breeding. Crop Breed. Appl. Biotechnol. 12, 15–24. doi: 10.1590/S1984-70332012000500003
Chiorato, A. F., Carbonell, S. A. M., Vencovsky, R., Júnior, F., da Silva, N., Pinheiro, J. B. (2010). Genetic gain in the breeding program of common beans at IAC from 1989 to 2007. Crop Breed. Appl. Biotechnol. 10, 329–336. doi: 10.1590/S1984-70332010000400007
CONAB – Companhia Nacional de Abastecimento (2020a). Acompanhamento da safra brasileira de grãos, v.7 - Safra 2019/2020 - Primeiro levantamento, outubro 2019. Available at: http://www.conab.gov.br (Accessed January 2, 2020).
CONAB – Companhia Nacional de Abastecimento (2020b). Série histórica das safras, Feijão total (1a;, 2a e 3a Safras). Available at: https://www.conab.gov.br/info-agro/safras/serie-historica-das-safras?start=20 (Accessed July 12, 2020).
Cormier, F., Faure, S., Dubreuil, P., Heumez, E., Beauchêne, K., Lafarge, S., et al. (2013). A multi-environmental study of recent breeding progress on nitrogen use efficiency in wheat (Triticum aestivum L.). Theor. Appl. Genet. 126, 3035–3048. doi: 10.1007/s00122-013-2191-9
Crossa, J., Perez-Elizalde, S., Jarquin, D., Cotes, J. M., Viele, K., Liu, G., et al. (2011). Bayesian estimation of the additive main effects and multiplicative interaction model. Crop Sci. 51, 1458–1469. doi: 10.2135/cropsci2010.06.0343
da Silva, F. A., Viana, A. P., Corrêa, C. C. G., Carvalho, B. M., de Sousa, C. M. B., Amaral, B. D., et al. (2020). Impact of Bayesian Inference on the Selection of Psidium guajava. Sci. Rep. 10, 1999. doi: 10.1038/s41598-020-58850-6
de Faria, L. C., Melo, P. G. S., Pereira, H. S., Del Peloso, M. J., Brás, A. J. B. P., Moreira, J. A. A., et al. (2013). Genetic progress during 22 years of improvement of carioca-type common bean in Brazil. Field Crops Res. 142, 68–74. doi: 10.1016/j.fcr.2012.11.016
de Faria, L. C., Melo, P. G. S., de Souza, T. L. P. O., Pereira, H. S., Melo, L. C. (2018). Efficiency of methods for genetic progress estimation in common bean breeding using database information. Euphytica 214, 164. doi: 10.1007/s10681-018-2246-8
Diacono, M., Baldivieso-Freitas, P., Sans Serra, F. X. (2019). Nitrogen utilization in a cereal-legume rotation managed with sustainable agricultural practices. Agronomy 9:113. doi: 10.3390/agronomy9030113
Dwivedi, S. L., Sahrawat, K. L., Upadhyaya, H. D., Mengoni, A., Galardini, M., Bazzicalupo, M., et al. (2015). “Advances in host plant and rhizobium genomics to enhance symbiotic nitrogen fixation in grain legumes,” in Advances in Agronomy (Amsterdam, Netherlands: Elsevier), 1–116. doi: 10.1016/bs.agron.2014.09.001
Fageria, N. K., Baligar, V. C. (2005). Enhancing nitrogen use efficiency in crop plants. Adv. Agron. 88, 97–185. doi: 10.1016/S0065-2113(05)88004-6
Fageria, N. K., Melo, L. C., Ferreira, E. P. B., Oliveira, J. P., Knupp, A. M. (2014). Dry matter, grain yield, and yield components of dry bean as influenced by nitrogen fertilization and rhizobia. Commun. Soil Sci. Plant Anal. 45, 111–125. doi: 10.1080/00103624.2013.848877
Fan, J., McConkey, B., Janzen, H., Townley-Smith, L., Wang, H. (2017). Harvest index–yield relationship for estimating crop residue in cold continental climates. Field Crops Res. 204, 153–157. doi: 10.1016/j.fcr.2017.01.014
Farid, M., Earl, H. J., Pauls, K. P., Navabi, A. (2017). Response to selection for improved nitrogen fixation in common bean (Phaseolus vulgaris L.). Euphytica 213, 99. doi: 10.1007/s10681-017-1885-5
Fidelis, R. R., Salgado, F. H. M., dos Santos Alexandrino, C. M., de Oliveira Tavares, T. C., Campestrini, R. (2019). Determinação do teor de proteína em genótipos de feijão comum cultivados em diferentes níveis de nitrogênio. AMBIÊNCIA 15, 161–172. doi: 10.5935/ambiencia.2019.01.10
Gallais, A., Hirel, B. (2004). An approach to the genetics of nitrogen use efficiency in maize. J. Exp. Bot. 55, 295–306. doi: 10.1093/jxb/erh006
Hadfield, J. D. (2010). MCMC methods for multi-response generalized linear mixed models: the MCMCglmm R package. J. Stat. Softw. 33, 1–22. doi: 10.18637/jss.v033.i02
Haegele, J. W., Cook, K. A., Nichols, D. M., Below, F. E. (2013). Changes in nitrogen use traits associated with genetic improvement for grain yield of maize hybrids released in different decades. Crop Sci. 53, 1256–1268. doi: 10.2135/cropsci2012.07.0429
Han, M., Okamoto, M., Beatty, P. H., Rothstein, S. J., Good, A. G. (2015). The genetics of nitrogen use efficiency in crop plants. Annu. Rev. Genet. 49, 269–289. doi: 10.1146/annurev-genet-112414-055037
Heidelberger, P., Welch, P. D. (1983). Simulation run length control in the presence of an initial transient. Oper. Res. 31, 1109–1144. doi: 10.1287/opre.31.6.1109
Heinemann, A. B., Ramirez-Villegas, J., Souza, T. L. P., Didonet, A. D., di Stefano, J. G., Boote, K. J., et al. (2016). Drought impact on rainfed common bean production areas in Brazil. Agric. For. Meteorol. 225, 57–74. doi: 10.1016/j.agrformet.2016.05.010
Horwitz, W. (1975). Official methods of analysis (Washington, DC: Association of Official Analytical Chemists).
Kamfwa, K., Cichy, K. A., Kelly, J. D. (2019). Identification of quantitative trait loci for symbiotic nitrogen fixation in common bean. Theor. Appl. Genet. 132, 1375–1387. doi: 10.1007/s00122-019-03284-6
Kefauver, S. C., Vicente, R., Vergara-Díaz, O., Fernandez-Gallego, J. A., Kerfal, S., Lopez, A., et al. (2017). Comparative UAV and field phenotyping to assess yield and nitrogen use efficiency in hybrid and conventional barley. Front. Plant Sci. 8, 1733. doi: 10.3389/fpls.2017.01733
Laidig, F., Piepho, H.-P., Rentel, D., Drobek, T., Meyer, U., Huesken, A. (2017). Breeding progress, environmental variation and correlation of winter wheat yield and quality traits in German official variety trials and on-farm during 1983–2014. Theor. Appl. Genet. 130, 223–245. doi: 10.1007/s00122-016-2810-3
Leal, F. T., Filla, V. A., Bettiol, J. V. T., Sandrini, F., de, O. T., Mingotte, F. L. C., et al. (2019). Use efficiency and responsivity to nitrogen of common bean cultivars. Ciec. e Agrotecnol. 43, e004919. doi: 10.1590/1413-7054201943004919
Lopes, M. A., Faleiro, F. G., Ferreira, M. E., Lopes, D. B., Vivian, R., Boiteux, L. S. (2012). Embrapa’s contribution to the development of new plant varieties and their impact on Brazilian agriculture. Crop Breed. Appl. Biotechnol. 12, 31–46. doi: 10.1590/S1984-70332012000500005
MAPA (2020). Ministry of Agriculture, Livestock and Food Supply. Available at: http://sistemas.agricultura.gov.br/snpc/cultivarweb/cultivares_registradas.php (Accessed April 27, 2020).
Moda-Cirino, V., Gerage, A. C., Riede, C. R., Sera, G. H., Takahashi, M., Abbud, N. S., et al. (2012). Plant breeding at Instituto Agronômico do Paraná: IAPAR. Crop Breed. Appl. Biotechnol. 12, 25–30. doi: 10.1590/S1984-70332012000500004
Moll, R. H., Kamprath, E. J., Jackson, W. A. (1982). Analysis and Interpretation of Factors Which Contribute to Efficiency of Nitrogen Utilization1. Agron. J. 74, 562. doi: 10.2134/agronj1982.00021962007400030037x
Moreira, S. O., Silva, M. G., Rodrigues, R., Viana, A. P., Pereira, M. G. (2010). Breeding methods and history of bean cultivars released in CBAB-Crop Breeding and Applied Biotechnology. Crop Breed. Appl. Biotechnol. 10, 345–350. doi: 10.1590/S1984-70332010000400009
Mueller, S. M., Messina, C. D., Vyn, T. J. (2019). Simultaneous gains in grain yield and nitrogen efficiency over 70 years of maize genetic improvement. Sci. Rep. 9, 1–8. doi: 10.1038/s41598-019-45485-5
Myers, J. R., Kmiecik, K. (2017). “Common Bean: Economic Importance and Relevance to Biological Science Research,” in The Common Bean Genome. Compendium of Plant Genomes. Eds. de la Vega, P. M., Santalla, M., Marsolais, F. (New York, US: Springer), 1–20. doi: 10.1007/978-3-319-63526-2_1
Nascimento, M., Nascimento, A. C. C., e Silva, F. F., Teodoro, P. E., Azevedo, C. F., de Oliveira, T. R. A., et al. (2020). Bayesian segmented regression model for adaptability and stability evaluation of cotton genotypes. Euphytica 216, 30. doi: 10.1007/s10681-020-2564-5
Neilson, E. H., Edwards, A. M., Blomstedt, C. K., Berger, B., Møller, B. L., Gleadow, R. M. (2015). Utilization of a high-throughput shoot imaging system to examine the dynamic phenotypic responses of a C4 cereal crop plant to nitrogen and water deficiency over time. J. Exp. Bot. 66, 1817–1832. doi: 10.1093/jxb/eru526
Oliveira, A., Pereira da Silva, C., Nuvunga, J. J., Da Silva, A. Q., Balestre, M. (2015). Credible Intervals for Scores in the AMMI with Random Effects for Genotype. Crop Sci. 55, 465–476. doi: 10.2135/cropsci2014.05.0369
Pereira, H. S., Alvares, R. C., Melo, L. C., da Costa, A. F., de Carvalho, H. W. L. (2017). Culinary and nutritional quality of common bean lines with Carioca grain type and interaction with environments. Rev. Ceres. 64, 159–166. doi: 10.1590/0034-737x201764020008
Pereira, H. S., Faria, L. C., Wendland, A., Costa, J. G. C., Souza, T. L. P., Melo, L. C. (2018). Genotype by environment interaction for disease resistance and other important agronomic traits supporting the indication of common bean cultivars. Euphytica 214, 12. doi: 10.1007/s10681-017-2093-z
Pereira, H. S., Mota, A. P. S., Rodrigues, L. A., de Souza, T. L. P. O., Melo, L. C. (2019). Genetic diversity among common bean cultivars based on agronomic traits and molecular markers and application to recommendation of parent lines. Euphytica 215, 38. doi: 10.1007/s10681-018-2324-y
Pinto Júnior, R. A., Patto, M. A., Martins, E. S., Abreu, Â.de F.B. (2018). Inheritance of harvest index in common bean. Crop Breed. Appl. Biotechnol. 18, 252–258. doi: 10.1590/1984-70332018v18n3a38
Plummer, M., Best, N., Cowles, K., Vines, K. (2006). CODA: convergence diagnosis and output analysis for MCMC. R News 6, 7–11.
Razvi, S. M., Khan, M. N., Bhat, M. A., Ahmad, M., Ganaie, S. A. N., Sheikh, F. A., et al. (2018). Morphological variability and phylogenetic analysis in Common bean (Phaseolus vulgaris L.). Legum Res. 41, 208–212. doi: 10.18805/LR-3421
Resende, R. T., Piepho, H.-P., Silva-Junior, O. B., e Silva, F. F., de Resende, M. D. V., Grattapaglia, D. (2019). Enviromics in breeding: applications and perspectives on envirotypic-assisted selection. bioRxiv, 726513l. doi: 10.1101/726513
Rezende, A. A., Pacheco, M. T. B., Silva, V. S. N., Ferreira, T. A. P. D. (2017). Nutritional and protein quality of dry Brazilian beans (Phaseolus vulgaris L.). Food Sci. Technol. 38, 421–427. doi: 10.1590/1678-457x.05917
Ribeiro, N. D., Steckling, S. D. M., Maziero, S. M., Klasener, G. R. (2020). Higher-precision experimental statistics for the selection of early and upright common bean lines. Acta Sci. Agron. 42, e42725. doi: 10.4025/actasciagron.v42i1.42725
Rozbicki, J., Ceglińska, A., Gozdowski, D., Jakubczak, M., Cacak-Pietrzak, G., Mądry, W., et al. (2015). Influence of the cultivar, environment and management on the grain yield and bread-making quality in winter wheat. J. Cereal Sci. 61, 126–132. doi: 10.1016/j.jcs.2014.11.001
Shibata, H., Galloway, J. N., Leach, A. M., Cattaneo, L. R., Cattell Noll, L., Erisman, J. W., et al. (2017). Nitrogen footprints: Regional realities and options to reduce nitrogen loss to the environment. Ambio 46, 129–142. doi: 10.1007/s13280-016-0815-4
Smyčka, J., Keil, P. (2020). bPCA - Bayesian Principal Components Analysis. Available at: https://github.com/petrkeil/bPCA.
Spiegelhalter, D. J., Best, N. G., Carlin, B. P., van der Linde, A. (2002). Bayesian measures of model complexity and fit. J. R. Stat. Soc. B 64, 583–639. doi: 10.1111/1467-9868.00353
Stahl, A., Pfeifer, M., Frisch, M., Wittkop, B., Snowdon, R. J. (2017). Recent Genetic Gains in Nitrogen Use Efficiency in Oilseed Rape. Front. Plant Sci. 8, 963. doi: 10.3389/fpls.2017.00963
Teodoro, P. E., Azevedo, C. F., Farias, F. J. C., Alves, R. S., de Azevedo Peixoto, L., Ribeiro, L. P., et al. (2019). Adaptability of cotton (Gossypium hirsutum) genotypes analysed using a Bayesian AMMI model. Crop Pasture Sci. 70, 615. doi: 10.1071/CP18318
Thorwarth, P., Liu, G., Ebmeyer, E., Schacht, J., Schachschneider, R., Kazman, E., et al. (2019). Dissecting the genetics underlying the relationship between protein content and grain yield in a large hybrid wheat population. Theor. Appl. Genet. 132, 489–500. doi: 10.1007/s00122-018-3236-x
Todeschini, M. H., Milioli, A. S., Rosa, A. C., Dallacorte, L. V., Panho, M. C., Marchese, J. A., et al. (2019). Soybean genetic progress in South Brazil: physiological, phenological and agronomic traits. Euphytica 215, 124. doi: 10.1007/s10681-019-2439-9
Tsutsumi, C. Y., Bulegon, L. G., Piano, J. T. (2015). Melhoramento genético do feijoeiro, avanços, perspectivas e novos estudos. Nativa 3, 217–223. doi: 10.14583/2318-7670.v03n03a12
Keywords: Phaseolus vulgaris L., plant breeding, abiotic stress, Additive Main effects and Multiplicative Interaction (AMMI), Nitrogen Efficiency Use (NUE)
Citation: Zeffa DM, Moda-Cirino V, Medeiros IA, Freiria GH, Neto JdS, Ivamoto-Suzuki ST, Delfini J, Scapim CA and Gonçalves LSA (2020) Genetic Progress of Seed Yield and Nitrogen Use Efficiency of Brazilian carioca Common Bean Cultivars Using Bayesian Approaches. Front. Plant Sci. 11:1168. doi: 10.3389/fpls.2020.01168
Received: 27 May 2020; Accepted: 20 July 2020;
Published: 05 August 2020.
Edited by:
Roberto Papa, Marche Polytechnic University, ItalyReviewed by:
Caléo Panhoca De Almeida, Instituto Agronômico de Campinas (IAC), BrazilHamid Khazaei, University of Saskatchewan, Canada
Copyright © 2020 Zeffa, Moda-Cirino, Medeiros, Freiria, Neto, Ivamoto-Suzuki, Delfini, Scapim and Gonçalves. This is an open-access article distributed under the terms of the Creative Commons Attribution License (CC BY). The use, distribution or reproduction in other forums is permitted, provided the original author(s) and the copyright owner(s) are credited and that the original publication in this journal is cited, in accordance with accepted academic practice. No use, distribution or reproduction is permitted which does not comply with these terms.
*Correspondence: Douglas Mariani Zeffa, douglas.mz@hotmail.com; Leandro Simões Azeredo Gonçalves, leandrosag@uel.br