Article

Variations of Macro- and Microelements in Yellow-Fleshed Cassava (Manihot esculenta Crantz) Genotypes as a Function of Storage Root Portion, Harvesting Time, and Sampling Method

by
Emmanuel Oladeji Alamu
1,*,
Busie Maziya-Dixon
2,
Consent Sibeso
1,
Elizabeth Parkes
1 and
Alfred Gilbert Dixon
1
1
International Institute of Tropical Agriculture, Southern Africa, Research and Administration Hub (SARAH) Campus, P.O. Box 310142, Chelstone, Lusaka 10101, Zambia
2
International Institute of Tropical Agriculture, PMB 5230, Ibadan 20001, Oyo State, Nigeria
*
Author to whom correspondence should be addressed.
Appl. Sci. 2020, 10(16), 5396; https://doi.org/10.3390/app10165396
Submission received: 18 June 2020 / Revised: 7 July 2020 / Accepted: 7 July 2020 / Published: 5 August 2020
(This article belongs to the Section Food Science and Technology)

Abstract

:

Featured Application

This study has provided information on the quantitative and qualitative information on the distribution of macro and trace elements and their concentrations within the cassava tuber (proximal, middle, and distal root portions). The data on the minerals of yellow-fleshed cassava roots could contribute to food composition databases. The knowledge generated would be of interest to researchers (cassava breeders and food scientists), food processors, dieticians, and policymakers in programming interventions. Yellow-fleshed cassava could be an alternative source of macro- and microelements for both humans and livestock.

Abstract

The correct estimation of the mineral content of cassava (Manihot esculenta) genotypes is vital from a nutritional point of view. This study evaluated the effects of the storage root section, maturity, and sampling method on the macro- and microelements in yellow-fleshed cassava root genotypes. In total, 44 genotypes were grown in replicated field trials of 2 sets (set 25 and set 19) and were harvested at 9 and 12 months after planting. Two sampling methods, sampling with a cork borer (A = proximal, B = middle, C = distal or method 1) and sampling without a cork borer (L = Longitudinal or method 2), were used. The minerals of the samples from the two methods were determined using inductively coupled optical emission spectrometry (ICP-OES). K and Mn were the most abundant minerals, and Na, Mo, and Co were the least abundant. Genotype, method, and maturity had a strong influence on mineral concentrations. Harvesting time affected the concentration level of some macro- and microelements in cassava roots. Additionally, Ca, Mg, K, P, Mn, Cu, Ni, and Zn contents were significantly (p < 0.05) higher in the proximal and middle portions for method 1. K and P and Mn and B were positively correlated, but K and Na and Fe and Ni were negatively associated.

1. Introduction

Minerals are the constituents that remain as ash after the combustion of plant and animal tissues. Minerals can be classified as primary (macro) elements, trace elements, and ultra-trace elements, and the main elements are essential for human beings in amounts >50 mg/day. Essential macroelements, such as Na, K, Mg, P, and S, are found in cassava and can play a vital role in the human body. Trace elements are naturally occurring inorganic substances required in humans in amounts <100 mg/day. They are essential components of biological structures and have an essential effect on and play a vital role in a variety of the processes necessary for life by mediating vital biochemical reactions [1].
Still, the potential of cassava as a significant source of these elements is yet to be fully exploited. Cassava (Manihot esculenta Crantz) is a tuberous root that belongs to the Euphorbiaceae family. It is also known as manioc, tapioca, or yucca. Cassava is adaptable to a variety of environmental conditions and is an essential source of nutrients and energy. It is the third-largest source of carbohydrates after rice and maize [2,3]. Although cassava leaves are consumed at times for food and medicinal purposes, its tuber (the swollen root of the plant) is the standard part of the plant that is consumed widely [4]. It is argued that more than two-thirds of the total production of cassava is used as food for humans, with lesser amounts being used for animal feed and industrial purposes [5]. Cassava can be consumed either in its natural form (i.e., boiled) or in a variety of industrially or traditionally processed forms, known under various names depending on the preferences and local customs. Cassava flour is one of these products, as well as chips and starch [6]. The root flour (high-quality cassava flour, HQCF) is gaining recognition as a suitable wheat flour substitute in biscuits and the fast-food industry. It is an essential raw material in the food industry preparation of a wide array of value-added products, such as bread, cookies, confectionery, pasta, and couscous-like products, and the production of adhesives. It is also used as a thickener in foods that are not subject to rigorous processing conditions. Indeed, although cassava flour has a low nutritional value, it remains an essential food in several parts of the world, as it is less expensive than wheat and can be used to produce a variety of food products [7,8,9].
Both macro and trace minerals are needed for the growth and maintenance of human body structures. The human body uses minerals for the proper composition of bone and blood, as well as the maintenance of normal cell function. Thus, diets rich in minerals are essential for proper growth and development. Further, as reported, essential macroelements, such as Ca, K, Mg, and P, which are found in cassava roots, play a vital role in the human body [10]. Ca, for example, is responsible for several metabolic functions, such as blood coagulation, muscle contraction regulation, hormone secretion, and neurotransmission. Mg is a macroelement that participates in energy metabolism and is involved in protein synthesis. Daily intake of sodium averages from 2.5 g (females) to 3.3 g (males); the adult average requirement ranges from 1.3 to 1.6 g/day (equal to 3.3–4.0 g/day NaCl). The intake of too little or too much sodium can result in severe disorders. From a nutritional standpoint, only the excessive consumption of sodium is of importance because it can lead to hypertension. A low intake of sodium can be achieved by a non-salty diet or by using diet salt [11].
Likewise, trace elements also have several important roles in human bodies. Some are essential for enzyme reactions, where they attract and facilitate the conversion of substrate molecules to specific end-products. Moreover, some of them donate or accept electrons in redox reactions that are of primary importance in the generation and utilization of metabolic energy. Some of them have structural roles and responsibilities for the stability of critical biological molecules. Furthermore, some trace elements have necessary actions throughout biological processes, for example, ıron (Fe), which can bind, transport, and release oxygen in the body. The established recommended daily amount (RDA) for Fe is 13.7–15.1 mg/day in children, 19.3–20.5 mg/day in men, and 17.0–18.9 mg/day in women, and for Zn, it is 8 mg/day for women and 11 mg/day for men. It is particularly vital for healthy skin and is essential for a healthy immune system and resistance to infection. Zn plays a crucial role in growth and cell division, where it is required for protein and DNA synthesis, in insulin activity, in the metabolism of the ovaries and testes, and liver function. Mn helps the body to form connective tissue, bones, blood-clotting factors, and sex hormones. It also plays a role in fat and carbohydrate metabolism, calcium absorption, and blood sugar regulation. Mn is also necessary for a healthy brain and nerve function. Co is an essential trace element for the human body, where it is a crucial constituent of cobalamin (the scientific name of vitamin B12). It also has a substantial role in the formation of amino acids and neurotransmitters [1].
It has been reported in the literature that the mineral element contents of plants are affected by the plant cultivar, soil conditions, weather conditions during the growing season, use of fertilisers, and the stage of plant maturity at harvest [12]. However, the variability of values of macroelements reported in the literature for cassava roots has revealed discrepancies that surpass those expected from the effects of the factors above but could be due to analytic inaccuracy, especially from the sampling method used. The correct estimation of the macro- and microelement content of cassava genotypes is vital from a nutritional point of view, especially for controlling and improving mineral intake in sub-Saharan Africa. There is a scarcity of information on the spatial distribution of both macro- and microelement contents of yellow-fleshed cassava storage roots. Based on this background, the present study aimed to evaluate the spatial distribution of macro and microelements in yellow-fleshed cassava root genotypes and establish the effect of the sampling method and harvesting time on their content. The knowledge generated from this study can be used by researchers, processors, dieticians, and policymakers in programming interventions.

2. Materials and Methods

2.1. Collection of Genetic Materials

A total of 39 yellow cassava genotypes from unlimited yield trials (UYTs) with β carotene-rich storage roots (yellow-fleshed) and five white-fleshed varieties (as checks) were grown in replicated field trials at the research farm of the International Institute of Tropical Agriculture (IITA), Ibadan, Nigeria. The 44 genotypes and varieties were planted in two sets. The set 1 trial comprised 22 genotypes with β-carotene-enriched roots and three check genotypes with white roots (30,572, TME 1, and 91/02324). The set 2 trial comprised 17 genotypes with β-carotene-enriched roots and two check varieties with white roots (30,572 and 91/02324). Through the crossbreeding of the wild-type varieties, the cassava breeders have been trying to improve the nutritional value, especially the β-carotene-enriched roots. The two sets were different from each other by the source (parent lines with different quality traits) used for the breeding crosses, which could dictate the mineral chemical properties of the genotypes. The experiments were planted during the rainy season in July and grown under rainfed conditions without the application of fertilisers or herbicides. The storage roots were harvested at 9 and 12 months after planting (MAP). Only the two middle rows were harvested per plot, and the cassava roots processed were collected from only one replication. Three plants per genotype were harvested, and six cassava roots of different sizes (large, medium, and big) were randomly selected per genotype and placed in a labelled polyethene bag and transferred to the laboratory for sample preparation for analysis.

2.2. Preparation of Samples

2.2.1. Sampling Method 1

The method reported by Maziya-Dixon et al. [13] was used for the first sampling method. In the laboratory, three storage roots of different sizes (large (900–2300 g), medium (500 to 899 g), and small (200 to 499 g)) were selected, washed thoroughly with potable water to remove dirt and sand particles, and air-dried on a clean concrete floor for about 5–10 min at atmospheric conditions. The storage roots were peeled manually using a stainless-steel knife and rinsed with deionized water. A cork borer (size 8) was used to bore through the storage roots, with the depth ranging from 4.6 to 9.7 cm, 3.8 to 7.1 cm, and 3.6 to 6.4 cm for the proximal, middle, and distal parts of the roots, respectively, and each portion was homogenized [13]. The rinsing of tubers and the sampling method guaranteed the elimination of mineral contaminants from the dirt and sand adhered to the tubers.

2.2.2. Sampling Method 2

The second sampling method was also described by Maziya-Dixon et al. [13]. A new set of the 3 storage roots of different sizes (large, medium, and small) were selected, washed thoroughly with potable water to remove dirt and adhered sand particles, and air-dried on a clean concrete floor. The storage roots were peeled manually using a stainless-steel knife, rinsed with deionized water, and cut longitudinally (from the proximal end to the distal end) into four equal parts. Two opposite sections from each root of each genotype were taken, combined, manually chopped into small pieces, and mixed thoroughly.

2.3. Determination of Macro- and Microelement Content

The samples for the determination of macro- and microelements were taken from the batch samples from the above-described two sampling methods. The samples were rinsed with deionized water, and placed in a petri dish and dried in an uncorroded conventional oven at 40 °C for 3 days. After drying, the samples were packed in labelled mineral-free paper envelopes. The macro- and microelement contents were analysed using inductively coupled optical emission spectrometry (ICP-OES) according to the validated method described by Wheal et al. [14]. A radial view Spectro Ciros CCD ICP-OES (Spectro Analytical Instruments, Kleve, Germany) was used, and all samples were digested with the closed-tube nitric acid/hydrogen peroxide digestion method as described elsewhere by Wheal et al. [14]. About 0.30 g of the dried sample was weighed to 1 mg into 50-mL screw-cap polypropylene tubes, and 2.0 mL of HNO3 and 0.5 mL of H2O2 were added to initiate the sample digestion. The digestion was done at 125 °C for 120 min using 72-position DigiPrep digestion blocks (SCP Scientific, Baie D’Urf e, Quebec, Canada). The samples were made to a final volume of 25 mL with 18 MΩ.cm water. The sample flow rate was 2.0 mL/min, and the total analysis time per sample was approximately 2.5 min. The calibration curves for all elements were created from mixtures of high-purity single-element standard solutions in a 4% (v/v) HNO3 matrix. Background correction was applied to all wavelengths, and spectral interferences were applied where required using software algorithms [14]. A drift correction solution (a mixture of all elements prepared in 4% HNO3) was analysed every 25 samples to account for within-run variation in the flows, etc. Additionally, the blank subtraction, the drift correction, and other data processing (mass and volume adjustments) were performed offline [14]. Six different reference materials (RMs) were obtained from the US National Institute of Standards and Technology (NIST, Gaithersburg, MD, USA) and used to establish the quality of the data [14].
Each sample was run in duplicate. The macroelements identified in all the genotypes and varieties investigated were calcium (Ca), magnesium (Mg), sodium (Na), potassium (K), phosphorus (P), and sulphur (S). The microelements identified in all the genotypes and varieties investigated were iron (Fe), manganese (Mn), boron (B), copper (Cu), molybdenum (Mo), cobalt (Co), nickel (Ni), zinc (Zn), and aluminium (Al).

2.4. Statistical Analysis

Data were subjected to analysis of variance, descriptive statistics, and Pearson correlation analysis using the Statistical Analysis System software (SAS) [15]. Means were separated using Fisher’s protected least significance difference test at p < 0.05.

3. Results and Discussion

3.1. Macro- and Micromineral Contents of Yellow-Fleshed Cassava Roots Across Genotypes, Locations, and Sets 1 and 2

The macro- and micromineral contents of yellow-fleshed cassava root across all the genotypes and locations are presented in Table 1. The most abundant mineral in cassava storage roots was potassium (K), with concentrations ranging from 4300 to 26,000 mg/kg with an overall mean of 12,116 ± 3543.58 mg/kg for trial 1, and ranged from 6300 to 38,000 mg/kg with a mean value of 17,883.60 ± 4898.77 mg/kg for trial 2. However, the least abundant mineral was sodium (Na), with concentrations ranging from 15.68 to 2100 mg/kg with an overall mean of 228.22 ± 316.74 mg/kg for trial 1, and from 11.47 to 186.73 mg/kg with a total mean value of 39.19 ± 23.41 mg/kg for trial 2. The results also showed that trial 2 had higher concentrations of calcium (Ca), magnesium (Mg), and potassium (K) than trial 1. Still, trial 1 sets had a higher content of Na, P (phosphorous), and S (sulphur). It could be deduced that the storage roots of cassava could be a good source of these macroelements, especially potassium. Diets rich in minerals are essential for proper growth and development [11]. This result agrees with Aro et al. [16], who reported that the highest mineral content of the cassava samples studied was K (269 mg/kg), but contradicts with Bamidele et al. [17]. Among the mineral compositions of the four cassava samples they studied, Mg was the highest mineral found in all four cassava samples investigated, with values ranging between 185.1 and 321.5 mg/kg. Manano et al. [18] studied some local and improved high-yielding and cassava mosaic disease (CMD)-resistant cassava varieties grown in Uganda. The findings of this study indicated that the levels of minerals differed with the cassava variety. The cassava yellow root genotypes for both trials and 1 and 2 had very low Na, and this indicates that these genotypes could form part of a low-sodium diet. However, K regulates the osmotic pressure within the cell, and is involved in cell membrane transport and the activation of several glycolytic and respiratory enzymes. Potassium intake in a regular diet is 2–5.9 g/day. The minimum daily requirement is estimated to be 782 mg. It implies that cassava, with a high level of K and low Na, might be an ideal crop to consume to reduce hypertension, although this needs further research evidence.
The most abundant mineral in cassava storage roots was manganese (Mn), with concentrations ranging from 7.390 to 39.990 mg/kg with an overall mean of 16.511 ± 6.200 mg/kg for trial 1, and ranging from 4.540 to 42.680 mg/kg with a mean value of 13.383 ± 4.698 mg/kg for trial 2. However, the least abundant minerals were molybdenum (Mo) and cobalt (Co), with concentrations ranging from 0.600 to 0.700 mg/kg with an overall mean of 0.694 ± 0.025 and 0.675 ± 0.043 mg/kg for trial 1, and ranging from 0.600 to 3.000 mg/kg with total mean values of 0.708 ± 0.237 and 0.696 ± 0.239 mg/kg for trial 2, respectively. The results also showed that all the minerals in trial 2 had higher concentrations than trial 1, as found for macrominerals. It could be deduced that the storage roots of cassava could be a good source of these microelements, especially Mn.

3.2. Mean Squares (MS) of Macro- and Microelements of Yellow-Fleshed Cassava Root

The effects of genotypes, maturity, and method of sampling on the macro- and microelements of yellow-fleshed cassava roots are presented in Table 2 and Table 3. For trial 1, the ANOVA showed that genotype, method, and genotype × maturity interaction had a strong significant (p < 0.001) effect on all the macrominerals studied. However, maturity had no significant effect (p > 0.05) on Mg, Na, K, and S. Genotype × maturity interaction had a significant effect (p < 0.001) on all the minerals except for Ca. Only Mg, S, and Na showed a significant difference (p < 0.001) for genotype × method interaction. For maturity × method interaction, only Ca and Na showed a significant difference at (p < 0.001). For the data set 2 trial, there was a highly significant effect (p < 0.001) of genotype and genotype × maturity interaction on all the macroelements. Maturity and method had no significant effect (p < 0.05) on Mg and Ca, respectively. Though, genotype × method interaction had a significant effect (at p < 0.001) only on Na; maturity × method interaction showed no significant effect (p < 0.05) across all the minerals investigated. Thus, for both trials 1 and 2, the independent variables (genotype and maturity) explained the variations observed for all the dependent variables (Ca, Mg, Na, K, P, and S) rather than the basic mean.
Table 4 showed the effects of genotype, maturity, and method of sampling on the microelements of yellow-fleshed cassava roots. For trial 1, the ANOVA showed that genotype, maturity, method, genotype × maturity interaction, genotype × method interaction, and maturity × method interaction had a strong significant effect (p < 0.001) on all the minerals investigated except Al. However, genotype × method interaction had no significant effect (p > 0.05) on all the minerals except for Ni. From the dataset 2 trial, the ANOVA showed that genotype, maturity, method, genotype × maturity interaction, genotype × method interaction, and maturity × method interaction had a strong significant effect (p < 0.001) on all the minerals investigated except Co. However, the genotype × method interaction had no significant effect (p < 0.05) on all the minerals investigated. The study also revealed that maturity × method interaction had a significant difference (p < 0.001) on Mo, Ni, and Zn. Both maturity and genotype × maturity interaction had a significant difference at (p < 0.001) on Fe, Mg, B, Ni, Zn, and Al. Thus, for both trials 1 and 2, the independent variables (genotype and maturity) explained the variations observed for all the dependent variables (Ca, Mg, Na, K, P, and S) than the basic mean.

3.3. Macromineral Concentrations of Yellow-Fleshed Cassava Roots by Genotype

The means of the macromineral concentrations of yellow cassava roots (trial set 1) by genotype are shown in Table 4. For trial 1, significant differences (p < 0.05) existed amongst the means of the macroelements for all the genotypes. However, genotypes 01/1224 (2033 mg/kg) and 01/1412 (1742.3 mg/kg) had the highest Ca concentrations among the samples investigated. The lowest Ca value (596.3 mg/kg) was found for TME1, the check variety. Genotypes 01/1368 (676.2 mg/kg) and 90/01554 (650.5 mg/kg) had the highest levels of Na in all the samples examined. However, the Na concentrations were found to be the lowest in genotype 94/0330 (44 mg/kg). For K, considerably higher concentrations were recorded in genotype 01/1662 (20160 mg/kg). However, the lowest K values were recorded in genotype 94/3030 (8206.7 mg/kg). The highest concentrations for P were recorded in genotype 01/1335 (1993.7 mg/kg). However, the P concentration was considerably lower in the 01/1371 (813.3 mg/kg), 01/1412 (807.7 mg/kg), 01/1413 (847.7 mg/kg), and 01/1442 (801 mg/kg) genotypes.
From the results for trial 2 in Table 5, the study showed that genotype 01/1417 (2833.3 mg/kg) had the highest Ca content of all genotypes investigated. However, genotypes 01/1181 and 01/1206 showed a significantly higher Ca content than 30,572 (check) and 91/02324 (check). Although the highest Mg content was recorded in genotype 01/1417 (1679.7 mg/kg), its concentration was found to be the lowest in genotypes 01/1231 (753.7 mg/kg) and 01/1172 (721.7 mg/kg) from all the genotypes examined. The highest levels of Na content were recorded in genotype 01/1417 (73.9 mg/kg). The study revealed that the levels of K content in genotype 01/1206 (23,000 mg/kg) were higher than the rest of the genotypes. However, genotype 99/7558 (12,680 mg/kg) had the lowest levels of all the genotypes examined. For P, the study showed the highest concentration in the Z97/0474 (12,680 mg/kg) genotype of all the samples examined. However, genotypes 99/7558 (760 mg/kg) and 01/1296 (763.7 mg/kg) had the lowest levels of P content of all the genotypes. Genotype Z97/0474 (358 mg/kg) showed the highest levels of S content of all the samples studied. From the results above, all the genotypes with significantly higher mineral concentrations than the check genotypes could be recommended for breeding purposes. However, genotypes with no significant difference or significantly lower mineral concentrations than the check genotypes could not be recommended for such purposes as breeding.
From these results, it could be inferred that most of the genotypes had higher levels of mineral density than the check genotypes, and they could be advanced to the next stage in the breeding program. Additionally, there were significant differences in the macroelement concentrations among the genotypes. Most of the values obtained for the macroelements for all the genotypes compared well with what most researchers reported. Chiwona-Karltun et al. [19] reported the macroelement content of the nine cassava varieties as follows: Potassium content ranged from 6810 to 12,200 mg/kg, and sodium ranged from 1720 (Nalumino variety) to 4590 mg/kg (Bangweulu variety). Otache et al. [20] reported that the macroelements of the peel of the three cassava cultivars studied was a calcium content of 137.4 to 198.1 mg/kg), sodium of 137.0 to 142.3 mg/kg, magnesium of 128.0 to 148.1 mg/kg, and potassium of 787.2 to 1239.8 mg/kg. Besides, the authors also corroborated the finding from this study that cassava roots are rich in macroelements, especially potassium. However, the values of macroelements reported by Afoakwa et al. [21] for six varieties obtained from the Crop Research Institute of Council for Scientific and Industrial Research (CSIR) in Ghana were lower than those obtained in this study and reported. The reported calcium content ranged from 0.06 to 1.60 mg 100 g−1, sodium ranged from 0.25 to 0.37 mg 100 g−1, magnesium content ranged from 1.35 to 2.52 mg 100 g−1, and the potassium content ranged from 0.25 to 0.36 mg 100 g−1. The difference in the values could be due to the genotypic differences and the environment. This study used yellow-fleshed genotypes, but most of the authors have used white-fleshed varieties. This implies that yellow-fleshed varieties are rich in macroelements compared with white-fleshed varieties. Additionally, it was observed in this study that most of the genotypes had the lowest sodium content among the macroelements, which was not in agreement with what some authors (Aro et al. [16]; Afoakwa et al. [21]; Otache et al. [20]) reported for white-fleshed varieties. This could also be due to genetic variation in terms of yellow-fleshed versus white-fleshed varieties. However, Chavez et al. [22] and Manano et al. [17] reported sodium as the lowest macroelement in cassava roots, as found in this study, which reported a sodium content of 3.6 to 3.9 mg 100 g−1.

3.4. Micromineral Concentrations of Yellow Cassava Roots by Genotype

The means of the microminerals concentrations of yellow cassava roots (Trial 1) by genotype are shown in Table 6. There were significant differences (p 0.05) on the levels of minerals that existed amongst the cassava varieties. Genotype 01/1235 (13.033 mg/kg) had the highest Fe concentration compared to the rest of the samples of cassava genotypes investigated. However, the Fe contents were the lowest in the check genotype 91/02324 (5.637 mg/kg). On the other hand, its concentrations were significantly higher in genotypes 01/1662, 01/1412, and 01/1610 compared to those found in the check genotypes (TME, 91/02324, and 30,572). Although genotypes 01/1662 (24.414 mg/kg), 01/1273 (24.800 mg/kg), and 01/1335 (24.823 mg/kg) had the highest Mn contents, its concentration was found to be the lowest in genotypes 95/03379 (9.544 mg/kg). On the other hand, genotypes 01/1224, 01/1663, 90/01554, 98/2135, 94/0330, 01/1413, 01/1331, 01/1277, and 01/1235 showed significantly higher contents of Mn than all the check genotypes. Genotype 01/1335 (2.698 mg/kg) showed the highest levels of B as compared to the rest of the samples examined. Its concentration was also found to be significantly higher in genotypes 01/1662, 01/1273, 01/1277, 01/1331, 01/1442, 01/1649, 90/01554, and 95/0379. However, the rest of the genotypes showed the least concentrations of B. Genotype 01/1662 (5.504 mg/kg) showed the highest levels of Cu as compared to the rest of the cassava genotypes investigated. However, its contents were the lowest in genotype 01/1235 (1.745 mg/kg). On the other hand, Cu contents were found to be significantly higher in genotype 98/2132. All the genotypes had significant amounts of Co and were significantly the same with the checks. For Ni, the highest levels were recorded in genotype 01/1273 (3.449 mg/kg). However, its levels were the lowest in genotype 01/1412 (1.449 mg/kg). On the other hand, genotype 01/1335 showed significantly higher levels of Ni than what was found in the checks. Zinc (Zn) had the highest levels in genotype 01/1115 (11.523 mg/kg). The results of the study also showed that genotypes 01/1273, 01/1442, 95/0379, 01/1662, and 01/1371 had significantly higher levels of Zn than those found in check genotypes.
The means of the micromineral concentrations of yellow cassava roots (Trial 2) by genotype are shown in Table 7. There were significant differences in the microelement concentrations among the genotypes. Genotype 00/0028 (14.851 mg/kg) had the highest Fe concentration as compared to the rest of the cassava genotypes investigated. However, the Fe contents were found to be the lowest in the check genotype 91/02324 (5.539 mg/kg). Additionally, genotype 00/0028 (21.261 mg/kg) had the highest Mn content, while its concentration was found to be the lowest in genotypes 99/7558 (8.850 mg/kg) and 01/1172 (8.563 mg/kg). The study also revealed that genotypes 00/0028 (3.418 mg/kg) and 01/1181 (3.366 mg/kg) had the highest contents of B than the rest of the genotypes examined. However, its lowest concentrations were recorded in genotypes 01/1423 (2.105 mg/kg), 99/7558 (2.114 mg/kg), 01/1231 (2.106 mg/kg), 01/1551 (2.106 mg/kg), and check 91/0232 (2.107 mg/kg). For Cu, the highest concentrations were recorded in the check genotype 30,572 (8.131 mg/kg). However, its contents were the lowest in genotypes 01/1296 (3.061 mg/kg) and 01/1172 (3.326 mg/kg). All the genotypes recorded significant contents of both Mo and Co and were significantly the same with the checks. Nickel (Ni) had the highest concentration in genotype 00/0028 (3.325 mg/kg). All the genotypes showed significantly higher levels of the mineral concentration than the check genotypes, which are white-fleshed. Thus, the yellow-fleshed roots are richer in minerals than the white-fleshed roots. Besides, the genotypes that showed higher levels of mineral density than the check genotypes could be advanced to the next stage in the breeding program. Most of the values obtained for the microelements for all the genotypes compared well with what most researchers reported. Burns et al. [23] found that the concentrations of iron in tubers from all cultivars studied (range from 8–24 mg/kg) were at the low end of the published range for cassava (3−140 mg/kg). In contrast, the range of tuber zinc concentrations, 8−19 mg/kg, straddled the published standard for cassava of 14 mg/kg [23].

3.5. Effect of Maturity on the Macroelement and Microelement Contents of Yellow-Fleshed Cassava Roots

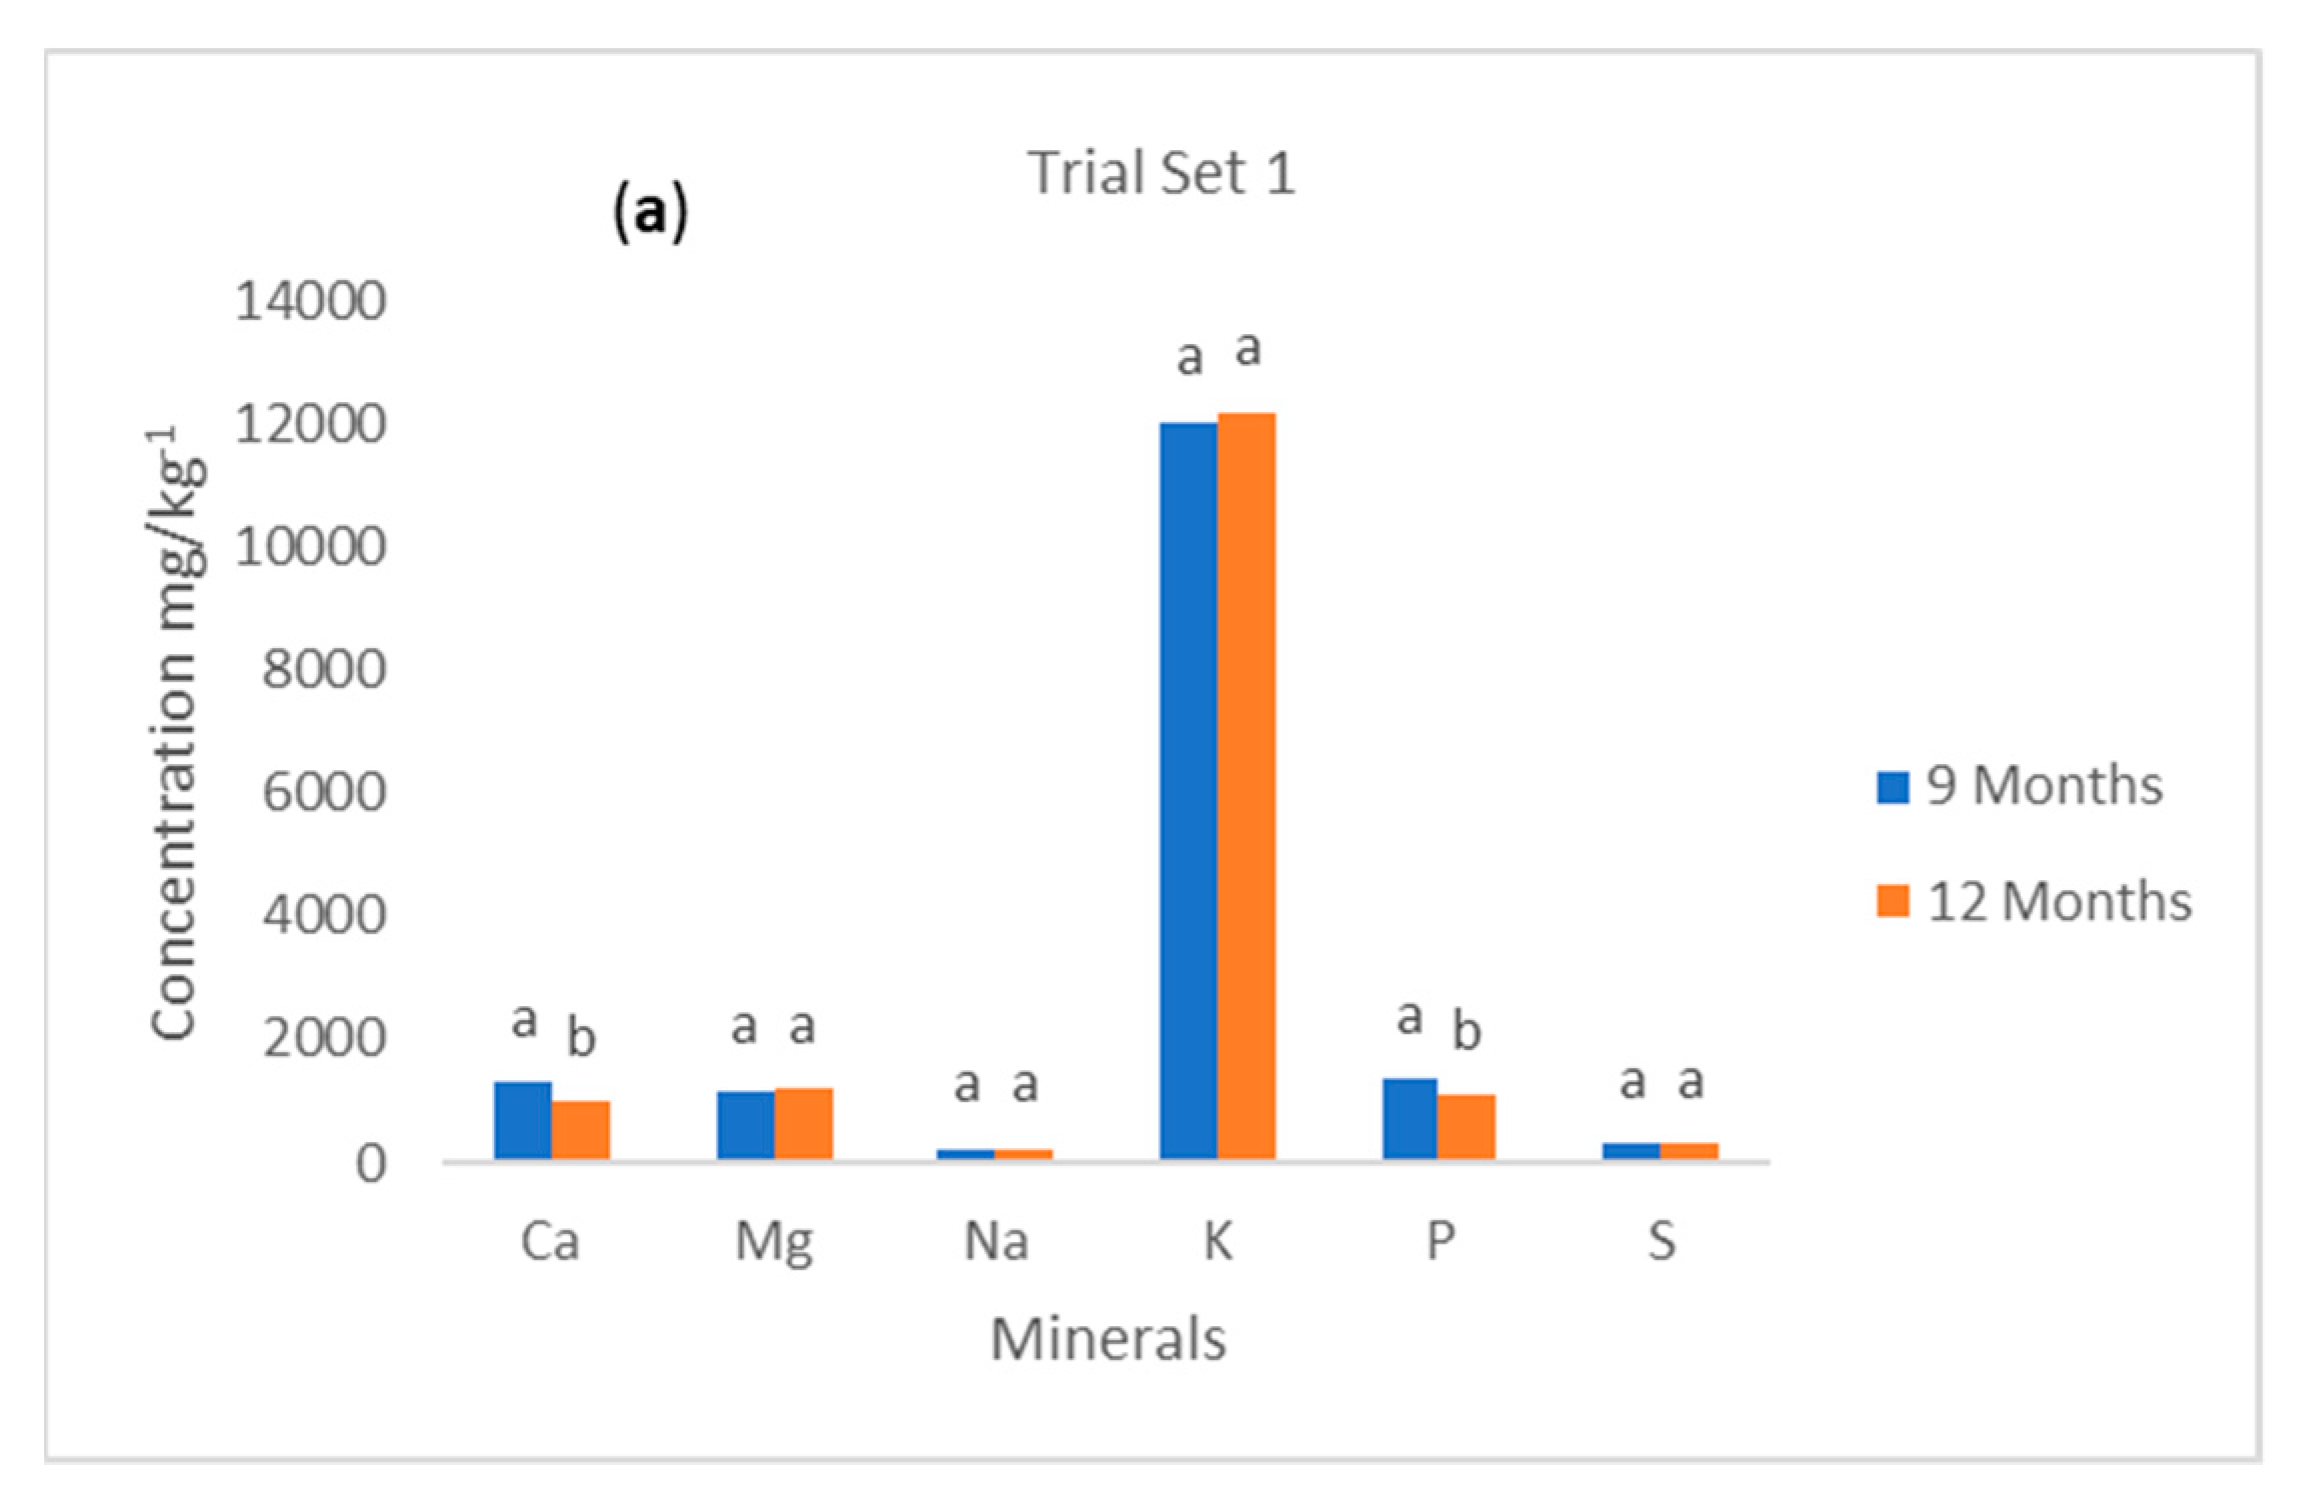
Figure 1a,b shows the concentrations of macrominerals in yellow-fleshed cassava roots by maturity (harvesting time) for both trials 1 and 2. For trial set 1, the study showed that there was a significant difference (p < 0.05) in the mean values for the Ca and P contents in cassava roots harvested at 9 and 12 months, respectively. However, the concentrations of Ca and P were higher in the cassava roots that were harvested at the age of 9 months than those at 12 months. Thus, harvesting time had a strong influence on the Ca and P content of cassava roots. However, there was no significant difference (p > 0.05) in the concentrations of Mg, Na, K, and S of cassava genotypes harvested at 9 and 12 months. For trial 2, the study showed that there was a significant difference (p < 0.05) between the mean concentrations of Ca, Na, K, S, and P for cassava roots harvested at 9 and 12 months. However, the Mg concentration showed no difference in the mean value for cassava roots harvested at both maturity stages. The concentration of Ca, Na, K, and P were higher in the cassava roots that were sampled at 9 months than those at 12 months except for S, which was higher in the samples that matured at 12 months. It implies that harvesting time plays a major role in the concentration level of some macroelements in cassava roots while showing no effect on some. Additionally, it was established that harvesting time showed different effects on the two trials investigated. Thus, genotype plays a key role in the degree of the effects the harvesting time had on the macroelement concentrations of cassava roots. Richardson [23] evaluated the macroelements of cassava sample materials that were harvested at nine months after planting and reported that the values of sodium ranged from 22.3 to 34.9 mg 100 g−1. In contrast, the values for potassium ranged from 817.3 to 1301.2 mg 100 g−1 [24]. If compared with what was obtained in this study for cassava genotypes harvested at 9 months for both trials studied, the values of potassium in this study were higher and those of sodium lower. The difference could be due to the different genetic make-up of yellow-fleshed and white-fleshed cassava roots. This further confirmed that yellow-fleshed roots contain more macroelements than the white-fleshed roots, especially K. However, the values of the macroelements obtained at 12 months for trial 2 compared well with what Chavez et al. [22] reported for cassava roots harvested at 10 to 11 months. He reported that samples had an average magnesium content of 1153 mg/kg, sodium averaged at 66.4 mg/kg, potassium averaged at 8903 mg/kg, phosphorus averaged at 1284 mg/kg, and sulphur averaged at 273 mg/kg dry weight. However, the macroelement values for trial 1 at 12 months showed higher values than what was reported in the literature [22].
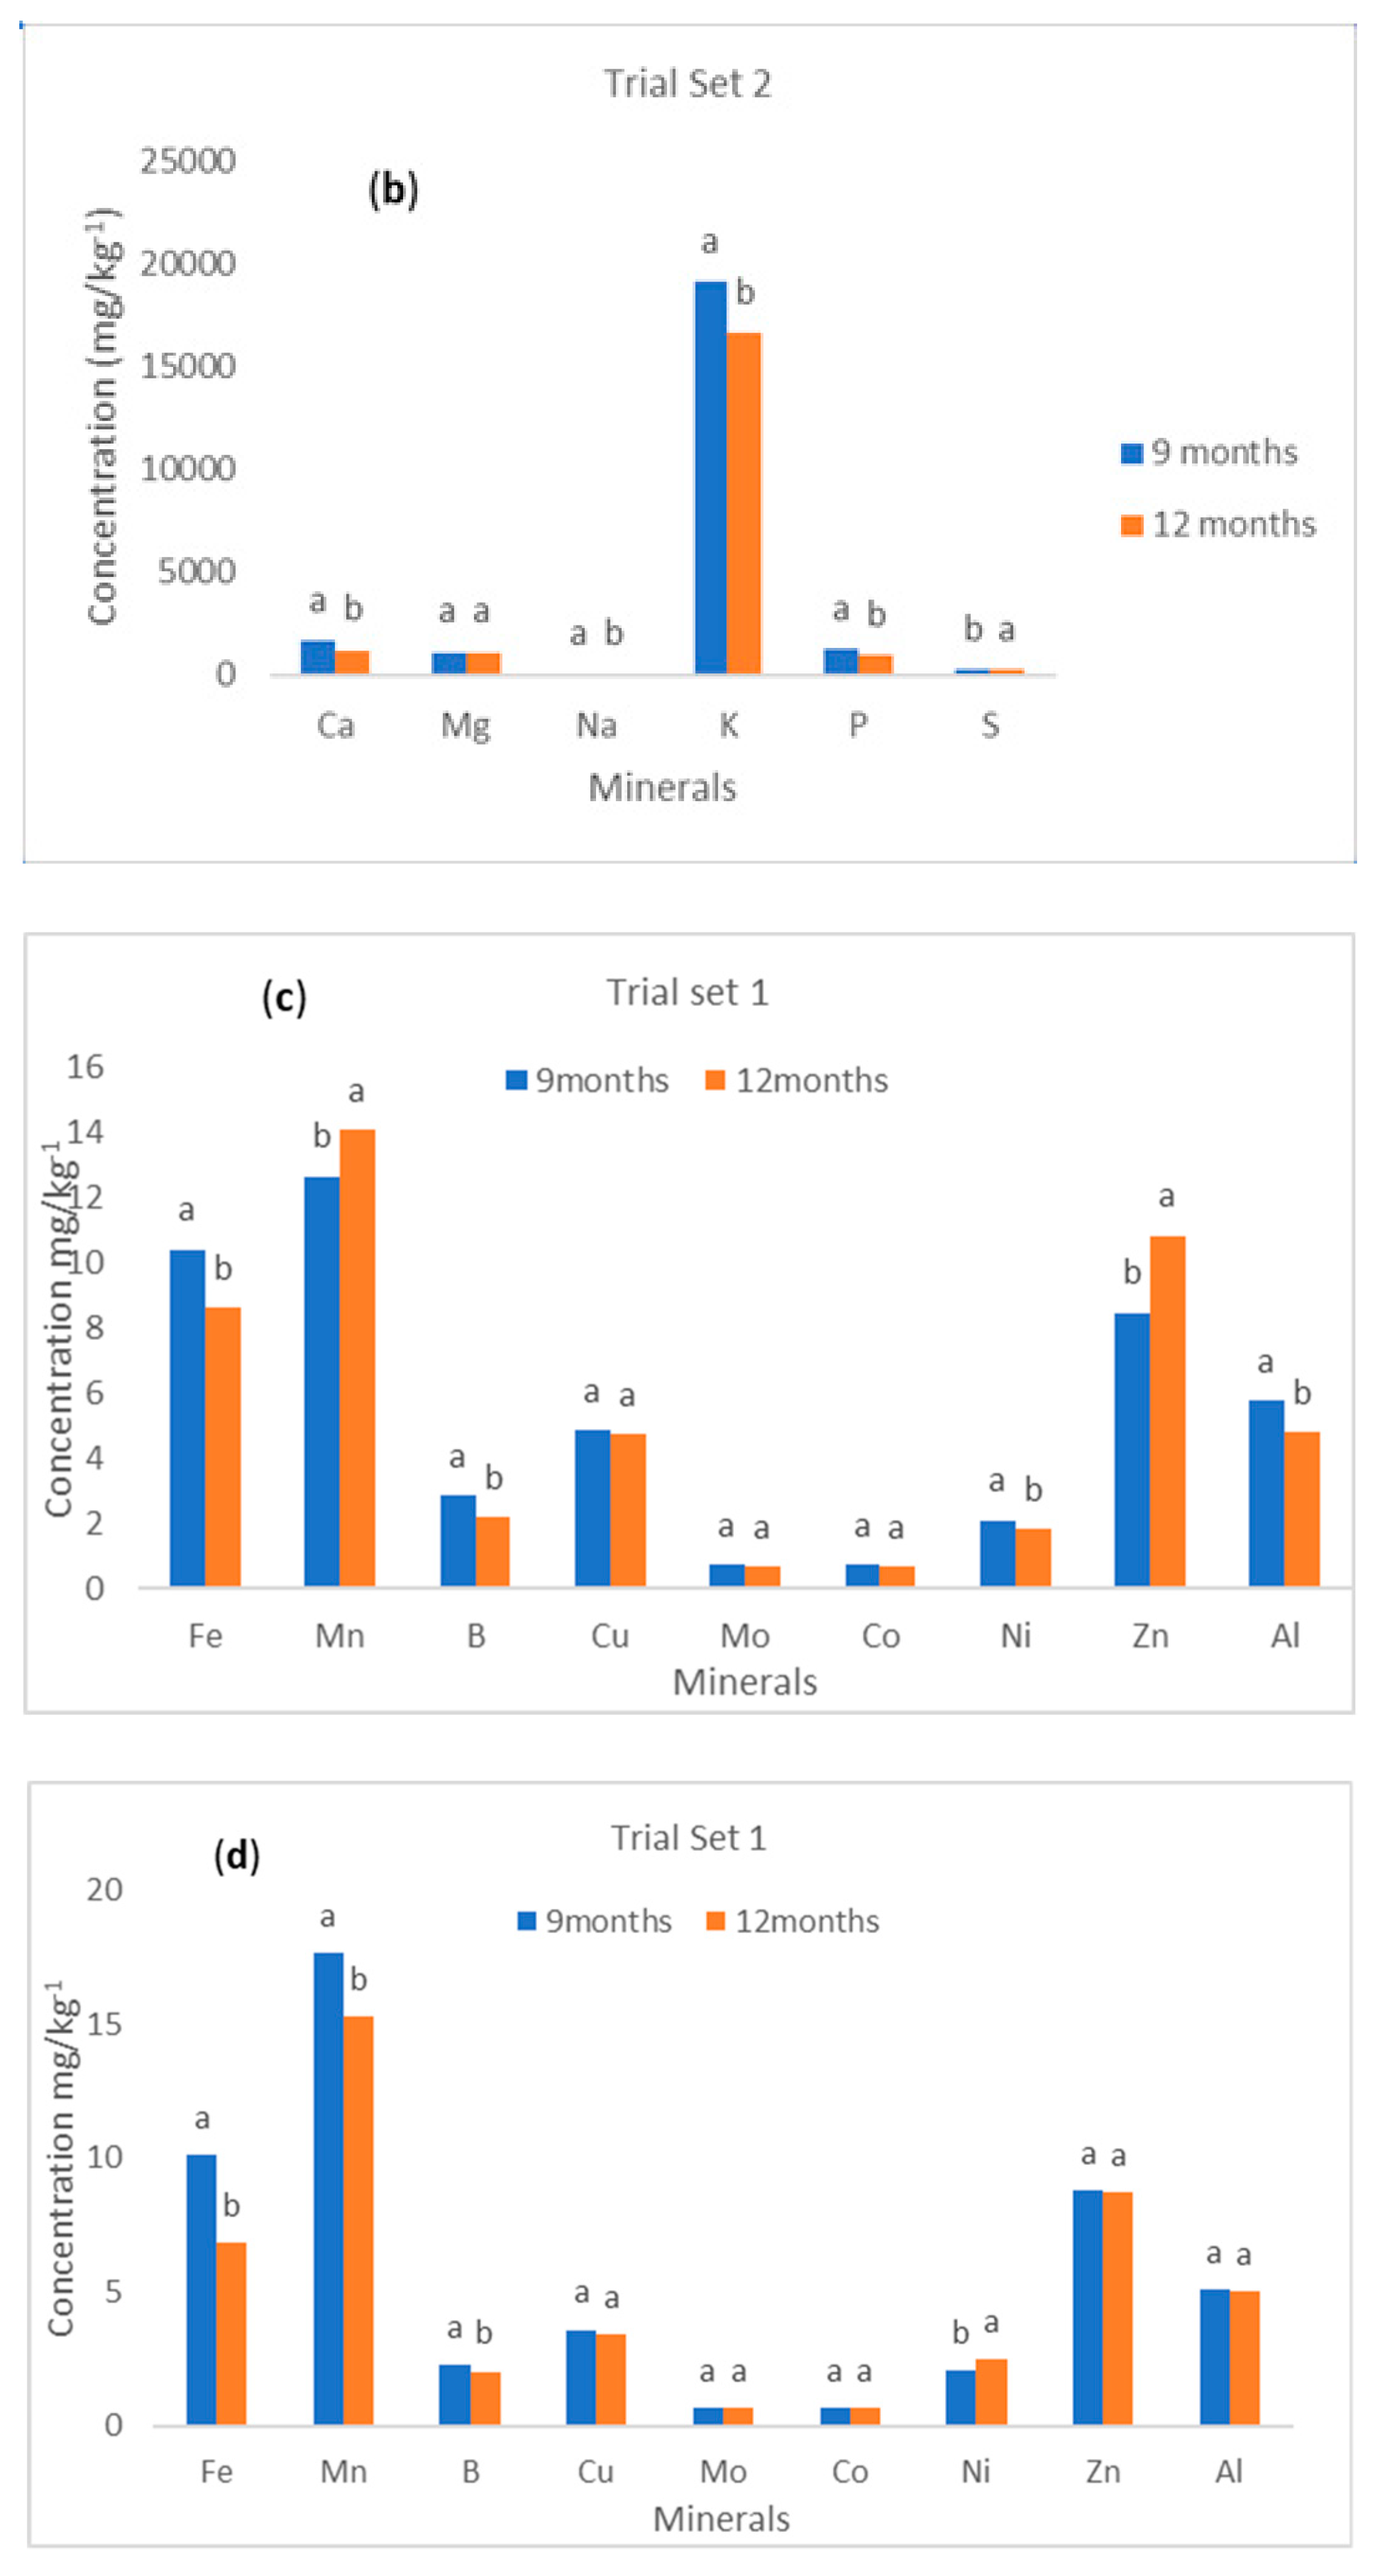
Figure 1c,d shows the levels of microelements in yellow-fleshed cassava roots by maturity (harvesting time) for both trial sets 1 and 2. For trial set 1, the study showed that there was a significant difference (p < 0.05) in the concentration of Fe, Mn, B, and Ni at different maturity levels. For Fe, Mn, and B, higher concentrations were found in cassava roots that were harvested at 9 months. However, higher contents of Ni were recorded in cassava roots that were harvested at 12 months. The results of the study also revealed that there was no significant difference (p > 0.05) in the contents of Cu, Mo, Co, Zn, and Al, regardless of the maturity stage. Thus, harvesting time had a strong influence on the contents of the minerals in cassava roots. For trial set 2, the study showed that there was a significant difference (p < 0.05) in the concentration of Fe, Mn, B, Ni, Zn, and Al at different maturity stages. The concentrations of Fe, B, Ni, and Al were found to be higher in the cassava roots that were harvested at 9 months. However, Mn and Zn contents were higher in cassava roots that were harvested at 12 months. The study further revealed that there was no significant difference (p > 0.05) in the contents of Cu, Mo, and Co regardless of the maturity stage. It implies that harvesting time plays a significant role in the concentration level of some microelements in the cassava roots while showing no effect on some. Additionally, it was established that harvesting time showed different effects on the two set trials investigated. Thus, genotype plays a vital role in the degree of effects the harvesting time showed on the microelement’s concentrations of cassava roots.

3.6. Effect of the Method of Sampling on the Distribution of the Macro- and Microelement Contents of Yellow-Fleshed Cassava Roots

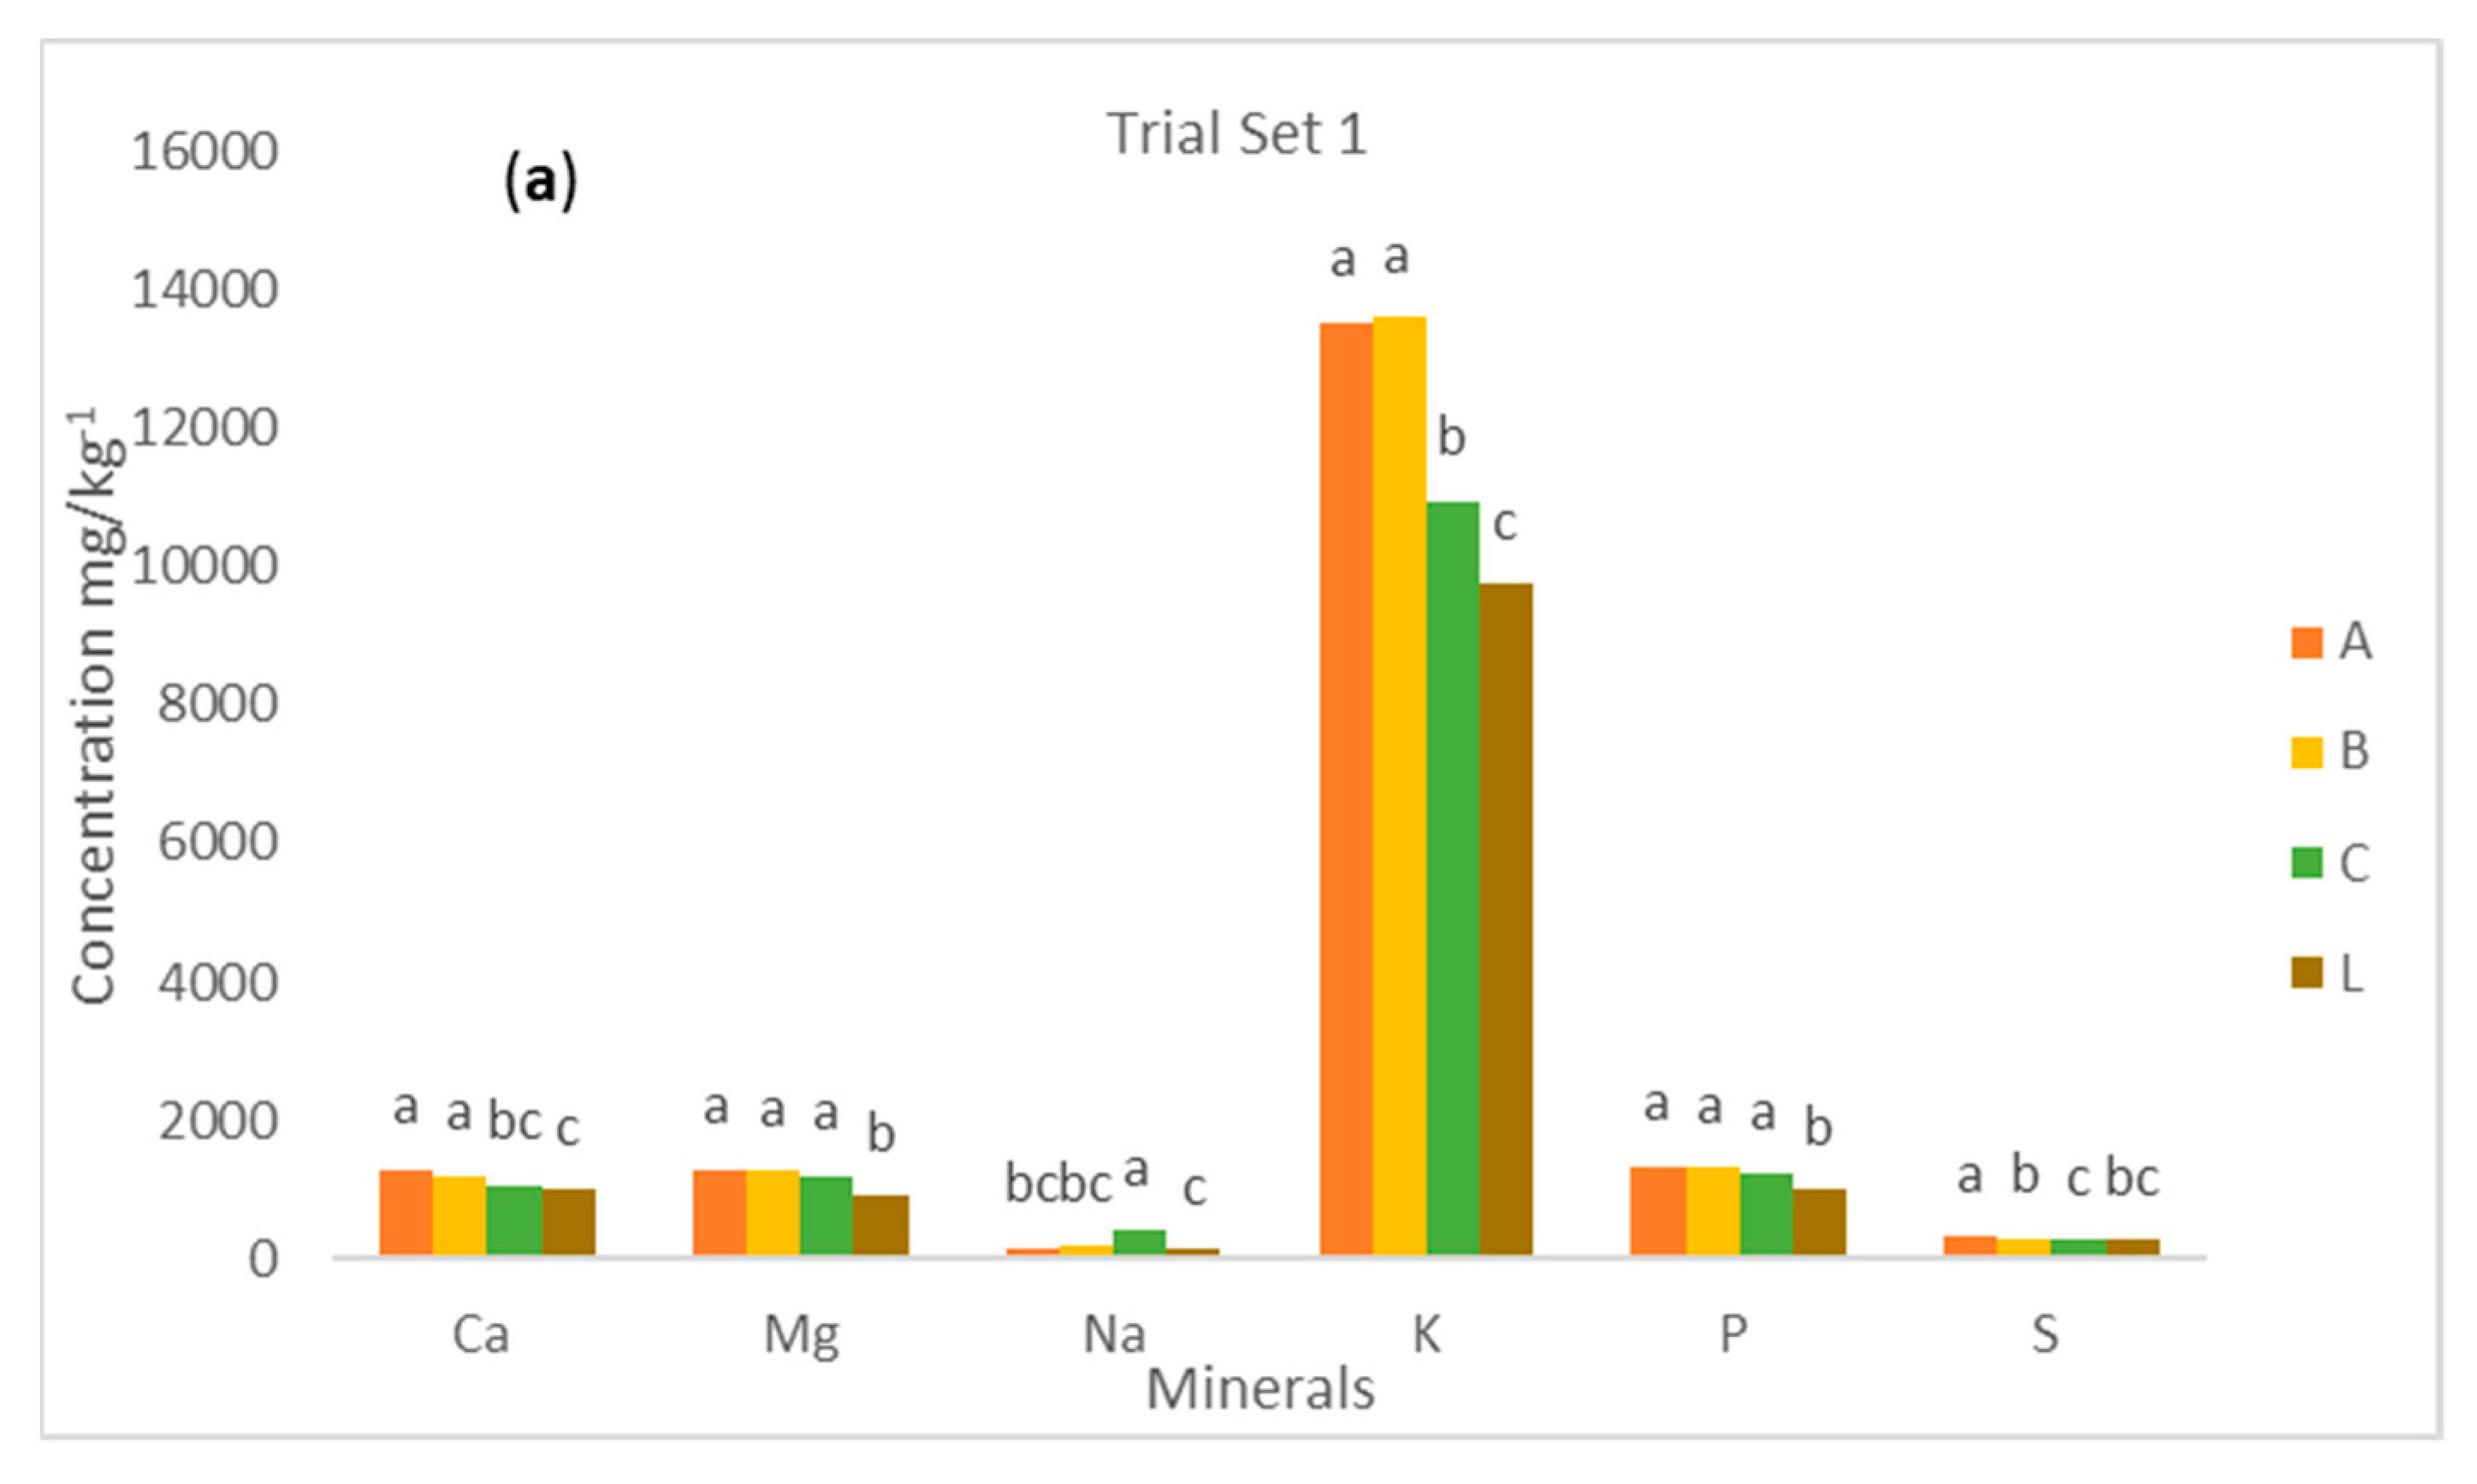
The mean values of the Ca, Mg, Na, K, P, and S content in yellow root cassava genotypes by sampling methods—method 1 (ABC) and method 2 (L) are presented in Figure 2a,b. The table also gives information on the distribution of the macroelements from the proximal, middle, and distal parts of cassava roots. There was no significant (p > 0.05) difference in the mean values of all macroelements studied in the proximal and middle parts of cassava roots except S, which showed a significant (p < 0.05) difference. Additionally, there were significant (p < 0.05) differences between the mean values of all the macroelements from the distal part and that of the proximal or middle part. It implies that macroelement concentrations are evenly distributed from the proximal to middle parts, but from the middle to the distal part, they are not evenly distributed. A similar pattern was observed for K, P, and S for set trial 2. However, a slightly different pattern was observed for the mean values of Ca, Mg, and Na, where there was no significant (p < 0.05) difference observed for the proximal, middle, and distal sections of cassava roots. The results showed that the distribution of macroelements within the cassava is mineral dependent. It was also observed that the macroelement concentrations were lower at the distal part than the proximal or middle section. This could be due to the dilution effect because it has been established that the water distribution of cassava increases from the proximal to distal parts. However, we could conclude that the best part to sample macroelements in cassava roots should be from the proximal or middle part. The two methods were compared by averaging the values of each of the macroelements from the proximal, middle, and distal parts (method 1) and comparing them with the values of the macroelements from the longitudinal section of the cassava roots (method 2).
For both trials 1 and 2, there was a significant (p < 0.05) difference in the mean values of all the macroelements except the Ca content of the set 2 trial. This shows that the concentration of the macroelements as a method is sampling dependent. It was observed that the mean value of all macroelements from method 1 was significantly (p < 0.05) higher than the mean values from method 2 for both trials 1 and 2. The levels of Ca, Mg, K, and P were significantly higher in the proximal and middle portions of the samples in method ABC (method 1) than method L (method 2). However, the levels of Na and S were far higher in the distal and proximal portions in method ABC than method L, respectively. From this result, method 1 (where samples were taken from all parts and averaged) was found to be the best, but it is not cost-effective. Method 2 could be the best alternative because it is cost-effective but not as accurate as method 1. It can be recommended that using sampling method 1 to determine Ca, Mg, Na, K, P, and S contents in yellow root cassava is better than using method 2 as it gives a far higher value of the mineral content. For set trial 1, the study showed that there was a significant (p < 0.05) difference in the mean values of macroelements. The levels of Ca, Mg, K, and P were significantly higher in the proximal and middle portions of the samples in method ABC than method L. However, the levels of Na and S were far higher in the distal and proximal portions in method ABC than method L, respectively. From this result, it can be recommended that using sampling method ABC to extract Ca, Mg, Na, K, P, and S contents in yellow root cassava is better than using method L as it gives a far higher value of the mineral content. This result was similar to Maziya-Dixon et al. [13]. They observed that the mean cis- and trans-beta-carotene contents were generally highest in the proximal end and lowest in the distal end of yellow-fleshed cassava storage roots. However, they reported that there was no significant difference (p > 0.05) between the two methods (the sectional and longitudinal) for the cis- and trans-beta-carotene content. The contrary results indicate that micronutrients are sampling dependent. The sampling method for minerals could be different for carotenes.
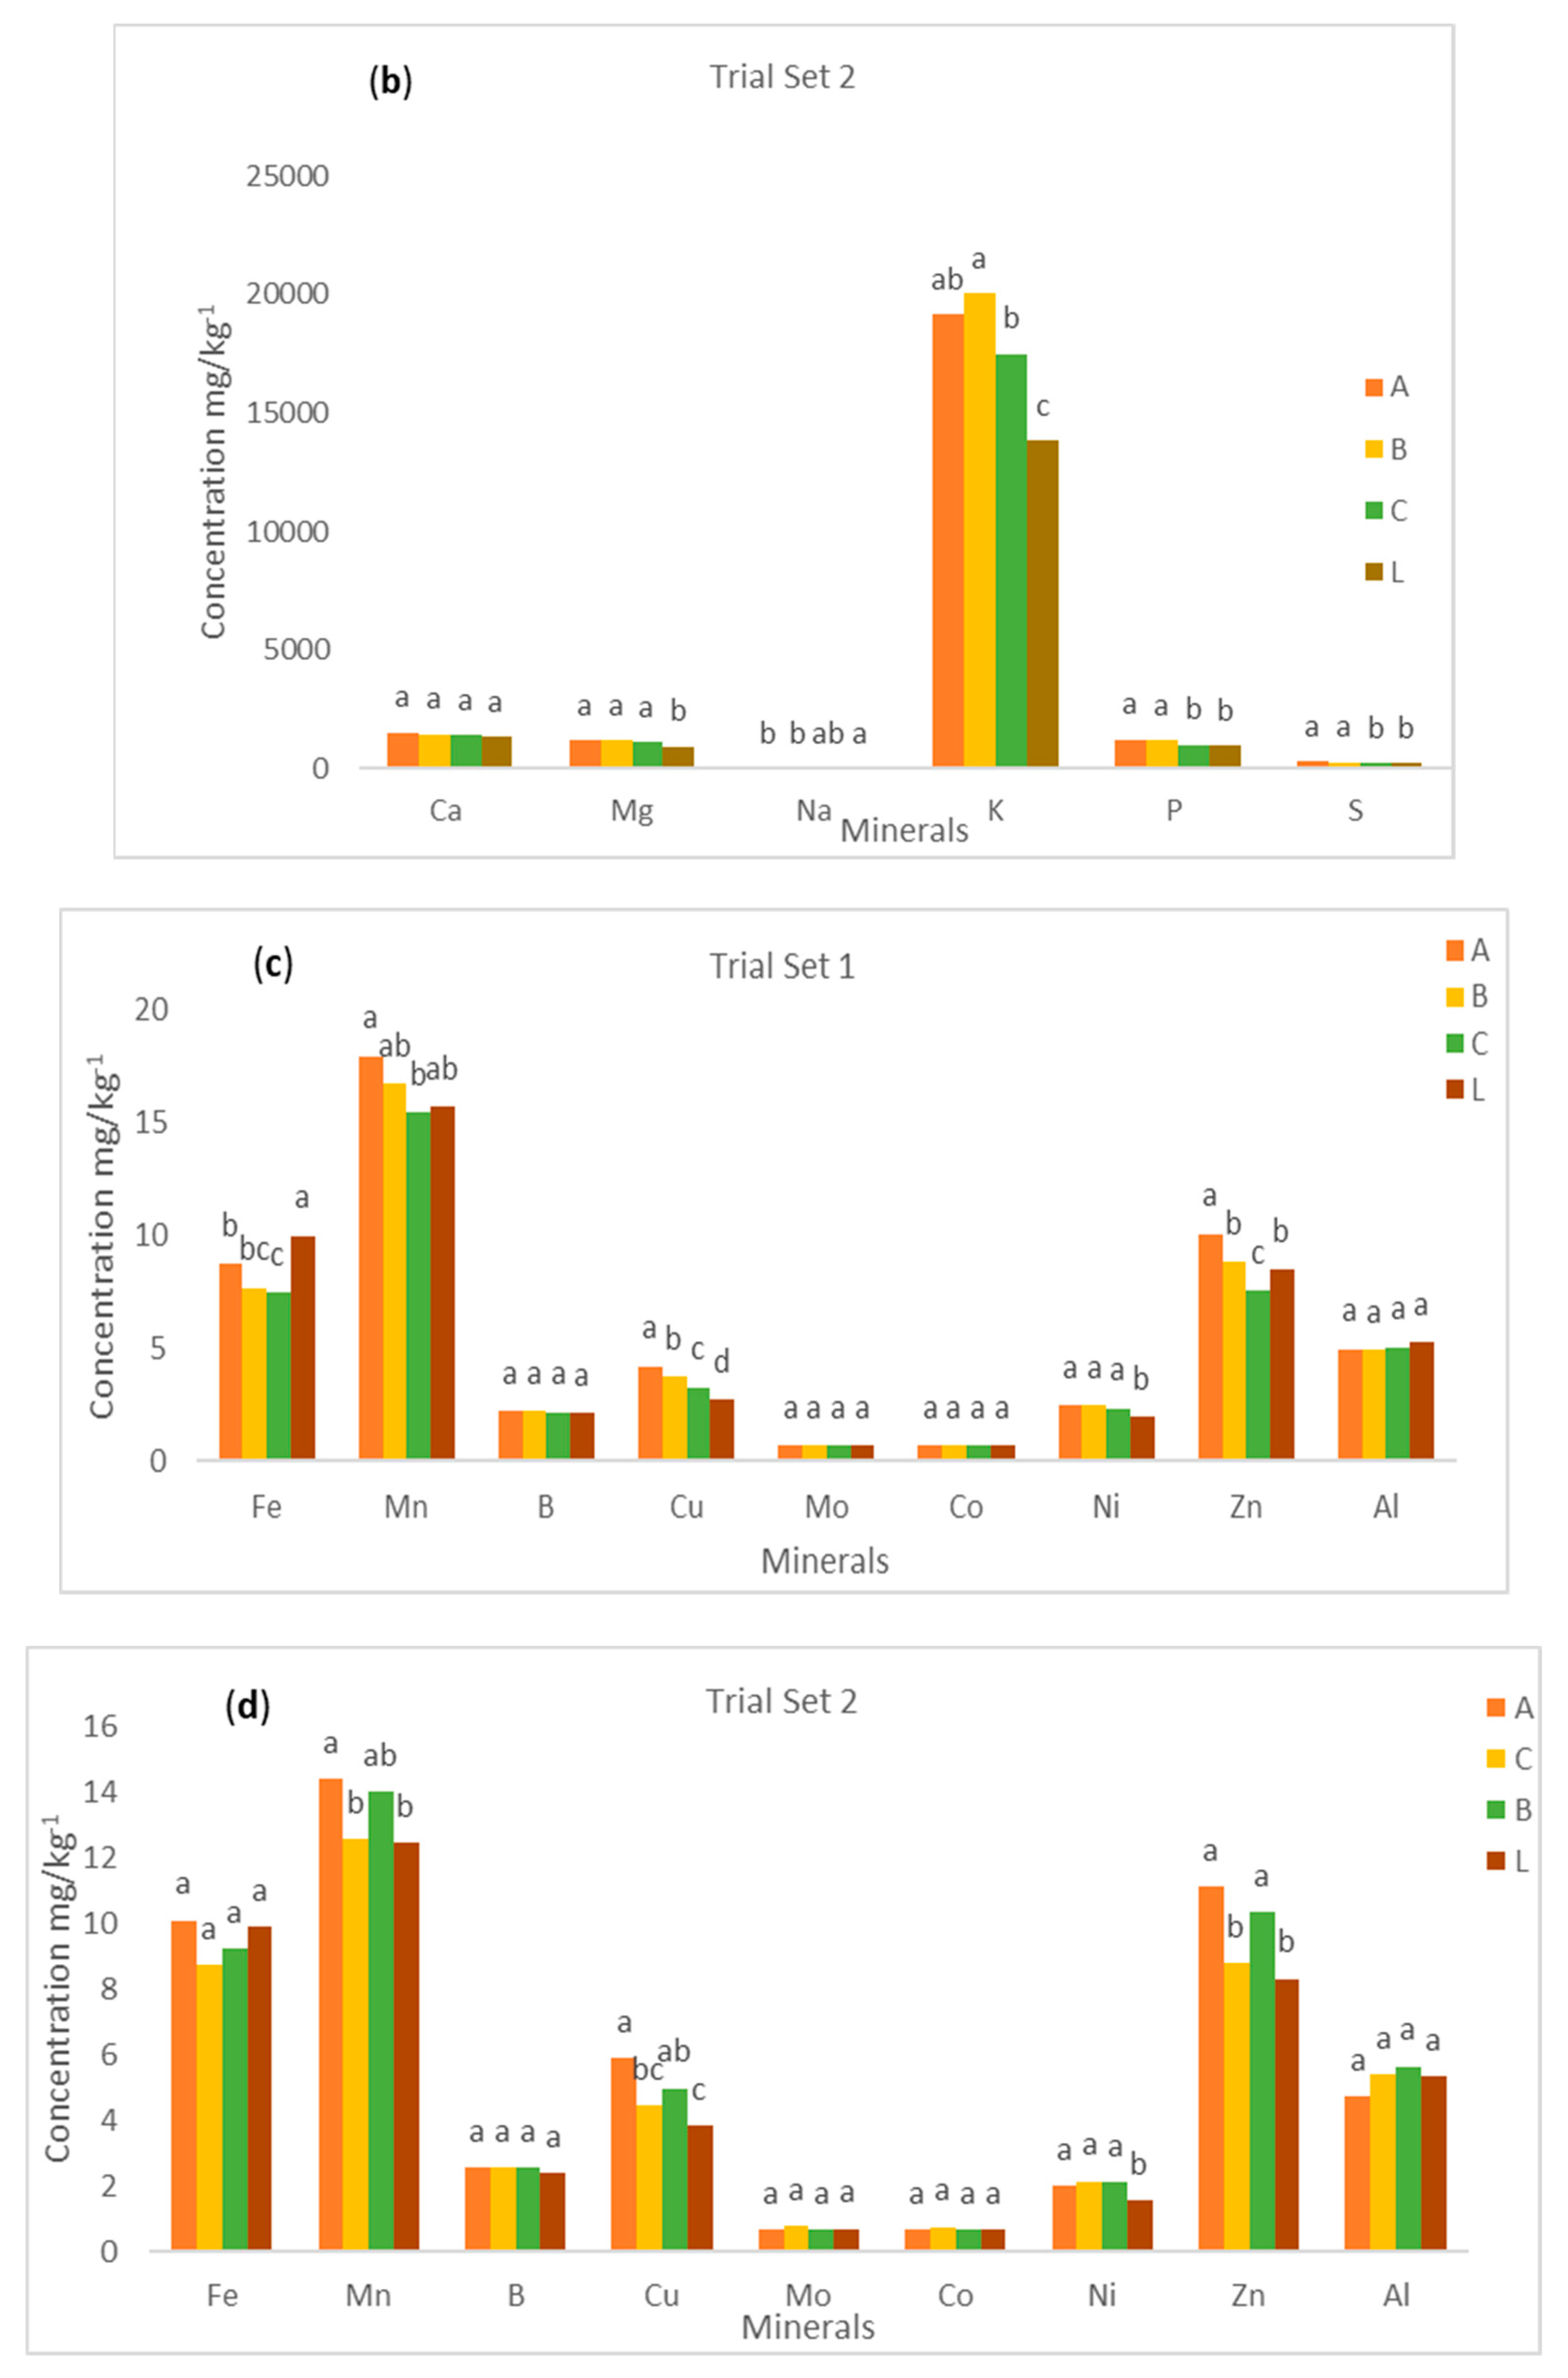
The mean values of Fe, Mn, B, Cu, Mo, Co, Ni, Zn, and Al contents in yellow root cassava genotypes by sampling methods—method 1 (ABC) and method 2 (L)—are presented in Figure 2c,d. The figure also gives information on the distribution of the microelements from the proximal, middle, and distal parts of cassava roots. From trial set 1, there was a significant difference (p < 0.05) in the mean values of Fe, Mn, Cu, and Zn elements in all the three sections (proximal, middle, and distal) of cassava root. A similar pattern was observed for Mn, and Cu in the trial set 2. The mean values for Zn showed a significant difference in the proximal and middle parts only. This result implies that the concentrations of these microelements are not evenly distributed from the proximal to the distal part of the cassava root. However, the study showed that there was no significant difference (p > 0.05) in the mean values of B, Mo, Co, Ni, and Al elements in the three sections of cassava root. Similarly, the mean values for Fe, B, Mo, Co, Ni, and Al did not show any significant difference (p > 0.05) in all three sections in the trial set 2. Further, the study revealed that there was no significant difference (p > 0.05) in the mean values of all microelements in the proximal part of the cassava root. It implies that the concentrations of Fe, B, Mo, Co, Ni, and Al are evenly distributed across the three cassava root sections that were studied.
The results showed that the distribution of microelements in the cassava root is mineral dependent. It was also observed that the microelement concentrations were lower in the distal part than the proximal or middle section. This could be due to the dilution effect because it has been established that the water distribution of cassava increases from the proximal to the distal part. However, we could conclude that the best part to sample microelements in cassava roots from is the proximal or middle part. The two sampling methods were compared by averaging the values of each of the microelements from the proximal, middle, and distal parts (method 1) and comparing them with the values of the microelements from the longitudinal section of the cassava roots (method 2). For both trial 1 and 2, there was a significant (p < 0.05) difference in the mean values of all the microelements except the B, Mo, Co, and Al content of trial set 1. Additionally, there was a significant difference (p < 0.05) in the mean values for all the microelements except for Fe, B, Mo, Co, and Al in the trial set 2. This shows that the concentration of microelements in a method that is sampling dependent. It was observed that the mean value of all microelements from method 1 was significantly (p < 0.05) higher than the mean values from method 2 for both trial set 1 and 2. The levels of Mn, Cu, Ni, and Zn were found to be significantly higher in the proximal portions of the samples in method ABC (method 1) than method L (method 2). However, the study showed that Fe had far higher levels in method L (method 2) than method ABC (method 1) in the trial set 1.
Further, the results of the study revealed that the B, Mo, Co, and Al contents did not show any significant difference (p > 0.05) between the two sampling methods. For trial set 2, the contents of Mn, Cu, Ni, and Zn were found to be significantly higher in the proximal portions of the samples investigated in method ABC (method 1) than in method L (method 2). However, the study revealed that the levels of Fe, B, Mo, Co, and Al did not show any significant difference in the two sampling methods. As a result, any of the two methods could be used for the extraction of these microelements. It can also be recommended that using sampling method ABC (method 1) for extraction of Mn, Cu, Ni, and Zn contents in cassava roots is better than using method L (method 2).

3.7. Pearson Correlation Coefficients of Macro- and Micromineral Contents of Yellow-Fleshed Cassava Roots

The Pearson correlation coefficients of the macromineral content in yellow root cassava samples investigated are presented in Table 8. From the dataset of trial 1, there was a significant positive (p < 0.001) correlation between the K and P content (r = 0.513). This correlation shows the possibility of breeding yellow root cassava varieties with high K and P mineral contents. However, the results showed that there was a significant negative (p < 0.05) correlation between the Na and K content (r = −0.271). Further, a significant (p < 0.05) but weak correlation was observed between the P and Mg content (r = −0.062), P and Na content (r = −0.073), and S and Na content (r = −0.67). From the dataset of trial 2, the results showed a significant positive (p < 0.001) correlation between the Ca and Mg content (r = 0.605), Ca and K content (r = 0.502), Mg and K content (r = 0.606), and K and P content (r = 0.636). However, the study showed a significant negative (p < 0.05) correlation between the K and Na content (r = −0.126), and a significant (p < 0.05) but weak correlation between P and Na (r = −0.052).
The Pearson correlation coefficients of the micromineral contents in the yellow root cassava samples investigated are presented in Table 9. From the data set 1 trial, there was a significant positive (p < 0.001) correlation between the Mn and B contents (r = 0.539). This correlation shows the possibility of breeding yellow root cassava varieties with high Mn and B mineral contents. However, the results of the study also showed that there was a significant negative (p < 0.05) correlation between the Fe and Ni contents (r = −0.22), and Al and Ni contents (r = −0.228). Further, a significant (p < 0.05) but a weak correlation was observed between the B and Mo contents (r = −0.161), Cu and Al contents (r = −0.186), as well as the Zn and Al contents (r = −0.141).
From the data set 2 trial, the results of the study showed a significant positive (p < 0.001) correlation between the Mo and Co contents (r = 0.991), B and Mo contents (r = 0.789), B and Co contents (r = 0.783), Fe and B contents (r = 0.663), Mn and Zn contents (r = 0.618), Fe and Co contents (r = 0.625), Co and Al contents (r = 0.604), Mo and Al contents (r = 0.603), Fe and Al contents (r = 0.536), and B and Al contents (r = 0.532). However, the study also showed that there was no correlation between the Al and Ni (r = 0.089), Al and Zn (r = 0.069), and Ni and Cu (r = 0.142) contents.
The observed strong positive correlation shows that those minerals could be bred together to increase their concentrations in yellow cassava roots. However, those minerals with a negative and significant correlation could be difficult to improve together in the breeding program as one will increase, and the other will decrease. Curiously, both for macro- and microminerals, r values >0.5 and lower p-values were found for set 2 than set 1, and the levels of minerals were higher than set 1.

4. Conclusions

The most abundant macromineral in cassava storage roots was found to be potassium (K), and the lowest was sodium (Na). It implies that cassava, with a high level of K and low Na, might be an ideal crop to consume to reduce hypertension, although this needs further clinical evidence. The most abundant microelement was manganese (Mn), and the least abundant microelements were molybdenum (Mo) and cobalt (Co). The genotype and method had a strong influence on the concentrations of the macro- and microelements in yellow-fleshed cassava roots. Most of the genotypes had higher levels of mineral density than the check varieties, which are white-fleshed, and they could be advanced to the next stage in the breeding program. Genotype 00/0028 had a high level of most of the minerals, especially Fe, Zn, Mn, and B, and could be considered to be an outstanding genotype. It could be concluded that harvesting time plays a significant role in the concentration level of some macro- and microelements in cassava roots while showing no effect on some. However, it was confirmed that yellow-fleshed roots contained more macro- and microelements than the white-fleshed roots. Method 1 (where samples were taken from all the parts and averaged) was found to be the best, but it is not cost-effective. Method 2 could be the best alternative because it is cost-effective but is not as accurate as method 1. The positively correlated elements could be bred together by breeders for improvements of the macro- and microelements in cassava roots. The quantitative and qualitative information on the distribution of macro- and microelements and their concentrations within the cassava tuber (proximal, middle, and distal root portions) would mostly benefit cassava breeders, food analysts, processors, and nutritionists. Yellow-fleshed cassava roots could be a good source of macro- and micro elements, and its potential as a functional food needs to be explored.

Author Contributions

Conceptualization B.M.-D., A.G.D., and E.O.A.; methodology, E.O.A., and B.M.-D.; software, E.O.A.; validation, B.M.-D., A.G.D. and E.P.; formal analysis, C.S. and E.O.A.; investigation, A.G.D. B.M.-D., E.O.A., and E.P.; resources, A.G.D. and B.M.-D.; data curation, C.S. and E.O.A.; writing—original draft preparation, E.O.A., and C.S.; writing—review and editing, B.M.-D., A.G.D. and E.P.; supervision, B.M.-D. and A.G.D.; funding acquisition, A.G.D. All authors have read and agreed to the published version of the manuscript.

Funding

This research received no external funding.

Acknowledgments

The authors acknowledged the supports from the HarvestPlus, CGIAR Research Program on Roots, Tubers, and Bananas (RTB), the staff of Food and Nutrition Sciences Laboratory and Cassava Breeding Unit, IITA, Ibadan, Nigeria.

Conflicts of Interest

The authors declare no conflict of interest.

References

  1. Falah, S.A.; Saja, N.M. Essential Trace Elements and Their Vital Roles in Human Body. Indian J. Adv. Chem. Sci. 2017, 5, 127–136. [Google Scholar] [CrossRef]
  2. FAO. The World Cassava Economy: Facts, Trends, and Outlooks; Food and Agriculture Organization of the United Nations and International Fund for Agricultural Development: Rome, Italy, 2000; p. 59. [Google Scholar]
  3. Adugna, B. Review on Nutritional Value of Cassava for Use as a Staple Food. Sci. J. Anal. Chem. 2019, 7, 83–91. [Google Scholar] [CrossRef] [Green Version]
  4. Burrell, M.M. Starch: The need for improved quality or quantity—An overview. J. Exp. Bot. 2003, 54, 451–456. [Google Scholar] [CrossRef] [Green Version]
  5. Nweke, F.I.; Spencer, D.S.; Lynam, J.K. The Cassava Transformation: Africa’s Best-Kept Secret; Michigan State University Press: East Lansing, MI, USA, 2001; p. 273. ISBN 13 978-0870136023. [Google Scholar]
  6. Akinpelu, A.O.; Amamgbo, L.E.F.; Olojede, A.O.; Oyekale, A.S. Health implications of cassava production and consumption. J. Agric. Soc. Res. 2011, 2, 118–125. [Google Scholar]
  7. Alamu, E.O.; Ntawuruhunga, P.; Chibwe, T.; Mukuka, I.; Chiona, M. Evaluation of cassava processing and utilization at the household level in Zambia. Food Secur. 2019, 11, 141–150. [Google Scholar] [CrossRef] [Green Version]
  8. Maziya-Dixon, B.; Alamu, E.O.; Popoola, I.O.; Yomeni, M. Nutritional and sensory properties: Snack food made from high-quality cassava flour and legume blend. Food Sci. Nutr. 2017, 5, 805–881. [Google Scholar] [CrossRef] [PubMed] [Green Version]
  9. Hong, K.; Ma, Y.; Li, M. Solid-state fermentation of phytase from cassava dregs. Appl. Biochem. Biotechnol. 2001, 91, 777–785. [Google Scholar] [CrossRef]
  10. Gomes, B.S.; Pereira, J.B., Jr.; Nunes, P.O.; Lemos, M.S.; Dantas Filho, H.A.; Dantas, K.G.F. Assessment of the Concentration of Trace Elements in Cassava Flour (Manihot esculenta Crantz) by Inductively Coupled Plasma Optical Emission Spectrometry. Rev. Virtual Quim. 2017, 9, 1699–1711. [Google Scholar] [CrossRef]
  11. Golden, M.H.N. The development of concepts of malnutrition. J. Nutr. 2002, 132, 2117S–2122S. [Google Scholar] [CrossRef] [PubMed] [Green Version]
  12. Jâkobsone, I.; Kantâne, I.; Zute, S.; Jansone, I.; Bartkeviès, V. Macro-elements and trace elements in cereal grains cultivated in Latvia. Proc. Latv. Acad. Sci. 2015, 69, 152–157. [Google Scholar] [CrossRef] [Green Version]
  13. Maziya-Dixon, B.; Alamu, E.O.; Dixon, G.A. Variation in the evaluation of cis- and trans-carotene in yellow-fleshed cassava (Manihot esculenta Cranz) varieties as a function of the storage root portion and sampling method. LWT Food Sci. Technol. 2016, 70, 296–301. [Google Scholar] [CrossRef]
  14. Wheal, M.S.; Fowles, T.O.; Palmer, L.T. A cost-effective acid digestion method using closed polypropylene tubes for inductively coupled plasma optical emission spectrometry (ICP-OES) analysis of essential plant elements. Anal. Methods 2011, 3, 2854. [Google Scholar] [CrossRef]
  15. SAS. Statistical Analysis Systems (SAS) Software for Windows; SAS Institute Inc.: Cary, NC, USA, 2001. [Google Scholar]
  16. Aro, S.O.; Aletor, V.A.; Tewe, O.O.; Agbede, J.O. Nutritional potentials of cassava tuber wastes: A case study of a cassava starch processing factory in south-western Nigeria, 2010. Livest. Res. Rural. Dev. 2010, 22, 1–11. [Google Scholar]
  17. Bamidele, O.P.; Fasogbon, M.B.; Oladiran, D.A.; Akande, E.O. Nutritional composition of fufu analog flour produced from Cassava root (Manihot esculenta) and Cocoyam (Colocasia esculenta) tuber. Food Sci. Nutr. 2015, 3, 597–603. [Google Scholar] [CrossRef] [PubMed] [Green Version]
  18. Manano, J.; Ogwok, P.; Byarugaba-Bazirake, G.W. Chemical Composition of Major Cassava Varieties in Uganda, Targeted for Industrialisation. J. Field Robot. 2017, 7, 1. [Google Scholar] [CrossRef] [Green Version]
  19. Chiwona-Karltun, L.; Nyirenda, D.; Mwansa, C.N.; Kongor, J.E.; Brimer, L.; Haggblade, S.; Afoakwa, E.O. Farmer Preference, Utilisation, and Biochemical Composition of Improved Cassava (Manihot esculenta Crantz) Varieties in Southeastern Africa. Econ. Bot. 2015, 69, 42–56. [Google Scholar] [CrossRef]
  20. Otache, M.A.; Ubwa, S.T.; Agbajor, K.G. Proximate Analysis and Mineral Composition of Peels of Three Sweet Cassava Cultivars. Asian J. Phys. Chem. Sci. 2017, 3, 1–10. [Google Scholar] [CrossRef]
  21. Afoakwa, E.O.; Asiedu, C.; Budu, A.S.; Chiwona-Karltun, L.; Nyirenda, D.B. Chemical composition and cyanogenic potential of traditional and high yielding CMD resistant cassava (Manihot esculenta Crantz) varieties. Int. Food Res. J. 2012, 19, 175–181. [Google Scholar]
  22. Chavez, A.L.; Bedoya, J.M.; Sánchez, T.; Iglesias, C.; Ceballos, H.; Roca, W. Iron, carotene, and ascorbic acid in cassava roots and leaves. Food Nutr. Bull. 2000, 21, 410–413. [Google Scholar] [CrossRef] [Green Version]
  23. Richardson, K.V.A. Quality Characteristics, Root Yield and Nutrient Composition of Six Cassava (Manihot Esculenta Crantz) Varieties; Gladstone Road Agricultural Centre Crops Research Report No. 18; Gladstone Road Agricultural Centre: Nassau, Bahamas, 2013.
  24. Burns, E.A.; Gleadow, R.M.; Zacarias, A.M.; Cuambe, C.E.; Miller, R.E.; Cavagnaro, T.R. Variations in the Chemical Composition of Cassava (Manihot Esculenta Crantz) leaves and roots as affected by genotypic and environment variations. J. Agric. Food Chem. 2012, 60, 4946–4956. [Google Scholar] [CrossRef] [PubMed]
Figure 1. (a,b) Macromineral content of yellow-fleshed roots (trial sets 1 and 2) by maturity. Mean values with different letters are significantly different at p < 0.05. (c,d) Micromineral content of yellow-fleshed cassava roots (trial sets 1 and 2) by maturity. Mean values with different letters are significantly different at p < 0.05.
Applsci 10 05396 g001aApplsci 10 05396 g001b
Figure 2. (a,b) Macromineral content of yellow-fleshed cassava roots (trial sets 1 and 2) by sampling methods. Mean values with different letters are significantly different at p < 0.05; A = Proximal; B = Middle; C = Distal; L = Longitudinal. (c,d) Micromineral content of yellow-fleshed cassava roots (trial sets 1 and 2) by sampling methods. Mean values with different letters are significantly different at p < 0.05; A = Proximal; B = Middle; C = Distal; L = Longitudinal.
Applsci 10 05396 g002aApplsci 10 05396 g002b
Table 1. Summary of mineral (macro and micro) contents of yellow cassava root genotypes from trial sets 1 and 2.
StatisticCaMgNa KP SuFeMnBCuMoCoNiZnAl
Parameters (mg/kg)
Trial Set 1
Minimum440.0370.015.74300.0600.0123.73.697.3920.850.60.60.94.234
Maximum2700.03000.02100.026,000.03300.0530.021.9139.993.88.490.70.76.0817.319.6
Mean1149.71184.5228.212,116.01233.0290.98.4616.512.163.490.690.682.38.695.04
Standard deviation (n − 1)455.0405.0316.83543.6471.367.33.356.20.331.390.030.040.792.230.68
Standard error of the mean28.825.620.0224.129.84.30.240.440.020.1000.060.160.05
Lower bound on mean (95%)1093.01134.0188.811,674.61174.4282.57.9915.652.123.30.690.672.198.384.94
Upper bound on mean (95%)1206.31234.9267.712,557.41291.8299.38.9217.382.213.680.70.682.4195.13
Trial Set 2
Minimum530.0420.011.56300.0540.0146.54.14.5421.780.60.60.94.524
Maximum5200.02900.0186.738,000.02600.0440.041.4242.689.8226.52336.4820.5224.57
Mean1444.71129.739.217,883.61112.9271.19.5213.382.524.80.710.71.969.665.29
Standard deviation (n − 1)622.5371.623.44898.8344.565.34.484.70.872.380.240.240.843.272.73
Standard error of the mean45.327.01.7356.325.14.70.360.380.070.190.020.020.070.270.22
Lower bound on mean (95%)1355.41076.435.817,180.71063.4261.88.812.632.384.410.670.661.829.134.85
Upper bound on mean (95%)1534.01183.042.618,586.51162.3280.510.2414.142.665.180.750.732.0910.195.73
Table 2. Mean squares (MS) of macroelements of yellow-fleshed cassava root.
SourceDFCaMgNaKPS
Parameters (mg/kg)
Trail Set 1
Genotype241,094,636.9 ***870,988 ***433,588.7 ***67,299,657.4 ***948,782.6 ***31,643.2 ***
Maturity16,634,645.5 ***54,562.8245.41,474,5604,725,187.6 ***1413.6
Method4645,224.4 ***1,260,184.4 ***627,252.2 ***14,453,8100 ***90,8662.4 ***10,790.2 ***
Genotype × Maturity24223,944.8275,492.7 ***139,095.4 ***14,043,235.9 ***545,051.5 ***4920 ***
Genotype × Method9658,200.352,372.4 **52,509.3 **3,109,278.353,274.71280.4 *
Maturity × Method4184,934.5 ***8869.2109,676.5 **6,790,46011,3824.6521.2
Error9645,495.233,198.633,832.32,803,823.457,485.7846.7
Trial Set 2
Genotype182,069,831.8 ***766,222.2 ***2390.6 ***6,9316,383.5 ***418,518.3 ***22,729.8 ***
Maturity18,586,896 ***8351.61233.1 *30,2441,860.2 ***3,941,892.3 ***86,920.9 ***
Method42059,09.1432,610.7 ***1075.3 ***223,459,232.4 ***566,446.7 ***18,305.5 ***
Genotype × Maturity18540,855.2 ***223,119.8 ***508.9 **41,997,484.4 ***230,692.9 ***3301.1 ***
Genotype × Method72117,288.947,556.3395.1 **9,120,322.132,886.31144.7
Maturity × Method4108,416.78194.861.616,541,188.414,550.81102
Error 72105,165.340982.7230.68,178,619.127,741.91255.8
ns, not significant at p > 0.05; *, significant p < 0.05; **, significant at p < 0.01; ***, significant at p < 0.001.
Table 3. Mean squares (MS) of microelements of yellow-fleshed cassava root.
SourceDFFeMnBCuMoCoNiZnAl
Parameters (mg/kg)
Trial Set 1
Clone_Name2422.869 ***146.01 ***0.216 ***7.538 ***0.001 ***0.0021.919 ***13.665 ***0.782
Maturity1483.888 ***253.001 ***2.859 ***1.309007.315 ***0.3340.141
Method365.053 ***64.268 *0.12718.985 ***00.0012.47 ***51.981 ***1.05
Clone_Name × Maturity2412.51 ***51.154 ***0.151 ***2.062 ***0.002 ***0.003 **1.399 ***7.029 ***0.419
Clone_Name × Method724.07513.670.0480.59600.0020.221 *1.5430.336
Maturity * Method312.469 *28.7840.1313.044 ***0.0010.0020.27122.104 ***0.41
Error724.24819.0260.0670.54900.0020.141.8450.487
Trial Set 2
Clone_Name1854.608 ***89.043 ***1.348 ***13.281 ***0.0440.0482.417 ***41.364 ***12.546 ***
Maturity1123.164 ***78.197 ***18.365 ***0.8690.0360.0262.717 ***214.769 ***33.793 **
Method314.91137.637 ***0.20828.696 ***0.060.0722.874 ***65.65 ***5.867
Clone_Name × Maturity1834.644 ***35.097 ***1.009 **5.6530.0810.0850.697 ***7.536 ***16.783 ***
Clone_Name × Method5412.5118.6710.5044.1840.0530.0510.3612.7034.786
Maturity × Method38.4579.2940.4954.0140.145 *0.1340.98 *9.108 *8.092
Error549.8527.1970.4523.3650.050.0510.2862.594.694
ns, not significant at p > 0.05; *, significant p < 0.05; **, significant at p < 0.01; ***, significant at p < 0.001.
Table 4. Means of the macromineral concentrations of yellow cassava roots (trial Set 1) by genotype.
GenotypeCaMgNaK PS
Parameters (mg/kg)
01/16621369.3 cd1081.7 defg61.0 fg20,160.0 a1791.7 ab308.7 cdef
01/11151090.0 defgh1441.3 bc316.9 cdefg11,383.3 defg1139.0 efgh310.7 cdef
01/12242033.0 a936.0 efgh119.3 efg11,050.0 efgh989.7 gh351.3 bc
01/1235967.7 efghi1551.7 b66.9 fg11,806.7 def1275.7 cdefg326.7 cde
01/12731423.3 bcd1167.7 cdef116.8 efg16,590.0 b1617.3 abc275.8 fg
01/12771250.3 defg1237.7 cde658.4 ab10,783.3 efghi1410.0 bcdef199.8 ij
01/13311128.0 defgh1026.7 efg200.0 cdefg14,720.0 bc1292.3 cdefg270.0 fgh
01/13351309.0 cde878.3 fgh446.6 abcd14,796.7 bc1993.7 a426.7 a
01/1368830.0 hij1410.7 bc676.2 a8693.3 ghi996.3 gh282.7 efg
01/13711424.3 bcd1342.0 bcd403.9 abcde12,290.0 cdef813.3 h311.3 cdef
01/14121742.3 ab1401.0 bc131.9 efg12,636.7 cde807.7 h289.9 ef
01/14131303.3 cdef930.0 fgh77.2 fg12,303.3 cdef847.7 h300.3 def
01/1442939.0 ghij1047.0 defg256.7 cdefg10,556.7 efghi801.0 h272.7 fg
01/16101005.3 efghi1941.0 a356.8 bcdef11,543.3 def1252.7 cdefg302.7 cdef
01/16461153.0 defgh1347.7 bcd61.3 fg12,743.3 cde1188.7 defgh271.3 fgh
01/1649870.0 hij889.0 fgh64.8 fg13,930.0 bcd1070.0 fgh312.0 cdef
01/1663947.3 fghij1588.3 b83.6 fg12,966.7 cde1152.0 efgh377.3 b
90/015541629.3 bc1418.7 bc650.5 ab9586.7 fghi1317.7 cdefg264.2 fgh
94/0006708.7 ij1028.0 efg68.6 fg12,736.7 cde1563.7 bcd351.7 bc
94/03301139.0 defgh1419.0 bc44.0 g8206.7 i1298.7 cdefg222.8 hij
95/0379827.0 hij1137.7 cdef72.5 fg11,806.7 def1125.3 efgh238.3 ghi
98/2132883.3 hij1004.3 efgh146.8 defg11,513.3 defg1503.3 bcde273.7 fg
TME1(check)596.3 j776.7 gh68.9 fg8323.3 hi1495.0 bcde204.2 ij
91/02324(check)1096.0 defgh715.7 h459.0 abc11,146.7 defg1082.0 fgh342.3 bcd
30,572(check)1076.3 defgh893.7 fgh97.1 efg10,626.7 efghi1002.0 gh184.6 j
Mean values in the same column with the different letters are significantly different at p < 0.05. Parameters were analyzed in duplicate and expressed in mg/kg.
Table 5. Macromineral contents of yellow-fleshed cassava roots (trial Set 2) by genotype.
GenotypeCaMgNaK PS
Parameters (mg/kg)
00/00281296.0 cdefgh1319.3 bcde42.8 cdef19,180.0 abcde1166.7 bcde320.0 abc
01/11811782.0 bc1455.7 abc54.8 abc17,976.7 bcdef1173.0 bcde263.7 cdefg
01/12061922.3 b1108.7 defg18.4 f23,000.0 a1290.3 abc206.4 gh
Z97/04741464.3 bcdef1465.7 ab35.5 cdef20,046.7 abcd1460.7 a358.0 a
99/29871416.3 bcdefg1460.7 ab28.8 def19,100.0 abcde1219.3 abc321.2 abc
01/14041550.5 bcdef1147.0 bcdefg32.9 cdef17,461.7 bcdef1204.6 abc225.5 fgh
01/14172833.3 a1679.7 a73.9 a21,630.0 ab892.0 fg338.3 ab
01/13801069.7 fgh1039.7 efgh23.7 ef19,016.7 abcde1143.7 cdef250.4 defgh
01/16351603.0 bcde1045.3 efgh45.0 bcde17,506.7 bcdef1187.0 bcde299.3 bcd
01/1659863.3 h1238.0 bcdef19.6 f20,850.0 abc1303.7 abc292.7 bcd
01/14231151.0 efgh857.3 gh29.2 def18,356.7 abcdef930.3 defg275.8 cdef
01/15601393.0 cdefg1126.7 cdefg34.9 cdef15,613.3 defg884.3 fg219.9 fgh
99/7558810.0 h895.7 gh42.7 cdef12,680.0 g760.0 g225.5 fgh
01/12961594.0 bcdef1430.0 abcd48.8 bcd19,603.3 abcd763.7 g227.8 fgh
01/12311217.3 defgh753.7 h39.9 cdef16,066.7 defg1074.7 cdef201.9 h
01/15511414.3 bcdefg952.0 fgh68.1 ab14,263.3 fg924.0 efg286.7 bcde
01/1172914.3 gh721.7 h28.6 def16,513.3 cdefg1126.7 cdef288.7 bcd
91/02324 (check)1708.0 bcd835.0 gh53.0 abcd16,123.3 defg1438.0 ab319.3 abc
30,572 (check)1446.7 bcdef932.3 fgh23.8 ef14,800.0 efg1202.0 abcd230.4 efgh
Mean values in the same column with the different letters are significantly different at p < 0.05. Parameters were analysed in duplicate and expressed in mg/kg.
Table 6. Means of the micromineral concentrations of yellow cassava roots (trial set 1) by genotype.
GenotypeFeMnBCuMoCoNiZnAl
Parameters (mg/kg)
01/166210.799 ab24.414 a2.383 ab5.504 a0.700 a0.700 a2.044 efghij9.789 abc5.000 ab
01/11159.456 abcde14.355 bcdef2.106 b3.519 cdefg0.700 a0.688 a1.980 efghij11.523 a5.425 ab
01/12248.691 bcdef19.011 abc2.000 b3.918 bcdef0.700 a0.663 a2.164 defghi7.939 bcdef5.000 ab
01/123513.033 a17.869 abcdef2.032 b1.745 h0.700 a0.688 a1.784 ghij7.806 bcdef6.050 a
01/12739.749 abcde24.800 a2.449 ab4.569 abc0.675 ab0.675 a3.449 a10.303 ab4.750 ab
01/12777.016 bcdef17.115 abcdef2.210 ab2.268 gh0.700 a0.688 a2.994 abc7.743 bcdef5.000 ab
01/13316.654 def17.208 abcdef2.230 ab3.553 cdefg0.700 a0.663 a2.205 defghi7.956 bcdef5.363 ab
01/13357.140 bcdef24.823 a2.698 a2.811 efgh0.662 b0.663 a3.119 ab9.230 abcd4.625 b
01/13687.965 bcdef10.376 def2.000 b3.069 defgh0.675 ab0.650 a2.065 efghij8.826 bcde4.750 ab
01/13716.878 cdef13.600 bcdef2.103 b3.873 bcdef0.700 a0.663 a2.654 bcde9.909 abc5.000 ab
01/141210.256 abcd15.101 bcdef2.178 b2.369 gh0.700 a0.688 a1.425 j10.010 abc5.200 ab
01/14139.819 abcde17.761 abcdef2.089 b3.350 cdefg0.700 a0.675 a2.566 bcdef9.228 abcd5.000 ab
01/14428.898 abcdef13.846 bcdef2.380 ab4.175 abcde0.704 a0.678 a1.802 ghij10.214 ab5.012 ab
01/161010.706 abc15.574 bcdef2.115 b3.360 cdefg0.675 ab0.650 a2.409 bcdefgh9.366 abcd4.750 ab
01/16467.806 bcdef15.798 bcdef2.139 b2.891 efgh0.700 a0.688 a1.918 fghij8.308 bcdef5.000 ab
01/16498.543 bcdef13.376 bcdef2.228 ab2.876 efgh0.700 a0.663 a2.360 cdefgh8.189 bcdef5.000 ab
01/16639.433 abcde21.625 ab2.105 b4.660 abc0.700 a0.688 a2.138 efghij7.140 def5.575 ab
90/015548.465 bcdef19.046 abc2.259 ab2.531 fgh0.700 a0.675 a2.480 bcdefg7.573 cdef5.000 ab
94/00067.888 bcdef9.726 ef2.071 b4.589 abc0.663 b0.638 a2.576 bcdef8.838 bcde4.500 b
94/03307.353 bcdef17.950 abcde2.050 b2.339 gh0.700 a0.700 a2.653 bcde9.411 abcd5.000 ab
95/03797.800 bcdef9.544 f2.218 ab4.443 abcd0.700 a0.675 a2.296 cdefgh10.238 ab5.000 ab
98/21327.971 bcdef18.186 abcd2.088 b5.053 ab0.700 a0.675 a2.854 abcd9.194 abcd5.000 ab
TME1(check)7.761 bcdef14.791 bcdef2.000 b2.606 fgh0.700 a0.688 a1.551 ij5.933 f5.025 ab
91/02324(check)5.637 f13.356 bcdef2.007 b4.158 abcde0.700 a0.676 a1.708 hij7.710 bcdef4.999 ab
30572(check)6.116 ef12.750 cdef2.000 b3.005 efgh0.688 ab0.688 a2.165 defghi6.345 ef4.875 ab
Mean values in the same column with different letters are significantly different at p < 0.05. Parameters were analysed in duplicate and expressed in mg/kg.
Table 7. Micromineral content of yellow cassava roots (trial set 2) by genotype.
GenotypeFeMnBCuMoCoNiZnAl
Parameters (mg/kg)
00/002814.851 a21.261 a3.418 a5.040 abc0.837 a0.812 a3.325 a10.736 bcd5.375 b
01/118114.465 ab14.576 cde3.366 a4.666 bc0.912 a0.912 a2.003 bcde10.013 bcde7.281 ab
01/12068.683 bcde19.555 ab2.979 ab4.601 bc0.775 a0.775 a1.436 de16.036 a5.852 ab
Z97/047410.116 abcde15.940 bc2.674 ab6.732 ab0.675 a0.675 a2.511 abc11.971 b4.750 b
99/298711.505 abcd15.133 bcde2.585 ab5.636 abc0.750 a0.750 a1.978 bcde9.999 bcde5.375 b
01/14047.343 de15.118 bcde2.831 ab5.012 abc0.751 a0.750 a1.674 cde9.661 bcdefg5.711 ab
01/14179.109 abcde12.846 cdef2.684 ab3.929 bc0.675 a0.650 a2.203 bcd11.505 bc4.750 b
01/13806.508 de10.510 def2.729 ab6.186 abc0.725 a0.712 a1.068 e10.248 bcde6.297 ab
01/163513.218 abc12.000 cdef2.265 ab3.890 bc0.662 a0.662 a2.101 bcd7.745 efgh4.625 b
01/16598.882 bcde14.891 bcde2.415 ab5.274 abc0.662 a0.638 a1.645 cde9.104 bcdefgh4.625 b
01/142311.038 abcde13.353 cdef2.105 b4.159 bc0.650 a0.625 a1.576 cde12.009 b4.500 b
01/15608.347 cde15.453 bcd2.230 ab3.890 bc0.650 a0.650 a2.309 bcd7.711 efgh4.500 b
99/75587.336 de8.850 f2.114 b3.633 bc0.687 a0.675 a2.079 bcd7.010 fgh4.875 b
01/12967.693 cde11.360 cdef2.363 ab3.061 c0.650 a0.650 a2.711 ab8.170 defgh4.500 b
01/12318.561 cde11.210 cdef2.106 b4.373 bc0.663 a0.625 a1.866 bcde9.875 bcdef4.500 b
01/15517.414 de12.469 cdef2.106 b3.665 bc0.662 a0.650 a1.578 cde9.732 bcdef4.500 b
01/11728.814 bcde8.563 f2.254 ab3.326 c0.625 a0.600 a1.370 de6.495 h4.250 b
91/02324 (check)5.539 e10.343 ef2.107 b5.891 abc0.675 a0.675 a2.433 abc6.744 gh4.865 b
30572 (check)11.376 abcd10.841 def2.479 ab8.131 a0.755 a0.737 a1.356 de8.756 cdefgh9.379 a
Mean values in the same column with different letters are significantly different at p < 0.05. Parameters were analysed in duplicate and expressed in mg/kg.
Table 8. Pearson correlation coefficients of the macromineral contents of yellow cassava roots (dataset 1 and 2).
VariablesCaMgNaK PS
Trial set 1
Ca1.00 ***
Mg0.291 ***1.00 ***
Na0.0990.193 ***1.00 ***
K0.274 ***0.074–0.271 ***1.00 ***
P0.14 *–0.062–0.0730.513 ***1.00 ***
S0.17 ***0.024–0.0670.397 ***0.276 ***1.00 ***
VariablesNaCaMgKPS
Trial set 2
Na1.00 ***
Ca0.341 ***1.00 ***
Mg0.214 ***0.605 ***1.00 ***
K–0.1260.502 ***0.606 ***1.00 ***
P–0.0520.343 ***0.306 ***0.636 ***1.00 ***
S0.0540.0970.382 ***0.23 ***0.216 ***1.00 ***
ns, not significant at p < 0.05; *, significant p < 0.05; **, significant at p < 0.01; ***, significant at p < 0.001.
Table 9. Pearson correlation coefficients of the micromineral contents of yellow cassava roots (dataset 1 and 2).
VariablesFeMnBCuMoCoNiZnAl
Trial set 1
Fe1.00 ***0.391 ***0.345 ***0.0560.026−0.029−0.22 ***0.178 **0.425 ***
Mn0.392 ***1.00 ***0.539 ***0.184 ***−0.0530.050.16 *0.322 ***0.042
B0.345 ***0.539 ***1.00 ***0.22 ***−0.161 ***−0.1120.0010.297 ***−0.084
Cu0.0560.184 ***0.22 ***1.00 ***−0.071−0.0320.316 ***0.377 ***−0.186 ***
Mo0.026−0.052−0.161 *−0.0711.00 ***0.457 ***−0.063−0.0840.401 ***
Co−0.0290.05−0.112−0.0320.457 ***1.00 ***0.066−0.0360.183 **
Ni−0.22 ***0.16 *0.0010.316 ***−0.0630.0661.00 ***0.189 ***−0.228 ***
Zn0.178 **0.322 ***0.297 ***0.377 ***−0.084−0.0360.189 ***1.00 ***−0.141 *
Al0.424 ***0.042−0.084−0.186 ***0.401 ***0.183 **−0.228 ***−0.141 *1.00 ***
Trial set 2
Fe1.00 ***0.419 ***0.663 ***0.341 ***0.64 ***0.625 ***0.389 ***0.229 ***0.536 ***
Mn0.419 ***1.00 ***0.434 ***0.246 ***0.431 ***0.446 ***0.262 ***0.618 ***0.177 *
B0.663 ***0.434 ***1.00 ***0.32 ***0.789 ***0.783 ***0.363 ***0.249 ***0.532 ***
Cu0.341 ***0.246 ***0.32 ***1.00 ***0.256 ***0.266 ***0.1420.26 ***0.183 *
Mo0.64 ***0.431 ***0.789 ***0.256 ***1.00 ***0.991 ***0.27 ***0.27 ***0.603 ***
Co0.625 ***0.446 ***0.783 ***0.266 ***0.991 ***1.00 ***0.27 ***0.283 ***0.604 ***
Ni0.389 ***0.262 ***0.363 ***0.1420.27 ***0.27 ***1.00 ***0.0520.089
Zn0.229 ***0.618 ***0.249 ***0.26 ***0.27 ***0.283 ***0.0521.00 ***0.069
Al0.536 ***0.177 *0.532 ***0.183 *0.603 ***0.604 ***0.0890.0691.00 ***
ns, not significant at p < 0.05; *, significant p < 0.05; **, significant at p < 0.01; ***, significant at p < 0.001.

