Modeling the Evolutionary Mechanism of China’s Domestic Air Transport Network


1
College of Civil Aviation, Nanjing University of Aeronautics and Astronautics, Nanjing 211106, China
2
Geography & Earth Science Department, Shippensburg University, Shippensburg, PA 17257, USA
3
School of Public Administration, Nanjing University of Finance and Economics, Nanjing 210023, China
4
Department of Geography, Ghent University, 9000 Ghent, Belgium
*
Author to whom correspondence should be addressed.
Sustainability 2020, 12(16), 6295; https://doi.org/10.3390/su12166295
Submission received: 18 June 2020
/
Revised: 28 July 2020
/
Accepted: 30 July 2020
/
Published: 5 August 2020
(This article belongs to the Section Sustainable Transportation)
Abstract
:With the rapid expansion of China’s domestic air transport network (CATN), it is fundamental to model which factors and mechanisms impact this development. This paper investigates how the combined endogenous and exogenous factors influencing the evolution of CATN based on longitudinal data by utilizing a more all-encompassing methodology of stochastic actor based-modeling (SABM). Endogenous variables include a density effect, a betweenness effect, a transitivity closure effect, and a ‘number of distances-two’ effect. Exogenous variables incorporate airport hierarchy, a distance effect, presence or absence of low-cost carriers (LCCs) and high-speed rail (HSR). The systematic classification of Chinese airports into more than the typical two or three tiers allows the impacts of the four endogenous covariates to be revealed. Overall, the CATN has tended to evolve into a more compacted and non-concentrated network structure through the creation of non-stop routes and closed triads. The integrated inclusion of low-cost carrier and high-speed rail effects highlights the importance of market presence to the initiation of new routes at initial stages, cultivating potential demand and increasing accessibility. In addition, the construction of HSR to one primary airport within a multi-airport system can raise “shadow effects” for other airports. Our findings provide policy suggestions for airport operators in terms of developing accurate positions in the hierarchy and strengthening transfer ability.
1. Introduction
Over the last several decades, the development of China’s air transport network (CATN) has been characterized by a combination of simultaneous inertial forces and massive change. These dynamics can be at least partially understood through an assessment, not only of supply and demand changes, but of the structure of the network, its spatial organization, air transport’s key competition—high speed rail (HSR), and government regulation. In this paper, we focus on the first four of the issues to build on previous research and to describe and explain the evolution of the CATN by 2019.
From the standpoint of air transport supply and demand, passenger traffic at airports in China has experienced rapid growth in both absolute and relative terms. Between 2010 and 2019, the number of passengers increased by 9% per year across the system. According to the Civil Aviation Administration of China [1], the number of scheduled routes has increased by an average of 13% per year. Even more staggering is the increase in the number of airports—from 175 in 2010 to 238 in 2019. By 2035, about 450 new airports are scheduled to be constructed. Given the difficulty in siting and developing new airport facilities in most regions, this change is unique across the globe.
The structural perspective relates to the network characteristics of the CATN across multiple metrics, including, for example, degree centrality, clustering coefficients and other measures based on complex network theory. Since the CATN is formed by the aggregation of all carriers’ routes across all airports, the network’s statistical properties provide a description of the ways in which key actors—air carriers, airports, the state—have devised transport systems in China. As of 2019, the CATN has evolved into a small-world network characterized by a short average path length, a high clustering coefficient, and scale-free properties with a two-regime power-law degree distribution [2,3,4], which is reflected in the coexistence of both hub-and-spoke (H&S) and point-to-point (P&P) networks adopted by particular carriers The debate between H&S and P&P has been a longstanding research stream in academia [5]. In the former structure, travelers need to transfer at an intermediary airport (i.e., hub) to reach their destinations, whereas in the latter one, only non-stop flights exist. Similar structures have also emerged in air transport networks in other geographies, such as the US and Europe [6,7]. Importantly, however, “real-hubbing” in terms of a connection-based wave structure, has been relatively stable and occurs at only four airports: Beijing (PEK), Shanghai (PVG), Guangzhou (CAN) and Kunming (KMG). Other Chinese airports, though hubs in the sense of degree centrality, are not major hubs through the lens of connectivity [8].
The spatial distribution properties of the Chinese domestic air system refer to the ways in which traffic flow is distributed among different airports, an inherently geographic process. Moreover, a focus on spatial organization explicitly allows for the assessment of the role of “airport hierarchies” in the system and the extent to which they have played a role in the development of the shape of the CATN [9]. This spatial hierarchy of airports continues to emerge within the CATN. Several researchers have investigated this issue from the perspective of network centrality [10], airline supply and competition [11], connectivity [12], as well as the development of integrated transport centers [13]. In general, airports in China can be classified into three to five groups depending upon the clustering indicators utilized. In any event, O’Connor et al. [11] state that “a level of inertia in the overall geography of China’s air transport” is apparent in the last several decades.
Meanwhile, the concomitant and extremely rapid development of HSR in China has significantly affected its air transport in many regards, such as supply and demand [14], spatial effects [15], substitutability [16], profits, and consumer welfare [17]. The overall conclusion has been that the HSR has had a negative influence on further air transport development in China, particularly in certain geographical and route situations.
The aforementioned research provides fundamental understanding of the evolution of CATN from one or two of the four standpoints. To date, relatively little attention has been paid to identify the complex interrelationship among these elements as well as how modeling these factors together are driving the changes in the CATN from a comprehensive perspective. One exception is Zhang et al. [12], who investigated the drivers of China’s airport connectivity and found that airport competition, the presence of low-cost carriers and high-speed rail had significant impacts on airport connectivity. These findings shed some light on the evolutionary mechanism of CATN, but their study did not consider the structural effects that are endogenous with the network changes.
Therefore, the objective of this paper is to investigate how the combined endogenous and exogenous factors influence the evolution of CATN based on longitudinal data by utilizing a more all-encompassing methodology of stochastic actor based-modeling (SABM). Here, the endogenous factors are defined from the perspective of micro-structural effects such as density, betweenness, transitivity closure effect, and so forth; while the exogenous factors refer to spatial organization, HSR competition and other external driving forces. The evolution of CATN is represented by the change of routes across a long time series. Zhang et al. [7] have employed SABMs to examine the dynamics of the European air transport network. The viability and advantages of using SABMs will be introduced in the next section.
The remainder of this paper is structured as follows. Section 2 provides a literature review that establishes the research context for the development of the CATN. Section 3 discusses data issues and reports on an exploratory data analysis used to inform the SABM modeling. Section 4 specifies the structural effects, actor and dyadic covariates that inform the SABM. Section 5 shows the estimation results, and Section 6 summarizes the main findings.
2. Literature Review
In this section, we review the literature on several relational components of the CATN. The purpose is to lay a foundation for SABM, and to appropriately construct both actor and didactic covariates. Specifically, we focus on three issues that span the spatial, structural and competition-based relationships described earlier. The advantages of SABM over other methodologies are also discussed.
2.1. Airport Hierarchy in the CATN
This section summarizes the structure of airport hierarchy in China based on the existing research. Although different studies have created varied classification schemes and used different time series, the results generally agree that there is at least a three-tier hierarchy in Chinese airports. As might be expected, the first tier includes the ‘big three’ (i.e., Beijing Capital, Shanghai Pudong, and Guangzhou Baiyun) that lead the country (by a wide margin) on nearly all indicators of airport activity and function. Airports included in the second tier, however, are not as consistently identified. For instance, Urumqi has been considered a second-tier airport based upon its betweenness centrality and function as a “connector hub” [10]. However, using different measures —for instance, the existence of an integrated transport systems including air, rail, and ground— other airports such as Wuhan, Zhengzhou and Shenyang have sometimes also been classified as second-tier airports [13]. Despite these differences, there does exist some commonality amongst studies. Specifically, Chengdu, Chongqing, Kunming, Shenzhen, and Xi’an nearly always appear in the second tier [10,11,12]. From this perspective then, all remaining airports are included in the last or third tier.
The inertia of the overall geography of CATN implies it is easy to overlook some of the nuances across China’s airports based upon only three tiers. We suggest that in order to identify airports that are likely to drive the change of CATN, three “forms” of connectivity indicators should be considered: i.e., the increases/decreases of airport measures in absolute terms, in relative terms, as well as relative rank. Airports that have increased on all of these features simultaneously are defined as “growing airports”. To make this determination, we turn to the work of Zhang et al. [12] on the connectivity of China’s airports. While connectivity is just one (albeit important) indicator with which to benchmark airport competition, research has found a high correlation between connectivity and other indicators [18] (see below).
2.2. The Impact of Low-Cost Carriers on CATN
Similar to the emergence of LCCs in the US [19], Europe [20], and other Asian countries [21], LCCs have also appeared in China. However, the rise of LCCs in China still lags somewhat behind other countries in terms of the total number of airlines, their market share, the extent to which they lower prices [22,23], and their effect on triggering substantial competition in the airline industry [24]. This is largely attributed to the government regulation of air transport [25] and the large-scale development of HSR [26].
Given the relatively small number of LCCs in China, research has usually focused on China’s largest—Spring Airlines, launched in 2005. According to the CAAC and the annual reports of Spring Airlines, its market share, in terms of numbers of passengers, increased from 0.78% in 2006 to around 3.3% in 2019 [1]. None of the other LCCs, such as Lucky Air, West Air, China United Airlines, and 9Air, accounted for more than 2% of market share in 2019. As with previous research, we limit our attention to the impact of Spring Airlines on the development of the CATN.
At the airport level, the presence of Spring Airlines has increased the overall connectivity of China’s airports over the period of 2005 to 2016 [12]. In particular, the airline tended to enter routes involving its hub airport in Shanghai and also its secondary airports such as Lanzhou, Shijiazhuang, Fuzhou and Huaihua [23]. At the route level, Spring Airlines was inclined to enter routes of relatively longer distances and higher densities than average, as well as routes which were not already served by any air carriers [23].
Wang et al. [26] found that Spring Airlines faces fierce competition with HSR expansion, especially within highly populated and developed corridors. This raises the question whether Spring Airlines will be able to survive in routes with high density. On the other hand, as Wang et al. [26] have pointed out, LCCs do seem to have advantages in the low-density corridors such as in central and western China. In sum, it is important to test whether the presence of Spring Airlines may still play a role in driving the evolution of CATN.
2.3. The Impact of High-Speed Rail on CATN
To our knowledge, there have been few studies that have explicitly focused attention on whether and in what way(s) HSR impacts and actually drives changes in China’s overall air transport network. At the airport level, researchers have investigated the “HSR effect” based on airport type by dividing China’s airports into hub and non-hub facilities [14,16]. However, the results have not always been clear because of varied hub definitions. For instance, Chen [14] defined four hub cities (i.e., Beijing, Shanghai, Guangzhou and Chengdu) and found that routes involving these cities were influenced to a greater extent by HSR service than those involving non-hub cities. Meanwhile, Wang et al. [16] obtained the opposite result by considering only Beijing, Shanghai and Guangzhou as hubs. This implies, as discussed in Section 2.1, that a classification scheme of China’s airports with more than two or three tiers is needed to refine the airport hierarchy.
At the route level, researchers have considered the HSR effect on disaggregated markets with different distances, densities and specific HSR lines. Several studies focused on identifying the distance range(s) for which there is the most competition between HSR and air transport. Chen [14] found that the strongest competition from HSR, both in supply and demand, occurred at a distance range of 500 to 800 km. Ding et al. [15] concluded that HSR has put significant pressure on the market share of air routes ranging from 500 to 900 km using Beijing–Shanghai passenger dedicated lines (PDL) as a case study. Here, the measurement of market share was based on a comprehensive utility function considering economy, speed, comfort, and convenience. Other researchers used different refinements to examine the impact of HSR in a variety of distance bands. For example, bands of 501–1000 km and 1001–1500 km were examined by Zhang et al. [12] and 500–2000 km by Lin (2012).
Zhang et al. [27] found that the impact of HSR on airlines was severe in thin markets and insignificant in thick markets. Additionally, other research has focused on specific HSR lines, such as Beijing–Shanghai PDL and Wuhan–Guangzhou PDL [15,28] due to their tremendous impacts on socio-economic development, the changing roles of major cities, and the advances in development of integrated transport [13]. Research has largely neglected, however, the complex relationships between HSR, LCCs, and air transport. It is likely that some routes can be simultaneously served by HSR, LCC and other types of carriers while others are more fragile. All of this suggests that a more systematic assessment is required if HSR’s role in the CATN is to be accomplished.
Given the special context of the development of LCCs and HSR in China, we extend previous research by investigating the integrated effects of LCCs and HSR on the evolution of CATN. To embed the HSR effect into the research framework of SABM, we examine the possible impacts of HSR on the evolution of CATN at route level.
2.4. Methodology Modeling Network Dynamics
The dramatic growth and changes of the CATN have drawn considerable attention from academic researchers as well as airport operators. If the past is at least some guide, the future growth and change of the CATN will be linked to the patterns of expansion (or contraction) of the economy, airline and airport strategies as well as the ongoing state-led liberalization process. Therefore, understanding the underlying evolutionary mechanisms to date is fundamental in order to better understand and ‘design’ more optimal air transport networks, where optimal refers to higher benefits from both producer and consumer perspectives.
As mentioned above, the CATN has been demonstrated as a complex network with small-world and scale-free characteristics, which is topologically self-organized due to the existence of several micro-structural effects such as preferential attachment, triadic closure, reciprocity, and so forth. However, traditional econometric models dealing with the mechanism of network formation and evolution assume that links in the network are independent and thus cannot capture those effects [29]. The interdependence within the dependent variable and between dependent and independent variables calls for more complex models. Two recent topology-based models derived from social network analysis have tackled these issues. One is the family of exponential random graph models (ERGMs) [30] that can explain the endogenous and exogenous driving factors of a network. However, they can merely deal with cross-section network data observed at a given moment instead of longitudinal data. The family of stochastic actor-based models (SABMs) [31] is capable of modeling longitudinal network data across several time periods and permits the parameterization of both exogenous and endogenous covariate factors.
The viability and advantages of using SABMs in spatial network analysis can be seen in Liu et al. [32]. Zhang et al. [7] have employed SABMs specifically in an air transport context in their research of the evolution of European air networks. In particular, the research recognized that in a liberalizing marketplace, airports have become significant actors in the development of air transport networks. This paper, then, extends the existing literature through the application of a more comprehensive SABM model to investigate the factors influencing the evolution of the CATN over the period 2011-2017. Since, as described above, the structural properties of the CATN have been shown to be characterized by some level of stability (i.e., in hubbing, core vs. peripheral airports), we employ endogenous variables commonly used in SABMs and construct the exogenous variables for the SABMs for China’s context based on a review of relevant literature and an exploratory analysis.
3. Data Considerations and Exploratory Analysis
The literature described above suggests that the inclusion of integrated measures of airport hierarchy, LCCs, and HSR must be incorporated into analyses to develop a more comprehensive understanding of the drivers of the CATN. In this section, we build on that discussion to accomplish two goals. First, we describe the resource of the database. Second, we perform an exploratory data analysis which provides direct inputs into the stochastic actor-based models as employed in Section 4 of the paper.
3.1. Data
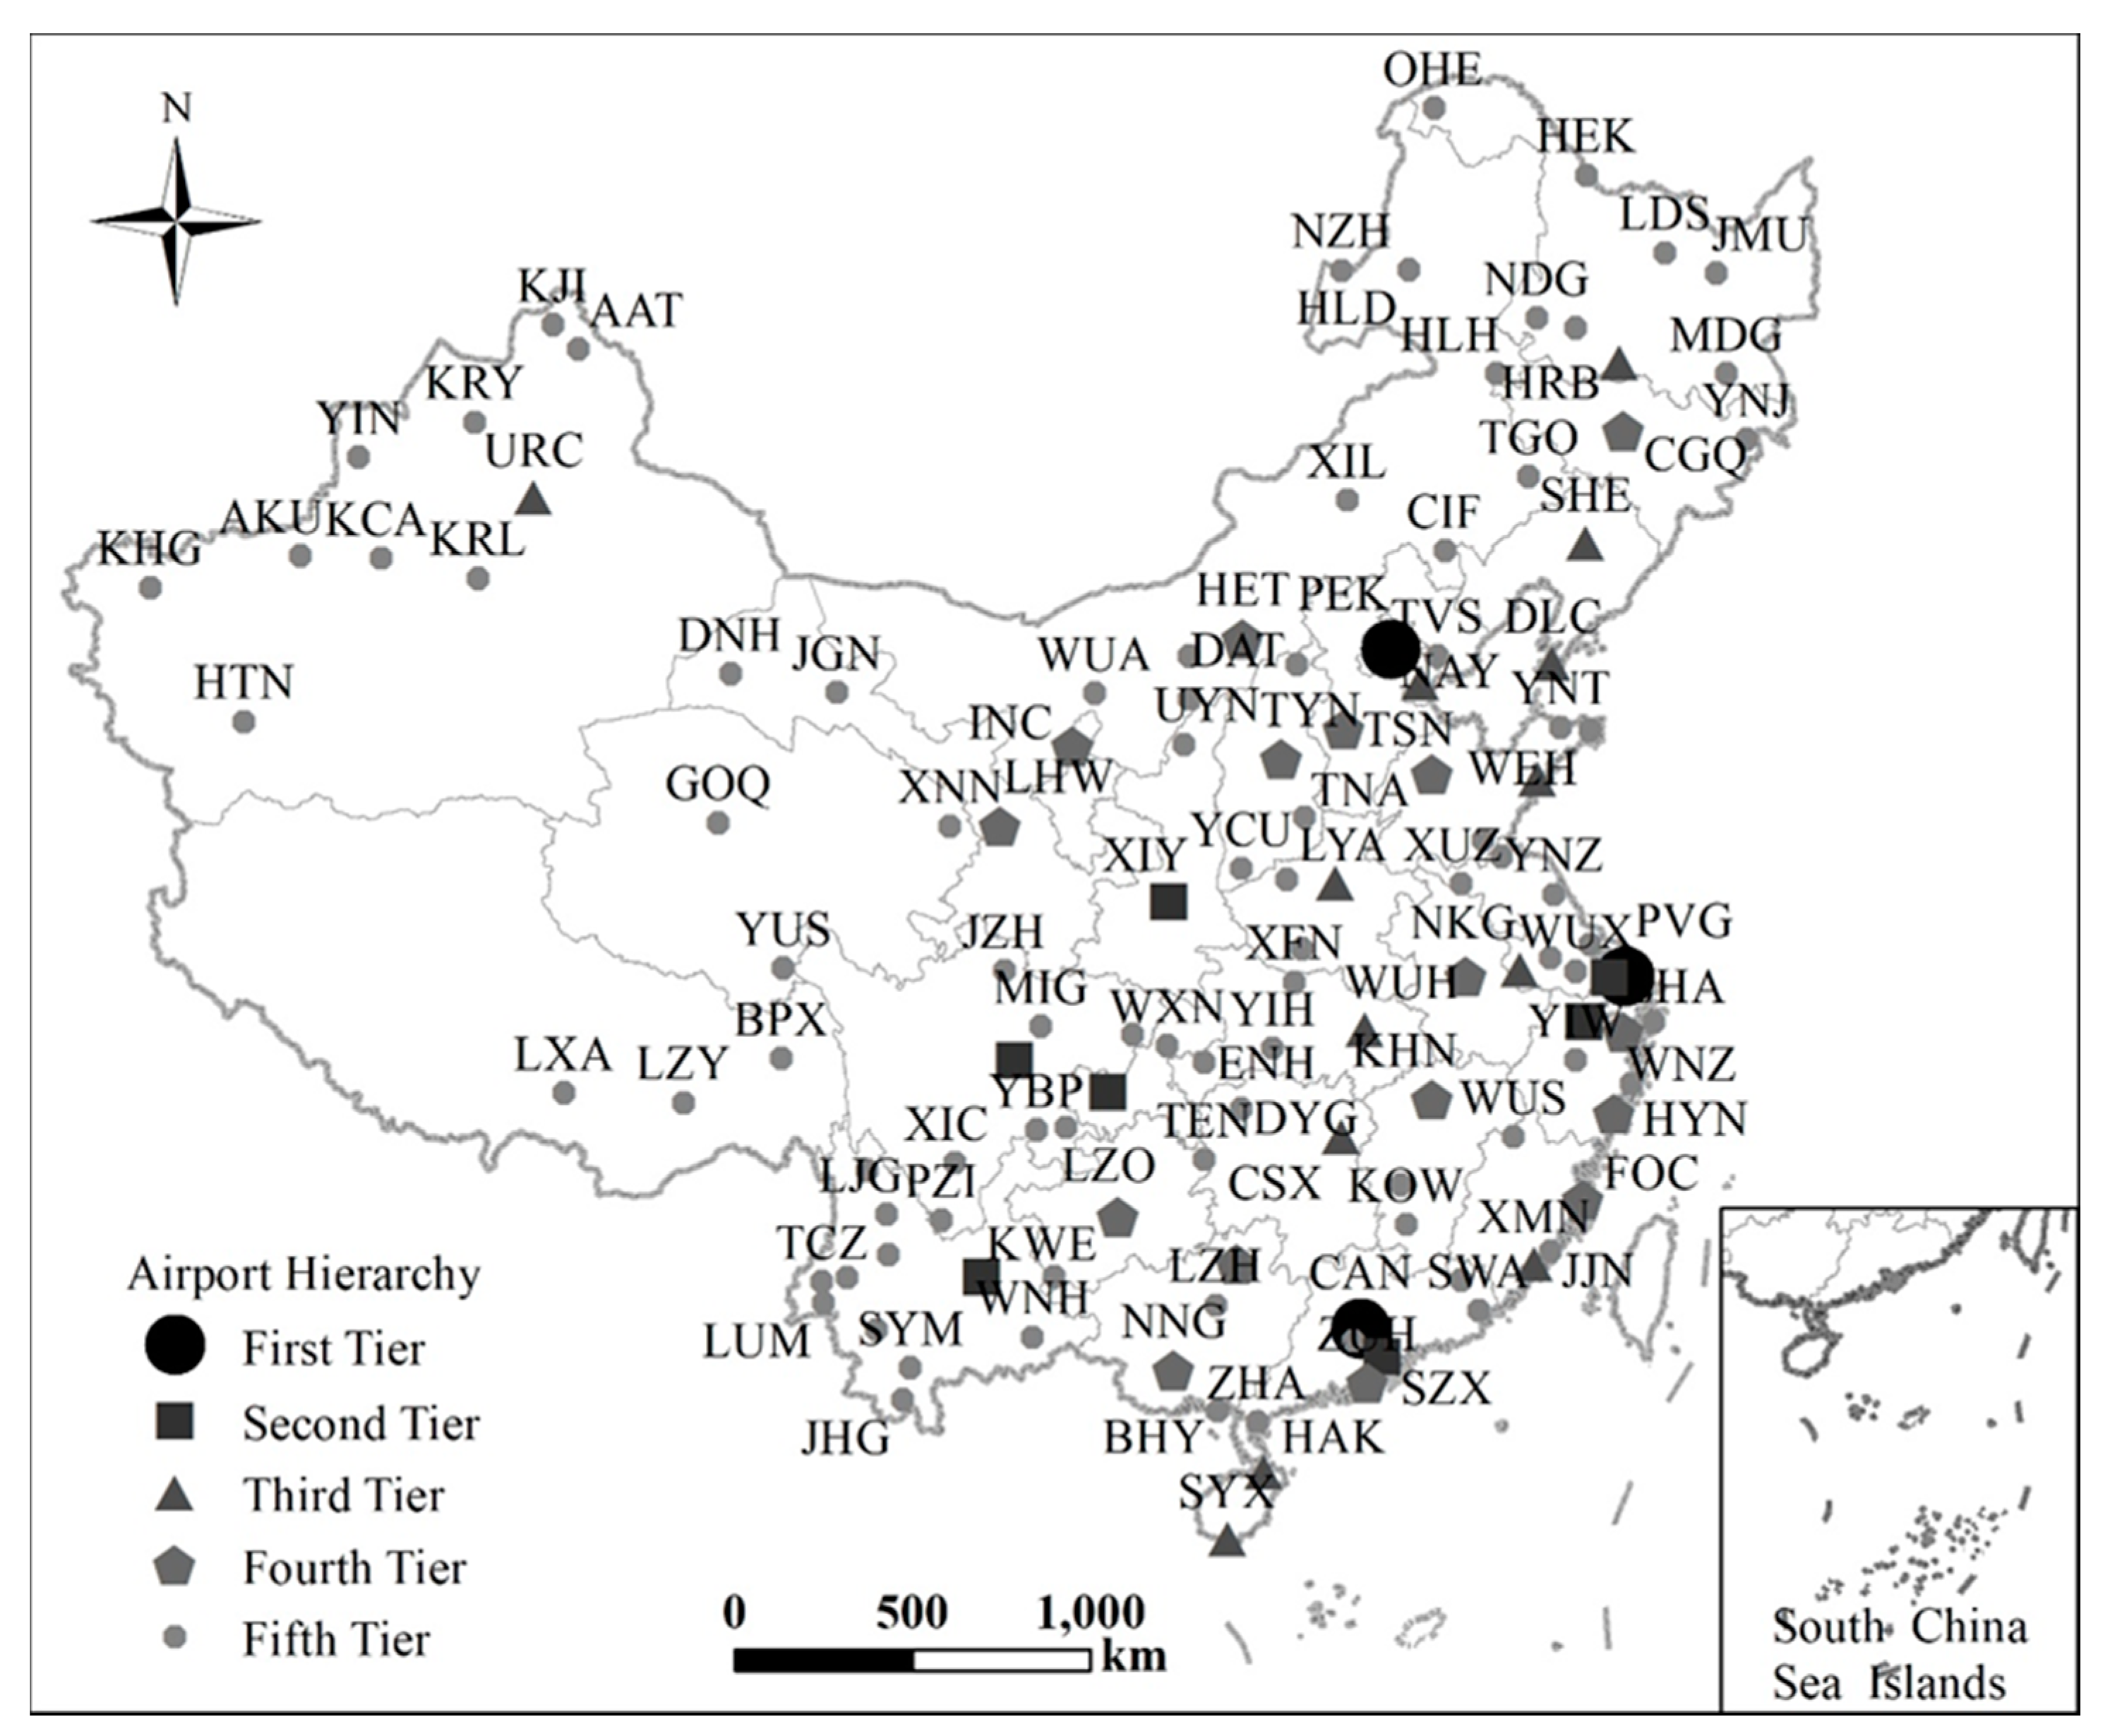
Flights data were collected from the Official Airline Guide’s (OAG) “schedule analyzer module” for the years 2011 and 2017. These data contain information on origin and destination airport, as well as flight frequencies and number of seats. We consider the CATN to be a non-directed network in which a route between any airport pair can always be matched with a return route. Airports of primary concern to the analysis include those that (1) had yearly outgoing route frequencies greater than 365, and, (2) provided services in both 2011 and 2017. The threshold of restricting routes selection is relatively high due to the fact that the opening of some routes may be policy-oriented instead of business-oriented given the regulation of the air transport in China. We have tried to eliminate this issue as much as possible in the analysis. Utilizing this technique, we identified 127 airports (Figure 1) which we consider to be the node set of the CATN upon which the rest of the analysis is focused.
As indicated earlier, it has become clear that a comprehensive assessment of the CATN requires a more refined breakdown of the airport hierarchy in order to capture the details of the evolving network. In order to facilitate the design of actor and dyadic covariates upon the airport hierarchy, we performed a hierarchical cluster analysis on the group of airports that met our criteria for inclusion The advantage of applying the hierarchical cluster analysis over other clustering methodologies is that there is no need to predefine the number of clusters. As shown in Table 1, the larger number of airports under investigation in this paper compared to other papers calls for a five-tier clustering which can better refine the distinct characteristics of the lower-level airports, which has been largely ignored by existing research. Four indicators, i.e., population levels and enplanements in both 2011 and 2017, were used as they are capable of representing the performance and potential demand of airports, as well as changes in the period under investigation. The classification results were validated by comparing with the results of other studies. As shown in Table 1, the first two tiers nearly correspond to the results of the existing research. Given the larger number of airports investigated, the classification of the remaining airports into more groups provides more details about the characteristics of airports. Most airports positioned in the third and fourth hierarchy are provincial capitals. The difference between these two tiers is due to the inequality of the economy development in different regions (e.g., east versus west). The fifth airports are those positioned as peripheral airports in the overall network.
SABM assumes that the ratio of the number of maintained ties over time relative to the sum of the maintained, new and broken ties is larger than about 0.3 [31]. To insure that this assumption is met, we applied the Jaccard index defined as follows: , where , and are the number of maintained ties, new ties and broken ties. The result was 0.422 (see Table 2), indicating that the network formation process can be modeled via SABM. Overall, the density of the CATN increased by 43.8% during the study period. The average number of routes connected by an airport increased by about 3, while the total number of routes increased by 333. However, there is still a large number of routes that are not linked by any airports until 2017, implying a sparse characteristic of CATN.
3.2. Exploratory Analysis
To establish the specific ways in which airport hierarchy, route distance ranges, as well as a new perspective on LCC-HSR interactions can be used in a model of drivers of change in the CATN, this section conducts an exploratory analysis of the data. In doing so, the definition of airport hierarchy follows Figure 1. Further, we divided route distance into three categories: short-haul routes of less than 1000 km, medium-haul with distances between 1000 km and 2000 km, and long-haul of more than 2000 km A more detailed division is also designed by dividing the short-haul into routes with distance less than 500 km and between 500 and 1000 km. Meanwhile, the long-haul is split into distance between 2000 and 3000 km, as well as larger than 300 km. However, it does not change the estimation results.
3.2.1. The Changes in the CATN Based on Airport Hierarchy
As described above and shown in Figure 1, the airports in the study were divided into five tiers. First, to determine whether there was variation in terms of routes over time, we measured the number and share of routes by group, weighted by the number of airports in each group (Table 3). The results show that the first-tier airports (i.e., PEK, PVG and CAN) have the strongest likelihood to open routes to airports in other tiers in both 2017 and 2011, confirming the inertia of the structure of CATN where the ‘big three’ continues to dominate the launch of the new routes. Interestingly, however, the share of routes at these top airports decreased by 15.2%. On the other hand, fifth-tier airports showed the largest relative increase in 2017, followed by the third-tier airports. While the percentage increase is large, particularly for the fifth tier, the fact that the overall percentage of routes in this group is small confirms that most of these airports remain on the periphery. Meanwhile, second-tier cities are also playing a more important role [11,33].
3.2.2. The Changes of CATN Based on Distance
Table 4 shows the changes in the number of routes and share of the CATN by distance band. Based on the number of routes, the long-haul markets (>2000 km) had the largest increase, followed by medium- (i.e., 1000–2000 km) and short-haul (<=1000 km) markets, respectively. Based on the share of total routes, medium-haul markets had the largest share in both 2017 and 2011 and experienced a 6% increase. Although long-haul markets also had a substantial increase, comparatively, they had the lowest share of routes in both years. Finally, the short-haul market had a 13.6% decrease in the share of number of routes. In sum, these trends strongly suggest that a model of CATN evolution should consider route distance in the mix of variables.
3.2.3. The Impact of LCCs and HSR
High speed rail is an important option for spatial mobility in many areas of China. However, as elaborated in the literature review, Wang et al. [26] found that the impact of HSR expansion on aviation may be overestimated if the potential impacts of LCCs (and specifically, Spring Airlines) is not recognized.
Data on HSR stations and lines were collected through cooperation with the Dispatching Department of China State Railway Group Company Data were collected through the website of China State Railway Group Company [https://www.12306.cn/index/. First accessed in 1st March 2020].We examined the joint impact of LCCs and HSR by dividing routes into four types: (1) routes served only by an LCC without HSR presence; (2) routes served only by HSR without LCC presence; (3) routes served by both LCC and HSR, and (4) routes served not by either LCC and HSR. Table 5 shows the changes in the number and share of routes by the four route types. Surprisingly, there were only two routes served by an LCC but without HSR presence in 2011 and no such routes in 2017. In other words, by 2017, all routes served by an LCC were also served by HSR. Moreover, the number of jointly served LCC/HSR routes increased by three times over the period. Both the number and share of routes served only by HSR increased between 2011 and 2017. These results indicate that the SABM should be incorporated into the dynamics of HST and LCC options.
4. Model Specification and SABMs
The SABM method combines continuous time Markov models, random utility models and Monte Carlo simulation techniques to analyze network dynamics [34]. The actor-based ‘unilateral initiative and reciprocal confirmation’ model is applied to estimate the tendency parameters due to the hypothesis of undirected characteristics of the CATN [34,35]. The key setting of the model is the objective function that determines the probabilities of the tie changes made by actors and is assumed to be a linear combination of a set of network effects [31], as presented in Equation (1).
where, represents the adjacency matrix of a network, in which represents the presence or absence of a route between two airports and and equals to 1 or 0; is the total number of actors. The dependent variables in the model are the changes in tie variables derived from . represents the objective function for airport . Its value depends on the current state , a potential future state of the network, as well as on actor covariates and dyadic covariates (i.e., exogenous effects). are functions denoting the endogenous and exogenous covariates driving the evolution of CATN from the standpoint of actor . are the statistical parameters that express dynamic tendencies of network evolution. If equals 0, the corresponding effect plays no role in the network dynamics; if is positive, the probability that the network shifts towards the direction with a high value on the corresponding network effect is higher; otherwise, if is negative [31].
As are the core components of the objective function, we will explain them in detail. We focus on three categories of covariates: structural, dyadic, and actor, which incorporate the supply/demand, structural, spatial and competitive effects described earlier. Following Zhang et al. [7], the structural effects include four endogenous network effects, i.e., (i) density, (ii) transitivity triads, (iii) betweenness, and (iv) ‘number of distances-two’ effects (network connections via an intermediary). This is due to the fact that both the CATN and European air transport network possess small-world network characteristics with scale-free properties [3]. The dyadic covariates include route distance, LCC activity, HSR activity, and the interaction term of LCC and HSR. The actor covariates include airport hierarchy, the growth of airports, and the trend to develop integrated (i.e., a combination of air and HSR) transport nodes. The definitions of the endogenous and exogenous covariates are introduced as follows.
4.1. Structural Covariates
- Density effect
The density effect is the most basic structural effect and captures the tendency of an airport to connect to other airports. As we are dealing with a non-directed network, in-degree and out-degree effects are combined into an overall degree or density effect, as measured by Equation (2).
where is the adjacency matrix; denotes the density effect; and are airports; indicates the presence or absence of a non-stop connection between two airports and equals to 1 or 0. A positive value for the density parameter suggests that airports tend to open more routes; a negative value for the density parameter suggests that airports tend to have fewer routes.
- Transitivity closure effect
The transitivity closure effect assesses the tendency of two airports to become connected if both airports share a third common ‘partner’ in the network. It is defined as the number of transitive patterns in an airport’s relations. The calculation is presented in Equation (3).
where denotes the transitivity closure effect; , and are airports. A positive sign suggests that airports connecting to the same ‘partner’ airport are more likely to initiate a new route compared to other airports that do not have a shared ‘partner’. A negative sign indicates that airports connecting to the same airport are less likely to form closed triangles than other airports that do not have a ‘partner’ in common.
- Betweenness effect
The betweenness effect measures the number of pairs of airports that are indirectly linked by a third airport. The calculation is presented in Equation (4).
where denotes the betweenness effect. A positive sign indicates the tendency of airports to be in between disconnected airports and to function as ‘transfer’ centers. A negative sign suggests that airports are less likely to be in between disconnected airports over time.
- Number of distances-two effect
Number of distances-two effect (nbrDist2) takes into account indirect connections between airports, which is defined by the number of airports to whom an airport is indirectly related through at least one intermediary node (i.e., at geodesic distance two).
where denotes the ‘number of distances-two’ effect. A positive sign for this effect suggests that airports open indirect routes, connecting other airports through an intermediary airport. A negative nbrDist2 effect indicates that airport is more likely to directly connect to airport , given that airport ’s ‘neighbor’ airport is directly connected to airport (and regardless of any other indirect connection to airport ).
It is worth noting that airports can perform as the predominant actor of opening or canceling routes when the network data were aggregated by all carriers. In addition, airports are playing an increasingly important role in the network development at the country level while dealing with complicated relationships with carriers, passengers and other airports [7].
4.2. Dyadic Covariates
- Distance effect
Based on the exploratory analysis, we construct two variables, i.e., and , to test whether distance is a significant driver of network dynamics. The benchmark variable is route distance belonging to the short-haul range. If the distance of a route is between 1000 and 2000 km, then the value of is 1, and 0 otherwise. If a route’s distance is above 2000 km, then the value of equals to 1, and 0 otherwise. This division allows us to examine whether the probability of opening new routes varies among different distance bands.
- LCC effect
The variable is designed to indicate if the presence of an LCC (i.e., Spring Airlines in particular) on a certain route can significantly influence change in the CATN. If Spring Airlines is active on a route, then the value of is 1, and 0 otherwise.
- HSR effect
The variable represents the potential impact of HSR on the evolution of the CATN. If both ends of a route are located in cities that have HSR stations, then the value of this variable equals to 1, and 0 otherwise.
Based on exploratory analysis, we further deploy an interaction term, i.e., to study the integrated impact of LCC and HSR given their strong overlap in services.
4.3. Actor Covariates
- Airport hierarchy effect
Four variables, i.e., , , , and , are designed to detect whether the existing airport hierarchy drives the network evolution. The measurement of these variables is based on the exploratory analysis explained in Section 3.
- Growing airports effect
Researchers have found that some airports in China experienced substantial growth after 2011 [11,12]. It is thus important to investigate whether these growing airports are also vital forces in overall network changes in the CATN. Based on Zhang et al. [12], we specifically consider 13 airports with the largest growth rates and rise in rank in terms of connectivity. These include Nantong, Mianyang, Liuzhou, Luzhou, Luoyang, Shantou, Zhanjiang, Lanzhou, Hohhot, Lijiang, Harbin, Zhengzhou and Yinchuan.
- Emerging integrated traffic center effect
The variable tests whether a city where the airport is located had HSR stations in 2017, but not in 2011. If positive, then this is an indirect representation of the HSR effect at the airport level. The coexistence of HSR and airports in the same city implies the government’s intent to develop a more integrated transport system at a city level to facilitate mobility. The emergence of an integrated transport system is important because it both reflects a level of travel demand, and may even stimulate new potential demand as travelers can easily choose between HSR and air. Its impact on network dynamics may be positive in the long-term, but also may be difficult to uncover in the short-term.
5. Results
5.1. Model Tests
We employed a forward stepwise procedure to gradually construct and select models. Based on the exploratory analysis and model specification, seven intermediate models were estimated: Model 1 is the basic model including the four endogenous covariates; Model 2 adds the two distance covariates; Models 3 to 5 incorporate other dyadic covariates (i.e., LCC, HSR and their interaction term); Model 6 accounts for the four airport hierarchy covariates; and finally, Model 7 includes the other two actor covariates (i.e., Growing airports effect, Emerging integrated traffic center effect). Model 7 consists of the full set of both endogenous and exogenous covariates that have the potential to drive the evolution of the CATN (Table 6).
The first step to ensure good parameter estimation is to evaluate the convergence of results. SABMs generate an indicator called “convergence t-ratio” to check for the convergence of the individual parameters and the overall model. For adequate convergence, the t-ratio of an individual parameter should be lower than 0.1 and the overall maximum convergence ratio should be less than 0.25 [31]. As shown in Table 6, this is the case for each of the models and their individual parameters.
In addition, Wald- and score-type tests are used to decide whether individual or multiple covariates should be incorporated in the model based on the (joint) significance of newly added parameters. As shown in Table 6, the significance of Score-type tests for Models 2–7 (except model 5). The Score- and Wald-type tests are applied to test the new added parameters only. As the interaction term of LCC and HSR in Model 5 is not significant, the values for the two tests are also not statistically significant. However, this variable is still included in the following models due to the theoretical considerations. indicates improvements in fitting the models, as the new dyadic and actor covariates are progressively included in the models. Wald-type tests for joint significance also yield significant results, revealing that the evolution of the CATN is strongly driven by the specified effects.
5.2. Parameter Interpretation
The estimation results are presented in Table 6. As represented by the rate parameter from Models 1 to 7, a Chinese airport can obtain 9 to 12 expected opportunities to change route links per time step between 2011 and 2017. Time steps represent the time moments when an actor obtains the chance to change a route connection according to its current state and other actors’ states in the network. These time steps are simulated values and made sequentially. The basic density effect is significant and negative in the first five models without airport hierarchy covariates, implying that the costs of an airport launching a route to another arbitrary airport outweigh the benefits. This suggests that the airport should rationally evaluate the attractiveness of the other airports before making links. Based on Model 5, the probability that an airport creates a new random route is 29% [] during the study period. The non-significance of the density effect in Models 6 and 7 (when adding the four airport hierarchy covariates) reflects the close association between node degree and its strength (e.g., flight frequency, passenger, GDP, etc.). This confirms results found by Lin [2] and Zhang et al. [4]. On the other hand, it highlights the overarching role of airport hierarchy covariates over simply binary links in driving the evolution of the CATN.
The transitive triplets effect is significant and positive in all seven models, suggesting that the network tends to evolve towards a state with a higher value of this effect. For instance, suppose that airport has a route link with airport and but and are not connected, then ceteris paribus, the odds of the route being created is about 1.1 times () higher than other cases. In other words, the probability that and connect with in order to increase its value of closed triplets is 51.4%.
The betweenness effect is only significant in Models 6 and 7 which include airport hierarchy covariates. The negative sign means that the CATN tends to evolve towards a state with a larger betweenness centrality. Numerically, if airport is linked with airport but not , then ceteris paribus, the probability that is connected to is as low as 43%, as the creation of route will increase the betweenness of airport by 1 unit. In practice, it reflects the fact that airports are not as attractive as transfer or stopping points in China’s domestic air markets.
The ‘number of distances-two’ effect is significant and negative in almost all models, suggesting the preference of non-stop routes over one-stop ones in the CATN. Although one-stop transfer flights can increase an airport’s accessibility, the unattractiveness of the domestic hub airports (as shown by the betweenness effect) has hindered the launch of many one-stop flights, especially from small airports. Combined with the positive effect of transitive triplets, the CATN tends to evolve towards a more compact and non-concentrated network by creating more point-to-point routes and closed triads.
The two distance covariates present significant and negative impacts when the airport hierarchy covariates are included in the model. As shown in Model 7, the probability that an airport links to another airport with a medium- and long-level distance are 32% and 17%, respectively. It seems that the CATN, overall, has generally evolved towards more routes with a distance below 1000 km during the study period.
The LCC effect is significant and negative in all models, suggesting that the CATN has a higher probability to establish new route linkages without the presence of Spring Airlines. This may not, however, necessarily imply that Spring Airlines had strong power to deter the entry of competitors on a route. Rather, this effect may reflect Spring Airlines’ stagnant development when facing the strong competition from HSR and the three big airlines (i.e., Air China, China Eastern, and China Southern).
The HSR effect is also significant and negative in all models. The odds ratio of opening a route overlapping with the HSR service versus without the HSR service is 0.04. In line with the negative impact of HSR on the demand for and capacity supplied of seats found by other researchers, we provide evidence that the large-scale development of HSR also puts great competition pressure on the overall air transport network evolution in China.
The interaction term of LCC and HSR is significant and positive in Models 6 and 7, signifying that the CATN tends to evolve towards airport pairs with the presence of both LCC and HSR. As shown in the exploratory analysis, the total number of routes with both LCC and HSR services in 2017 increased by two times compared to 2011, especially on routes involving fourth-tier airports connected by first, third, and fourth-tier airports. A closer examination of the overlapping LCC and HSR routes in 2011 and 2017 shows that the expansion of Spring Airlines in focus cities, and the “shadow effect” of HSR constructed at Shanghai, contribute to the positive impact of the interaction term. As shown in Table 7, four new focus cities (i.e., LHW, NGB, CGQ, and BHY) that were added into Spring’s network in 2017 also have HSR service. Although it is unclear whether it is the operation of HSR or LCC that stimulates new demand and drives the route expansion, the presence of both LCC and HSR provides more options for passengers. Second, twelve more routes were added at PVG, i.e., one of the most important focus cities of Spring, in 2017. Given the fact that the HSR was directly integrated into Shanghai Hongqiao Airport, the significant increase of route linkages at PVG may be due to the shadow effect of integrated transport construction at SHA. In addition, combined with the negative effects of including LCC and HSR covariates separately, this variable captures the tradeoff and contradiction between the relatively regulated aviation industry and the surge of the external development in China, such as economy, trade, labor migration, and urbanization.
As expected, the four airport hierarchy covariates significantly and positively affect the evolution of the CATN. Compared with the fifth-tier airports, the odds of opening routes at the other four tier airports is quite high. The effects reveal a gradually decreasing trend as the hierarchy moves from the first-tier to the fourth-tier airports. The results highlight the significance of the existing airport hierarchy as a driver of network evolution. Furthermore, as expected, airports with high growth rates also have higher probability to open new routes. This contrasts with airports whose cities were included in the policy of establishing new HSR stations. Here, there was no statistical impact on network change.
6. Conclusions
This paper investigates the dynamics of air transport in China by considering the impact of structural, spatial, competitive, and (by implication) state-level effects on the development of the CATN. Important considerations are the impacts of airport hierarchy, low-cost carrier activity and high-speed rail. Stochastic actor-based modeling allows us to incorporate the endogenous structural effects in order to examine how exogenous and endogenous factors together drive network evolution in a comprehensive way. This paper contributes to the literature in three ways: (1) The systematic classification of airports with five tiers (as opposed to traditional three-tier representations) permits the significant impacts of the four endogenous covariates to be revealed. In other words, the traditional classification of airports into less tiers cannot fully capture the network sub-structures such as transitivity or indirect connection in CATN; (2) An integrated perspective of low-cost carrier and high-speed rail is adopted to highlight the importance of market presence to motivate the opening of new routes and further activation of potential demand; and (3) The combined endogenous and exogenous covariates provide a comprehensive explanation on the mechanisms of network evolution in the CATN, expanding on previous research to better parameterize the effects and to show the utility of SABMs.
Airport hierarchy effect plays a role, not only in driving the evolution of the CATN, but also by enhancing the estimation accuracy of the model. First, the higher the level of the airport in the hierarchy, the larger the probability or odds of opening new routes. While this seems obvious, it is, in fact, quite nuanced, since busy airports operating closer to capacity may not necessarily have the ability to do so. The quantification of the probability or odds difference among various levels of the hierarchy reveals a significant phenomenon—the rising role of second-tier airports as a driver of network evolution—confirming the more descriptive results of O’Connor and Fuellhart [33] and O’Connor et al. [11]. As suggested by Zhang et al. [36], the congestion at the ‘big three’ airports (i.e., here corresponding to the first-tier airports) caused by capacity constraints leads to a “congestion spillover effect.” Some secondary airports in China have more ability to accommodate the spillover transfer traffic. Our findings add straightforward evidence that verifies the extent to which second- tier airports are influencing the dynamics of the CATN. Second, incorporating the airport hierarchy effect into the model highlights the significance of other covariates, such as betweenness effect, two distance effects and the LCC and HSR interaction effect.
Low-cost carriers, like Spring Airlines, have a significant role in impelling the development of the CATN, but not in an ‘aggressive’ way. This is in line with Fu et al. [23] who, using data from 2005 and 2012, summarized that “LCCs have potential to introduce more competition but are yet to be a ‘game changer’ in China.” Our research, using data from 2011 and 2017, shows that Spring Airlines still needs to make substantial efforts before it more substantially impacts the aviation market, at least from the perspective of system-wide network development.
The significant and negative sign of HSR provides new evidence about its impact on driving the network evolution of the CATN. Our findings confirm that HSR has profoundly influenced aviation in a widespread way. However, they also show that this result, together with the significant and positive impact of the LCC/HSR interaction term, provides evidence that the development of a sophisticated air transport network at the national level calls for policy support from both the aviation industry and city governments. Expanded aviation deregulation, especially to encourage the prosperity of LCCs, would benefit the market and the network. After all, it is both the diversity of carriers and competitive market structure that will benefit travel. For local governments, a higher priority on the development of an integrated transport system could be made to enhance the coordination of different transport modes. As illustrated by the PVG - SHA case, the construction of HSR inside of one primary airport within a multi-airport system can bring the “shadow effect” for other airports. On the other hand, it can also be the case that the presence of HSR (even before the official operation) cultivates the willingness-to-travel of passengers, which can be later enhanced by the presence of Spring, or vice versa.
The three endogenous variables (i.e., transitive triplets, betweenness, and indirect effects) are also crucial driving forces of the network evolution. Given the unattractiveness of transfer through the domestic hub airports (as shown by the negative betweenness effect), the CATN has tended to evolve into a more non-concentrated, point-to-point network structure through the creation of non-stop routes (i.e., the negative indirect effect) and closed triads (i.e., the positive transitive triplets). Together with the airport hierarchy effect, our findings provide opportunities for airport operators. First, given the importance of airport hierarchy in network formation, airports should carefully examine their development strategies and functions in order to develop strong positions in the hierarchy. For instance, for the large number of fifth-tier airports, playing a feeder role to regional capital airports is a way to significantly increase accessibility. Second, the weakness of the existing transfer market overall may actually signify opportunity for some alternative airports to become more transfer-centered—particularly those airports positioned in the second and third tier of the hierarchy. Finally, we showed that route distance also significantly influences the evolution of the CATN. In sum, these integrated findings offer an extensive summary of the evolution of the CATN over a 16-year period, ending prior to the global COVID pandemic of 2019/2020—which will most certainly change the shape of aviation in China and around the world. The study provides a benchmark by which to view the reemergence of the aviation industry in the Chinese context as a different air transport market evolves.
This study also has some limitations, and provides opportunities for further research in several ways. First, the coverage of the CATN can be expanded to include smaller routes and more airports in order to explicitly quantify the impact of policy regulation on an even broader definition network evolution. Second, the construction of the HSR variable can be made more specific by considering the speed, frequency and travel time of HSR routes. In that way, the impact of HSR on air transport network dynamics can be interpreted in a more straightforward way. Last but not the least, we have analyzed the CATN from purely a domestic perspective. Future work can take China’s international air transport network into consideration, which is particularly relevant vis a vis the COVID-19 pandemic, as knowing how the CATN has arrived in its current state can be an important benchmark to understanding the similarities, differences, and potential outcomes of a post-pandemic China (and world).
Author Contributions
Conceptualization, S.Z. and K.F.; methodology, L.D.; validation, X.T. and F.W.; formal analysis, Y.H.; data curation, S.Z. and X.T.; Writing—Original draft preparation, S.Z. and L.D.; Writing—Review and editing, K.F. and F.W.; Funding acquisiton, X.T., S.Z. and Y.H. All authors have read and agreed to the published version of the manuscript.
Funding
This research was funded by the National Natural Science Foundation of China under grant number 41701120, number 61603178, number 41901189 and Foundation of Graduate Innovation Center at Nanjing University of Aeronautics and Astronautics under grant number kfjj20190704.
Acknowledgments
This research has been supported by the National Natural Science Foundation of China under grant number 41701120, number 61603178, number 41901189) and the Foundation of Graduate Innovation Center at Nanjing University of Aeronautics and Astronautics under grant number kfjj20190704.
Conflicts of Interest
The authors declare no conflict of interest.
References
- Civil Aviation Administration of China. Statistical outlook of China Civil Aviation in 2019. 1-216. Available online: http://www.caac.gov.cn/XXGK/XXGK/TJSJ/202006/P020200605630677965649.pdf (accessed on 4 August 2020).
- Lin, J. Network analysis of China’s aviation system, statistical and spatial structure. J. Transp. Geogr. 2012, 22, 109–117. [Google Scholar] [CrossRef]
- Wang, J.; Mo, H.; Wang, F. Evolution of air transport network of China 1930–2012. J. Transp. Geograph. 2014, 40, 145–158. [Google Scholar] [CrossRef]
- Zhang, J.; Cao, X.-B.; Du, W.-B.; Cai, K.-Q. Evolution of Chinese airport network. Phys. A Stat. Mech. Its Appl. 2010, 389, 3922–3931. [Google Scholar] [CrossRef]
- Alderighi, M.; Cento, A.; Nijkamp, P.; Rietveld, P. Network competition—the coexistence of hub-and-spoke and point-to-point systems. J. Air Transp. Manag. 2005, 11, 328–334. [Google Scholar] [CrossRef]
- Gegov, E.; Postorino, M.N.; Atherton, M.; Gobet, F. Community structure detection in the evolution of the united states airport network. Adv. Complex Syst. 2013, 16, 1350003. [Google Scholar] [CrossRef]
- Zhang, S.; Derudder, B.; Witlox, F. Dynamics in the European Air Transport Network, 2003–9: An Explanatory Framework Drawing on Stochastic Actor-Based Modeling. Networks Spat. Econ. 2015, 16, 643–663. [Google Scholar] [CrossRef] [Green Version]
- Huang, J.; Wang, J. A comparison of indirect connectivity in Chinese airport hubs: 2010 vs. 2015. J. Air Transp. Manag. 2017, 65, 29–39. [Google Scholar] [CrossRef]
- Wang, J.; Mo, H.; Wang, F.; Jin, F. Exploring the network structure and nodal centrality of China’s air transport network: A complex network approach. J. Transp. Geogr. 2011, 19, 712–721. [Google Scholar] [CrossRef]
- Mo, H.; Jin, F.; Liu, Y.; Wang, J.E. Network analysis on centrality of airport system. Sci. Geogr. Sin. 2010, 30, 204–212. [Google Scholar]
- O’Connor, K.; Fuellhart, K.; Zhang, S. Change in the role of cities in China’s air transport 2005–2015. Asian Geographer 2018, 35, 1–14. [Google Scholar] [CrossRef]
- Zhang, Y.; Zhang, A.; Zhu, Z.; Wang, K. Connectivity at Chinese airports: The evolution and drivers. Transp. Res. Part A Policy Pr. 2017, 103, 490–508. [Google Scholar] [CrossRef]
- Jinxue, D.; Fengjun, J.; Chengjin, W. Evaluation, optimization and simulation of the spatial layout of transport hubs in China. Acta Geogr. Sin. 2011, 66, 504–514. [Google Scholar]
- Chen, Z. Impacts of high-speed rail on domestic air transportation in China. J. Transp. Geogr. 2017, 62, 184–196. [Google Scholar] [CrossRef]
- Ding, J.; Jin, F.; Wang, J.; Liu, D. Competition game of high-speed rail and civil aviation and its spatial effect—a case study of Beijing—Shanghai high-speed rail. Econ. Geogr. 2013, 33, 104–110. [Google Scholar]
- Wang, J.e.; Jing, Y.; Yang, H. Impacts of high-speed rail on China’s domestic air transportation. J. Nat. Res. 2019, 34, 1933–1944. [Google Scholar]
- Xia, W.; Zhang, A. Air and high-speed rail transport integration on profits and welfare: Effects of air-rail connecting time. J. Air Transp. Manag. 2017, 65, 181–190. [Google Scholar] [CrossRef]
- Jin, F.; Wang, F.; Liu, Y. Geographic patterns of air passenger transport in China 1980-1998: Imprints of economic growth, regional inequality, and network development. Prof. Geogr. 2004, 56, 471–487. [Google Scholar]
- Brueckner, J.K.; Lee, D.; Singer, E.S. Airline competition and domestic US airfares: A comprehensive reappraisal. Econ. Transp. 2013, 2, 1–17. [Google Scholar] [CrossRef]
- De Wit, J.; Zuidberg, J. Route churn: An analysis of low-cost carrier route continuity in Europe. J. Transp. Geogr. 2016, 50, 57–67. [Google Scholar] [CrossRef]
- Gross, S.; Lück, M. The Low Cost Carrier Worldwide; Ashgate Publishing, Limited: Farnham, UK, 2013. [Google Scholar]
- Chen, R. Competitive responses of an established airline to the entry of a low-cost carrier into its hub airports. J. Air Transp. Manag. 2017, 64, 113–120. [Google Scholar] [CrossRef]
- Fu, X.; Lei, Z.; Wang, K.; Yan, J. Low cost carrier competition and route entry in an emerging but regulated aviation market—The case of China. Transp. Res. Part Pol. Prac. 2015, 79, 3–16. [Google Scholar] [CrossRef] [Green Version]
- Zhang, Q.; Yang, H.; Wang, Q.; Zhang, A. Market power and its determinants in the Chinese airline industry. Transp. Res. Part A Policy Pr. 2014, 64, 1–13. [Google Scholar] [CrossRef]
- Wang, J.; Bonilla, D.; Banister, D. Air deregulation in China and its impact on airline competition 1994–2012. J. Transp. Geogr. 2016, 50, 12–23. [Google Scholar] [CrossRef] [Green Version]
- Wang, K.; Xia, W.; Zhang, A. Should China further expand its high-speed rail network? Consider the low-cost carrier factor. Transp. Res. Part A Policy Pr. 2017, 100, 105–120. [Google Scholar] [CrossRef]
- Zhang, Q.; Yang, H.; Wang, Q. Impact of high-speed rail on China’s Big Three airlines. Transp. Res. Part A Policy Pr. 2017, 98, 77–85. [Google Scholar] [CrossRef]
- Zhang, X.; Luan, W.; Zhao, B. Competition between Wuhan-Guangzhou High-speed Railway and Civil Aviation Based on Disaggregate Model. J. Transp. Syst. Eng. Inf. Technol. 2012, 12, 17–21. [Google Scholar] [CrossRef]
- Dai, L.; Derudder, B.; Liu, X. Generative network models for simulating urban networks, the case of inter-city transport network in Southeast Asia. Cybergeo 2016. [Google Scholar] [CrossRef]
- Snijders, T.A.B.; Pattison, P.; Robins, G.; Handcock, M.S. New Specifications for Exponential Random Graph Models. Sociol. Methodol. 2006, 36, 99–153. [Google Scholar] [CrossRef]
- Snijders, T.A.B.; Van De Bunt, G.G.; Steglich, C. Introduction to stochastic actor-based models for network dynamics. Soc. Netw. 2010, 32, 44–60. [Google Scholar] [CrossRef]
- Liu, X.; Derudder, B.; García, C.G. Exploring the co-evolution of the geographies of air transport aviation and corporate networks. J. Transp. Geogr. 2013, 30, 26–36. [Google Scholar] [CrossRef] [Green Version]
- O’Connor, K.; Fuellhart, K. Change in air services at second rank cities. J. Air Transp. Manag. 2013, 28, 26–30. [Google Scholar] [CrossRef]
- Van de Bunt, G.G.; Groenewegen, P. An actor-oriented dynamic network approach the case of interorganizational network evolution. Org. Res. Meth. 2007, 10, 463–482. [Google Scholar] [CrossRef] [Green Version]
- Snijders, T.A. Actor-Based Models for Dynamics of Two-Sided Relations. 2011. Available online: http://www.stats.ox.ac.uk/~snijders/siena/OneSidedNetDyn.pdf (accessed on 4 August 2020).
- Zhang, S.; Fuellhart, K.; Wang, Y.; Wu, W.; Zhu, J.; Witlox, F. Congestion spillover effects of Chinese hub airports on international connecting traffic. Transp. A Transp. Sci. 2019, 15, 1339–1359. [Google Scholar] [CrossRef]
Figure 1.
Airport location and hierarchy of CATN (China’s domestic air transport network).


Table 1.
Literature overview of airport hierarchy of CATN.
| Author Name | Indicators | # Clusters | # Airports | Airport IATA Code | ||||
|---|---|---|---|---|---|---|---|---|
| First Tier | Second Tier | Third Tier | Fourth Tier | Fifth Tier | ||||
| Mo et al. [10] | Network centrality | 3 | 146 | 4 *: PEK, PVG, SHA, CAN | 5: SZX, KMG, CTU, XIY, CKG | 137: Others | ||
| Ding et al. [13] | Integrated transport hubbing | 4 | 42 | 4: PEK, PVG, SHA, CAN | 7: KMG, CTU, XIY, WUH, CKG, SHE, URC | 15: TSN, CGO, NKG, HGH, HRB, and another 10 airports | 17: SJW, TYN, FOC, HFE, HAK, and another 12 airports | |
| Zhang et al. [12] | Connectivity | 3 | 69 | 3: PEK, PVG, CAN | 5: SZX, KMG, CTU, XIY, SHA | 40: CGO, HGH, URC, XMN, HRB, and another 35 airports | 21: JJN, NAY, BAV, XUZ, and another 17 airports | |
| O’Connor et al. [11] | Airline supply and competition | 3 | 37 | 3: PEK, PVG, SHA, CAN | 5: SZX, KMG, CTU, XIY, CKG | 18: HGH, WUH, CSX, TAO, and another 14 airports | 15: CGQ, KHN, LHW, HET, HFE, and another 10 airports | |
| This paper | Changes in population and enplanements | 5 | 127 | 3: PEK, PVG, CAN | 7: SZX, KMG, CTU, XIY, CKG, HGH, SHA | 13: NKG, WUH, TSN, XMN, CGO, and another 8 airports | 16: KWE, TNA, NNG, LHW, FOC, and another 11 airports | 88: WUX, YNT, XNN, JJN, SWA, and another 83 airports |
* The value represents the number of airports included in a particular cluster. Note: CAN: Guangzhou; CTU: Chengdu; CKG: Chongqing; CGO: HGH: Hangzhou; CGQ: Changchun; CSX: Changsha; FOC: Fuzhou; HAK: Haikou; HET: Hohhot; HFE: Hefei; HRB: Harbin; JJN: Quanzhou; KHN: Nanchang; KMG: Kunming; KWE: Guiyang; LHW: Lanzhou; NKG: Nanjing; PEK: Beijing Capital; PVG: Shanghai Pudong; SHA: Shanghai Hongqiao; SHE: Shenyang; SJW: Shijiazhuang; SZX: Shenzhen; Zhengzhou; TNA: Jinan; TSN: Tianjin; TYN: Taiyuan; URC: Urumqi; WUH: Wuhan; XIY: Xi’an; XMN: Xiamen; XNN: Xining.
Table 2.
Descriptive network statistics and tie changes between 2011 and 2017.
| Statistic | 2011 | 2017 |
|---|---|---|
| Number of airports | 127 | 127 |
| Density | 0.048 | 0.069 |
| Average degree | 6.079 | 8.701 |
| Existing ties | 772 | 1105 |
| Changes | ||
| Jaccard index | 0.439 | |
| No tie: 0 → 0 | 14698 | |
| New tie: 0 → 1 | 532 | |
| Broken tie: 1 → 0 | 199 | |
| Maintained tie: 1 → 1 | 573 | |
Table 3.
The changes of CATN based on airport hierarchy.
| Airport Hierarchy | Airport Number | Number of Routes Per Airport | Share of Number of Routes Per Airport | ||||
|---|---|---|---|---|---|---|---|
| 2011 | 2017 | Change (%) | 2011 | 2017 | Change (%) | ||
| First Tier | 3 | 63 | 66 | 4.8 | 40.2 | 34.1 | −15.2 |
| Second Tier | 7 | 42 | 54 | 28.6 | 27.0 | 28.1 | 4.1 |
| Third Tier | 13 | 27 | 38 | 40.7 | 17.5 | 20.0 | 14.3 |
| Fourth Tier | 16 | 21 | 29 | 38.1 | 13.6 | 15.0 | 10.3 |
| Fifth Tier | 88 | 3 | 5 | 66.7 | 1.7 | 2.8 | 64.7 |
| Total | 127 | 156 | 193 | 23.7 | 100.0 | 100.0 | 0.0 |
Table 4.
The changes of CATN based on distance range.
| Distance Type (km) | Number of Routes | Share of Number of Routes | ||||
|---|---|---|---|---|---|---|
| 2011 | 2017 | Change (%) | 2011 | 2017 | Change (%) | |
| <=1000 | 330 | 408 | 23.6 | 42.7 | 36.9 | −13.6 |
| 1001–2000 | 363 | 551 | 51.8 | 47.0 | 49.9 | 6.0 |
| >2000 | 79 | 146 | 84.8 | 10.2 | 13.2 | 29.1 |
| Total | 772 | 1105 | 43.1 | 100.0 | 100.0 | 0.0 |
Table 5.
The changes of CATN based on low-cost carrier (LCC) and high-speed rail (HSR).
| Route Type | Number of Routes | Share of Number of Routes | ||||
|---|---|---|---|---|---|---|
| 2011 | 2017 | Change (%) | 2011 | 2017 | Change (%) | |
| Routes served only by LCC | 2 | 0 | −100.0 | 0.3 | 0.0 | −100.0 |
| Routes served only by HSR | 310 | 764 | 146.5 | 40.2 | 69.1 | 72.2 |
| Routes served by both LCC and HSR | 36 | 107 | 197.2 | 4.7 | 9.7 | 107.7 |
| Others | 426 | 234 | −45.1 | 55.2 | 21.2 | −61.6 |
| Total | 772 | 1105 | 43.1 | 100.0 | 100.0 | 0.0 |
Table 6.
Simulation results.
| Parameters | Mode1 | Mode2 | Mode3 | Mode4 | Mode5 | Model6 | Mode7 |
|---|---|---|---|---|---|---|---|
| Rate parameter | 10.374 *** (0.547) | 10.095 *** (0.532) | 10.039 *** (0.511) | 9.242 *** (0.470) | 9.257 *** (0.474) | 11.589 *** (0.595) | 11.684 *** (0.604) |
| Outdegree (density) | −0.967 *** (0.233) | −0.961 *** (0.156) | −0.955 *** (0.216) | −0.885 *** (0.255) | −0.890 *** (0.258) | 0.407 (0.332) | 0.358 (0.349) |
| Transitive triplets | 0.204 *** (0.065) | 0.209 *** (0.039) | 0.212 *** (0.068) | 0.255 *** (0.081) | 0.255 *** (0.062) | 0.054 *** (0.019) | 0.054 *** (0.020) |
| Betweenness | −0.102 (0.11) | −0.092 (0.056) | −0.086 (0.097) | −0.096 (0.122) | −0.096 (0.154) | −0.272 *** (0.049) | −0.269 *** (0.053) |
| NbrDist2 | −0.129 * (0.075) | −0.139 *** (0.036) | −0.151 ** (0.074) | −0.160 ** (0.080) | −0.159 (0.108) | −0.091 *** (0.022) | −0.092 *** (0.021) |
| DistanceMedium | −0.554 * (0.332) | −0.443 (0.305) | −0.502 (0.349) | −0.391 (0.371) | −0.765 * (0.450) | −0.754 * (0.419) | |
| DistanceLong | −0.142 (0.497) | −0.167 (0.635) | −0.606 (0.696) | −0.552 (0.587) | −1.604 ** (0.740) | −1.605 ** (0.695) | |
| LCC | −1.550 *** (0.438) | −1.522 *** (0.568) | −2.395 *** (0.857) | −3.523 *** (0.818) | −3.388 *** (0.947) | ||
| HSRBothEnds | −1.362 *** (0.349) | −1.512 ** (0.641) | −3.457 *** (1.032) | −3.165 *** (0.739) | |||
| LCC*HSRBothEnds | 1.388 (0.855) | 2.169 * (1.117) | 2.139 ** (0.975) | ||||
| FirstTier ego | 5.226 *** (1.297) | 5.190 *** (1.226) | |||||
| SecondTier ego | 6.968 *** (1.505) | 6.797 *** (1.616) | |||||
| ThirdTier ego | 5.154 *** (0.984) | 5.050 *** (1.061) | |||||
| FourthTier ego | 3.871 *** (0.769) | 3.720 *** (0.708) | |||||
| GrowingAirports ego | 0.508 * (0.269) | ||||||
| EmergingIntegratedNodes ego | 0.158 (0.167) | ||||||
| Score-type tests | 4.600 * df = 2 | 15.797 *** df = 1 | 12.490 *** df = 1 | 1.303 df = 1 | 4076.540 *** df = 4 | 5.059 * df = 2 | |
| Wald-type tests | 4.011 df = 2 | 8.055 *** df = 1 | 13.413 *** df = 1 | 1.726 df = 1 | 31.737 *** df = 4 | 5.000 * df = 2 | |
| Overall maximum convergence ratio | 0.126 | 0.105 | 0.071 | 0.115 | 0.150 | 0.170 |
Notes: Standard errors are within parentheses. *** , ** , * .
Table 7.
Number of routes linked with Spring Airlines’ focus cities (2011 and 2017).
| Airport Code | 2011 | 2017 | Difference |
|---|---|---|---|
| SJW | 7 | 25 | 18 |
| PVG | 7 | 19 | 12 |
| LHW | 0 | 9 | 9 |
| CGQ | 0 | 9 | 9 |
| SHE | 6 | 14 | 8 |
| NGB | 0 | 6 | 6 |
| SHA | 16 | 21 | 5 |
| BHY | 0 | 4 | 4 |
| Total | 38 | 107 | 69 |
Note: BHY: Beihai; CGQ: Changchun; LHW: Lanzhou; NGB: Ningbo; PVG: Shanghai Pudong; SHA: Shanghai Hongqiao; SHE: Shenyang; SJW: Shijiazhuang.
© 2020 by the authors. Licensee MDPI, Basel, Switzerland. This article is an open access article distributed under the terms and conditions of the Creative Commons Attribution (CC BY) license (http://creativecommons.org/licenses/by/4.0/).
Share and Cite
MDPI and ACS Style
Zhang, S.; Hu, Y.; Tang, X.; Fuellhart, K.; Dai, L.; Witlox, F. Modeling the Evolutionary Mechanism of China’s Domestic Air Transport Network. Sustainability 2020, 12, 6295. https://doi.org/10.3390/su12166295
AMA Style
Zhang S, Hu Y, Tang X, Fuellhart K, Dai L, Witlox F. Modeling the Evolutionary Mechanism of China’s Domestic Air Transport Network. Sustainability. 2020; 12(16):6295. https://doi.org/10.3390/su12166295
Chicago/Turabian StyleZhang, Shengrun, Yue Hu, Xiaowei Tang, Kurt Fuellhart, Liang Dai, and Frank Witlox. 2020. "Modeling the Evolutionary Mechanism of China’s Domestic Air Transport Network" Sustainability 12, no. 16: 6295. https://doi.org/10.3390/su12166295
Note that from the first issue of 2016, this journal uses article numbers instead of page numbers. See further details here.