The Impact of High-Speed Railways on Unequal Accessibility Based on Ticket Prices in Korea


1
The Korea Transport Institute, Sejong 30147, Korea
2
Department of Saemaul Studies and International Development, Yeungnam University, Gyeongsan 38541, Korea
*
Author to whom correspondence should be addressed.
Sustainability 2020, 12(16), 6302; https://doi.org/10.3390/su12166302
Submission received: 11 July 2020
/
Revised: 2 August 2020
/
Accepted: 3 August 2020
/
Published: 5 August 2020
(This article belongs to the Section Sustainable Urban and Rural Development)
Abstract
:The high-speed railway (HSR) has affected accessibility at diverse spatial levels. Although previous studies have examined HSR impacts on accessibility and inequality, the price attribute in estimating accessibility is less noted. This study evaluates the effects of HSR on unequal accessibility at the South Korean national level, capital and non-capital regions and according to urban population sizes by comparing ticket prices to time values. There are two major conclusions of this study. First, an increase in time value through national growth or other exogenous conditions maximizes HSR impact and, thus, increases accessibility. For example, when the time value is 9.98 USD/h, the national HSR access inequality is reduced by 0.56%. However, when the time value is 6.02 USD/h, the reduction in the national inequality by the HSR is 0.19%. Second, if considering generalized travel time, HSR impact is maximized in medium cities rather than in large cities. When the time value is 6.02 USD/h (or 9.98 USD/h), the change in inequality between cities is −0.4% (−1.29%) in medium cities, while large cities show a −0.08% (−0.9%) reduction in access inequality.
1. Introduction
High-speed railways (HSR) are more time-efficient than conventional railways. HSR specializes in intercity passenger transport, bringing about various changes in the socioeconomic environment. One of the significant contributions of HSR is enhanced accessibility by reducing travel time and cost [1] for intercity travel. Accessibility is an essential attribute of regions [2] that changes land use [2], attracts economic activities [3,4] and brings about economic agglomeration [5,6]. Accessibility related to the socioeconomic environment can be discussed as a national inequality issue. National inequality concerns sustainable development at the regional, capital and non-capital regions and national levels. On one hand, if HSR aggravates national accessibility, it results in unbalanced spatial development. On the other hand, each region can be uniformly accessible to other regions if the HSR can address the inequality problem. In this discussion, first, the notions of accessibility and spatial equity are defined.
Accessibility by HSR can be defined as the ease of reach to other locations and services from a particular location [4,7,8,9,10,11], by a reduction of travel time through HSR networks [1]. The ease of reach in HSR travel is a combination of “to HSR stations” and “to other regions and services through HSR” [12]. Accessibility can explain the impact of new transportation infrastructures on the socioeconomic environment; however, the impacts are not equal across all cities and regions [13,14]. This inequality is due to limited HSR benefits in some regions, even if there are effects on cities without HSR [1,13]. The spatially unequal HSR impact is relevant to the inequality problem.
Although HSR impact may be distributed across cities and regions, it can also polarize certain regions. For example, wealthy socioeconomic regions benefit by being connected to major cities through HSR to maximize cost-efficiency. In contrast, underdeveloped regions may suffer recession due to isolation from HSR operation [14,15]. Accessibility signifies whether potential interaction has been distributed across various cities by reducing inequality between regions. In order to evaluate the accessibility, it is crucial to take into account destination attractiveness, spatial scale and travel decay [16,17]. The degree of unequal accessibility may vary across each spatial coverage. For example, even if inequality becomes severe between the capital and non-capital regions due to the introduction of a new HSR line, inequality at the national level may be alleviated.
Considering railway transportation, HSR is much faster than conventional railways. After the HSR opened in South Korea, people used it, instead of conventional railways, for travel between the capital and two metropolitan cities (Daegu (289 km) and Busan (400 km)) [18]. However, full HSR fares are more expensive than conventional railway fares so that the HSR may be less attractive to low-income people and for short-distance travel. From this perspective, the HSR inequality issue is connected to fares, demands and time values, which are related to passenger economic conditions [13,19]. Therefore, to evaluate HSR impacts on accessibility and inequality, it is necessary to consider the ticket price based on time value.
This study aims at estimating HSR impact on accessibility across diverse dimensions: at the national level, between cities with and without HSR, between the capital and non-capital regions and urban population scales. In estimating travel time, we utilize two measurement factors: travel time by transportation type and the time/fare value of each. The travel time compared to the ticket price resulting in the time value is expressed as the generalized travel time, which can prevent the overestimation of HSR impacts resulting from only considering a reduction in travel time. Further comparing different territorial inequalities such as the capital and non-capital regions can identify which territorial and socioeconomic urban attributes are sensitive to HSR operations. To achieve the research aim, we compare accessibility and inequality in two scenarios from 2018 data: with HSR networks (S1) and without HSR networks (S0). As for spatial coverage, we analyze the Korea train eXpress (KTX), which is the HSR of South Korea.
There are three major conclusions of this study. First, at the national level, HSR operation contributes to reducing inequality, regardless of ticket prices. Second, our results suggest that HSR impact on accessibility may be overestimated if ticket prices are not considered in estimating generalized travel time. The mean HSR accessibility change is +17.83% if there is no consideration for ticket prices. However, when the time value is 6.02 USD/h (or 9.98 USD/h), the mean accessibility increase is only 0.33% (1.23%). Last, when comparing pre and post HSR, inequality change is higher in medium cities. Inequality change between large cities is −0.08% (−0.9%) when the time value is 6.02 USD/h (9.98 USD/h). However, the change is −0.4% (−1.29%) in medium cities. This result suggests that HSR impact is maximized in medium cities compared to large cities.
In Chapter 2, we discuss HSR impact on accessibility and issues of inequality. Chapter 3 introduces the methodology and Chapter 4 shows the analysis results. Chapter 5 draws significant conclusions and recommends future directions.
2. Literature Review
2.1. High-Speed Rail and Regional Development
The opening of HSR lines necessarily affects national and regional development by reducing travel time between regions. A high-speed railway is for passenger transportation, so HSR impact originates from travel purpose and behavior. HSR operation triggers urban development near station areas and whole regions since HSR stations may become urban centers. A reduction in travel time by HSR contributes to interactions between companies, people and regions. Therefore, HSR impact is related to various socio-economic factors, such as accessibility, productivity, employees, economic agglomeration, land-use, travel behavior, etc. The relationship between the HSR and socioeconomic factors is interrelated in a dynamic urban structure.
We can find previous studies that have examined HSR impact on various socioeconomic factors using several distinctive models:
Hiramatsu (2018) [20] examined tourism impact of HSR on productivity in Japan. The author proposed that HSR impact can spread out to adjacent regions. HSR travelers consume products provided by adjacent prefectures. This supply chain from adjacent prefectures indicates an extensive indirect HSR impact. Therefore, regional economic inequality may be reduced by a spillover effect as non-HSR cities can benefit from HSR networks.
Jiang and Kim (2016) [21] proposed HSR impact on regional income inequality by using a convergence model in China and South Korea. The authors found that HSR networks reduced regional income disparity in both countries. However, the negative HSR impact on regional accessibility may differ according to the measurements and factors considered.
Jin et al. (2017) [22] employed daily accessibility and weighted average travel-time indicators to evaluate accessibility in China, Japan, Korea and Taiwan. The authors proposed that HSR networks increase time–space convergence by enhancing accessibility. They also pointed out that HSR will increase unequal accessibility in China and decrease the regional disparity in Japan, South Korea and Taiwan.
These previous studies evaluated HSR impact by considering various socioeconomic factors. However, HSR impact on regional development is much more complicated.
A primary goal of expanding HSR networks is to reduce travel time between regions, to address an imbalance of movement. Then the opening of HSR lines, directly and indirectly, triggers knock-on effects on urban socio-economic conditions at the national and regional levels. Chen and Haynes (2017) [23] proposed a conceptual framework explaining how HSR affects regional disparities. According to the authors’ framework, HSR development changes accessibility, connectivity and transport cost. The changes affect information dissemination, market access, capital and labor mobilities and productivity, which increase the return to scale for agglomeration and spillover. Then HSR operation finally creates regional convergence and divergence. Chen and Silva (2013) [24] showed the relationship between HSR and regional development. Their conceptual framework also emphasized an increase in regional accessibility through HSR. An increase in accessibility attracts new households, firms and activities, which attracts more regional investment. An increase in firms and households represent an increase in labor demand and supply, which again leads to growth in regional employment. The relationship between accessibility, investment and growth in employment connects to regional production. In the process, attracting households and firms results in a change in land-use and spatial patterns. Sasaki et al. (1997) [25] proposed the model to examine HSR impact on regions. The authors’ model considers the accessibilities of Shinkansen, expressway and ordinary roads. A change in accessibilities leads to regional private investment. The regional private investment connects to regional private capital stock, then to regional and national products. The change in accessibility also affects regional population, which is related to regional labor supply. The authors’ approach mainly centers on HSR accessibility, population and a supply oriented regional econometric model.
HSR openings inevitably change land development near station areas as well as for whole cities. Shen et al. (2015) [26] assumed a future HSR opening in the Lisbon metropolitan area and examined potential impact on urbanization. The authors employed a bi-level spatial structure at local and regional levels. They assumed that an HSR opening would affect accessibility at all focus levels. First, an increase in regional accessibility attracts firms and population which are distributed at the local spatial level. GDP also affects regional firms and population. A change in the local population and number of firms influences urbanization. Second, an increase in local accessibility resulting from public transport and road networks directly changes land development. Changes in land development affect regional firms and population; then, this framework is iterated. Their result proposes that land development is faster in scenarios with HSR operation than without, even if the non-HSR scenario also shows land development. Although there are no HSR networks in Portugal, their result proposes HSR impact on land development through increases in accessibility, firms and population in a dynamic urban structure.
Land development can be expressed as land trading and price. Low and Lee (2020) [27] focused on HSR impact on land price with consideration for various socioeconomic factors in Taiwan. HSR impact on land prices followed knock-on effects such as HSR station > accessibility > population > population density > infrastructure > land prices. Accessibility also raised investment opportunities, and an increase in investment also attracted companies. Economic growth started from HSR accessibility, which ultimately increased land prices. They further shed light on the fact that HSR stations contributed to increases in land prices in the multivariate model.
Rungskunroch et al. (2020) [28] also evaluated HSR impact on the volume of trading and average property price in the Minhang district of the Shanghai region in China. They proposed that land prices in China are not affected by HSR services since it is controlled by the government. Instead, the authors verified that HSR services affected the trading value of land use. However, their model did not consider other socioeconomic factors, and the spatial target of the study was confined to a specific district. If considering other factors and broader spatial targets, HSR impact on the trading value of land use would be more distinct.
The main HSR impact is to reduce travel time. The HSR impact on travel time is expressed as accessibility. According to the previous frameworks, the impact of HSR on accessibility is connected to various socioeconomic factors in a reiterated influencing relationship. In the urban dynamic structure, an increase in accessibility by HSR results in knock-on effects. The knock-on effects started from accessibility connect to regional development, which can be proxied by population, employees, product and land development. These knock-effects vary depending on a region since the impact of HSR depends on socioeconomic conditions. Some regions are sensitive to HSR networks while some others are insensitive to an introduction of HSR. Therefore, the HSR impact on accessibility is unequal across regions and socioeconomic characteristics.
2.2. Accessibility and Inequality through HSR Networks
HSR impact on accessibility has been one of the key issues of how HSR affects socioeconomic conditions. The HSR impact on socioeconomic conditions results from the reduction in travel times, leading to a change in accessibility [9]. Among diverse accessibility measurement factors, two are common: ease of access to other regions and attractiveness of the region [13,29]. They are expressed as weighted average travel time (WATT) and potential accessibility (PA), respectively. WATT considers attractiveness as a weight to measure the average travel time from one region to all other regions. WATT does not include distance-decay (or travel-decay), so it emphasizes minimal-time through the transportation network [9]. PA refers to the economic potential of a region, which shows the volume of socioeconomic activities under travel cost-payment [30]. PA is based on a gravity model with distance-decay and specializes in measuring the volume of attractiveness from a certain region [9]. In both WATT and PA, attractiveness refers to a socioeconomic mass of the destination, such as population, employees and productivity.
PA has been widely used in previous studies [9,16,31,32,33,34,35,36,37] for evaluating economic potential by elucidating the interaction potential between regions [38] from a socioeconomic viewpoint. The notion of accessibility in this study is the potential interaction between regions based on the concept of Hansen (1959) [38]. An increase in accessibility represents a reduction in time–space friction; therefore, the interaction between regions and firms connected by HSR can be strengthened [3]. Improved transportation networks by HSR allow for specialization of the economies of scale, which implies urban agglomerations and ease of access to major cities [9]. PA can be calculated as follows:
In Equation (1), and denote regions and represents the attractiveness of region . The denominator shows travel cost between and . The PA, therefore, depends on the attractiveness of the destination along with travel-decay.
The issue of inequality through accessibility has been discussed in previous studies [9,13,14,39,40]. One of the measures to evaluate the inequality of a variable is the coefficient of variation (CV). CV is expressed as the standard deviation divided by the mean; this measure better addresses the right-hand tail of distribution than the Gini-coefficient [41]. To evaluate the unequal accessibility by HSR, previous studies have utilized CV, especially the weighted average version [13,14,39]:
In Equation (2), is the standard deviation of PA, and is the attractiveness of region . A difference between CV values in different scenarios can explain whether the unequal accessibility decreases (a reduction in the CV) or increases (an increase in the CV).
Comparing CV values of scenarios with and without HSR can explain HSR impact on accessibility. Gutiérrez (2001) [9] analyses impact for the Madrid–Barcelona–French border HSR line by using three accessibility measurements. The author analyzed accessibility at the European, Spanish and corridor regions, respectively. The results in the European and corridor regions showed a reduction in unequal accessibility, while inequality in the Spanish region became severe. This result illustrates that even if HSR impact is negative at one spatial level, inequality between cities may change when considering different spatial coverage. Although the Madrid–Barcelona–French border HSR line may exacerbate inequality at the national level, Monzón et al. (2013) [40] observed a positive impact of the HSR network at the national level in Spain. The authors compared variations in unequal accessibility between scenarios with and without HSR. The authors proposed that a radial extension of the HSR network contributed to reducing inequality, even if there is an increase in inequity in some cities. In the case of South Korea, Kim and Sultana (2015) [13] also employed WATT and PA to evaluate a change in accessibility by dividing the HSR opening into three stages. The authors proposed that the different HSR openings resulted in a varied HSR impact on inequality at each stage. At the initial stage, efficient HSR operation was emphasized;, but later stages centered more on spatial equity. Polarized HSR effects were also observed: an advantage for the Gyeongbu HSR corridor and a disadvantage for the northeast and southwest regions of Korea.
These previous studies focused on variation in accessibility through HSR networks. However, they only employed travel time, without considering HSR fares. When evaluating inequality through HSR networks, fares should also be considered. If not, HSR impact may be overestimated.
HSR is generally operated on newly constructed or upgraded railways, so HSR fares are more expensive than conventional railways. Even if the HSR reduces travel times, its comparatively more expensive fare may become an obstacle in converting conventional railway passengers into HSR passengers. This tendency is much stronger in countries with small land areas that have price-competitive transportation modes, such as intercity buses, cars and conventional railways. Income status also affects HSR travel [19]. For example, HSR ticket prices may hamper commuters in Spain [42]. In Taiwan, considering cost-efficiency between the HSR and intercity buses, intercity bus passengers use the HSR less due to price sensitivity [43]. This sensitivity is much stronger if the national land area is small. Therefore, due to the competitive relationship between HSR and other transportation modes, it is necessary to consider ticket prices based on the value of time while evaluating accessibility.
Previous studies have focused on HSR impact on unequal accessibility. Unequal accessibility can differ according to the spatial coverage of the analysis; for instance, at the national, corridor and international levels. HSR impact can be concentrated in specific metropolitan areas at the initial stage of operation to achieve cost-efficiency. However, HSR networks can also mitigate territorial access imbalance. Previous studies mainly centered on travel time and travel costs in evaluating accessibility, even if HSR competes with conventional railways in time and cost-efficiency. Therefore, in this study, we emphasize two points in analyzing HSR impact on territorial accessibility: different spatial coverage and HSR fares based on time value. For intercity transportation, we only use HSR and conventional railways.
There are various measurements, models and data to evaluate accessibility and inequality. However, PA and CV are a traditionally popular measurement since they are easy to interpret the results. Additionally, we utilize population as a measure of attractiveness in this study. The population size represents attractiveness, thus indicating market potential. Although the measurements in itself may be relatively simple, we further consider ticket prices based on time values.
3. Methodology
3.1. Accessibility Estimation
In estimating accessibility, this study utilizes PA, as shown in Equation (1). For travel costs, we employ travel time between the population-weighted centroids of origin and destination.
For intercity transportation, we assume two transportation modes: HSR and conventional railway. In calculating interregional travel time, it is necessary to consider the intraregional travel time as well as travel time from departure to arrival stations. Although we use two transportation modes for intercity travel, car travel is additionally included only for intraregional travel time and travel time from departure to arrival. The fastest travel time () is the minimum travel time for HSR travel () and conventional railway travel (). This comparison emphasizes the importance of high-speed travel through HSR, compared to conventional railway. Both and are calculated through the summation of intraregional travel time () by car, travel time from the centroid to the HSR station () by car and travel time by HSR or conventional railway (). To estimate travel time, we utilize the road, conventional railway and HSR networks. The transportation network data provide the maximum speed attribute for each segment, which is used to calculate the travel time for each transportation mode. If there is no available maximum speed attribute information in the road network, we assume the maximum speed at 30 km/h. Not considering intraregional travel time may underestimate large and major cities [36,44]; therefore, we consider intraregional travel time by assuming a circular land area of each city [36,45], as follows:
In Equation (4), is the land area and is the circular constant. To emphasize the importance of urban centers, it is multiplied by 1/2. The average speed by car () is assumed to be 30 km/h. Self-potential is important in estimating potential interaction since it constitutes a large portion of total potential interaction [46]. In estimating self-potential, is expressed as , when origin () and destination () are the same. Travel time between stations as well as between station and centroid is calculated by GIS software; then, we choose the fastest travel time among all pairs of departure stations, travel between stations and arrival stations.
In evaluating PA, travel-decay generally takes a power function and an exponential function [3,47,48]. The exponential function is used in explaining the international and national levels, whereas the power function is appropriate for short travel [49]. This study utilizes the exponential function in estimating accessibility, as shown in Equation (5). In Equation (5), is the travel decay coefficient and is assumed to have a value of one [9,13].
The PA in Equation (5) is based on travel time, without considering HSR ticket prices. However, this study further considers the generalized travel cost, which is the sum of the ticket price of transportation based on the value of time. The generalized travel cost is expressed as a monetary value; however, we convert this into travel time in minutes to emphasize HSR impact in reducing travel time. Therefore, the generalized travel time () is the generalized travel cost expressed in time; that is, the total travel cost is a summation of net travel time () and the transportation fare converted into time in minutes (). In Equation (6), is the transportation fare of converted into time and * denotes the value of time.
Travel time is calculated using GIS networks, so the actual ticket price between stations cannot be directly applied in . Instead, a ticket price is calculated based on the distance of each transportation mode in since charges of the conventional railway and HSR in Korea are proportional to distance. In this study, conventional railway and HSR are based on the Korean Mugunghwa train and Korea train eXpress (KTX), respectively. Our methodology provides the minimum travel time, but not travel distance for the minimum travel time. To calculate travel distance, we convert into the distance by using the scheduled time for each transportation mode, assuming speeds of 95 km/h for the conventional railway and 150 km/h for HSR. In the case of car-driving, we assume a speed of 30 km/h. By using the converted distance, we estimate travel costs between two cities and . In the case of the conventional railway, the basic fare is 1600 KRW (about 1.28 USD, KRW:USD = 1250:1) until 40 km and 64.78 KRW/km (about 0.05 USD) is added after the first 40 km. For HSR, the basic fare is 8400 KRW (about 6.72 USD) until 50 km in the high-speed track and 164.41 KRW/km (0.13 USD) is added after the first 50 km. The fuel efficiency by car is assumed as 16.5 km/L and 1562.5 KRW/L (1.25 USD/L).
Each transportation fare must be converted into time to derive the generalized travel time. is the transportation fare divided by the value of time (*). We utilize two types of value of time in South Korea: minimum wages (7530 KRW per hour in 2018, about 6.02 USD/h) and average annual salary (36.34 million KRW in 2018, about 9.98 USD/h). The PA estimation using is expressed in Equations (7) and (8). To distinguish Equation (3) from Equation (7), the former is named as the fastest travel time and the latter as generalized travel time in this study. implies using generalized travel time (*). and denote , using minimum wage and average salary, respectively.
3.2. Inequality Evaluation
To examine variations in accessibility through HSR, we compare two scenarios: with the HSR network (S1) and without (S0). The former utilizes Equation (3), while the latter only uses . By comparing CV values between two scenarios as shown in Equation (2), we can determine the HSR contribution to unequal accessibility.
An increase in the CV means severe inequality, while a decrease in the CV represents that HSR alleviates unequal accessibility. However, changes in the CV may be observed depending on the spatial coverage and control group of the CV value. For example, a change in the CV value at the national level may be invalid between cities with and without HSR. The capital region may show a different change in the CV, compared to the non-capital regions. Therefore, we further examine variations in the CV value at the national level, capital and non-capital regions, cities with and without HSR and for urban population size.
3.3. Spatial Coverage and the High-Speed Rail Network of South Korea
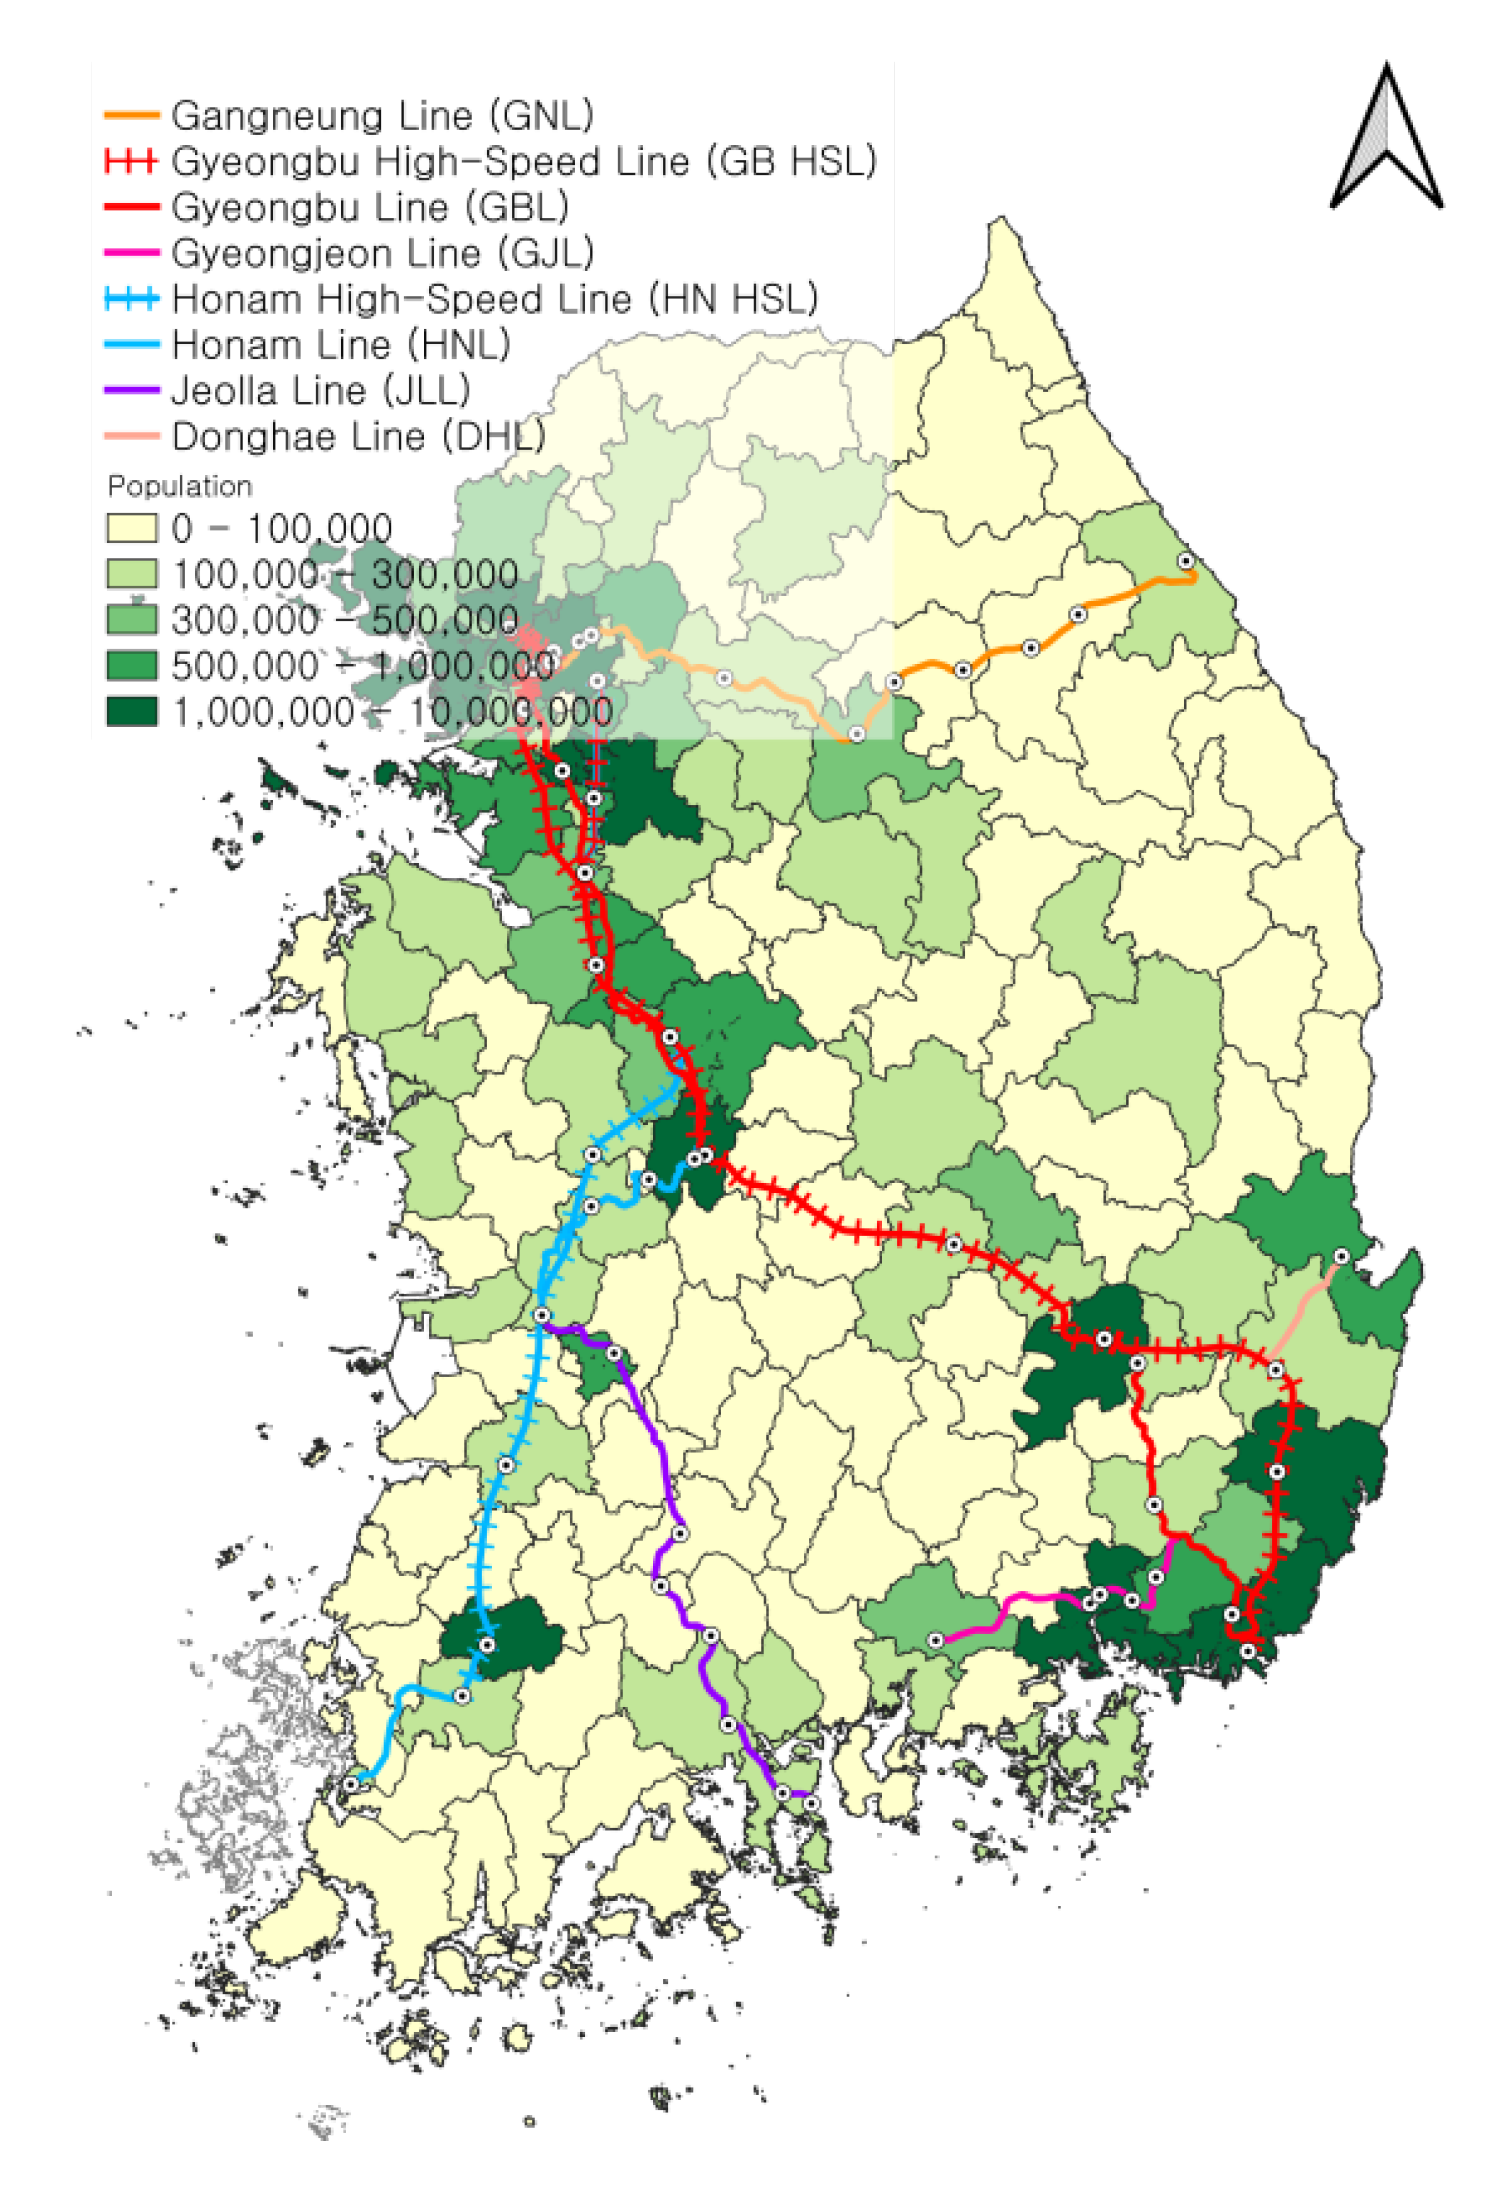
This study centers on KTX, the HSR network of Korea. The first HSR opened in Korea in 2004; then, additional HSR corridors continued to open until now. The HSR, railway and road networks are based on 2018 data. The Korean HSR network is shown in Figure 1. The KTX operates on both high-speed (xx high-speed line) and upgraded conventional (xx Line) tracks. The Gyeongbu high-speed line (GB HSL) and Honam HSL (HN HSL) operate at a speed of more than 300 km/h and the upgraded conventional lines operate from 180–250 km/h. However, the scheduled time is quite slow, around 120–180 km/h, due to many HSR stations and limitations in the upgraded conventional lines. The HSR network of this study includes both high-speed and upgraded conventional lines. The area where the HSR stations are densely concentrated in Figure 1 is the Seoul metropolitan area (SMA), the capital region of South Korea. The major HSR lines are GB HSL and HN HSL, which connect major local municipalities to the SMA. This study focuses on 158 cities: 150 municipalities (cities and counties), six metropolitan cities, one special city and one special autonomous city. However, in this analysis, the counties of Shinan and Ulleung, as well as Jeju and Seogwipo cities, are excluded consisting of numerous unconnected islands far from the mainland.
4. Results
4.1. Accessibility
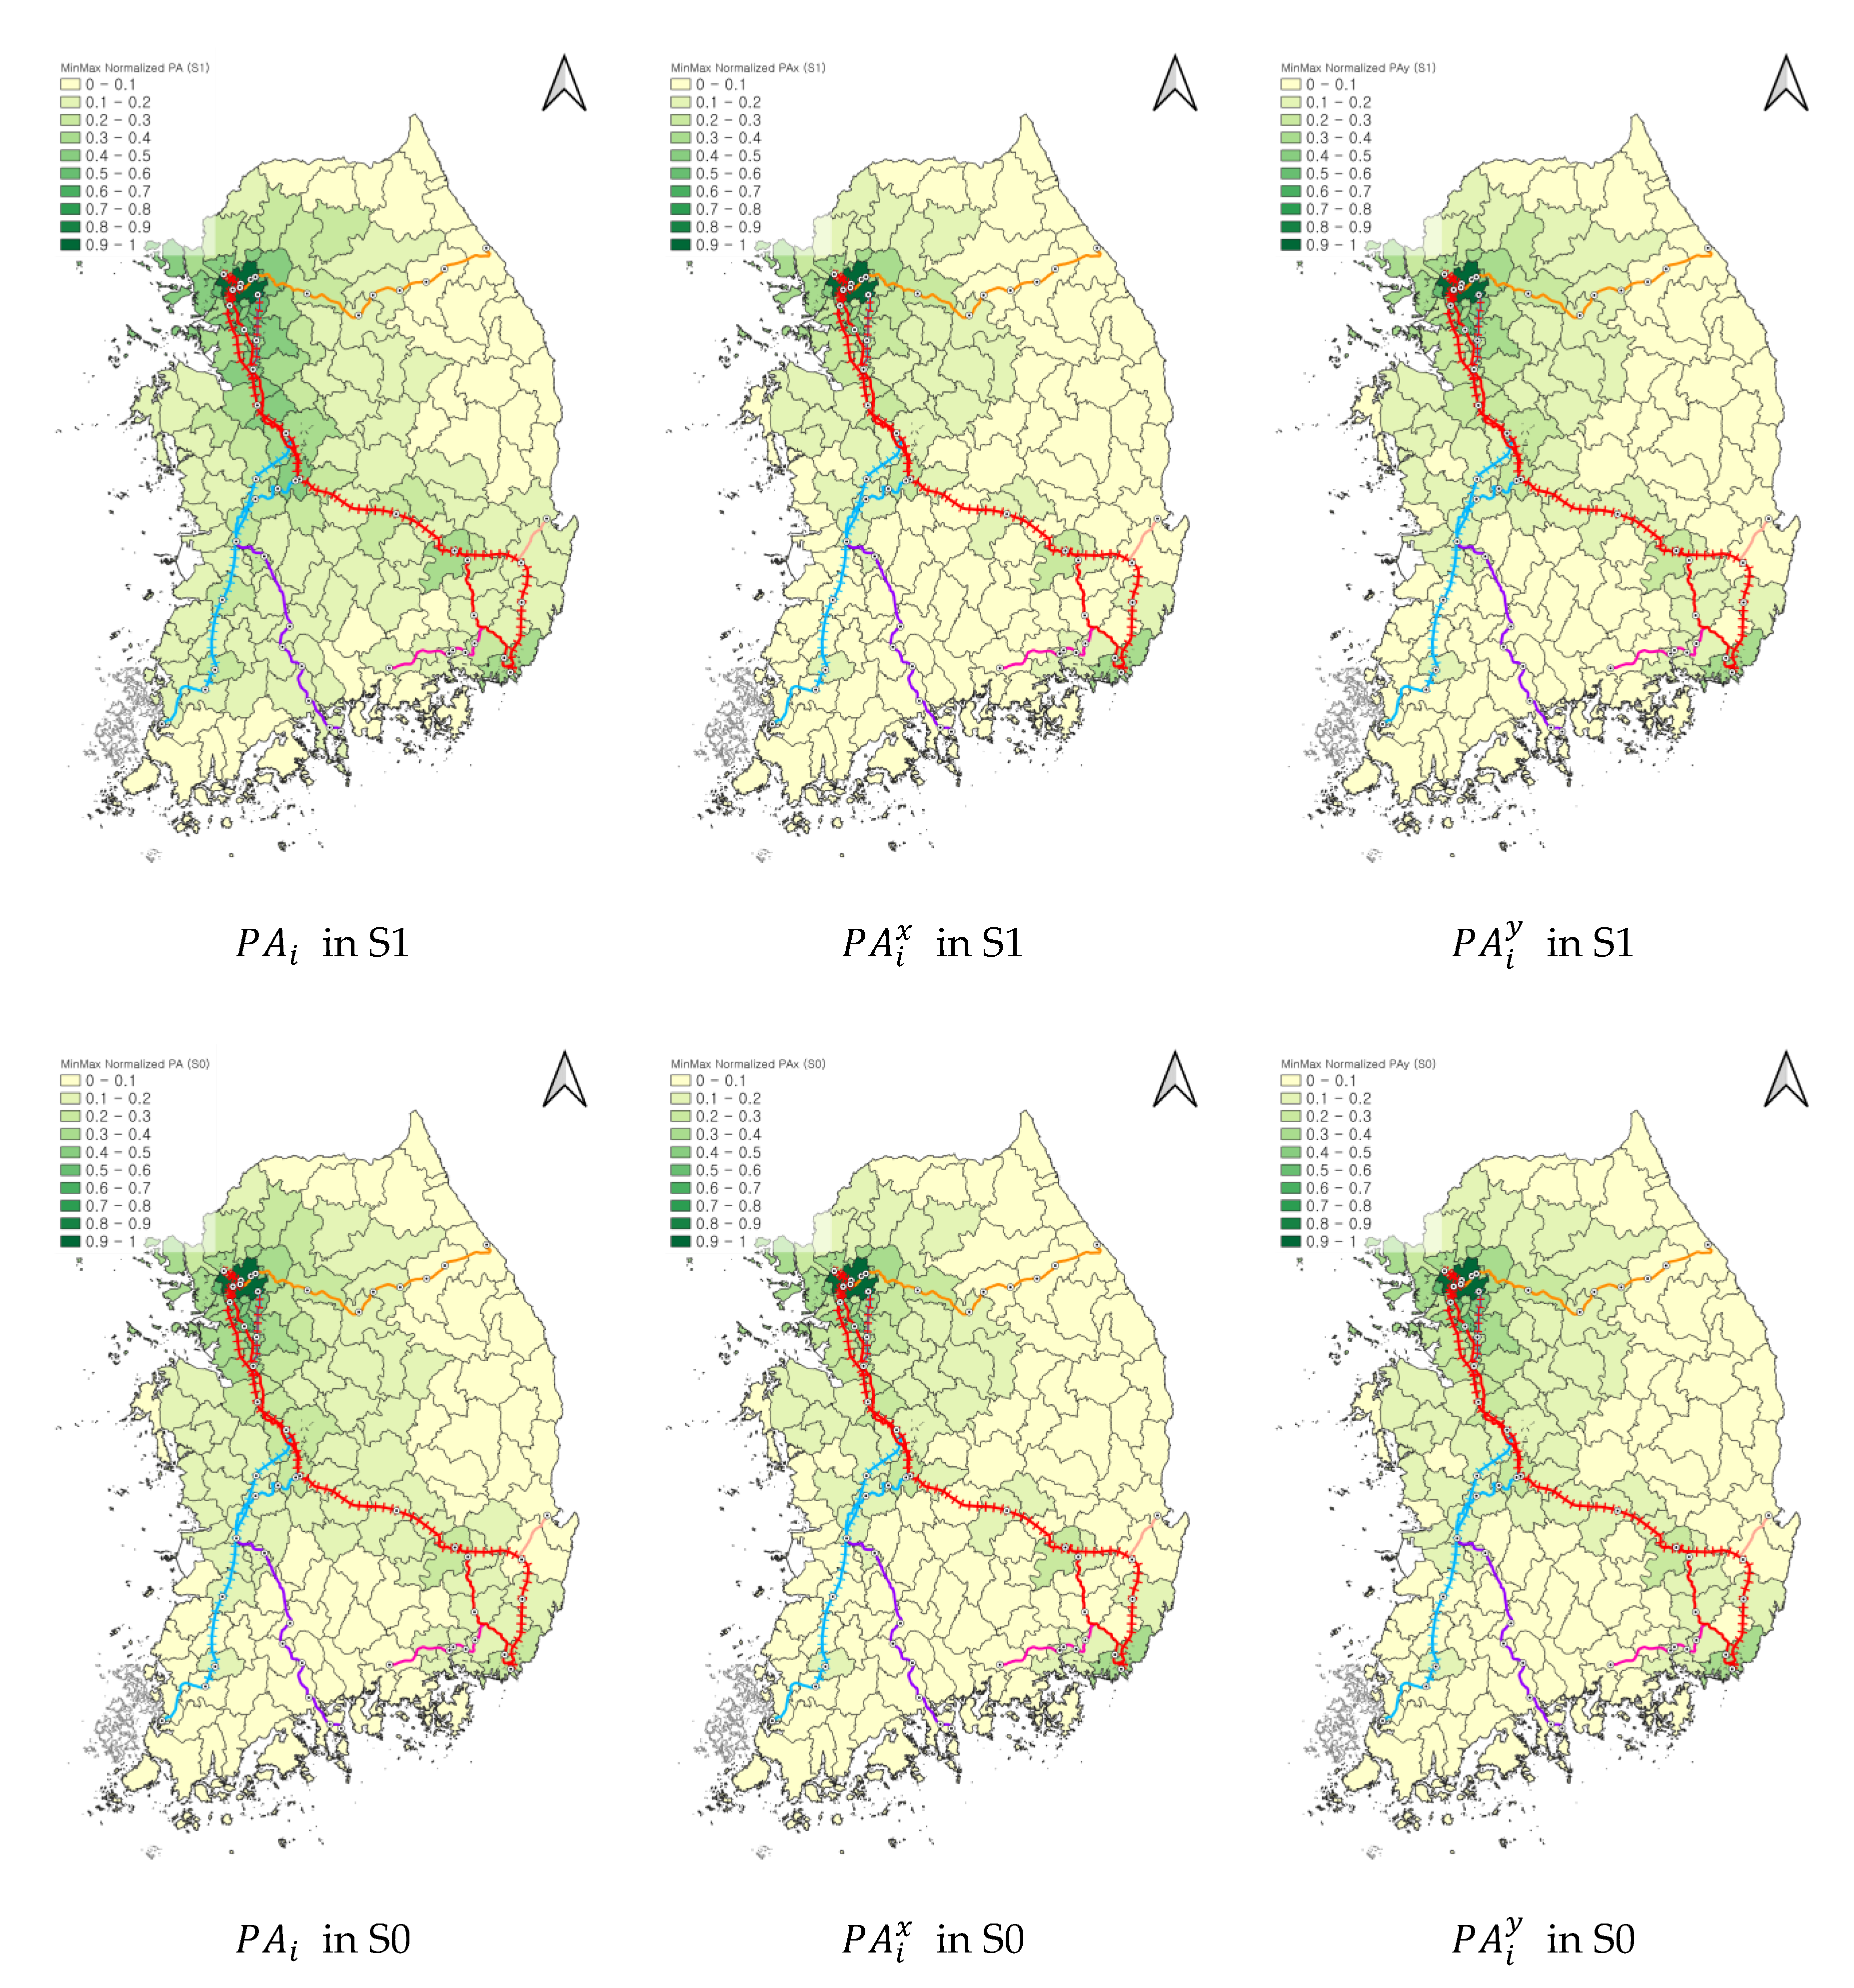
Table 1 suggests the summary of travel time between the origins and destinations of 158 cities. From Table 1, we can evaluate the difference between the fastest travel time and two generalized travel-time measurements. The PA cannot be interpreted as time since the travel-time parameter in Equation (1) is for distance decay to cut the destination’s attractiveness. Instead, an interpretation of the PA is a measurement of economic potential and a change in the PA is the changed economic potential by HSR [9]. Table 2 shows a summary of each PA in S1 and S0.
We conduct the paired samples t-test, to examine whether the HSR networks of South Korea make the mean difference of potential accessibility between S1 and S0. The paired sampled t-test is applied to , and the result is organized in Table 3. As we can see, the result of each PA is statistically significant at the 99% level. This result represents that HSR networks affect accessibility change with statistical significance. Therefore, it is assured that HSR networks increase the potential accessibility of each city in South Korea.
In calculating potential accessibility, travel time is based on three different estimations: fastest travel time and the two generalized travel times considering different time values. PA results cannot be compared to each other since each PA takes a different travel-time measurement. To compare the PA values in a different range, we apply the minimum–maximum normalization to each PA. Then we investigate HSR impact on accessibility corresponding to ticket prices based on time value. Figure 2 displays the result of each min–max normalized PA in S1 and S0. Potential interaction is highest in the SMA in both scenarios of and . The branches of the Korean HSR network are all connected to the SMA, so a polarized accessibility pattern in the SMA is observed. The polarization originates from the socioeconomic attributes of the capital region, which possesses abundant capital, labor and business activities. Comparing accessibilities in S1 and S0, only shows an increase in accessibility of local municipalities on the HSR network. The HSR network even increases the accessibility of cities without HSR according to the result of in S1, but does not show a distinctive change in S1 compared to S0.
Table 4 shows a list of cities with a high variation in accessibility through HSR operation. The variation of accessibility from S0 to S1 is highest in , which is based on the fastest travel time. In contrast, and show a relatively small variation range. For example, the mean of change in is 17.83% and the standard deviation (Std.) is 10.29%. However, the mean of the accessibility change is 0.33% in and 1.23% in . The highest change in is observed in Jeongeup city, a 44.8% increase in accessibility through HSR operation. When considering the generalized travel time, Gurye city shows the highest increase in accessibility, 4.62% and 7.11% increases in and respectively. The small change in suggests that the expensive HSR fares may result in price-resistance.
If considering generalized travel time, the higher the time value, the greater the change in accessibility. The average annual salary is converted into an hourly wage ( time value: 9.98 USD/h). The minimum hourly wage ( time value) is 6.02 USD/h. The time value is 65.78% higher than the time value. The mean of accessibility change in the time value is 3.73 times larger than the mean of accessibility change in the time value. This result indicates that the price-resistance of HSR passengers can be weakened if the time value increases. Passengers will choose the HSR if their time value is higher than the ticket price.
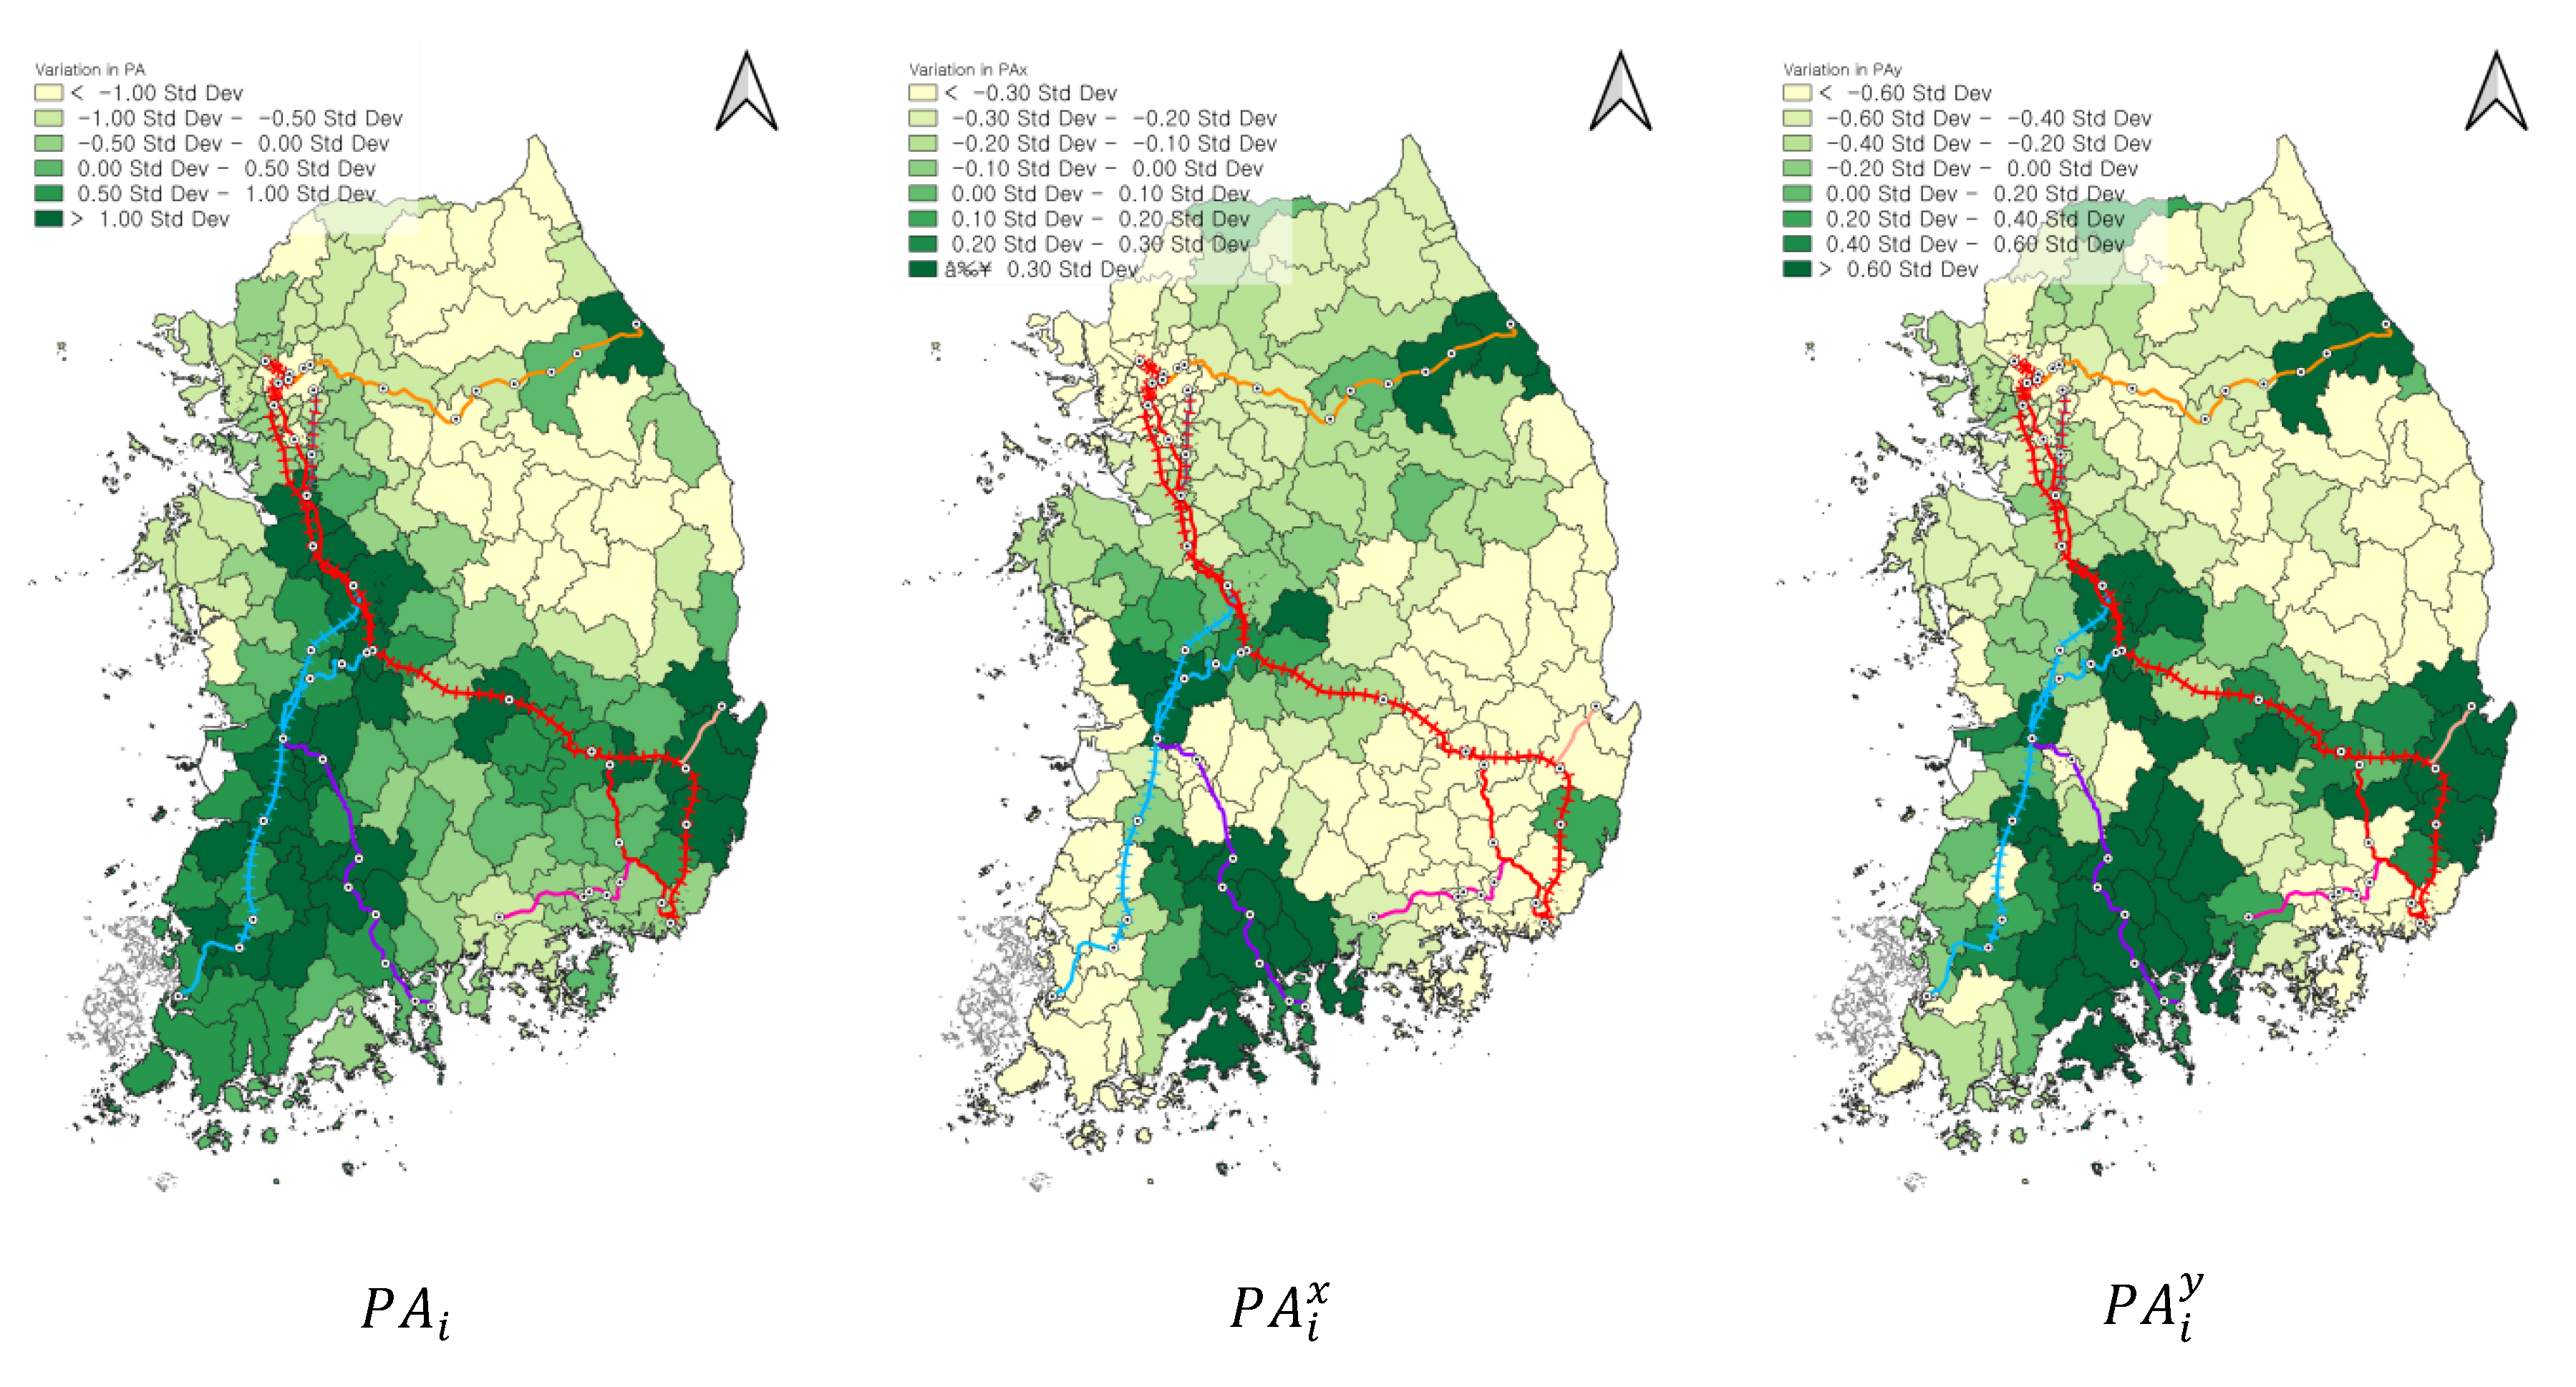
Changes in and are colorized in Figure 3 according to the standard deviation. First, the variation in is strong in cities connected by HSR. The cities on the Gyeongbu, Honam and Jeolla high-speed lines show a significant variation in accessibility through the HSR network. The Gangwon line connects cities in the region, but the HSR accessibility impact only centers on two cities: Gangneung and Pyeongchang. The SMA is served by numerous HSR stations. However, the change in accessibility through HSR is not very large compared to nearby HSR-connected cities. This result can be attributed to the existing developed transportation network in the SMA. Moreover, HSR benefits do occur in local cities, even though all the HSR networks are connected to the SMA for operational efficiency. According to Figure 3, even cities without HSR stations can benefit from HSR operation.
Second, considering the result of , the HSR impact on accessibility mainly occurs in cities on the Jeolla line and in Chungcheong province. The Gyeongbu and Honam lines furcate at Osong Station, thus benefitting Chungcheong province. Some cities on the Gangneung line and Ulsan, on the Gyeongbu HSL, also show a high increase in accessibility of S1 compared to S0. However, an indirect impact on cities without HSR is much smaller than .
Third, the higher time value in compared to shows a significantly higher variation in accessibility through the HSR network. In addition, the impact on cities without HSR is much more substantial in . Cities on the Gyeongbu HSL have especially experienced a high increase in accessibility, whereas smaller variations in the accessibility of the Gyeongbu HSL are observed in . HSR impact on accessibility mainly occurs in local municipalities.
4.2. Unequal Accessibility
Based on Equation (2), we analyze variation in the CV to evaluate HSR impact on unequal accessibility. First, the CV of each accessibility between targeted cities in S1 and S0 is derived. Then, we compare the CV difference in scenarios of S1 and S0. The CV decrease in S1 means inequality is reduced. The CV is calculated at the national level, cities in the capital and non-capital regions, cities with and without HSR and cities categorized by population size. Urban population sizes are categorized into small (~0.1 million), medium (0.1–0.5 million) and large (more than 0.5 million). The results of the CV are summarized in Table 5.
First, at the national level, the HSR network reduces unequal accessibility. The inequality of in S1 is 2.96% lower than in S0. When the time value is 6.02 USD/h and 9.98 USD/h, inequality is reduced by 0.19% and 0.56%, respectively through HSR operation. The greater CV change in shows that the HSR contribution to reducing inequality becomes larger as the time value increases.
Second, we analyzed the CV between cities in the capital and non-capital regions. This comparison examines whether effects differ despite the concentration of HSR in the SMA. The capital region (SMA) includes Seoul, Incheon and cities belonging to Gyeonggi province. The CV results in the capital region based on the fastest travel time () suggest a reduction in unequal accessibility through the HSR network. The decreased inequality is attributed to the spatial attribute of the HSR network connected to the capital region. However, the HSR exacerbates unequal accessibility between cities in the non-capital regions. The CV between cities in the non-capital regions increases by 12.19% in S1. Most of the non-capital cities are not served by HSR, so the inequality between them becomes severe. In contrast, the HSR network reduces inequality in both capital and non-capital regions if considering the generalized travel time. However, the percentage change is not very significant. The changes in CV between cities in the capital region are −0.06 in and −0.12% in . For the CV between cities in the non-capital regions, the changes in the CV in and are −0.27% and −0.04%, respectively.
Third, the CV decreases not only in cities with HSR, but also in cities without. The change in the CV of is −8.78% between cities with HSR and −2.72% between cities without. When the time value is high, the decrease in inequality is also high. The decrease in the CV of between cities with and without HSR is −1.01% and −0.51%, respectively. The reduction in the CV of between cities with and without HSR is −0.28% and −0.21%. These results explain that even cities without HSR indirectly benefit from networks by developing feeder services to the HSR stations.
Finally, when generalized travel time is considered, HSR can alleviate inequality. A reduction in the CV between large, medium and small cities is −0.08%, −0.4%, −0.37%, respectively, when the time value is 6.02 USD/h. When the time value is 9.98 USD/h, the reduction is −0.9% between large cities, −1.29% between medium cities and −0.36% between small cities. HSR impact is maximized in medium cities since the change in CV is greatest in medium cities in , . Small cities may suffer side-effects since an increase in inequality is observed in . The CV of between small cities increases by 1.37% in S1 compared to S0. Smaller cities generally have limited intercity transportation modes, so that HSR impact may be limited.
To sum up, HSR operation can mitigate unequal accessibility at the national level, in the capital region, cities with and without HSR stations and large and medium cities by reducing travel time. The CV results based on generalized travel time suggest that HSR networks can reduce unequal accessibility even in non-capital regions and small cities. Although the initial stage of HSR operation may focus on travel efficiency by connecting to the SMA, the expanding HSR network plays an essential role in reducing inequality of isolated and less developed regions: the non-capital regions, small cities and cities without HSR. Further, the results suggest that inequality can be reduced more in medium cities since they are more sensitive to investment in transportation infrastructure. The marginal effect of HSR operation may be small in large and major cities due to previously existing networks [52]. We can confirm that HSR mitigates regional inequality by enhancing accessibility to other regions even if HSR ticket prices are higher than those of conventional railways.
However, as we can see in Table 5, the percentage change in the CV is not very large. This is because HSR networks are connected to the capital region, which is located in the northwestern area of South Korea. Unlike France, Japan, Spain and China, South Korea has a small land area and HSR networks are geographically concentrated in the northwest. Due to geographical characteristics, the CV change is not very large when considering generalized travel time. Even if the degree of change is not very large, it is significant to observe the HSR impact on reducing inequality and enhancing the accessibility of local municipalities. The CV change is much smaller in than in . This change explains why it is crucial to consider ticket prices based on time value. If there is no consideration for ticket prices, the HSR impact may be overestimated.
5. Discussion
Results on unequal accessibility are varied depending on the spatial coverage of the analysis. Even if HSR reduces inequality at the corridor level, it may increase inequality at the national level [9]. In estimating HSR impact on unequal accessibility, we considered fares and time values. This study utilized the potential accessibility measurement based on the fastest and generalized travel times. Generalized travel times included ticket prices based on time values. We examined variations in unequal accessibility through the HSR networks at the national level, the capital and non-capital regions, cities with and without HSR and for urban population size.
We suggest three significant implications of this study. First, it is necessary to include ticket prices in estimating potential accessibility. To date—at least to our knowledge—HSR fares and time values have not been considered in evaluating potential accessibility and inequality. If ticket prices are not included in estimating accessibility, HSR impact may be overestimated. In addition, Figure 2 suggests that local municipalities benefit from HSR operation. The result also explains that an increase in time value through national growth or other exogenous conditions maximizes HSR impact on increasing accessibility. However, it is difficult to increase time values artificially. One of the alternatives to maximizing HSR impact on accessibility is to enhance its cost-efficiency. For example, HSR impact can be maximized by reducing fares and providing a specific discount policy within a practical range of fiscal sustainability.
Second, accessibility itself is highest in the SMA. However, HSR impact on accessibility is higher in local municipalities. The initial HSR network was connected to the SMA for operational efficiency [13], but the HSR network contributes to reducing national inequality. However, even cities without HSR indirectly benefit from HSR operation. According to Table 5, inequality between cities in the non-capital regions is reduced. This result represents the indirect spatial HSR impact. Therefore, cities that do not have or cannot build HSR stations should develop feeder service to the HSR network. It is also true that HSR impact is larger in cities with HSR, even if it has an indirect impact on cities without HSR. Areas close to HSR stations may have faster economic growth than distant regions [21].
Third, if considering generalized travel times, HSR impact is maximized in medium cities. Although the HSR reduces inequality between large cities, HSR impact on inequality is higher in medium cities. Similar results were also observed in Japan [52]. This difference is because large and major cities already possess developed transportation networks. The introduction of cost-efficient transportation modes for medium cities is beneficial in expanding travel distance and increasing time at destination. Further, residents can have various movement options; they can choose an optimal travel route depending on personal socioeconomic conditions. The marginal HSR impact may be larger in medium cities, so HSR can enhance regional accessibility and reduce national inequality.
There are a few recommendations for future research. Accessibility significantly depends on the time values. If the time values change, HSR impact on accessibility and inequality will be varied as well. Future research should cautiously review time values based on the socioeconomic background of each country. Moreover, in converting travel time to distance for estimating the value of time and ticket price, we assumed the scheduled times of the conventional railways and HSR. The analysis in this study depended on the parameter of scheduled times instead of actual travel times due to technical problems. If possible, it will be useful to consider actual travel times and distances for the various transportation networks. Finally, there are various accessibility measures, which were not applied to this study, such as weighted average travel time, generalized weighted travel time and daily accessibility. Further, the PA results depend on the attractiveness of the destination. For example, GDP and employment could also be used for measuring attractiveness. The business interactive accessibility index [37] can also be employed instead of PA. Utilizing other accessibility and attractiveness measures will lead to other interesting results. Finally, this study focused on accessibility by employing population to indicate the attractiveness of a destination. However, there are other socioeconomic factors related to HSR impact: such as land development, productivity, firms and workers to name a few. It is recommended to consider these other factors to further evaluate inequality in dynamic urban structures.
Author Contributions
Conceptualization, K.K. and J.K.; methodology, K.K.; software, K.K. and J.K.; validation, K.K. and J.K.; formal analysis, K.K.; investigation, K.K. and J.K.; resources, K.K.; data curation, K.K.; writing—original draft preparation, K.K.; writing—review and editing, K.K. and J.K.; visualization, K.K.; supervision, K.K.; project administration, K.K.; funding acquisition, J.K. All authors have read and agreed to the published version of the manuscript.
Funding
This work was supported by the 2016 Yeungnam University Research Grant.
Conflicts of Interest
The authors declare no conflict of interest.
References
- Garmendia, M.; Ribalaygua, C.; UREñA, J.M. High speed rail: Implication for cities. Cities 2012, 29, S26–S31. [Google Scholar] [CrossRef]
- Shen, Y.; E Silva, J.D.A.; Martínez, L.M. HSR Station location choice and its local land use impacts on small cities: A case study of Aveiro, Portugal. Procedia Soc. Behav. Sci. 2014, 111, 470–479. [Google Scholar] [CrossRef] [Green Version]
- Chen, G.; e Silva, J.D.A. Estimating the provincial economic impacts of high-speed rail in Spain: An application of structural equation modeling. Procedia Soc. Behav. Sci. 2014, 111, 157–165. [Google Scholar] [CrossRef] [Green Version]
- Willigers, J.; Van Wee, B. High-speed rail and office location choices. A stated choice experiment for the Netherlands. J. Transp. Geogr. 2011, 19, 745–754. [Google Scholar] [CrossRef]
- Fujita, M.; Krugman, P.R.; Venables, A. The Spatial Economy: Cities, Regions, and International Trade; MIT Press: Cambridge, MA, USA, 1999. [Google Scholar]
- Kotavaara, O.; Antikainen, H.; Rusanen, J. Population change and accessibility by road and rail networks: GIS and statistical approach to Finland 1970–2007. J. Transp. Geogr. 2011, 19, 926–935. [Google Scholar] [CrossRef]
- Morris, J.M.; Dumble, P.L.; Wigan, M.R. Accessibility indicators for transport planning. Transp. Res. Part A Gen. 1979, 13, 91–109. [Google Scholar] [CrossRef]
- Hay, A. Equity and welfare in the geography of public transport provision. J. Transp. Geogr. 1993, 1, 95–101. [Google Scholar] [CrossRef]
- Gutiérrez, J. Location, economic potential and daily accessibility: An analysis of the accessibility impact of the high-speed line Madrid–Barcelona–French border. J. Transp. Geogr. 2001, 9, 229–242. [Google Scholar] [CrossRef]
- Monzón, A.; Ortega, E.; López, E. Social impacts of high speed rail projects: Addressing spatial equity effects. In Proceedings of the 12th WCTR, Lisbon, Portugal, 11–15 July 2010. [Google Scholar]
- Zhenling, L.I.U. Review on regional and spatial-economic impact from high speed rails. Afr. J. Bus. Manag. 2012, 6, 9738–9741. [Google Scholar] [CrossRef]
- Kim, K.; Hamamoto, T.; Yai, T. Review of international high-speed rail effect on the region: A characteristic of HSR operation of the world. In Proceedings of the 23rd International Conference of Hong Kong Society for Transportation Studies, Hong Kong, China, 8–10 December 2018; pp. 537–546. [Google Scholar]
- Kim, H.; Sultana, S. The impacts of high-speed rail extensions on accessibility and spatial equity changes in South Korea from 2004 to 2018. J. Transp. Geogr. 2015, 45, 48–61. [Google Scholar] [CrossRef] [Green Version]
- Monzón, A.; Ortega, E.; López, E. Efficiency and spatial equity impacts of high-speed rail extensions in urban areas. Cities 2013, 30, 18–30. [Google Scholar] [CrossRef] [Green Version]
- Martin, F. Justifying a high-speed rail project: Social value vs. regional growth. Ann. Reg. Sci. 1997, 31, 155–174. [Google Scholar] [CrossRef]
- Rosik, P.; Pomianowski, W.; Komornicki, T.; Goliszek, S.; Szejgiec-Kolenda, B.; Duma, P. Regional dispersion of potential accessibility quotient at the intra-European and intranational level. Core-periphery pattern, discontinuity belts and distance decay tornado effect. J. Transp. Geogr. 2020, 82, 102554. [Google Scholar] [CrossRef]
- Spiekermann, K.; Neubauer, J. European Accessibility and Peripherality: Concepts, Models and Indicators; Nordregio Working Paper; Nordregio-the Nordic Centre for Spatial Development: Stockholm, Sweden, 2002. [Google Scholar]
- Terabe, S.; Lee, J.Y.; Lin, J.J.; Oh, J.H.; Morich, S.; Feng, C.M.; Tomari, N. International Comparison of High-Speed Railway Impacts on Transportation, Tourism, and Land Price–Japan, Korea and Taiwan. In Proceedings of the Eastern Asia Society for Transportation Studies, Ho Chi Minh City, Vietnam, 18–21 September 2017. [Google Scholar]
- Currie, G. Quantifying spatial gaps in public transport supply based on social needs. J. Transp. Geogr. 2010, 18, 31–41. [Google Scholar] [CrossRef]
- Hiramatsu, T. Unequal regional impacts of high speed rail on the tourism industry: A simulation analysis of the effects of Kyushu Shinkansen. Transportation 2018, 45, 677–701. [Google Scholar] [CrossRef]
- Jiang, M.; Kim, E. Impact of high-speed railroad on regional income inequalities in China and Korea. International Journal of Urban Sciences. Int. J. Urban Sci. 2016, 20, 393–406. [Google Scholar] [CrossRef] [Green Version]
- Jin, F.; Jiao, J.; Qi, Y.; Yang, Y. Evolution and geographic effects of high-speed rail in East Asia: An accessibility approach. J. Geogr. Sci. 2017, 27, 515–532. [Google Scholar] [CrossRef] [Green Version]
- Chen, Z.; Haynes, K.E. Impact of high-speed rail on regional economic disparity in China. J Transp. Geogr. 2017, 65, 80–91. [Google Scholar] [CrossRef]
- Chen, G.; Silva, J.D.A.E. Regional impacts of high-speed rail: A review of methods and models. Transp. Lett. 2013, 5, 131–143. [Google Scholar] [CrossRef]
- Sasaki, K.; Ohashi, T.; Ando, A. High-speed rail transit impact on regional systems: Does the Shinkansen contribute to dispersion? Ann. Reg. Sci. 1997, 31, 77–98. [Google Scholar] [CrossRef]
- Shen, Y.; Chen, G.; MartíNez, L.M.; Silva, J.D.A. Bi-level cellular agent-based model: Simulation of potential impacts of high-speed rail on land cover change in the Lisbon Metropolitan Area, Portugal. J. Transp. Land Use 2015, 8, 151–180. [Google Scholar] [CrossRef] [Green Version]
- Low, J.M.; Lee, B.K. A Data-Driven Analysis on the Impact of High-Speed Rails on Land Prices in Taiwan. Appl. Sci. 2020, 10, 3357. [Google Scholar] [CrossRef]
- Rungskunroch, P.; Yang, Y.; Kaewunruen, S. Does High-Speed Rail Influence Urban Dynamics and Land Pricing? Sustainability 2020, 12, 3012. [Google Scholar] [CrossRef] [Green Version]
- PÁEZ, A.; Scott, D.M.; Morency, C. Measuring accessibility: Positive and normative implementations of various accessibility indicators. J. Transp. Geogr. 2012, 25, 141–153. [Google Scholar] [CrossRef]
- Dundon-Smith, D.M.; Gibb, R.A. The Channel Tunnel and regional economic development. J. Transp. Geogr. 1994, 2, 178–189. [Google Scholar] [CrossRef]
- Martin, J.C.; Gutiérrez, J.; Román, C. Data envelopment analysis (DEA) index to measure the accessibility impacts of new infrastructure investments: The case of the high-speed train corridor Madrid-Barcelona-French border. Reg. Stud. 2004, 38, 697–712. [Google Scholar] [CrossRef]
- López, E.; Gutiérrez, J.; Gómez, G. Measuring regional cohesion effects of large-scale transport infrastructure investments: An accessibility approach. Eur. Plan. Stud. 2008, 16, 277–301. [Google Scholar] [CrossRef] [Green Version]
- Cao, J.; Liu, X.C.; Wang, Y.; Li, Q. Accessibility impacts of China’s high-speed rail network. J. Transp. Geogr. 2013, 28, 12–21. [Google Scholar] [CrossRef]
- Jiang, B.; Chu, N. Comprehensive Evaluation of Accessibility in China’s High-Speed Rail Network Based on the Perspective of Time, Economy, and Frequency. J. Urban Plan. Dev. 2017, 143, 05017009. [Google Scholar] [CrossRef]
- Xu, W.; Zhou, J.; Yang, L.; Li, L. The implications of high-speed rail for Chinese cities: Connectivity and accessibility. Transp. Res. Part A Policy Pract. 2018, 116, 308–326. [Google Scholar]
- Yi, Y.; Kim, E. Spatial economic impact of road and railroad accessibility on manufacturing output: Inter-modal relationship between road and railroad. J. Transp. Geogr. 2018, 66, 144–153. [Google Scholar] [CrossRef]
- Kim, K.; Yai, T. The Economic Benefit from Business Interaction between Different Business Activities through High-Speed Rail Operation: An Experimental Concept for the Business Interactive Accessibility and Its Application. Asian Transp. Stud. 2019, 5, 845–861. [Google Scholar]
- Hansen, W.G. How accessibility shapes land use. J. Am. Inst. plan. 1959, 25, 73–76. [Google Scholar] [CrossRef]
- Yang, J.; Guo, A.; Li, X.; Huang, T. Study of the impact of a high-speed railway opening on China’s accessibility pattern and spatial equality. Sustainability 2018, 10, 2943. [Google Scholar] [CrossRef] [Green Version]
- Monzón, A.; López, E.; Ortega, E. Has HSR improved territorial cohesion in Spain? An accessibility analysis of the first 25 years: 1990–2015. Eur. Plan. Stud. 2019, 27, 513–532. [Google Scholar] [CrossRef]
- Bendel, R.B.; Higgins, S.S.; Teberg, J.E.; Pyke, D.A. Comparison of skewness coefficient, coefficient of variation, and Gini coefficient as inequality measures within populations. Oecologia 1989, 78, 394–400. [Google Scholar] [CrossRef]
- Moyano, A. High speed rail commuting: Efficiency analysis of the Spanish HSR links. Transp. Res. Procedia 2016, 18, 212–219. [Google Scholar] [CrossRef]
- Cheng, Y.H. High-speed rail in Taiwan: New experience and issues for future development. Transp. Policy 2010, 17, 51–63. [Google Scholar] [CrossRef]
- Bruinsma, F.; Rietveld, P. Is Transport Infrastructure Effective? Transport Infrastructure and Accessibility: Impacts on the Space Economy; Springer: Berlin, Germany, 1998. [Google Scholar]
- Gutiérrez, J.; Condeço-Melhorado, A.; López, E.; Monzón, A. Evaluating the European added value of TEN-T projects: A methodological proposal based on spatial spillovers, accessibility and GIS. J. Transp. Geogr. 2011, 19, 840–850. [Google Scholar] [CrossRef]
- Frost, M.E.; Spence, N.A. The rediscovery of accessibility and economic potential: The critical issue of self-potential. Environ. Plan. A 1995, 27, 1833–1848. [Google Scholar] [CrossRef]
- Reggiani, A.; Bucci, P.; Russo, G.; Haas, A.; Nijkamp, P. Regional labour markets and job accessibility in city network systems in Germany. J. Transp. Geogr. 2011, 19, 528–536. [Google Scholar] [CrossRef] [Green Version]
- Ortega, E.; López, E.; Monzón, A. Territorial cohesion impacts of high-speed rail under different zoning systems. J. Transp. Geogr. 2014, 34, 16–24. [Google Scholar] [CrossRef] [Green Version]
- Rosik, P.; Stępniak, M.; Komornicki, T. The decade of the big push to roads in Poland: Impact on improvement in accessibility and territorial cohesion from a policy perspective. Transp. Policy 2015, 37, 134–146. [Google Scholar] [CrossRef]
- Korea Transport Database. Available online: https://www.ktdb.go.kr/www/index.do (accessed on 2 March 2020).
- Statistical Geographical Information Service. Available online: https://sgis.kostat.go.kr/jsp/english/index.jsp (accessed on 3 March 2020).
- Kim, K. The Impact of the Business Interactive Accessibility by High-Speed Rail. Doctoral Thesis, Tokyo Institute of Technology, Tokyo, Japan, March 2020. [Google Scholar]
Figure 1.
High-speed railway (HSR) network of South Korea in 2018.

Figure 2.
Result of the accessibility change: S1 and S0.

Figure 3.
Results of the accessibility change: S1 and S0.


Table 1.
Travel-time estimation between origins and destinations.
| Travel Time | Time Value | Scenario | Median (min) | Mean (min) | Std. (min) |
|---|---|---|---|---|---|
| Fastest Travel Time | – | S1 | 109.69 | 114.76 | 50.76 |
| S0 | 134.592 | 137.33 | 61.37 | ||
| Generalized Travel Time | 6.02 USD/h | S1 | 201.75 | 208.03 | 94.23 |
| S0 | 203.5 | 210.08 | 96.16 | ||
| 9.98 USD/h | S1 | 172.37 | 177.37 | 79.37 | |
| S0 | 176.41 | 181.23 | 82.11 |
Table 2.
Result of potential accessibility.
| Accessibility | ||||||
|---|---|---|---|---|---|---|
| Scenario | S1 | S0 | S1 | S0 | S1 | S0 |
| Time Value | – | 6.02 USD/h | 9.98 USD/h | |||
| Minimum | 271,844 | 240,023 | 167,221 | 167,221 | 191,157 | 189,763 |
| Median | 530,793 | 435,625 | 301,388 | 300,638 | 344,110 | 340,046 |
| Mean | 600,036 | 513,380 | 366,868 | 365,907 | 415,582 | 411,086 |
| Maximum | 2,001,335 | 1,895,716 | 1,707,327 | 1,707,025 | 1,769,297 | 1,763,994 |
| Std. | 259,843.12 | 237,974.67 | 189,471.74 | 189,679.15 | 203,660.38 | 203,335.99 |
Table 3.
Result of the paired samples t-test between S1 and S0 of each potential accessibility.
| Accessibility | Mean of the Differences | 95% Confidence Interval of the Difference | t | df | |
|---|---|---|---|---|---|
| Lower | Upper | ||||
| 86,656.26 | 78,526.8 | 94,785.73 | 21.06 * | 157 | |
| 961.03 | 665.84 | 1256.21 | 6.43 * | 157 | |
| 4495.91 | 3777.23 | 5214.6 | 12.36 * | 157 | |
* p < 0.01.
Table 4.
Results of potential accessibility based on different travel-time values
| City | Increase (%) | City | Increase (%) | City | Increase (%) |
|---|---|---|---|---|---|
| Jeongeup | 44.8 | Gurye | 4.62 | Gurye | 7.11 |
| Iksan | 43.96 | Gokseong | 3.87 | Namwon | 7.09 |
| Pohang | 43.85 | Gwangyang | 3.79 | Gokseong | 6.59 |
| Namwon | 38.5 | Namwon | 3.62 | Gwangyang | 5.32 |
| Gimcheon | 37.81 | Namhae | 3.17 | Ulsan | 4.65 |
| Naju | 37.26 | Hadong | 2.63 | Suncheon | 4.33 |
| Gyeongju | 37.25 | Suncheon | 2.24 | Namhae | 4.30 |
| Daejeon | 34.67 | Sunchang | 2.09 | Gangneung | 4.23 |
| Gyeryong | 34.66 | Goheung | 1.56 | Iksan | 4.05 |
| Gangneung | 34.56 | Gangneung | 1.17 | Sunchang | 4.01 |
| ⋮ | ⋮ | ⋮ | ⋮ | ⋮ | ⋮ |
| Mean | 17.83 | Mean | 0.33 | Mean | 1.23 |
| Std. | 10.29 | Std. | 0.74 | Std. | 1.38 |
Table 5.
Change in unequal accessibility through the HSR network.
| S1 | S0 | Change (%) | S1 | S0 | Change (%) | S1 | S0 | Change (%) | |
|---|---|---|---|---|---|---|---|---|---|
| ① | 0.25 | 0.26 | −2.96 | 0.26 | 0.26 | −0.19 | 0.25 | 0.26 | −0.56 |
| ② | 0.41 | 0.42 | −2.3 | 0.45 | 0.45 | −0.06 | 0.43 | 0.44 | −0.12 |
| ③ | 0.42 | 0.37 | 12.19 | 0.39 | 0.39 | −0.27 | 0.38 | 0.38 | −0.04 |
| ④ | 0.41 | 0.45 | −8.78 | 0.47 | 0.48 | −0.28 | 0.46 | 0.47 | −1.01 |
| ⑤ | 0.76 | 0.78 | −2.72 | 0.78 | 0.78 | −0.21 | 0.77 | 0.78 | −0.51 |
| ⑥ | 0.39 | 0.45 | −13.86 | 0.48 | 0.48 | −0.08 | 0.47 | 0.47 | −0.9 |
| ⑦ | 1.3 | 1.39 | −6.24 | 1.36 | 1.37 | −0.4 | 1.35 | 1.37 | −1.29 |
| ⑧ | 3.4 | 3.35 | 1.37 | 3.18 | 3.19 | −0.37 | 3.22 | 3.23 | −0.36 |
① national level; ② capital region; ③ non-capital regions; ④ cities with HSR station; ⑤ cities without HSR station; ⑥ large cities; ⑦ medium cities; ⑧ small cities.
© 2020 by the authors. Licensee MDPI, Basel, Switzerland. This article is an open access article distributed under the terms and conditions of the Creative Commons Attribution (CC BY) license (http://creativecommons.org/licenses/by/4.0/).
Share and Cite
MDPI and ACS Style
Kim, K.; Kim, J. The Impact of High-Speed Railways on Unequal Accessibility Based on Ticket Prices in Korea. Sustainability 2020, 12, 6302. https://doi.org/10.3390/su12166302
AMA Style
Kim K, Kim J. The Impact of High-Speed Railways on Unequal Accessibility Based on Ticket Prices in Korea. Sustainability. 2020; 12(16):6302. https://doi.org/10.3390/su12166302
Chicago/Turabian StyleKim, Kyungtaek, and Junghoon Kim. 2020. "The Impact of High-Speed Railways on Unequal Accessibility Based on Ticket Prices in Korea" Sustainability 12, no. 16: 6302. https://doi.org/10.3390/su12166302
Note that from the first issue of 2016, this journal uses article numbers instead of page numbers. See further details here.